
Abstract
A new approach to the storage, processing, and interrogation of the quality data for screening samples has improved analytical throughput and confidence and enhanced the opportunities for learning from the accumulating records. The approach has entailed the design, development, and implementation of a database-oriented system, capturing information from the liquid chromatography–mass spectrometry capabilities used for assessing the integrity of samples in AstraZeneca’s screening collection. A Web application has been developed to enable the visualization and interactive annotation of the analytical data, monitor the current sample queue, and report the throughput rate. Sample purity and identity are certified automatically on the chromatographic peaks of interest if predetermined thresholds are reached on key parameters. Using information extracted in parallel from the compound registration and container inventory databases, the chromatographic and spectroscopic profiles for each vessel are linked to the sample structures and storage histories. A search engine facilitates the direct comparison of results for multiple vessels of the same or similar compounds, for single vessels analyzed at different time points, or for vessels related by their origin or process flow. Access to this network of information has provided a deeper understanding of the multiple factors contributing to sample quality assurance.
Introduction
Accompanying the rise to prominence of high-throughput screening (HTS) during the past two decades, more attention has been focused on the quality of the compounds in screening collections. The term quality embraces two complementary elements: the intrinsic capability of the collection for sustainable lead generation and the physical integrity of the samples.1 –4 Strategies to enhance each component are generally, although not necessarily, deployed independently. For example, in silico techniques, such as data profiling and predictive modeling, are often employed in enhancing the diversity and lead-likeness of collection members, typically by identifying potential compound additions or, less frequently, by recommending removals.5 –8 In contrast, the task of assuring and improving physical integrity generally entails manual activities, related to the assessment and curation of stock vessels that have accrued from different sources over many years. Such activities include analyses of the contents of individual vessels, followed by compilation and review of the relevant data, noting that individual compounds are frequently represented by more than one sample or “batch” and that each individual sample may occupy more than one vessel. However, analytical monitoring can generate an abundance of data that, typically, spends only a fleeting moment of its life in the spotlight, being actively scrutinized and cross-referenced, before retiring into relative obscurity. Because the data are most pertinent when further screening could be performed, interest is often limited by the longevity of the sample itself within the collection.
Corporate screening collections are, of course, in a constant state of flux. Compound additions at AstraZeneca originate from in-house synthesis, complemented by contracted and commercial chemistry supplies and, occasionally, by the consolidation of vessels from site closures. Compound efflux from the collection occurs mostly by the depletion of materials. Adjustment of local criteria governing HTS eligibility means that some historical compounds may occasionally move into or out of the screening deck as well. The quality control (QC) and quality assurance (QA) of large collections requires a robust, high-throughput analytical technique that introduces little or no delay to the deliveries of compounds to screening. Liquid chromatography–mass spectrometry (LCMS) with ultraviolet diode array detection (UV-DAD) is used widely in the industry, 9 –11 often with a second complementary detector that does not rely on the analyte structure having a UV-absorbant chromophore. AstraZeneca’s compound management (CM) group uses reversed-phase high-performance chromatography (HPLC) coupled to mass spectrometry (MS) with UV-DAD and charged aerosol detection (CAD) for the routine QC/QA of the corporate compound collection. 12 Although each LCMS system had been supported by an instrument-linked review software package from the manufacturer, we had observed discrepancies in the way that a peak of interest (i.e., a chromatographic fraction peak containing appropriate mass ions for the expected compound) was defined and prioritized. The preference between two possible peaks of interest in the same chromatogram, for example, could depend on which was the largest or which was the earliest to be eluted. Clearly, the choice between two different-sized peaks could lead to different calculations of sample purity. Alongside other inconsistencies between analyses performed on different systems, we were finding that the need for manual reviews of the output data, to ensure correct peak assignments, was becoming rate limiting for a high-sample throughput. There was also greater risk of human error during lengthy manual review sessions. A consistent approach to the data from all our LCMS systems, which reduced the need for manual intervention, was therefore seen as very desirable. At the time, published responses to these challenges appeared to be scarce, one example being that from Virscidian (Virscidian Inc., Raleigh, NC), in their modifications of algorithms to improve peak differentiation and quantitation in Analytical Studio Reviewer (Agilent Technologies, Inc., Santa Clara, CA). 13 As will be described, the versatility of our LCMS database solution, and its wider impact across sample management activities, has transformed the utility of LCMS data within our CM environment and has not, to our knowledge, been matched so far in the commercial sphere.
Materials and Methods
A QC check is part of the process for compounds entering the AstraZeneca liquid store. Samples stored over months and years are also monitored by a separate QA regime. These checkpoints employ three LCMS–UV-CAD systems, generating data that were, historically, collected into spreadsheets or customized reports for individual stakeholders. Our initial drivers for change were unification and standardization of the data from the three different systems. After a deconstruction of the existing workflows, we were able to reassemble all the elements into the common modular format shown in Figure 1 . It was anticipated that other analytical groups within AstraZeneca would also contribute data from LCMS QC, hence generic interfaces between the new database and the LCMS systems were deliberately engineered.
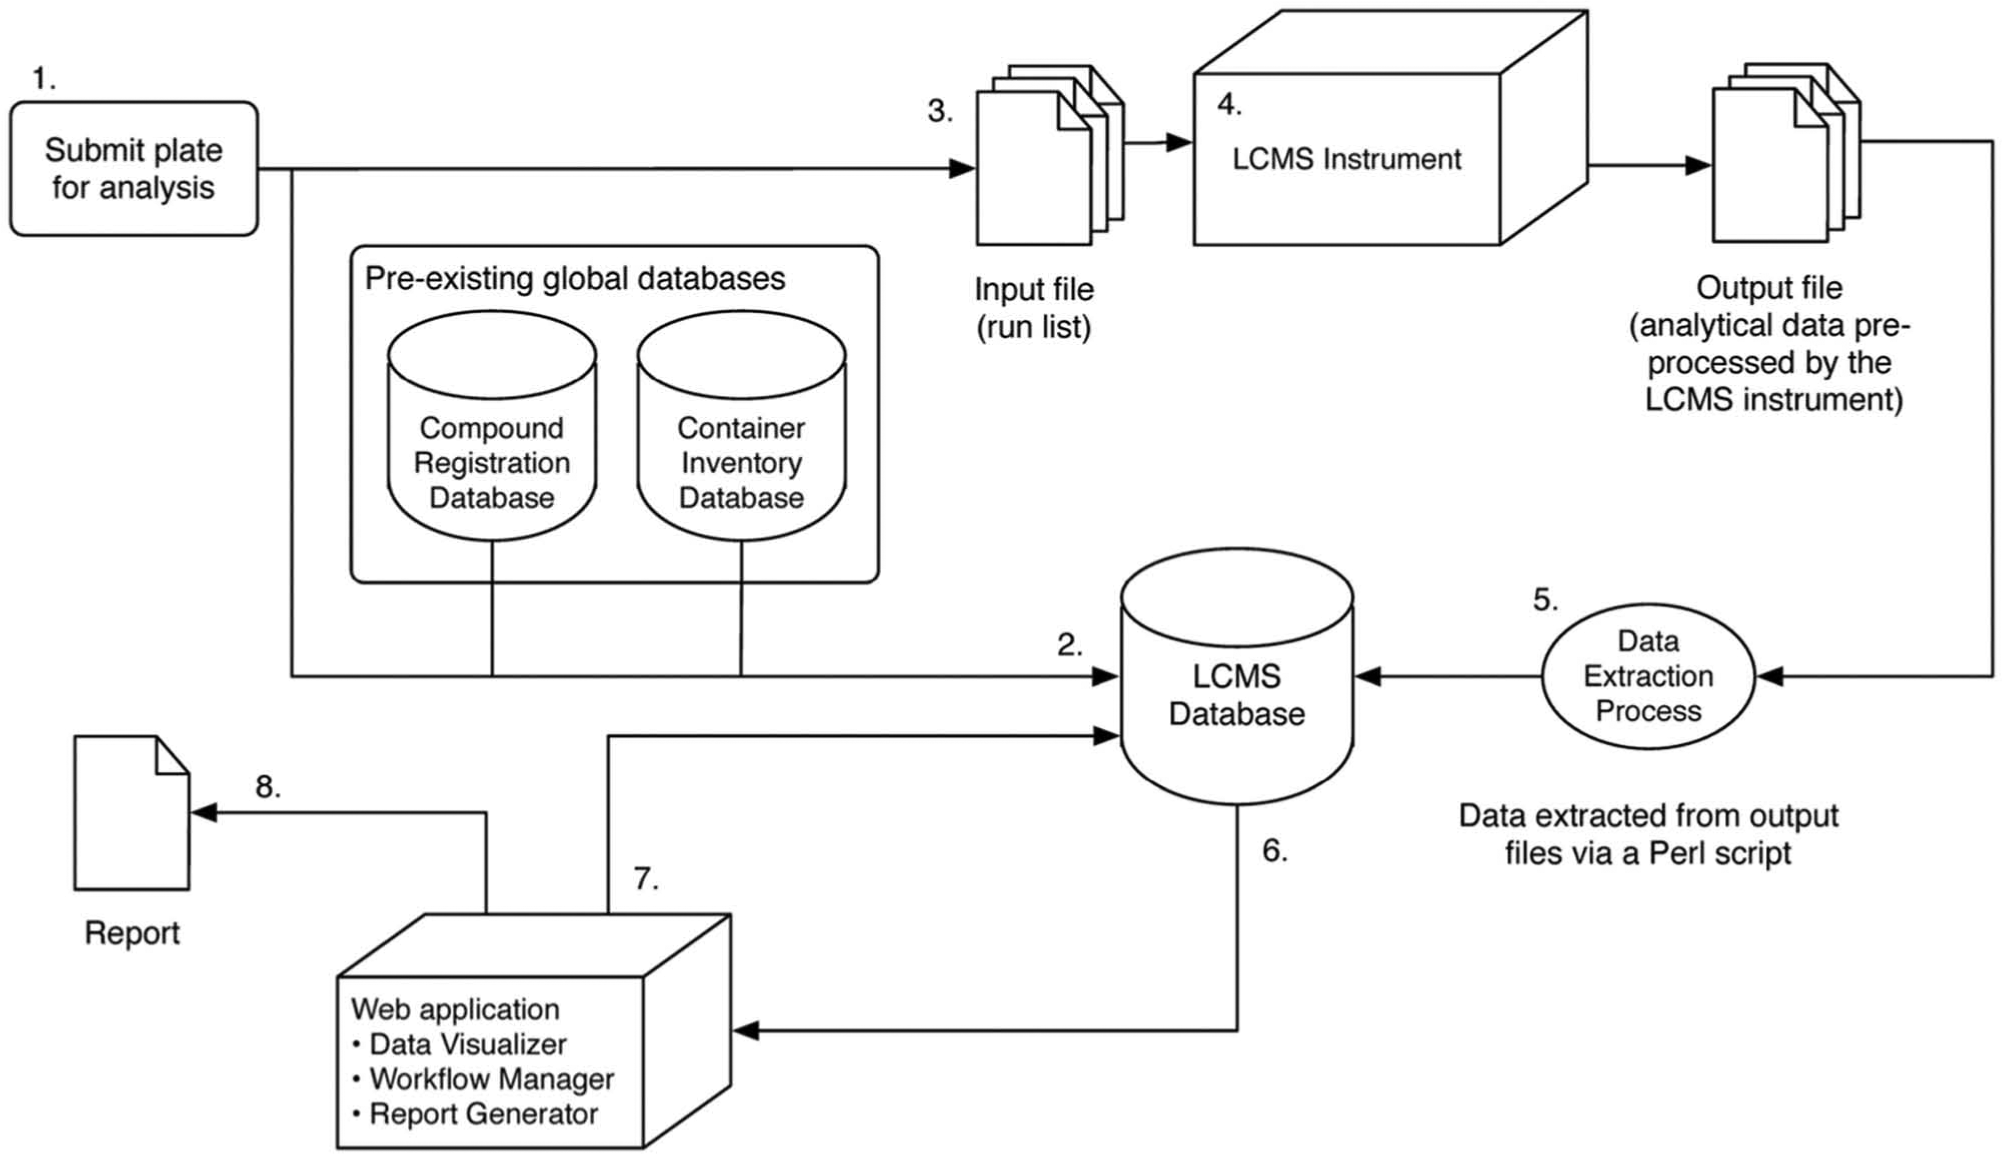
Analytical workflow showing the modular elements that link to the database. The key steps are labeled as follows: (1) A plate is created for analysis. (2) Data for the plate are added to the database, and new record IDs are created for each well. (3) Run files to drive the liquid chromatography–mass spectrometry (LCMS) kit are generated via a Pipeline Pilot protocol. (4) LCMS analysis is performed and output data generated by the instrumentation. (5) Pertinent data are extracted from the output data files via a Perl script executed within a Pipeline Pilot protocol. Extracted information is used to update the records in the database with the analysis results. (6) Analyses that are not automatically passed are reviewed manually via a Web application. (7) Analyses are annotated and marked as passed or failed via an interactive graphical user interface. (8) Summary reports can be generated via the Web application.
The extraction and standardization of the data meant that its storage and processing were independent of LCMS instrumentation, including hardware that could be replaced or upgraded over the longer term. Consequently, our standard LCMS hardware and methods, reported in more detail below, imposed no particular constraints upon the key steps in the construction and implementation of the new database and workflow.
Creation of the Database
A relational database (Oracle Database 11g Enterprise Edition Release 11.2.0.3.0, 64-bit production) was created to store data produced by the LCMS systems, as shown in Figure 1 . The design of the LCMS database has included relationships for plates and wells with their sample identifiers, recognition of sample status (i.e., test sample or control, the latter being an analysis of a standard solution to calibrate the CAD response), individual identifiers for chromatogram peaks with the elements of annotation shown in Table 1 , and further fields to record configurations of LCMS system variables, including instrument settings, chromatography conditions, and interchangeable fixtures such as chromatography columns. Mass spectra are stored in the LCMS database as character large object (CLOB) fields, encoded as y-x coordinates of percentage-of-base-peak and mass in Daltons, respectively. Chromatograms are also stored in CLOB fields, as y-x coordinates representing the normalized detector response versus chromatography retention time. Each eluted peak corresponds with up to four mass spectra, derived from two ion-generation techniques (electrospray ionization and atmospheric pressure chemical ionization) and from two ion detection modes (positive and negative).
The table shows peak annotation values that were extracted from the mass spectra and chromatographic data and stored in the database.
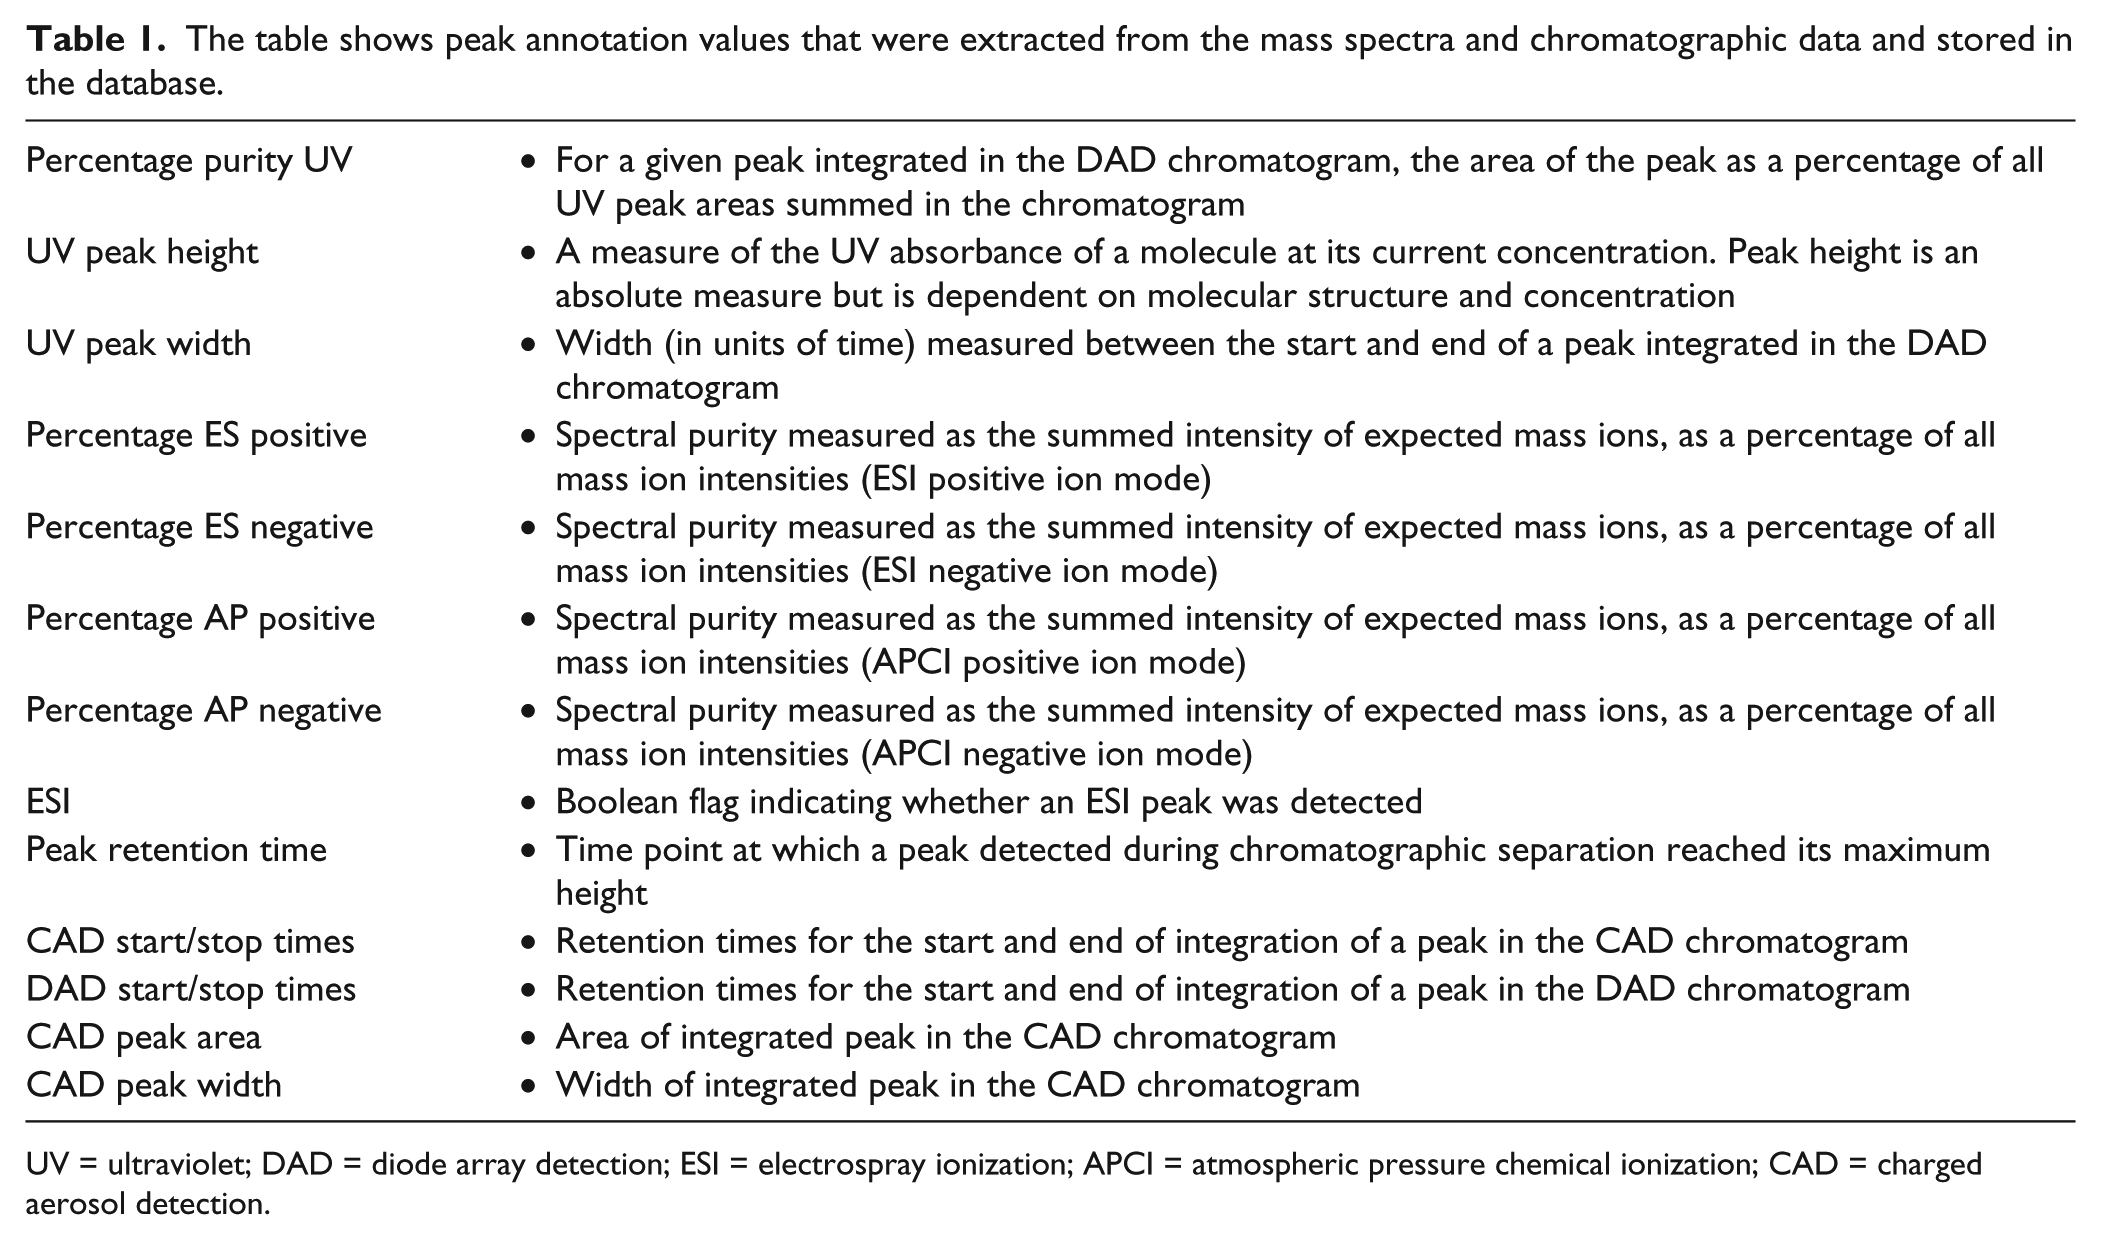
UV = ultraviolet; DAD = diode array detection; ESI = electrospray ionization; APCI = atmospheric pressure chemical ionization; CAD = charged aerosol detection.
Initial Generation of Records and Run Files
Samples were submitted to LCMS in 96-well or 384-well microtiter plates. A run file with tab-separated values was generated, listing the plate barcode and well position linked to the sample identifier. As part of this process, a new tuple was created in the LCMS database for each plate and well, including selected metadata drawn from the preexisting global compound registration and container inventory databases (see Fig. 1 ). The plate run file was used to introduce the plate to the LCMS instrumentation. Each individual well analysis was assigned a unique record identifier. Generation of the record identifiers and run file, and registration of the new jobs into the LCMS database, were implemented as Pipeline Pilot Web services (Pipeline Pilot version 8.5.0.200, Accelrys, Inc., San Diego, CA).
HPLC
All HPLC separations were performed on an Agilent 1200 system, using two binary G1312B high-pressure gradient pumps connected with the solvent flow from pump 1 delivered through the autosampler and that from pump 2 delivered immediately after the separation column, as has been previously described in the literature. 14 The typical solvent system was a combination of (A) HPLC grade water (Sigma Aldrich, UK) containing 0.1% formic acid (Sigma Aldrich) and (B) HPLC-grade methanol (Sigma Aldrich) containing 0.05% formic acid (Sigma Aldrich).
Solvent was delivered from pump 1 at a flow rate of 700 µL per minute with a composition at time zero of A = 95% and B = 5%, developing over a linear gradient such that, after 2 min, B = 100%, which was maintained for 0.5 min before being returned to starting conditions. The solvent composition for pump 2 was delivered in exact opposition to that for pump 1 at all times, starting from A = 5% and B = 95% at time 0 and traversing a mirror-image gradient toward A = 100% after 2 min, held for 0.5 min before being returned to starting conditions. The two streams were combined using a T-piece after the separation column and, by this method, produced a constant 50:50 mix of A and B going forward and thus minimized any solvent-related drift in signal response. The separation column normally used was a 50 × 2 mm Kinetex C18 3uM column (Phenomenex, Torrance, CA).
Peak Detection and MS
The HPLC eluent was delivered through an Agilent G1315B diode array detector, scanning from 240 to 320 nm at a rate of 5 Hz, and then split between a single quadrupole MS and a CAD. Two configurations of MS systems were employed.
Agilent 6140 single quadrupole mass detector with G1367C well plate autosampler, G2255A well plate stacker, G1316B column oven, ESA Corona CAD detector (ESA, Chelmsford, MA), and Agilent 35900E analog to digital converter (ADC), all operating under Chemstation version B.03.01.
Waters ZQ quadrupole mass detector (Waters Corporation, Milford, MA) with an integrated ADC, a CTC PAL autosampler (CTC Analytics, Zwingen, Switzerland) and an ESA Corona CAD detector, all operating under MassLynx 4.0.
The corona discharge detector relied on droplet production and transformation into a particle beam and was particularly sensitive to changes in solvent affecting the size of the droplets, hence the careful control of postcolumn solvent composition. The particle beam was passed through a stream of charged nitrogen molecules where the charge was transferred to the analyte molecules contained within the droplets. The charge on these droplets was then detected via an electrometer, with a proportional output acquired at a rate of 5 Hz through the ADC. In this way, a chromatogram was produced by plotting electrometer current against time. The detector had an equivalent response for equal mass-per-volume concentrations of nonvolatile analytes. The ratio of CAD peak area to sample molecular weight was therefore proportional to the molar concentration of sample. 12 The CAD detector was complementary to the DAD in that, in the main, it provided confirmation of the sample purity but could also provide information not available from the DAD. This was particularly true when the sample structure did not absorb in the UV detection range or where the sample was not retained on the chromatographic column but was eluted in the solvent front along with its original solvent (normally DMSO). In both of these cases, sample purity was not measurable by the DAD and was assessed from the CAD alone. Peak recognition by UV-DAD and CAD has captured useful spectra for more than 99% of analyses since the database was created, currently in excess of 500,000 unique structures.
Extraction and Loading of Analytical Data
For the reduction of chromatogram data into discrete peaks, with a mass spectrum associated to each peak, the LCMS system configurations used either Agilent’s Analytical Studio Reviewer or Waters’s OpenLynx. The software searched each MS spectrum to confirm the identification of the compound. Peaks were compared with simple predefined adduct patterns for the expected mass, reported in Daltons (Da). The adduct patterns were mass (M) + 1 Da (compound plus proton) and M +23 Da (compound plus sodium ion; this is commonly observed when an analyte has been in contact with glass) for the positive ion, and M − 1 Da (compound minus proton) for the negative ion. Although these are not the only likely adducts, a more exhaustive list was found to increase the risk of false-positive assignments to an unacceptable level.
A spectral purity figure then represented the summed intensity of detector responses for the ions of interest, as a proportion of all ion responses detected at that time point. Each instrument system generated a plate report as either an .rpt file (Waters) or .asr file (Agilent). In our workflow ( Fig. 1 ), the report files were processed using Pipeline Pilot Web services with an embedded Perl script to extract data into a standardized template, subsequently used to update the LCMS database. An independent log file captured the status of the extraction for each individual plate and its data, to ensure that no information was lost during transfer. Sample records in the LCMS database were stamped with the date and time of analysis. New tuples were created and stored in the database for each individual peak to capture the information shown in Table 1 .
Determination of Peak of Interest
A PL/SQL function on the database was used to identify the “peak of interest” by first considering all peaks that passed the MS spectral purity threshold (a customizable parameter against which the four spectral purity measurements were compared), then ranking the peaks in descending order by percentage purity UV, followed by CAD peak area, followed by the maximum value of spectral purity, and then taking the first peak in the sequence.
Creation of an Automatic Pass Function
Our initial objective was the automatic assessment and reliable confirmation of high sample quality that would avert the need for manual review of the data. A PL/SQL function was applied to the peak of interest data to test (1) whether the predefined adduct patterns for the expected mass ion had been found and (2) whether minimum quality thresholds had been reached. For (2), there were five parameters considered: percentage purity UV, UV peak height, UV peak width, CAD peak area, and maximum value of spectral purity. Threshold values, which were customizable, were deliberately set high for these criteria so as to minimize the occurrence of false-positive designations.
During the extraction and loading of analytical data (step 5 of Fig. 1 ), each record was flagged with a review type. If all five criteria were met in full, the record was labeled as “Auto” and was not queued for review. If one or more values did not reach the specified threshold, the analysis required manual review. In this case, a provisional pass or fail status was assigned, based on reaching the thresholds for both percentage purity UV and spectral purity. Inspection using the interactive graphical user interface (GUI) allowed the provisional pass or fail assignment to be manually confirmed or refuted. The review workflow and possible outcomes are illustrated in Figure 2 . The thresholds were reassessed regularly during the first weeks of use, and conservative settings proved successful in avoiding false-positive assignments while still significantly reducing the manual review load.
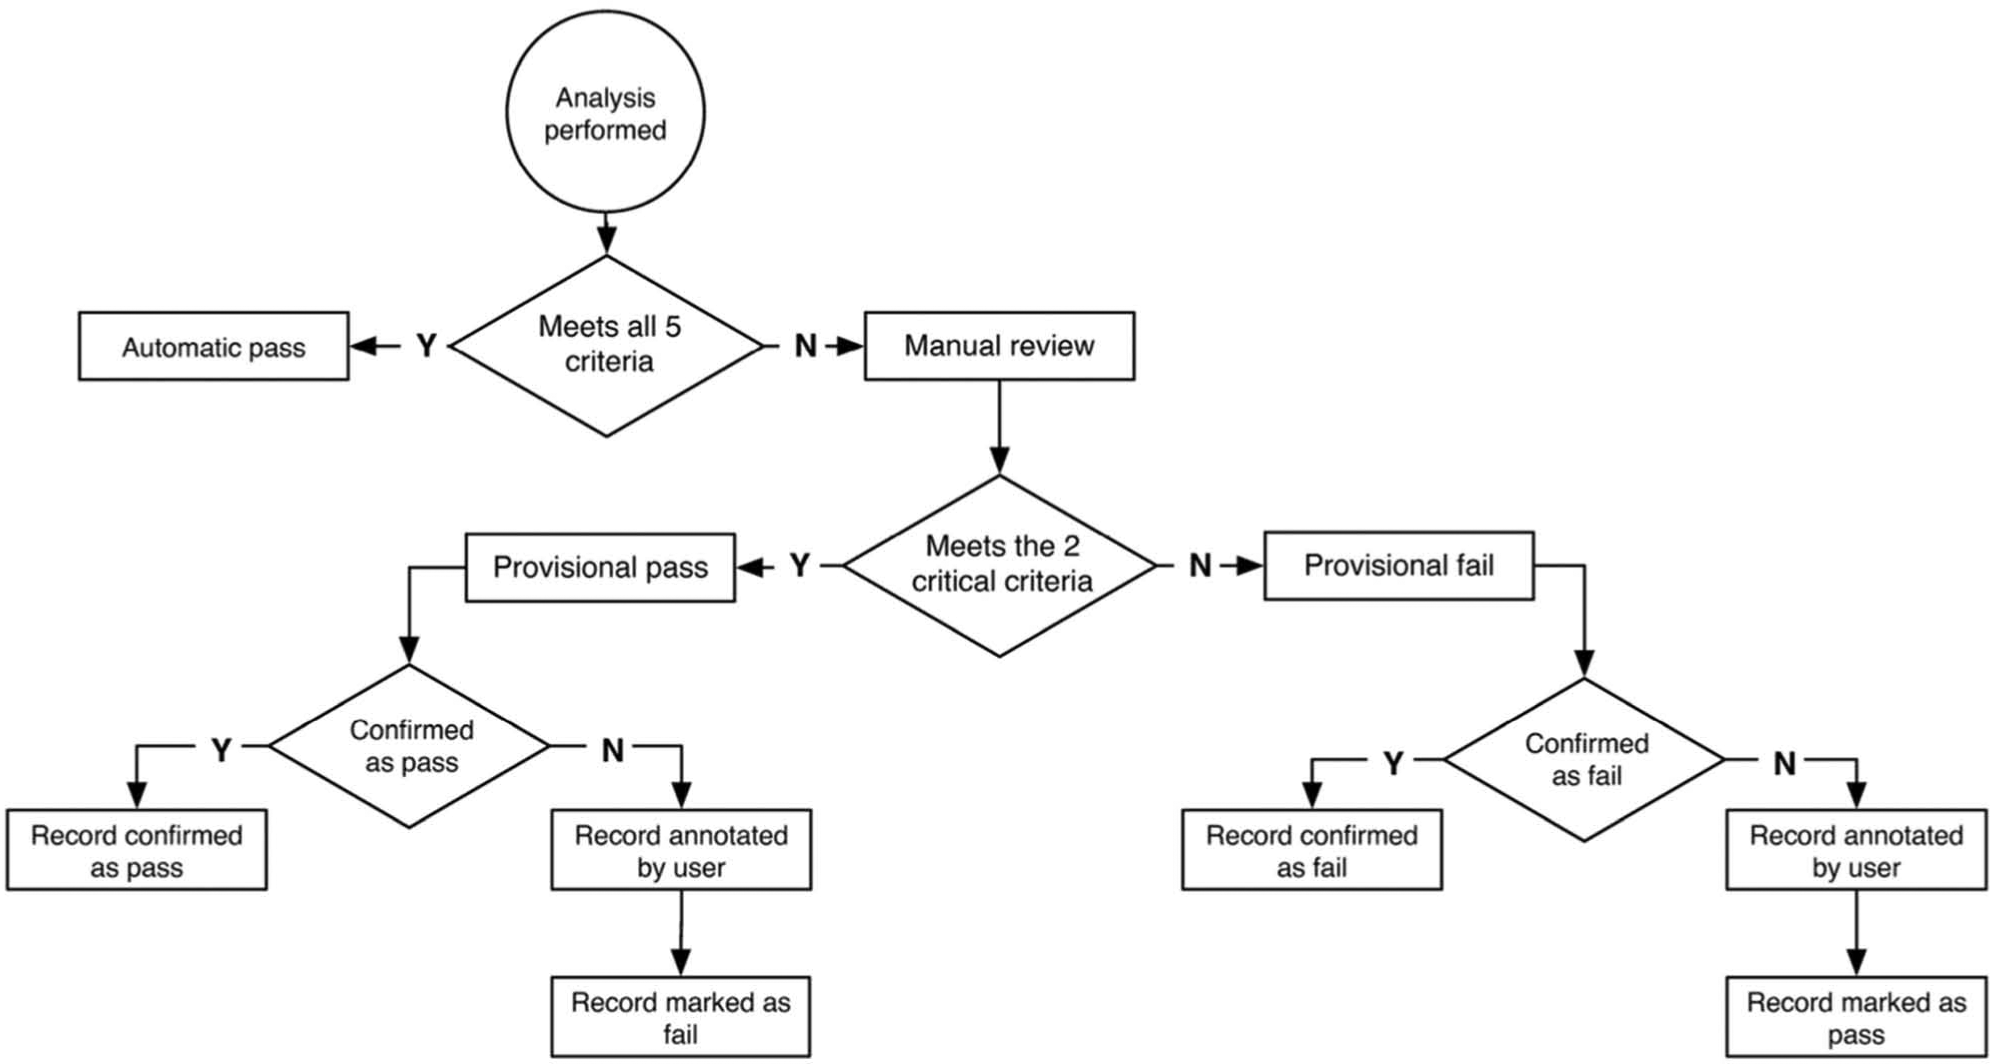
Decision tree showing the possible pathways for assigning a database pass or fail flag to the quality of sample in a vessel, as judged from its analytical data. An automatic pass is assigned only if the five key criteria are satisfied, that is, user-designated thresholds are reached for percentage purity UV, UV peak height, UV peak width, CAD peak area, and maximum value of spectral purity. A provisional pass is assigned if the two critical measures of percentage purity UV and maximum value of spectral purity reach their minimum thresholds but one or more of the other criteria do not.
Interaction via the GUI
A Web application was created for the manual review of data via an interactive GUI, and for monitoring and managing the workflow. The application was implemented using PHP version 5.3.1, and the interactive chromatograms were created using Emprise JavaScript Charts 2.1. The screen shot in Figure 3 exemplifies the review pane, showing individually color-coded peaks as detected by UV and CAD, with the peak of interest automatically identified. Use of the GUI cursor to select a peak in either of the chromatograms would automatically trigger the display of mass spectra for the relevant peak. Annotation options were available in certain fields:
“Confirmed”: The system provided a Yes/No result based on the predefined adduct patterns for the expected mass ion. It could be changed if the reviewer disagreed with the setting. This field reported only that expected mass ions had been found in the relevant peak and did not confirm or measure sample quality.
“Purity”: The user could insert an interpreted value in addition to the one reported automatically. Both values were then retained. This was useful in certain circumstances, for example, when an expected compound was eluted close to the solvent front and its indistinct peak not correctly integrated by the LCMS system software.
“Mass”: When an unexpected compound was found as a major component, its molecular weight could be captured. This proved to be particularly useful in the recognition of incorrect structure assignments and in understanding compound degradation pathways.
“Comments”: Additional information such as “no peaks of interest” or “instrument error” could be reported.
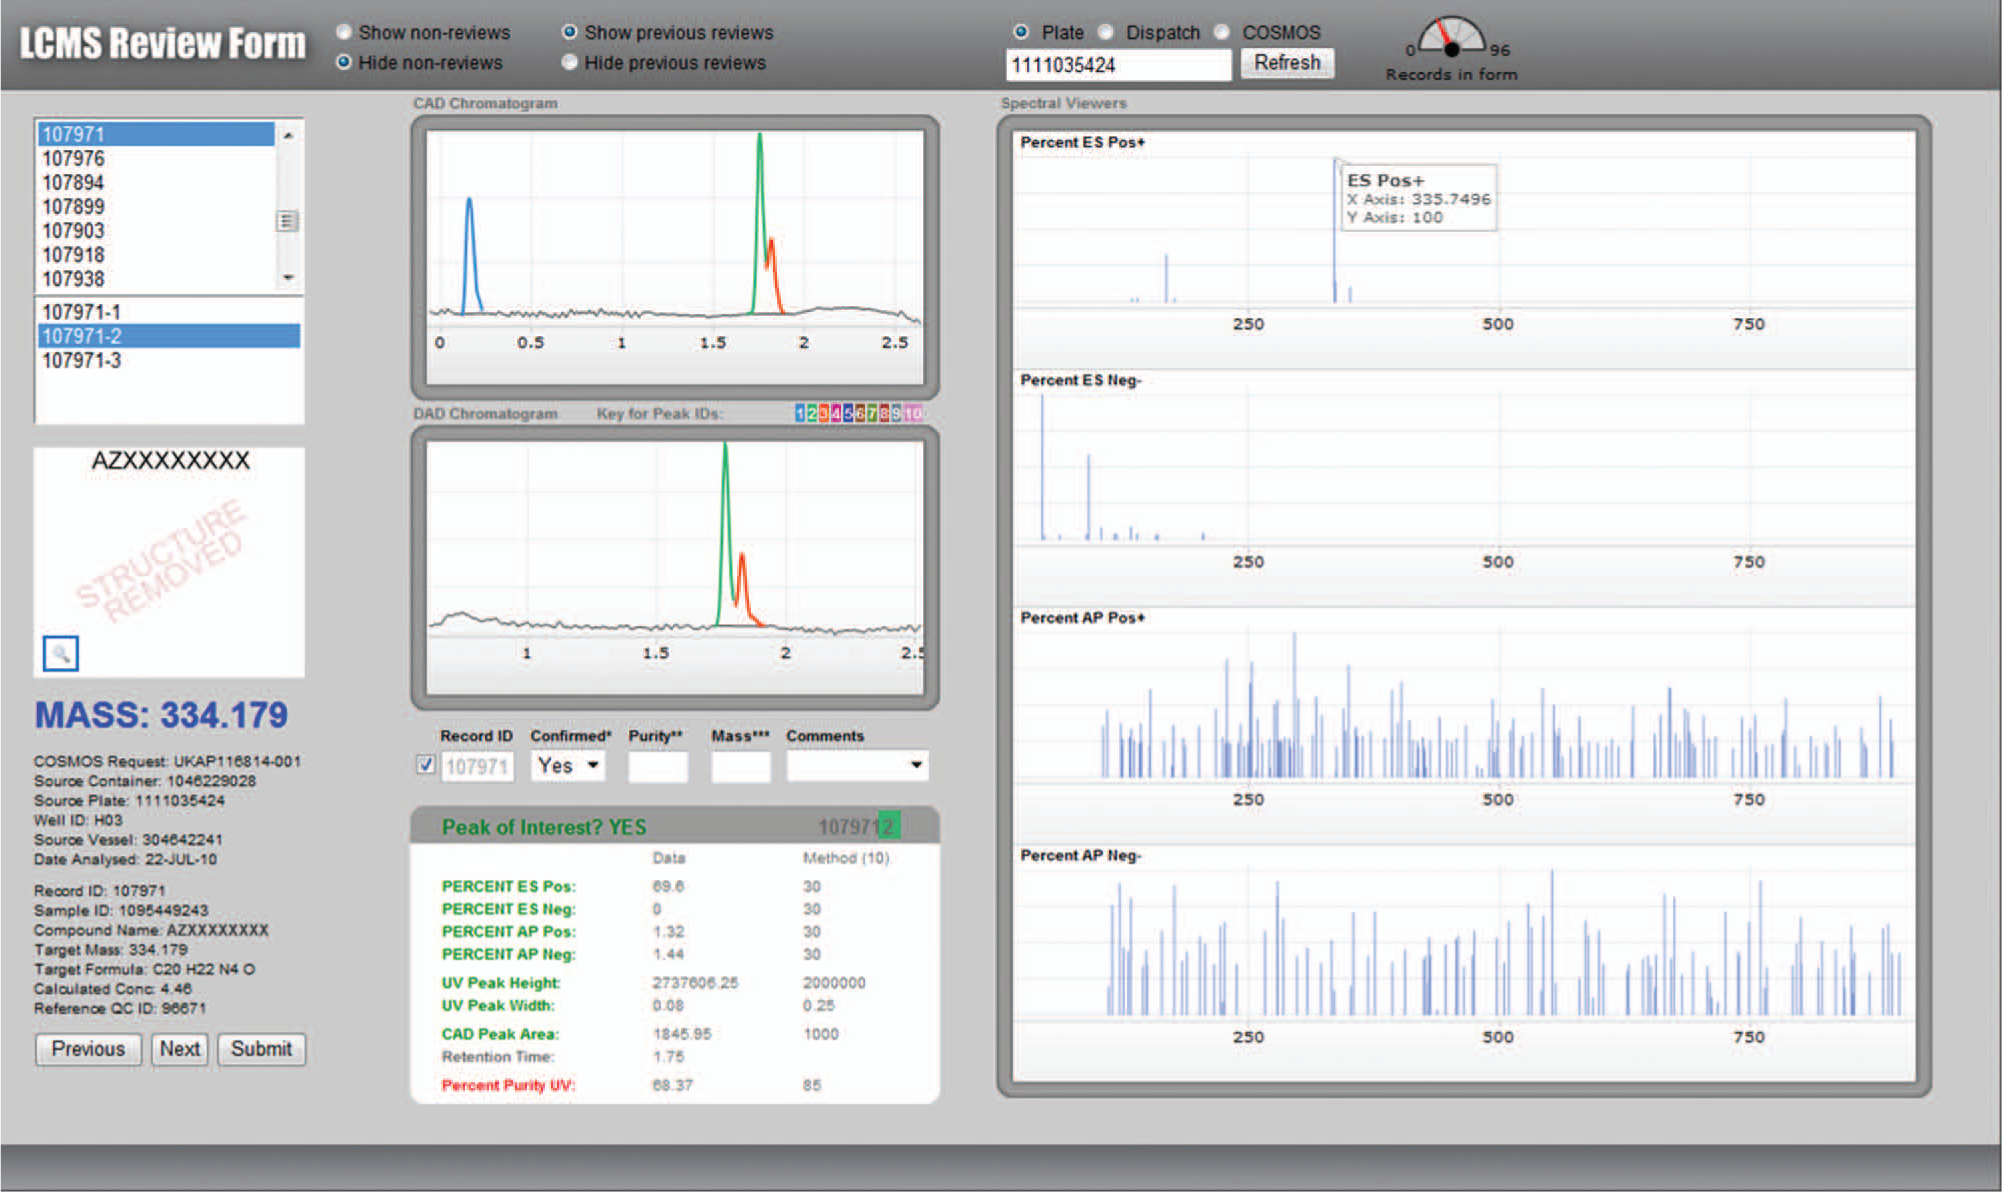
Analytical data review interface showing peak of interest (in green). In this example, the expected mass ions were observed but percentage purity was below the threshold required (85%) for an automatic pass; hence, a manual review was prompted.
The manual review process allowed a user to make their final decision on the analytical result classification, either confirming or changing the provisional pass or fail status that had been proposed. The time required to review each analysis and make any annotation needed was reduced, with practice, to an average of 10 s. This was largely due to the visual cues within the GUI, such as the color coding, that guided the user toward key pieces of decision-making information.
Visual workflow tools ( Fig. 4 ) allowed the prioritization of individual or batches of plates, as well as prompting the user to export the reports on completed jobs and to queue new orders, thus maintaining a steady flow of samples through the system. Standard reports were generated directly from the LCMS database, in customizable output formats, which further reduced the time required to complete the analytical cycle and also circumvented the risk of errors in manually assembling data into spreadsheets. Without the bottleneck of manual reviewing, which had often required two employees to work on the highest priority batches, a daily workflow of more than a thousand analyses became manageable by one employee. Also, the full capacity of the three LCMS instrument assemblies could be exploited, by continuously queuing samples for analysis and using the flexibility of the GUI to prioritize selected batches of results for reviewing and reporting.
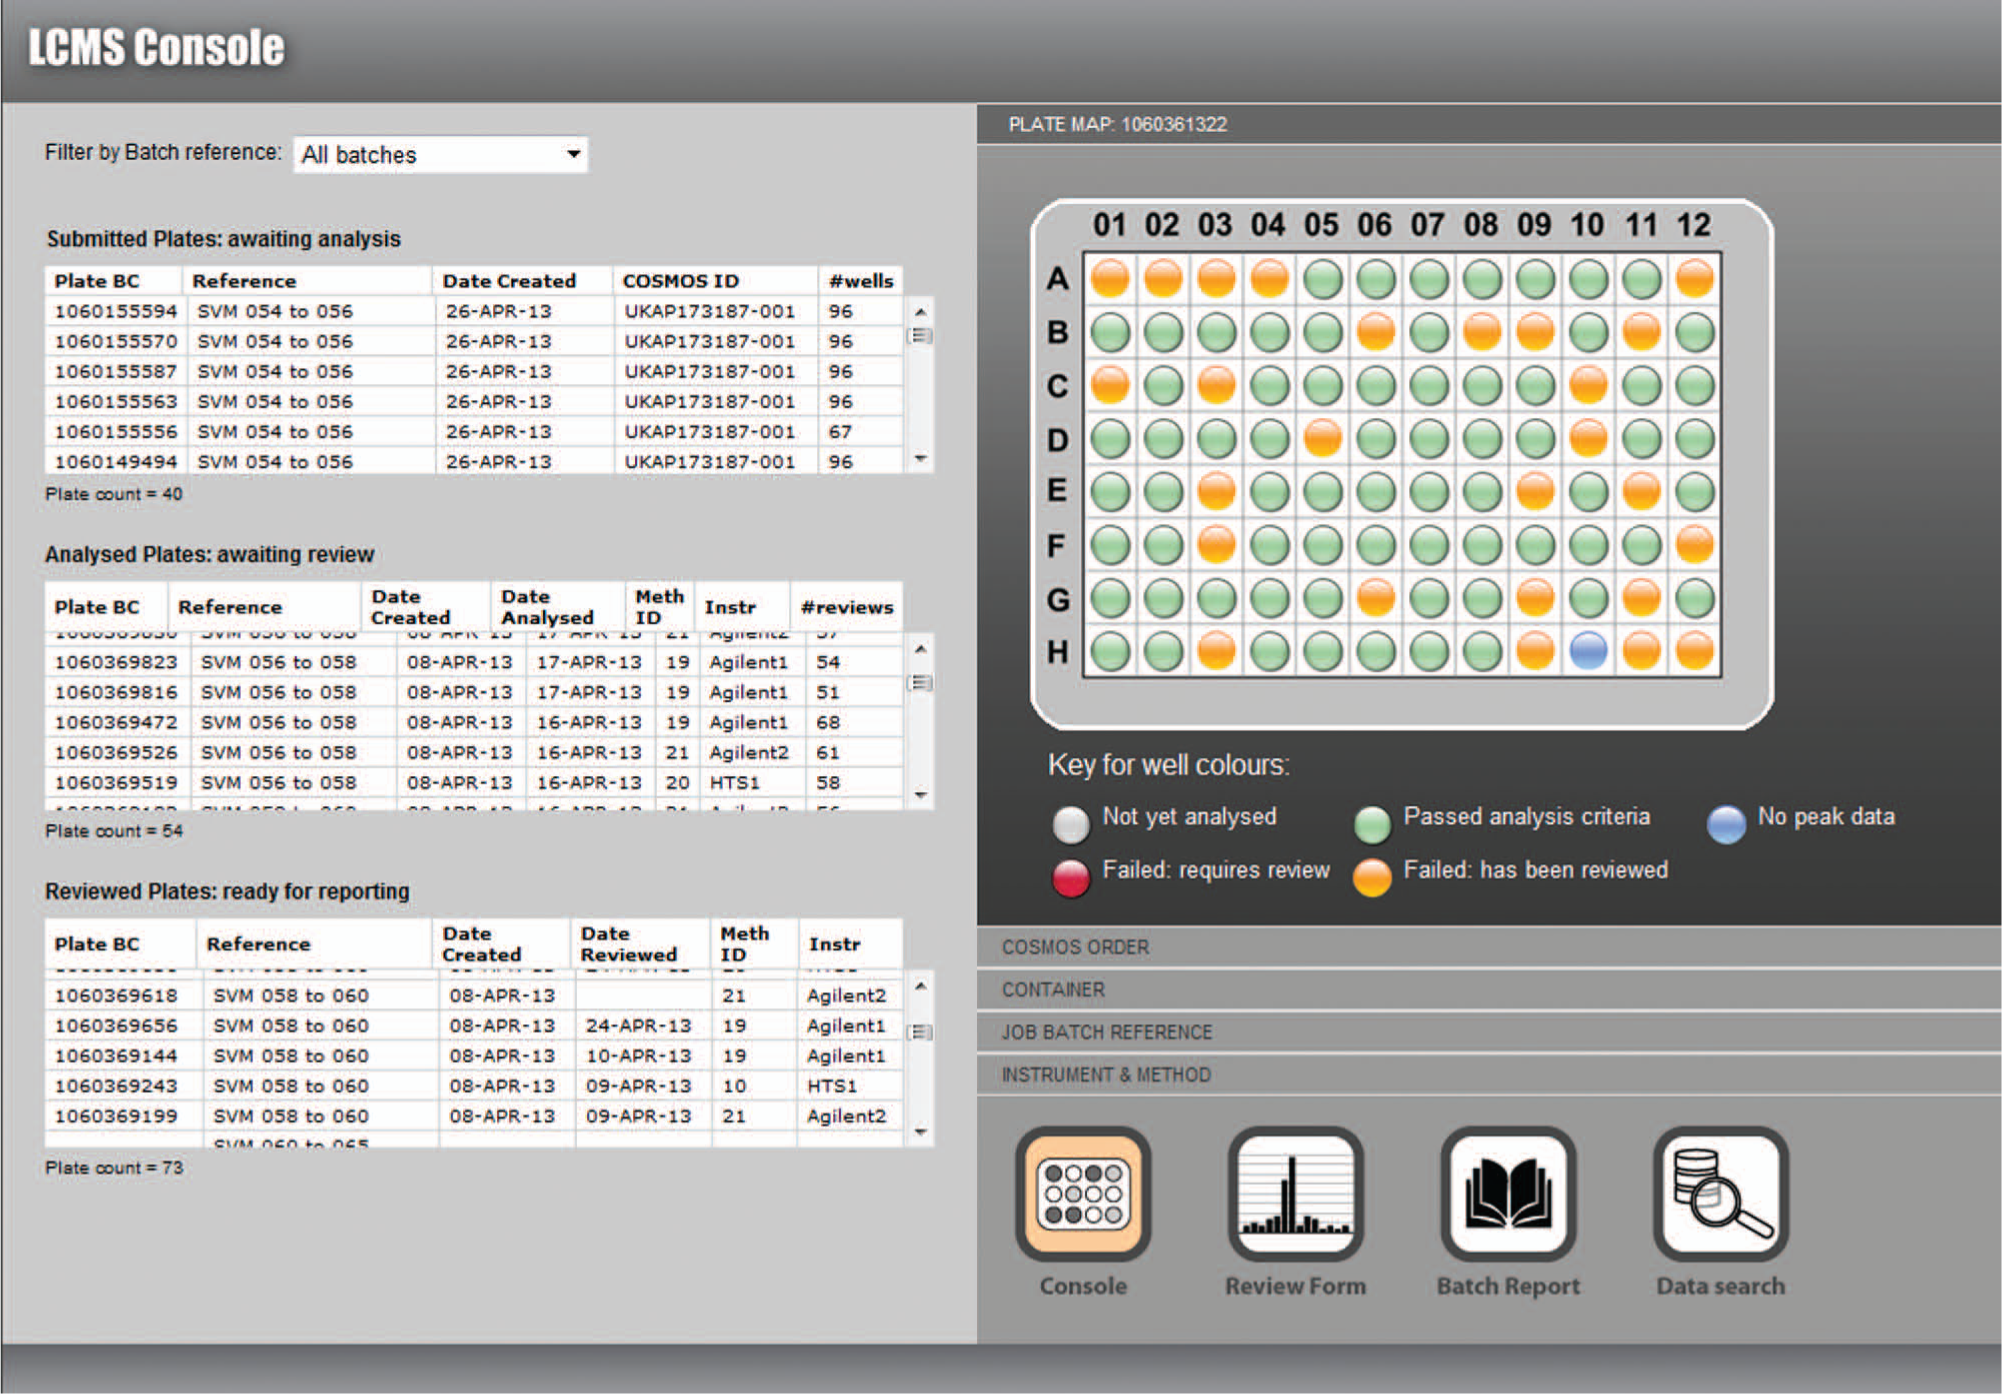
Visual workflow tools to manage the work in progress. Plates in the queue for analysis, data review, or final report can be flexibly prioritized. The link through to the data search tool allows individual analyses to be recalled by sample identifier, plate barcode, date of analysis, or a user-assigned reference code.
Further time saving and risk reduction were achieved by the automatic calculation of analyte concentration. Control sample injections were performed at predesignated regular intervals on each LCMS system to ensure that baseline drifts or system anomalies did not go unnoticed. Analytical records for control samples were generated via the same workflow as test sample records ( Fig. 1 ) except that they were flagged as controls in the run file and in the LCMS database. The control sample was a standardized solution of warfarin in DMSO, created from solid by weighing to a target concentration of 10 mM solution that was then accurately calibrated by nuclear magnetic resonance studies. 12 Each subsequent test sample analysis, which used the same instrument assembly and the same conditions for chromatography and detection, was automatically compared with the last control sample analysis. Calculation of the analyte concentration, using the relative CAD peak areas and molecular weights of warfarin and the analyte compound, respectively, was then performed and recorded using a PL/SQL function on the database, without any need for user intervention.
Results
Over approximately 3 years, the proportion of analyses automatically passed by the system has averaged 33%. This figure has fluctuated according to the type of work undertaken. During studies focused on compounds at greater risk of deterioration in solution, a higher proportion of the analyses required manual review. However, samples supplied to HTS for hit follow-up were generally of good quality, and the proportion of analyses automatically passed by the software then exceeded 60%, leading to valuable time savings during the review stage. Liberation of resources from reviewing sample analyses, combined with the ease of interrogation of the database, quickly encouraged more probing questions. Because the database was structured around individual analyses rather than (as in most commercial software) around plates, it was possible to identify trends and discrepancies in the chemical stability of compounds through the relationships with their source vessels. Their analytical records could be easily recalled and visualized, and the connection with container and compound registration data allowed vessel-level results to be compared with those of other vessels containing the same batch or other batches of the same compound.
When a low-quality sample was found, we were able to distinguish with relative ease between likely reasons. If the compound was unstable in DMSO, for example, then some deterioration was generally exhibited in all other vessels containing the same compound in DMSO solution. (The QC strategy itself evolved, so that a single-vessel failure would trigger the analysis of all other examples of the same structure.) Rates of sample deterioration could be readily investigated by recalling and visualizing analyses performed at different time points after the sample had been solubilized. However, if two vessels containing the same sample had produced radically different analytical results, such as one being confirmed as high quality whereas the other contained a compound with an entirely different molecular weight, this provided a strong indication for a handling error either within the supply chain or during the solubilization process. Using the new database, it was possible to identify other vessels, containing other compounds, that would have been present at the same point in the process flow at the same time and to target them all for analysis. From these results, it quickly became apparent whether transposition errors had occurred, that is, an interchange of two relationships between container position and sample identifier. In some instances, the identified compounds could be “reprieved” by realignment of the transposed data within the compound registration and/or container inventory databases. We could also explore more generally whether the incidence of quality failures recorded in the LCMS database was linked to certain solubilization dates, vessel storage time, sample supplier, or synthesis program and begin to look for any underlying risk factors. Thus, the recording of low-quality vessels could generate additional value beyond a simple classification.
Compounds that were unstable could be computationally clustered by structural similarity and studied for functional groups or spatial relationships of atoms that appeared to correlate with higher risk. This work, which will be reported separately, has led to a highly efficient approach to the targeting and removal of low-quality compounds in the screening collection. The number of analyses thereby required to find low-quality compounds has been far fewer compared with the number that would have been required by random analytical monitoring. The proportion of low-quality compounds in the collection has been reduced by nearly 10% in approximately 18 months, with concomitant improvement in the average quality of compounds selected for HTS hit follow-up. The ability to add information to the database records for low-quality results has enabled us to explore a number of interesting features within the collection. For example, in samples in which a molecular weight was captured for the major component and was not that of the anticipated compound, the distribution of mass difference between “found” and “expected” was clearly nonrandom and exhibited significant spikes at particular values. When the most prominent mass shifts were examined in detail, they appeared to represent simple chemical transformations such as oxidation and hydrolysis (see Fig. 5 ).
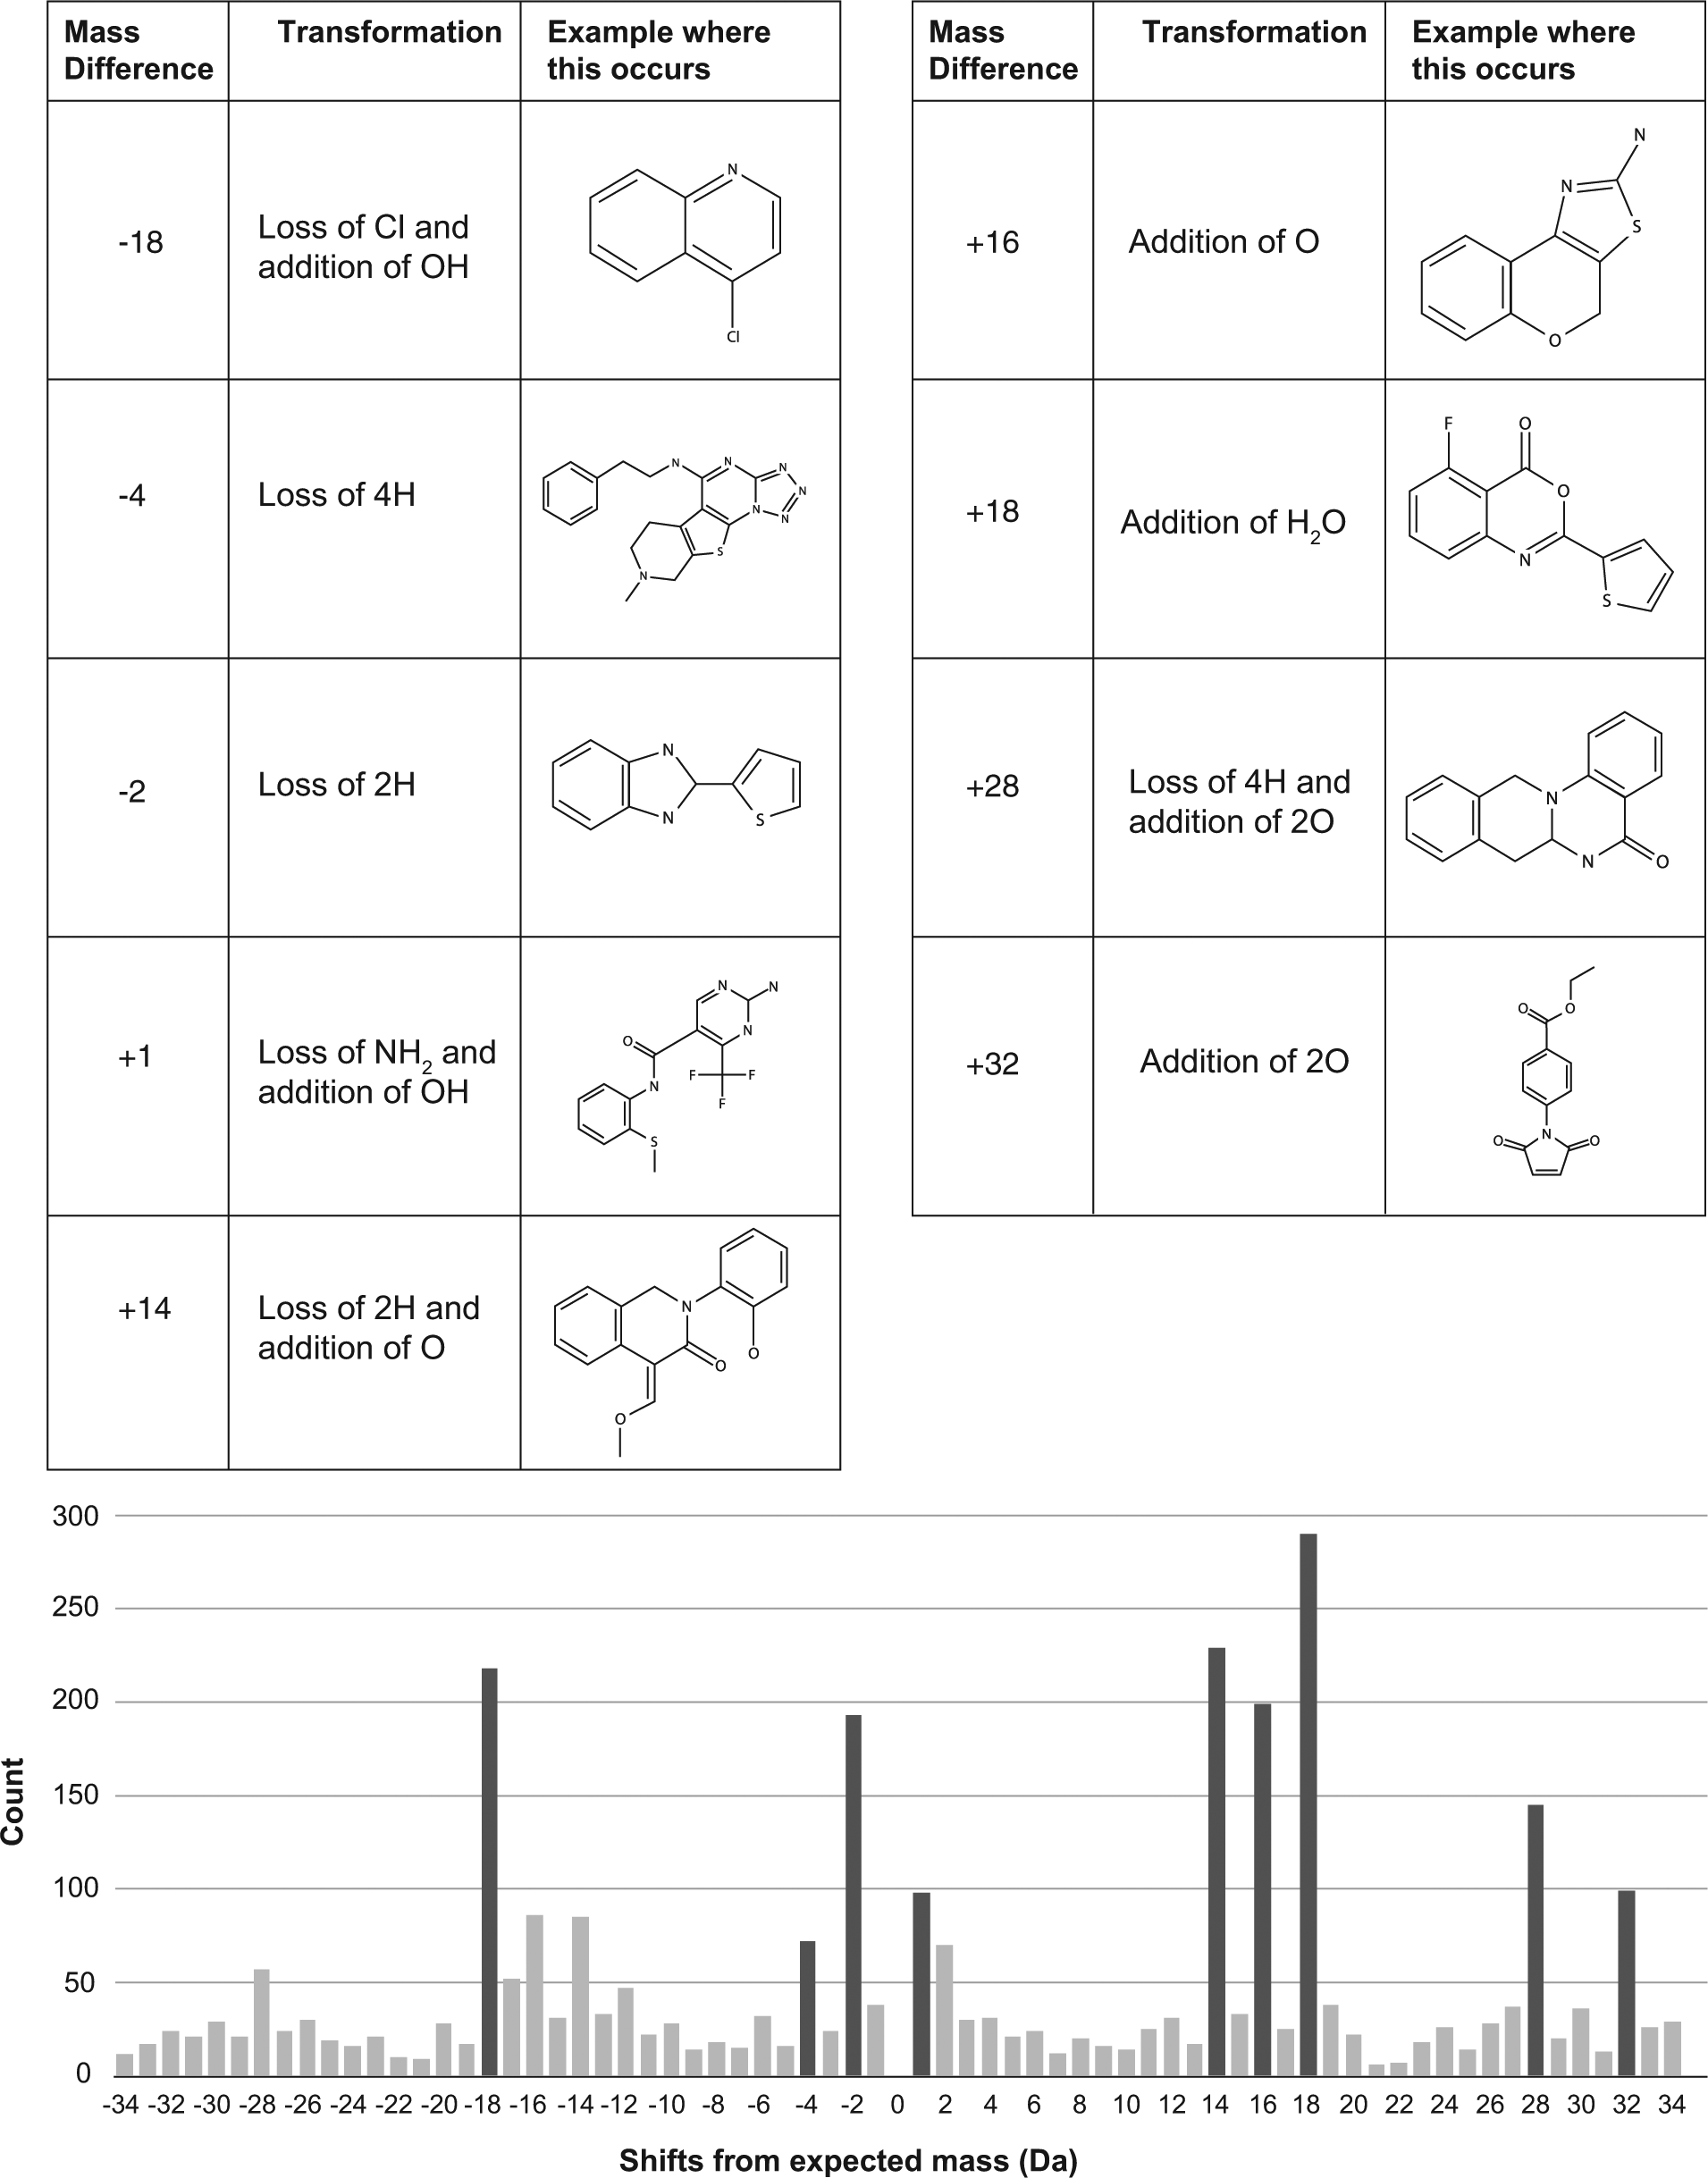
Graph showing the most abundant values (in Daltons) for the differences between the molecular mass ion expected and the mass ion identified for the major component of the sample. Six thousand analyses were studied in which an unexpected compound appeared as a single peak in the chromatogram at more than 60% purity by UV. The most common values of mass differences are thought to result from hydrolytic and oxidative transformations. Examples illustrated show some commercially available compounds in which these differences were observed.
Important deductions from interrogation of the database were also made when anomalies in biological testing were observed. In one example, a chemical series that had originally appeared potent became inactive when compounds were resynthesized via a different chemical route. By reviewing the analytical spectra and data for all the original potent samples, it was possible to identify and characterize, without the need for further analysis, a small impurity that was common to the products of the first synthetic route but not the second. This impurity was much more potent than the intended compounds targeted for synthesis. In a separate example, a compound that had lost its potency on resynthesis appeared, by chromatographic retention, to be identical with the original batch. However, retrieval and comparison of the mass spectra for the two samples showed different fragmentation patterns that could be attributed to different regioisomers with the same molecular formula.
Where multiple batches of the same compound had been stored in the inventory, reporting of analytical data at the vessel level, rather than summarizing at the sample or compound level, has offered a rapid route to improving the overall quality of the collection. The system has allowed vessels containing the same chemical entity to be ranked in priority according to their physical quality and thereby a preferred vessel to be identified. Subsequent dispenses of the compound are then always sourced from the highest-quality vessel. In many cases, the lower-quality candidates could be physically discarded. If alternative batches were not available, there was the option to repurify high-priority compounds that were of low quality or to trigger their replacements either by purchase or custom synthesis.
Discussion
The concepts that underpinned our approach were the preprocessing of MS raw data and their storage in a dedicated repository to facilitate data mining. Challenges and advantages of this approach have already been explored in the fields of proteomics and metabolomics, where MS data are perhaps more readily perceived as an enduring asset for future learning and scientific discovery, in addition to the more immediate value in quality control. Literature related to these fields contains many examples of the preprocessing of MS data and storage for subsequent mining, and of applying user-guided thresholds to key parameters for peak detection and discrimination.15 –17 The value of applying similar concepts to the custodianship of small-molecule analytical data has now been realized. Population of a relational database has enabled an efficient storage and retrieval of preprocessed data, allowing import and export functions to be easily supported and offering query and update functions. Moreover, the structured storage model has allowed data from different scenarios to be matched and compared, potentially across multiple users and instrument setups, and with the facility for further annotation of results with meta-information.
In parallel with the improved visualizations that enabled simplified reviewing and decision making and operational gains in throughput and efficiency, the new system has supported investigations extending well beyond the traditional questions of, “Is this the expected compound?” and “How pure is it?” and has exposed a new wealth of information about the compound collection. Moreover, the combination of a large volume of analytical data with human annotation will present further opportunities for data mining and machine-learning approaches that could increasingly automate its interpretation and exploitation.
Footnotes
Acknowledgements
The authors express their thanks to James Wood (AstraZeneca) for the collection and review of LCMS QC data between 2010 and 2012.
Declaration of Conflicting Interests
The authors declared no potential conflicts of interest with respect to the research, authorship, and/or publication of this article.
Funding
The authors received no financial support for the research, authorship, and/or publication of this article.