
Abstract
Global mass spectrometry (MS) profiling and spectral count quantitation are used to identify unique or differentially expressed proteins and can help identify potential biomarkers. MS has rarely been conducted in retrospective studies, because historically, available samples for protein analyses were limited to formalin-fixed, paraffin-embedded (FFPE) archived tissue specimens. Reliable methods for obtaining proteomic profiles from FFPE samples are needed. Proteomic analysis of these samples has been confounded by formalin-induced protein cross-linking. The performance of extracted proteins in a liquid chromatography tandem MS format from FFPE samples and extracts from whole and laser capture microdissected (LCM) FFPE and frozen/optimal cutting temperature (OCT)- embedded matched control rat liver samples were compared. Extracts from FFPE and frozen/OCT-embedded livers from atorvastatin-treated rats were further compared to assess the performance of FFPE samples in identifying atorvastatin-regulated proteins. Comparable molecular mass representation was found in extracts from FFPE and OCT-frozen tissue sections, whereas protein yields were slightly less for the FFPE sample. The numbers of shared proteins identified indicated that robust proteomic representation from FFPE tissue and LCM did not negatively affect the number of identified proteins from either OCT-frozen or FFPE samples. Subcellular representation in FFPE samples was similar to OCT-frozen, with predominantly cytoplasmic proteins identified. Biologically relevant protein changes were detected in atorvastatin-treated FFPE liver samples, and selected atorvastatin-related proteins identified by MS were confirmed by Western blot analysis. These findings demonstrate that formalin fixation, paraffin processing, and LCM do not negatively impact protein quality and quantity as determined by MS and that FFPE samples are amenable to global proteomic analysis.
M
Formalin fixation with paraffin embedding is the universal method for tissue preservation and stabilization prior to histological evaluation by pathologists. The process of formalin fixation results in protein-nucleic acid and protein-protein cross-links, owing to reactivity of formaldehyde with side chain moieties of lysyl, argininyl, tyrosyl, aspartyl, histidyl, and seryl residues (Fox et al. 1985; Shi et al. 2000). Protein extraction from these samples using traditional extraction is confounded by the high degree of protein covalent cross-linking. Despite these limitations, protein isolated from formalin-fixed, paraffin-embedded (FFPE) tissue has been successfully used in Western blot, reverse-phase arrays, and surface-enhanced laser desorption/ionization time-of-flight MS (Ikeda et al. 1998; Martinet et al. 2004; Becker et al. 2007; Nirmalan et al. 2009). With the advent of newly developed procedures and extraction methods, analysis of FFPE tissue by MS has recently been reported. A commercially available tissue lysis buffer has been used for successful MS analysis by allowing extraction of peptides directly from FFPE tissue (Hood et al. 2005; Prieto et al. 2005; Jain et al. 2008).
MS analysis from FFPE tissue has only rarely been demonstrated (Crockett et al. 2005; Aoki et al. 2007; Stauber et al. 2008). These studies have largely focused on a comparison of the proteomic profiles from matched FFPE and frozen tissue. The number of proteins identified from FFPE tissues compared with matched frozen samples varied widely and was apparently dependent on several variables, including the amount of protein used and type of MS platform [matrix-assisted laser desorption/ionization, liquid chromatography tandem mass spectrometry (LC-MS/MS), or capillary isoelectric focusing/nano-reverse-phase LC separation coupled with electrospray ionization-linear ion trap] (Balgley et al. 2007; Chaurand et al. 2008; Patel et al. 2008; Stauber et al. 2008). The number of proteins identified from FFPE tissue has generally been shown to be reduced compared with matched frozen tissue (Crockett et al. 2005; Hood et al. 2005; Bagnato et al. 2007; Guo et al. 2007). Although Hood et al. (2005) demonstrated that formalin fixation and paraffin embedding reduced the number of identified unique proteins, the amount of proteomic information that could be extracted from these samples was similar to frozen samples with respect to gene ontology and subcellular localization. Others have reported equal representation of FFPE as compared with frozen tissue (Shi et al. 2006). In a recent report (Palmer-Toy et al. 2005), the number of proteins identified from FFPE tissue was greater than that from matched frozen tissue, with a percentage of unique proteins of 20% and 40% for the frozen and FFPE samples, respectively.
We have utilized MS and a modified, commercially available tissue lysis buffer to compare protein yield, number, and subcellular representation of lysates obtained from FFPE and matched OCT-frozen liver samples from vehicle-treated rats. We further assessed the impact of LCM on these parameters. The effect of formalin fixation and paraffin embedding on detection and quantitation of regulated proteins was also evaluated in liver samples from atorvastatin-treated rats. Validation and application of these methods will allow researchers to obtain valuable proteomic information from the vast reservoir of archived tissue by MS analysis of FFPE tissue. This represents a promising approach for biomarker discovery in disease research and/or drug development.
Materials and Methods
Atorvastatin Treatment Protocol
Male Sprague-Dawley rats (Charles River; Raleigh, NC), 12–14 weeks of age and weighing 350–500 g were used. The animals were housed individually in stainless steel cages in an environmentally controlled room and were fed certified rodent diet #5002 (PMI Nutrition International; St. Louis, MO), and water was available ad libitum. Each group of five rats received vehicle (1% methycellulose) or 100 mg/kg/day atorvastatin for 4 days by oral gavage at a dose volume of 10 ml/kg. Animals were euthanized by carbon dioxide asphyxiation followed by exsanguination.
Tissue Samples
Paired liver samples were collected from each rat. One sample was embedded in OCT, snap frozen in liquid nitrogen, and stored at −70C. The other sample was fixed in 10% neutral buffered formalin for 48 hr then routinely processed to paraffin (FFPE). Two 7-μm-thick sections were prepared from each OCT-frozen and FFPE block, mounted on standard glass slides, and stored at −70C until use. In each section, there were two pieces of liver that were ∼7 cm × 3 cm. FFPE and OCT tissue blocks were stored at room temperature and −70C, respectively, and were 2 years old at the time of protein isolation.
Protein Isolation
Non-LCM Samples
LCM Samples
Protein Quantitative and Qualitative Assessment
Protein concentration was determined using the Nano-Orange Protein Quantitation Kit (Invitrogen; Carlsbad, CA) according to the manufacturer's instructions. One microgram of each sample was run on 4–12% Bis-Tris gels (Invitrogen) and stained with Sypro Ruby Gel Stain (Invitrogen) according to the manufacturer's instructions.
Protein Tryptic Digestion and LC-MS/MS
Samples were reduced with 5 mM DTT for 1 hr at 60C and alkylated with 15 mM iodoacetamide at room temperature for 1 hr. Protein digestion was performed with trypsin (Promega Corp.; Madison, WI) at a 1:20 enzyme/substrate ratio for 16 hr at 37C in 75 mM ammonium bicarbonate. Following digestion, peptide solutions were acidified to 0.1% formic acid and analyzed directly. Peptide solutions (500 ng) were analyzed using a Paradigm MS4 HPLC system (Michrom Bioresources, Inc.; Auburn, CA) coupled to a linear ion trap mass spectrometer (LTQ; ThermoFisher, San Jose, CA). Samples were loaded from an autosampler onto a 6-mm vented column (Licklider et al. 2002) at a flow rate of 12 μl/min, followed by separation on a 15-cm analytical column at a flow rate of 250 nl/min (generated by splitting the flow from 100 μl/min using a micro-tee). Both columns were 75-μm inner diameter (ID) × 360-μm outer diameter fused silica IntegraFrit capillaries (New Objective; Woburn, MA) and were slurry packed in-house with 4-μm, 90-A° pore size Jupiter C12 material (Phenomenex; Torrance, CA). Gradient conditions were 1–30% buffer B for 95 min, 30–50% buffer B for 15 min, and 50–95% buffer B for 5 min. Mobile phases consisted of 0.1% formic acid-0.1% acetonitrile in water (v/v; buffer A); and 0.1% formic acid-5% water in acetonitrile (v/v; buffer B). The analytical column was directly connected to a 30-μm-ID × 3-cm stainless steel emitter (Proxeon; Odense, Denmark) through a micro-tee (Upchurch Scientific; Oak Harbor, WA). MS/MS analyses were performed in data-dependent acquisition (DDA) mode; each full MS (
Protein Identification
Product ion data were searched against the concatenated forward and reverse rat International Protein Index protein database (version 3.38; http://www.ebi.ac.uk/) using the Mascot search engine (v2.2, Matrix Science; London, UK) via Mascot Daemon v2.2. The database was appended with the common contaminant proteins (common repository of adventitious proteins, www.thegpm.org/crap/index.htm) to prevent false assignment of peptides derived from those proteins. The Extract_msn executable generates both doubly and triply charged versions of each ion selected in the DDA experiment, unless no ions are observed above the parent
1-Dimensional (1-D) Gel Separation of a Selected FFPE Sample to Reduce Sample Complexity Prior to MS Analysis
To reduce sample complexity prior to MS, 20 μg of protein from one control FFPE rat liver was loaded on a 4–12% gradient NuPAGE Bis-Tris gel (Invitrogen); the gel was stained with SimplyBlue (Invitrogen). The lane was excised into ten equal segments using a grid and transferred into microfuge tubes. Samples were tryptic digested, and LC-MS/MS was performed as above.
Western Blot
Ten micrograms of protein lysate from each sample were run on 4–12% NuPAGE Bis-Tris gels (Invitrogen) and transferred to nitrocellulose membranes (Invitrogen) as per the manufacturer's instructions. Membranes were blocked and incubated with antibodies for formimidoyltransferase-cyclodeaminase (FTCD) (1:500; Santa Cruz Biotechnology, Santa Cruz, CA), adenosyl homocysteinase 1 (AHCYL1) (1:500; Abnova Corp., Heidelberg, Germany), acyl-CoA synthetase long-chain family member 1 (ACSL1) (1:500; Santa Cruz Biotechnology), acetyl-CoA acetyltransferase (ACAT) (1:2000; Abcam, Inc., Cambridge, MA), aldehyde dehydrogenase 9 family, member A1 (ALDH9A1) (1:500; Atlas Antibodies AB, Stockholm, Sweden), fructose 1, 6-biphosphatase (FBP1) (1:500; LifeSpan Biosciences, Seattle, WA), hydroxymethyl-glutaryl-CoA synthase (HMGCS) (1:2000; Abcam), glutamate dehydrogenase (GD) (1:1000; Abcam), or calmodulin (1:1000; Abcam) overnight at 4C, and then probed with peroxidase-conjugated goat anti-mouse IgG (1:10,000), peroxidase-conjugated donkey anti-mouse IgG (1:10,000), peroxidase-conjugated rabbit anti-mouse IgG (1:10,000), peroxidase-conjugated goat anti-chicken IgG (1:10,000), or peroxidase-conjugated donkey anti-rabbit IgG (1:10,000) (Jackson ImmunoResearch Laboratories, Inc.; West Grove, PA), for 1 hr at room temperature. To verify the presence of protein and to normalize protein loading, matching blots were also run with 10 μg of each sample, and blots were probed with an anti-actin antibody (AB-1; 1:10,000) (Oncogene Research Products; San Diego, CA) for 1 hr at room temperature, followed by a 1-hr room temperature incubation with peroxidase-conjugated goat anti-mouse IgG (1:2000) (Oncogene Research Products). All Western blots containing 10 μg of protein were developed using Amersham ECL Plus Western blotting detection reagents (GE Health Bio-Sciences; Piscataway, NJ) according to the manufacturer's instructions. Bands were visualized with a Kodak image station 440CF, with Kodak 1D software (Carestream Molecular Imaging; New Haven, CT), or by exposing the membrane to autoradiography film.
Ingenuity Pathway Analysis
Differentially regulated proteins identified in OCT-frozen and FFPE samples were analyzed using Ingenuity Pathways Analysis (Ingenuity Systems; Mountain View, CA). Analyses were conducted on regulated proteins with minimum criteria of 2-fold upregulation or downregulation (based on spectral counts). A data set containing protein identifiers and corresponding expression values were uploaded into the application. Each protein identifier was mapped to its corresponding protein object in the Ingenuity Pathways knowledge base (Ingenuity Systems). Functional analysis (signaling and canonical) was performed on the data set and identified the biological and disease processes that were relevant to the set of regulated proteins.
Results
Protein Yield and Quality Assessment
Efficient extraction of proteins from FFPE samples was obtained, and these FFPE samples were subsequently successfully used for MS analysis (Table 1). Protein yields obtained from FFPE samples tended to be slightly less than OCT-frozen samples, except for the LCM samples, in which FFPE and OCT-frozen yields were similar (Table 1). The greater similarity in the yields of the LCM samples may be due to greater consistency, because an equivalent area was collected from each sample, whereas in the whole-tissue slide scrape, the amounts of liver tissue that were OCT embedded might not have been exactly equal. Sufficient amounts of protein were isolated from each sample/tissue type for further analysis. Protein quality from FFPE samples was adequate, as indicated by widely distributed molecular masses represented on polyacrylamide gels (Figure 1A). Compared with the OCT-frozen samples, protein banding patterns from FFPE samples appeared less sharp (Figures 1A and 1B), suggesting either potentially greater peptide fragmentation, fixation artifact resulting from the use of different lysis buffer components in FFPE samples, and/or effects of formalin on protein characteristics.
Protein yields from control non-LCM liver samples and LCM liver samples
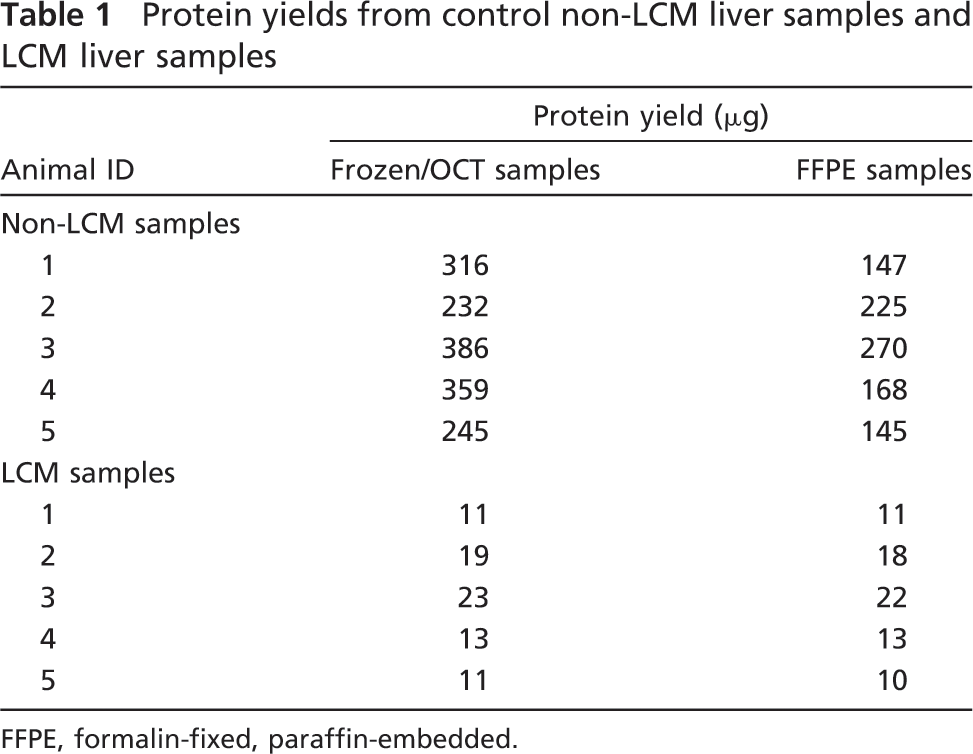
FFPE, formalin-fixed, paraffin-embedded.
MS Analysis of Proteins From Vehicle Control FFPE and Frozen/OCT-embedded Tissue Samples
FFPE and OCT-frozen liver samples from five vehicle control rats were analyzed with two MS runs performed on each sample. Proteins were only considered present if they were identified in three of the five biological replicates in both MS runs and identified by two or more peptides. We required two unique peptides per protein in a given replicate for a protein to be identified and did not use single peptides hits in generating the data. The number of identified proteins that met the above criteria were 85 from the OCT-frozen and 132 from the FFPE samples, with 75 proteins shared (Figure 2A). Thirteen percent of proteins identified were unique to OCT-frozen samples and 40% to FFPE samples.
Results from LCM samples indicated 116 proteins and 170 proteins were identified from the LCM OCT- frozen and LCM FFPE samples, respectively, with 97 proteins shared (Figure 2B). Similar unique percentages were seen in LCM samples, with 16% and 42%, respectively, for the OCT-frozen and FFPE samples. The effect of LCM on the number of proteins identified in frozen samples in the absence and presence of LCM was assessed. Eighty-five proteins were identified from the whole-section (non-LCM) samples compared with 116 proteins from the LCM samples, with 68 proteins shared between samples (Figure 2C). FFPE (non-LCM) and LCM samples were similarly compared. There were 132 proteins identified from the FFPE (non-LCM) sample and 170 proteins identified from the FFPE (LCM) sample, with 117 proteins shared (Figure 2D).
Subcellular Localization of Identified Proteins From Control Animals
The subcellular locations of the identified proteins were assigned by the Gene Ontology database. Identified proteins were found to be distributed across various cellular compartments. Equivalent subcellular compartmental representation was observed with the whole-section (non-LCM) FFPE (Figure 3A) and OCT-frozen samples (Figure 3B), and the majority of identified proteins originated from the cytoplasm (Figure 3).
MS Analysis of Proteins From Vehicle Control and Atorvastatin-treated FFPE and Frozen/ OCT-embedded Tissue Samples
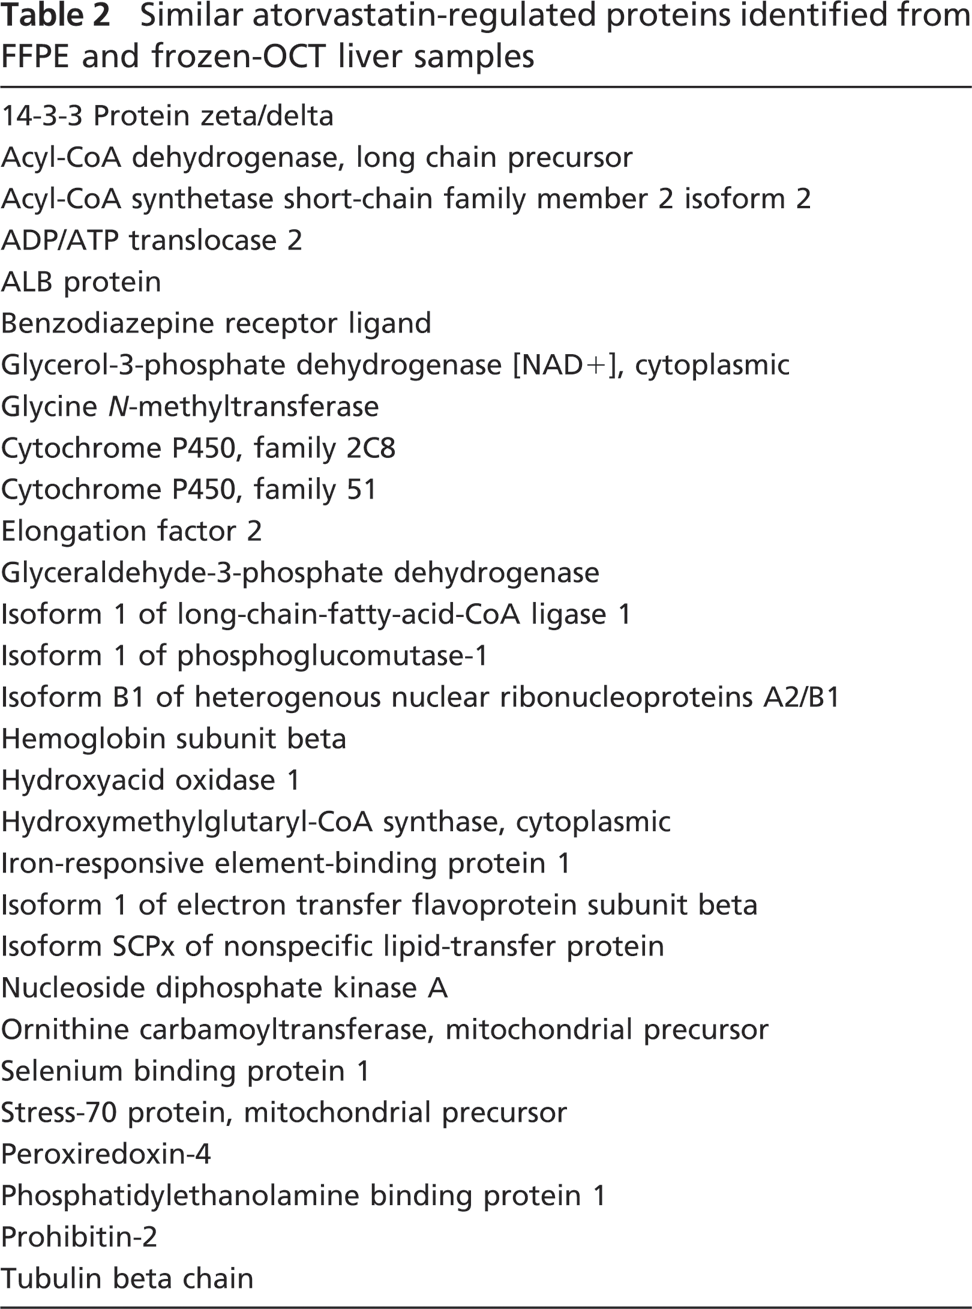
FFPE and OCT-frozen liver samples from rats treated with either vehicle or atorvastatin were assayed to identify and compare the number of treatment-regulated proteins. It is important to determine the effect of formalin fixation and paraffin embedding on both the number of regulated proteins and the biological information provided by those proteins. Spectral counting was done to give a semiquantitative assessment of protein abundance. Regulated proteins that made the list demonstrated a 2-fold or greater difference in peptide count between control and treated samples. The number of treatment-regulated protein changes identified from the OCT-frozen sample was 76 compared with 129 from the FFPE sample (Figure 4). Fifty-six percent of proteins identified were unique to the OCT-frozen samples and 78% unique to the FFPE samples. Twenty-eight shared regulated proteins from FFPE and OCT-frozen liver samples are listed in Table 2. The majority of regulated proteins were anticipated based on the pharmacologic activity of atorvastatin. Atorvastatin is a selective, competitive inhibitor of HMG-CoA reductase, the rate-limiting enzyme that converts 3-hydroxy-3-methylglutaryl-CoA to mevalonate and a precursor of sterols such as cholesterol (Igel et al. 2002).
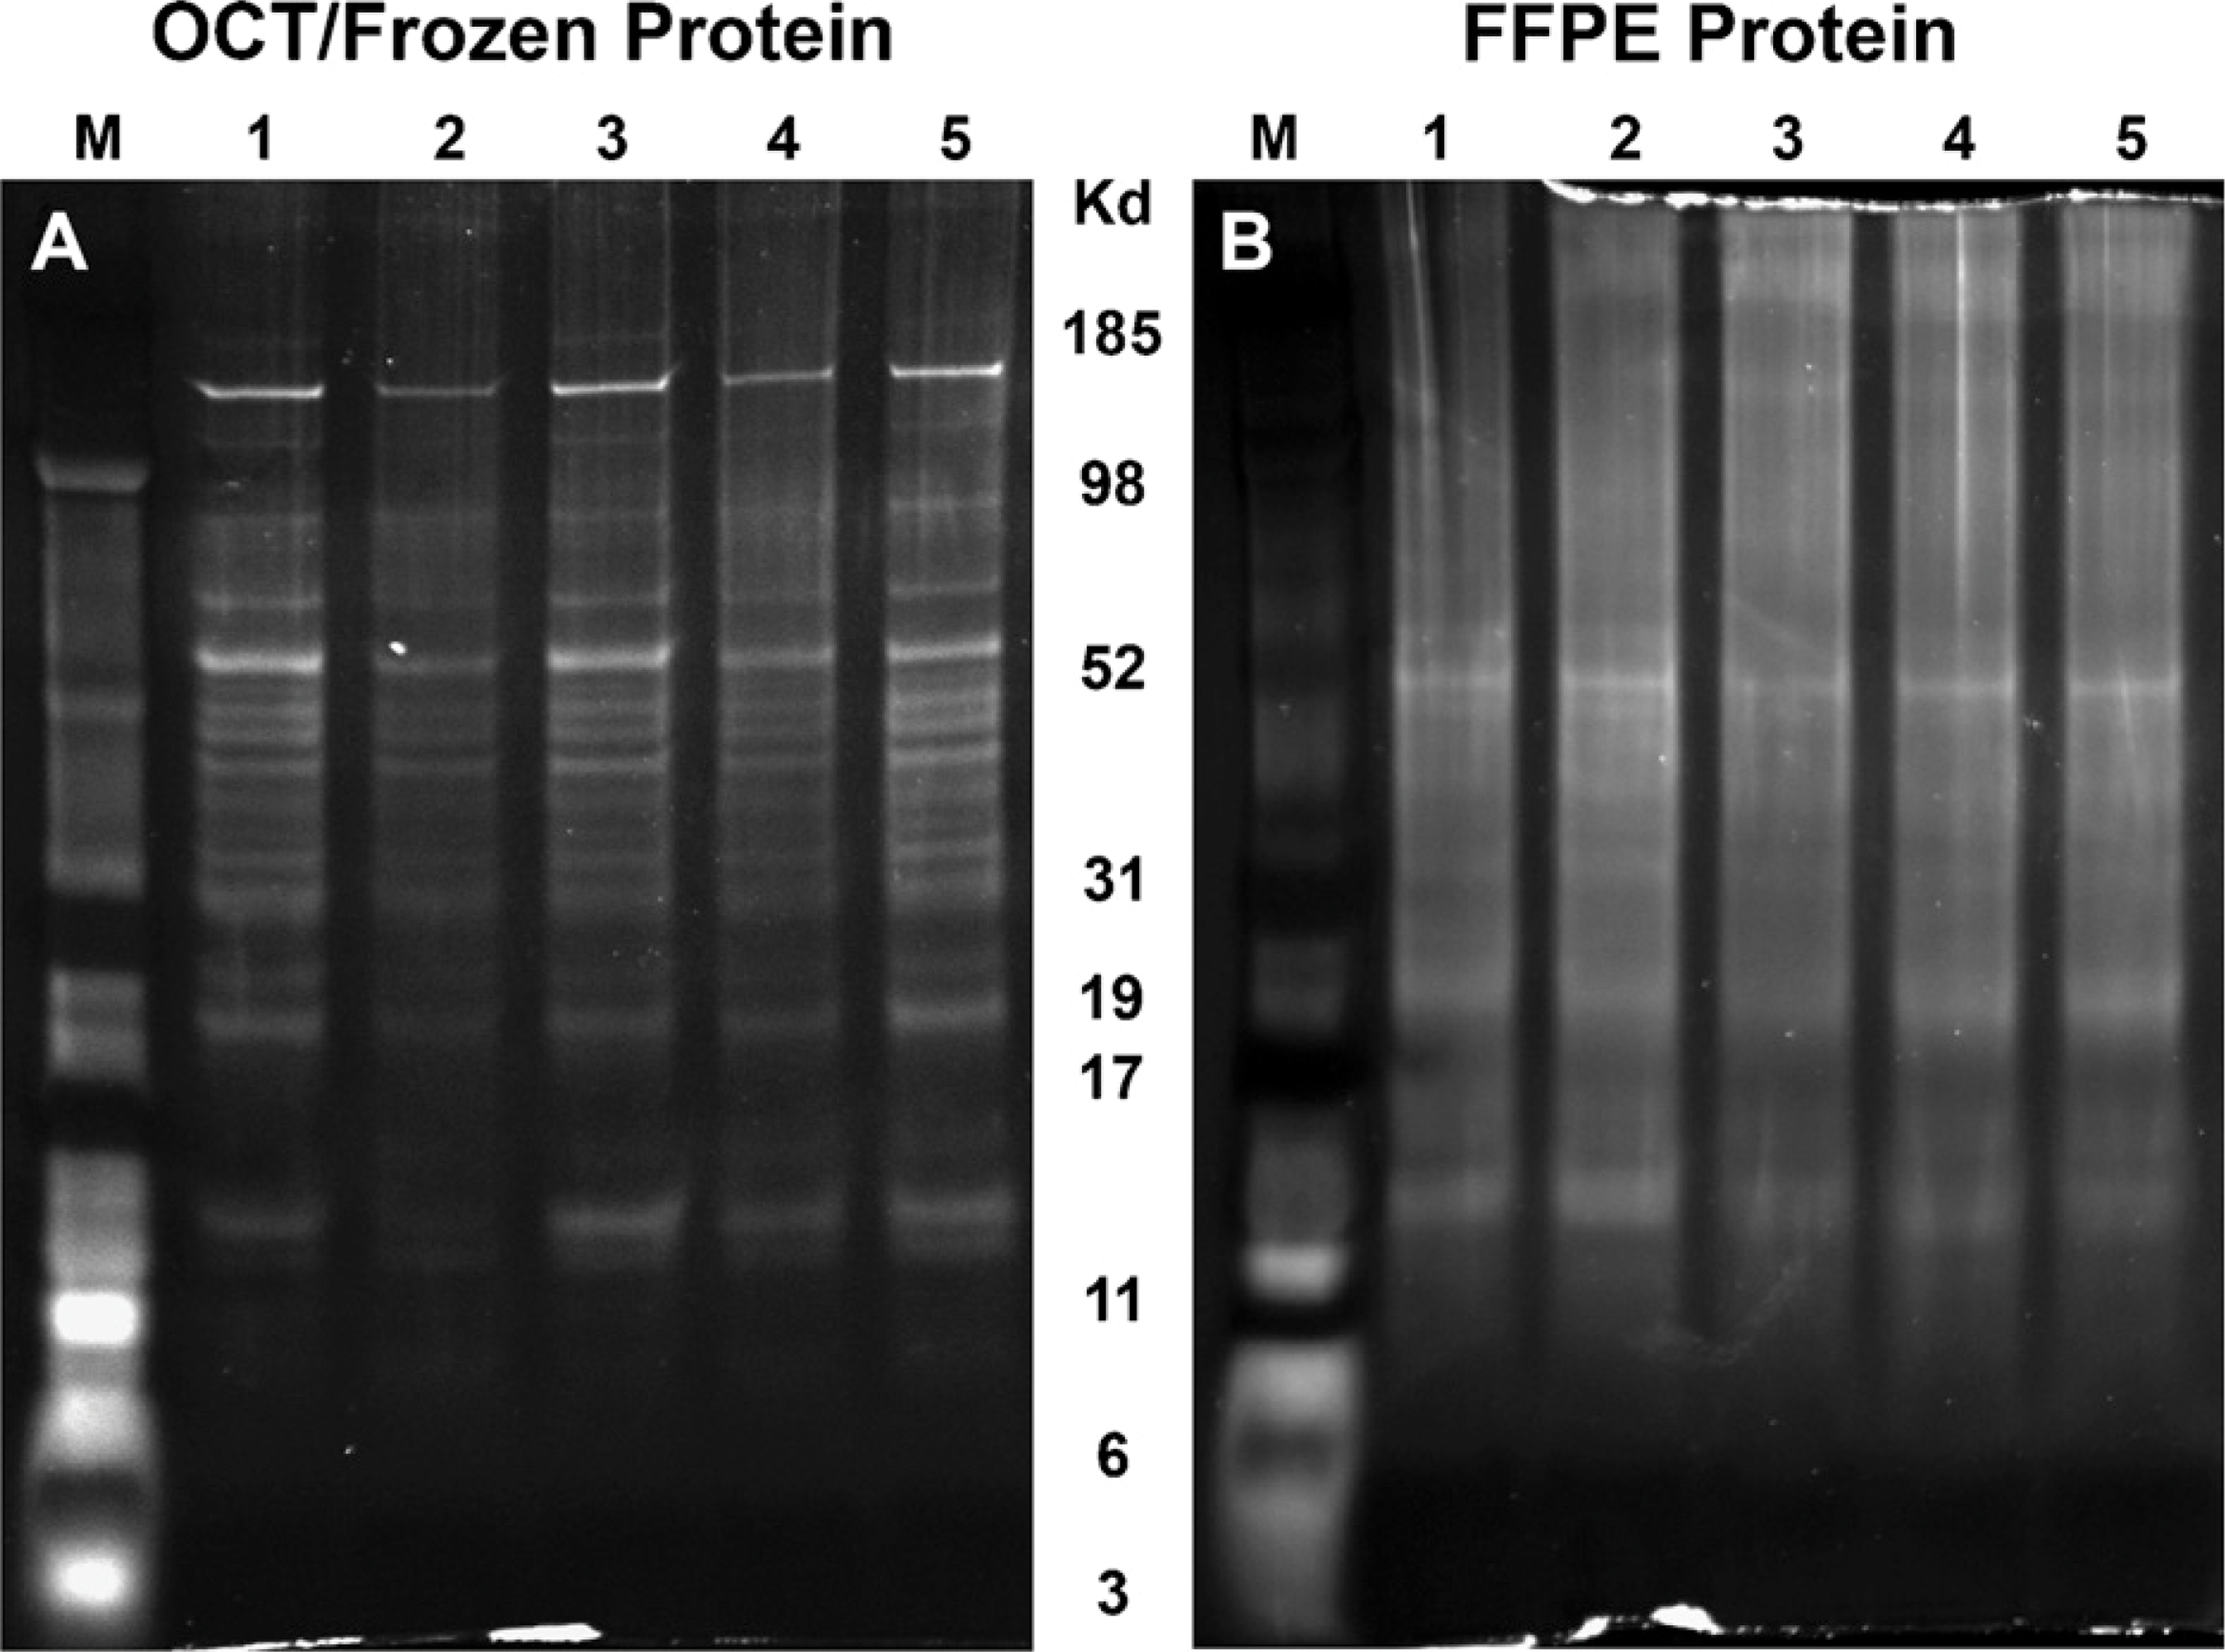
Comparison of SDS-PAGE protein profiles obtained from (
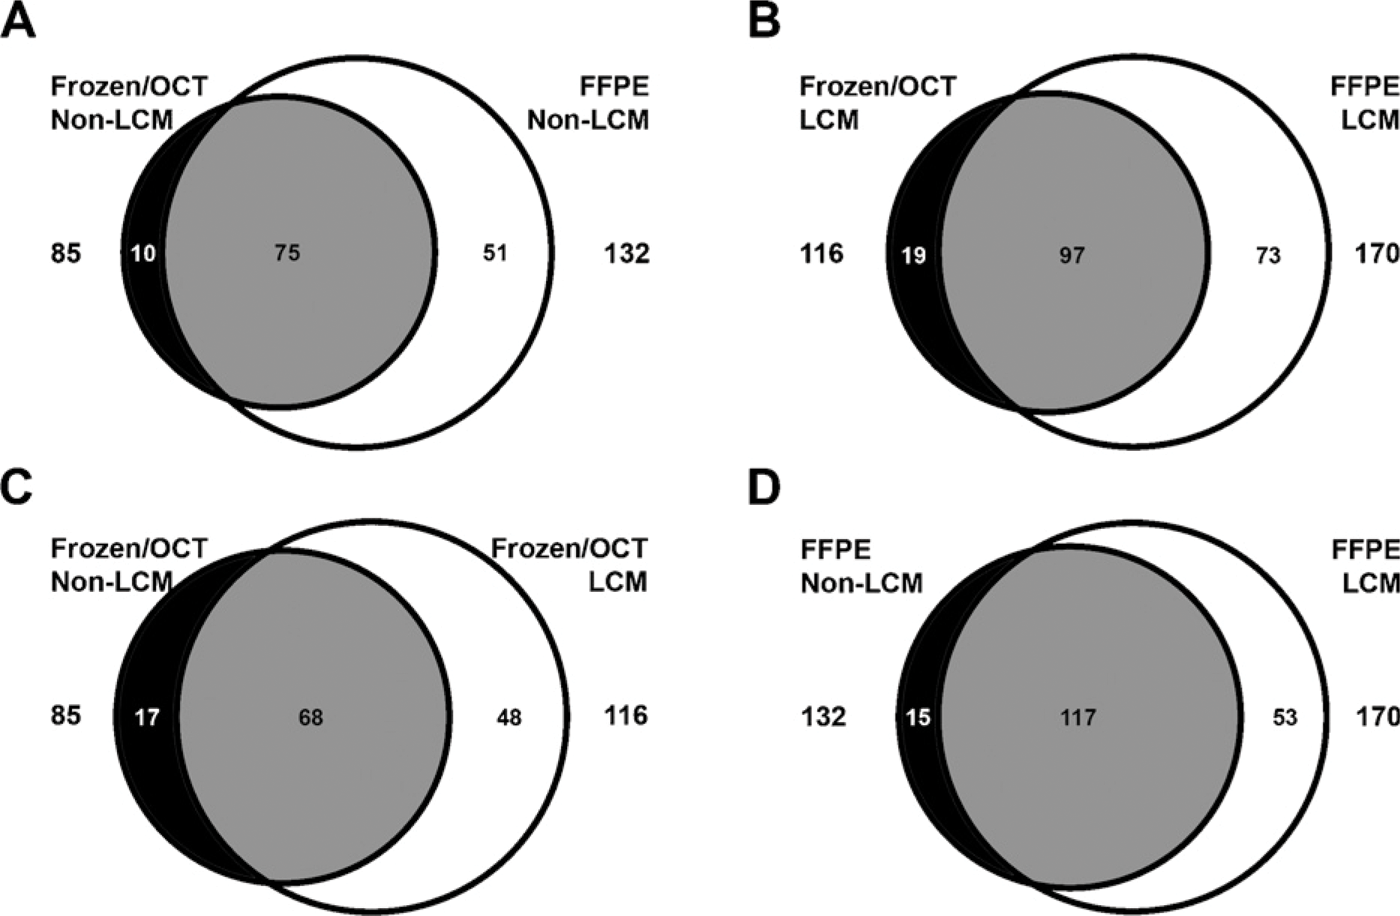
Venn diagram showing overlap in the protein identified from (
Western Blot Confirmation of Atorvastatin-regulated Proteins
Western blot analysis was used to confirm the expression levels of the differential proteins identified by MS. Nine atorvastatin-regulated proteins identified by MS were evaluated by Western blot analysis (Figures 5A-5I) and all were confirmed. An actin antibody was included to ensure equal protein sample loading. FTCD, AHCYL1, FBP1, ACAT, ACSL1, ALDH9A1, GD, and HMGCS were all downregulated, whereas calmodulin was confirmed to be upregulated. There was 100% concurrence of the MS and Western blot data in both intensity and direction of fold change.
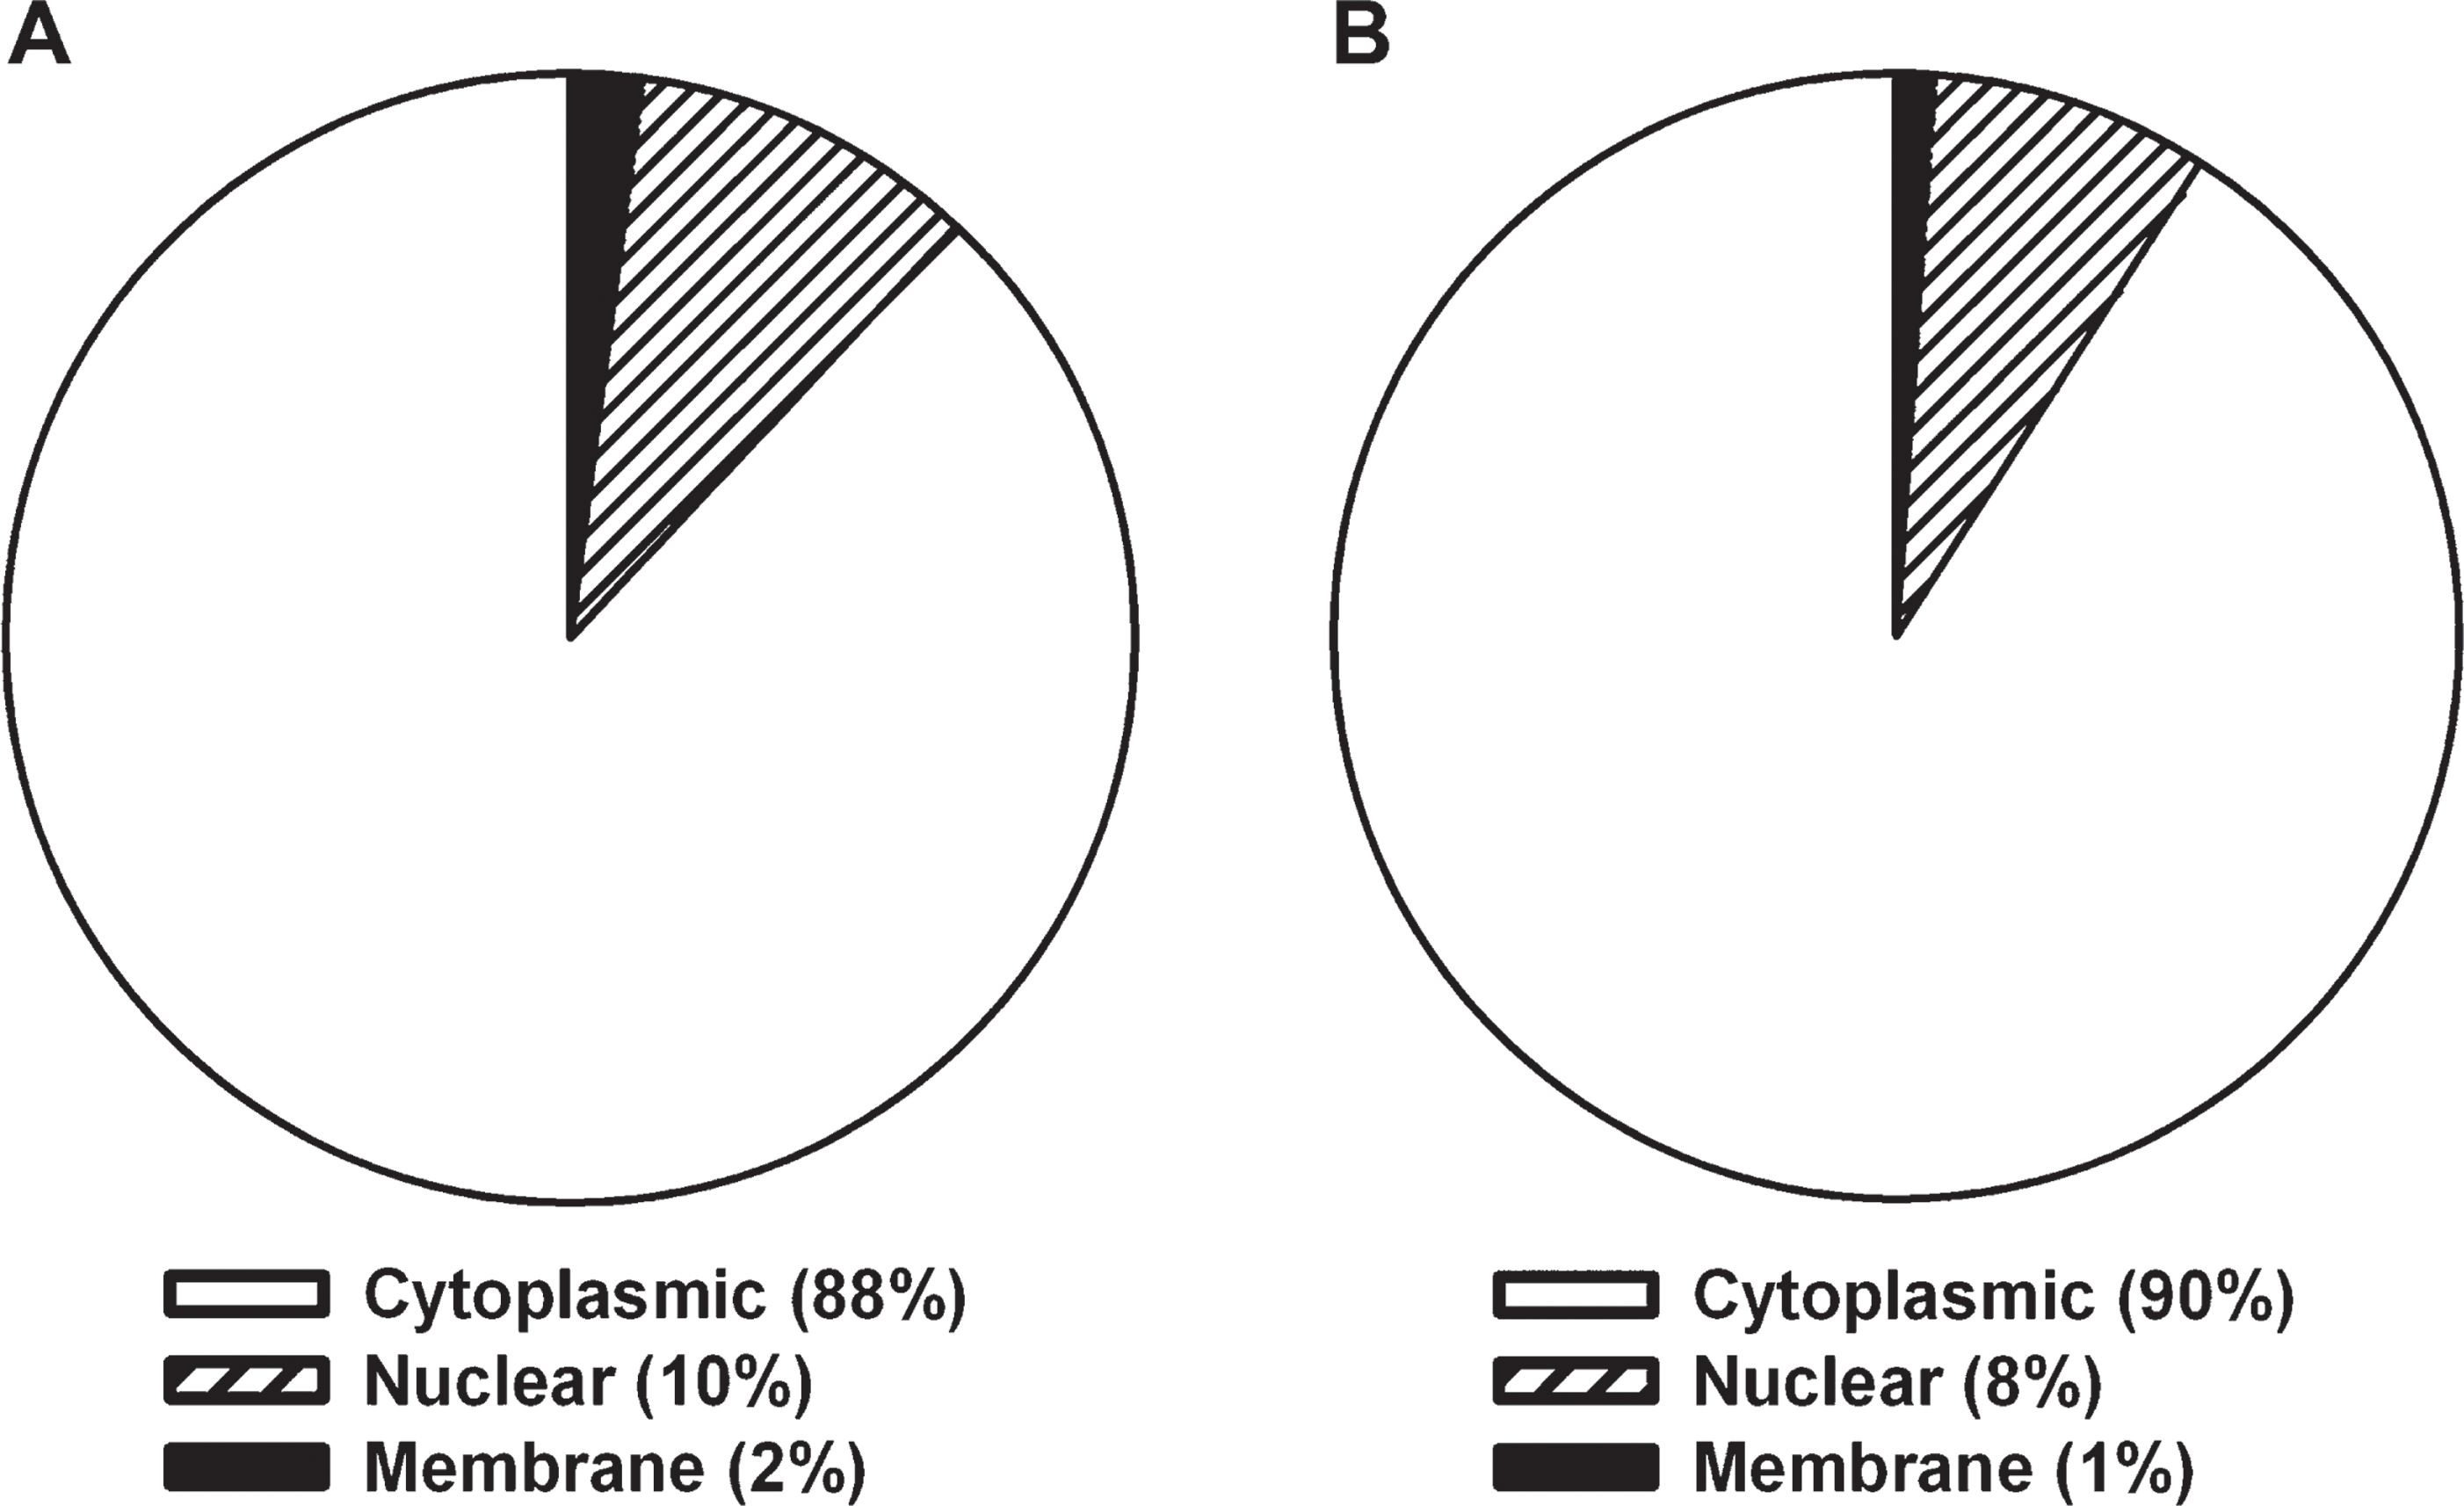
Diagram showing the cellular distribution of identified proteins using Gene Ontology TermFinder. OCT-frozen (
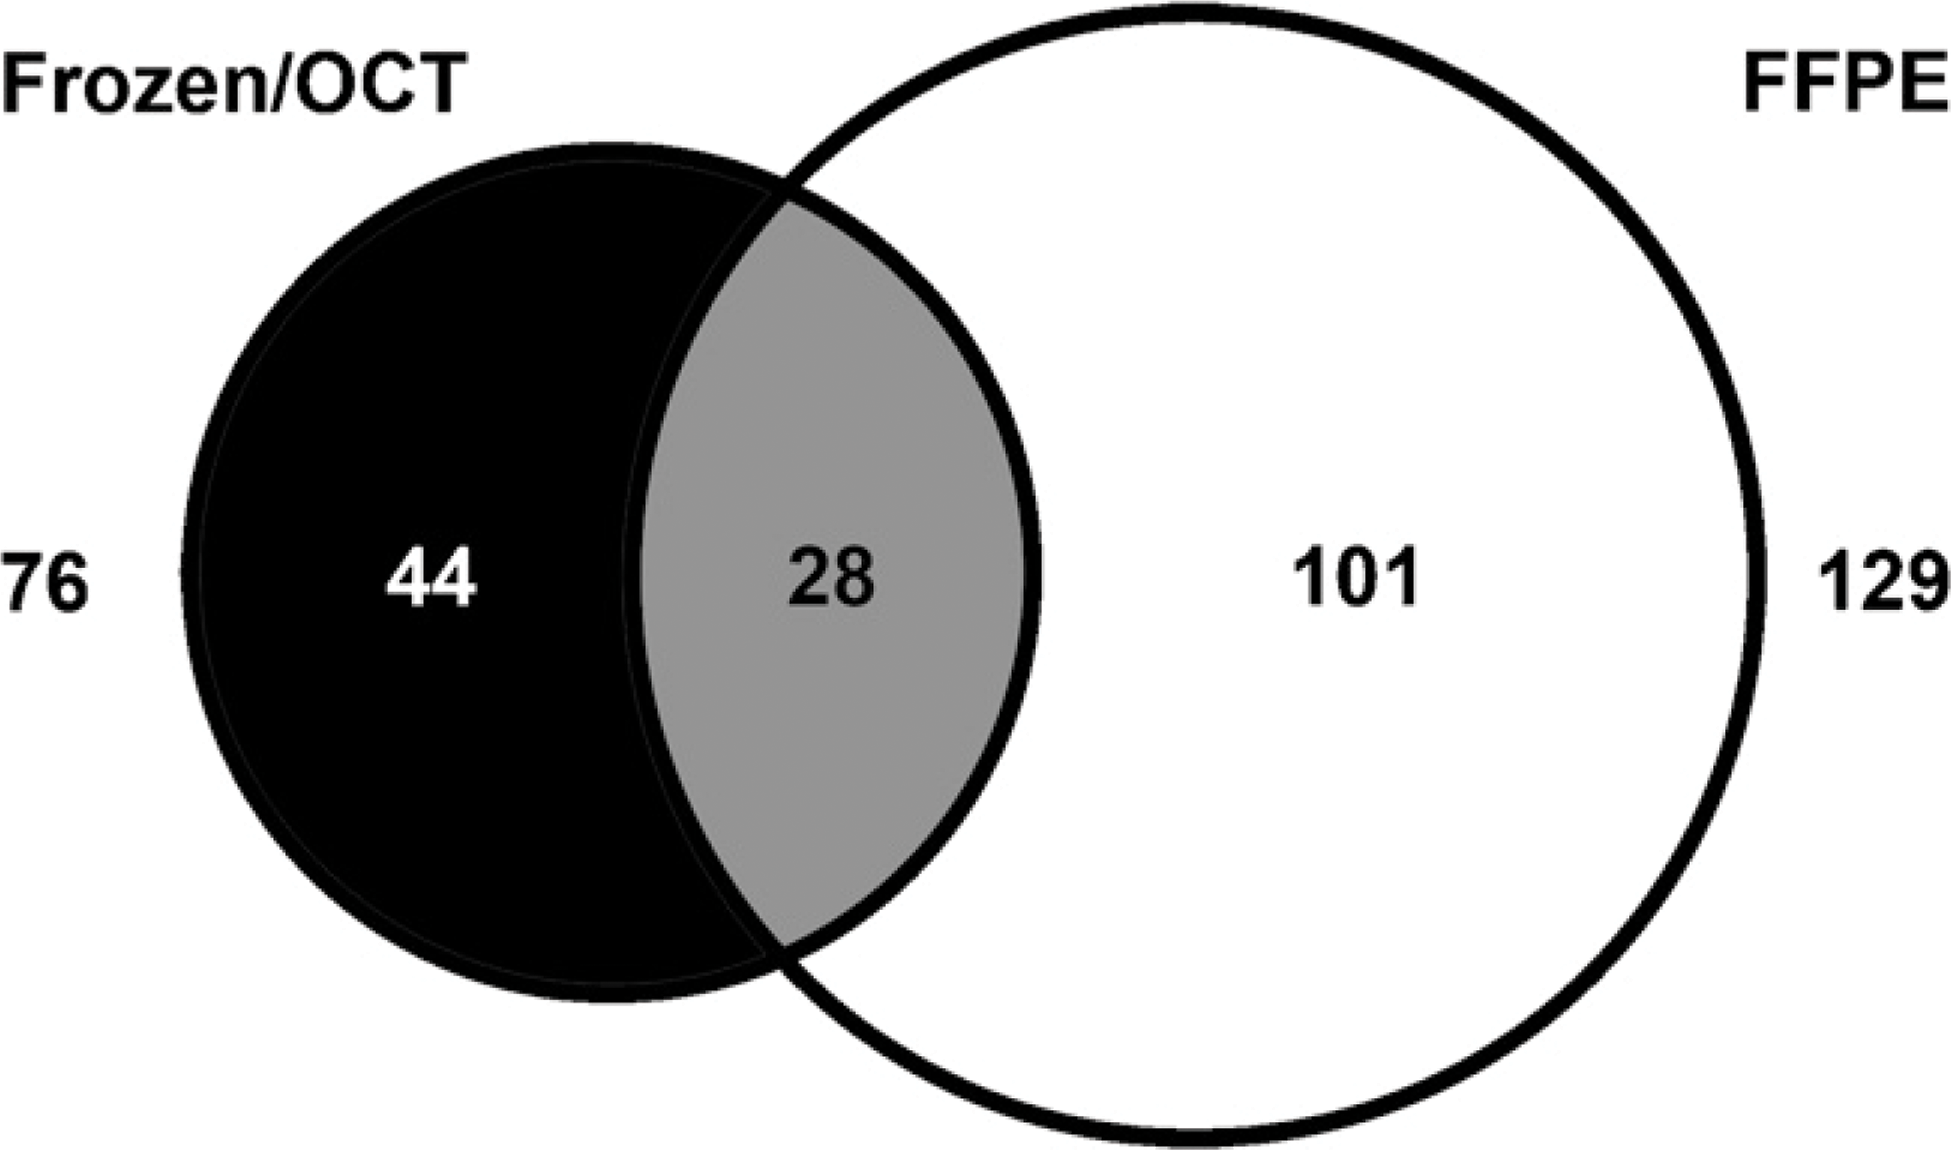
Venn diagram showing overlap in the protein identified from atorvastatin-treated liver samples (OCT-frozen and FFPE).
Similar atorvastatin-regulated proteins identified from FFPE and frozen-OCT liver samples
Pathway Analysis of Atorvastatin-regulated Proteins Identified From FFPE and Frozen/ OCT-embedded Samples
The Global Functional Analysis feature of the Ingenuity Pathway Analysis software was used to visualize changes in key signaling pathways affected by atorvastatin treatment. Outputs of the pathway analysis from frozen and FFPE tissues were compared to determine whether FFPE preparations could identify key atorvastatin-modulated signaling and canonical pathways. The regulated proteins represented in Figure 4 were used for this analysis. A selective representation of major protein signaling pathways and numbers of detected proteins are listed for OCT-frozen and FFPE samples in Figure 6A. Similar signaling pathways were identified with both samples. Both FFPE and OCT-frozen samples identified nucleic acid metabolism, carbohydrate metabolism, lipid metabolism, amino acid metabolism, and small-molecule biochemistry as major signaling pathways regulated by atorvastatin treatment. Regulated proteins were then classified into canonical pathways. Both FFPE and OCT-frozen samples identified fatty acid metabolism, fatty acid elongation in mitochondria, glycolysis/glucogenesis, tryptophan metabolism, and PPARα/RXRα metabolism signaling as major atorvastatin-regulated canonical pathways, showing that biologically relevant protein changes were detected in atorvastatin-treated FFPE liver samples (Figure 6B).
1-D Gel Separation of Protein to Reduce Sample Complexity
The importance of reducing sample complexity was assessed prior to analyzing samples for this study. A common FFPE liver protein lysate sample was subjected to MS analysis with and without 1-D gel electrophoresis separation. A Venn diagram (Figure 7) of this data shows that from the 179 proteins originally identified from the whole-cell lysate, the gel-separated sample identified 95% (171) of these proteins plus an additional 861 proteins. Results show that prefractionation based on molecular mass increased the number of identified proteins by reducing the complexity of the lysate prior to MS and allows a more comprehensive global proteomic view of the samples.
Discussion
With the exception of immunohistochemical localization, FFPE tissues have historically been considered largely intractable to proteomic analysis, owing to problems associated with formalin-induced covalent cross-linking. The lack of applicable methods for assaying FFPE tissue using an MS platform prior to 2004 has limited most proteomic investigations to frozen tissue that is often difficult to obtain and process and expensive to store. Retrospective proteomic investigations have only rarely been performed with the more readily available OCT-embedded frozen tissue stored as archived specimens from regulatory toxicology studies, inasmuch as even these specimens are often limited in number. The ability to extract proteins from OCT and FFPE tissue enables global proteomic analysis of archived tissues with correlating clinical and pathological data and allows access to vast numbers of the more commonly processed FFPE blocks sequestered in tissue banks. This represents a promising retrospective approach for obtaining proteomic data otherwise unavailable.
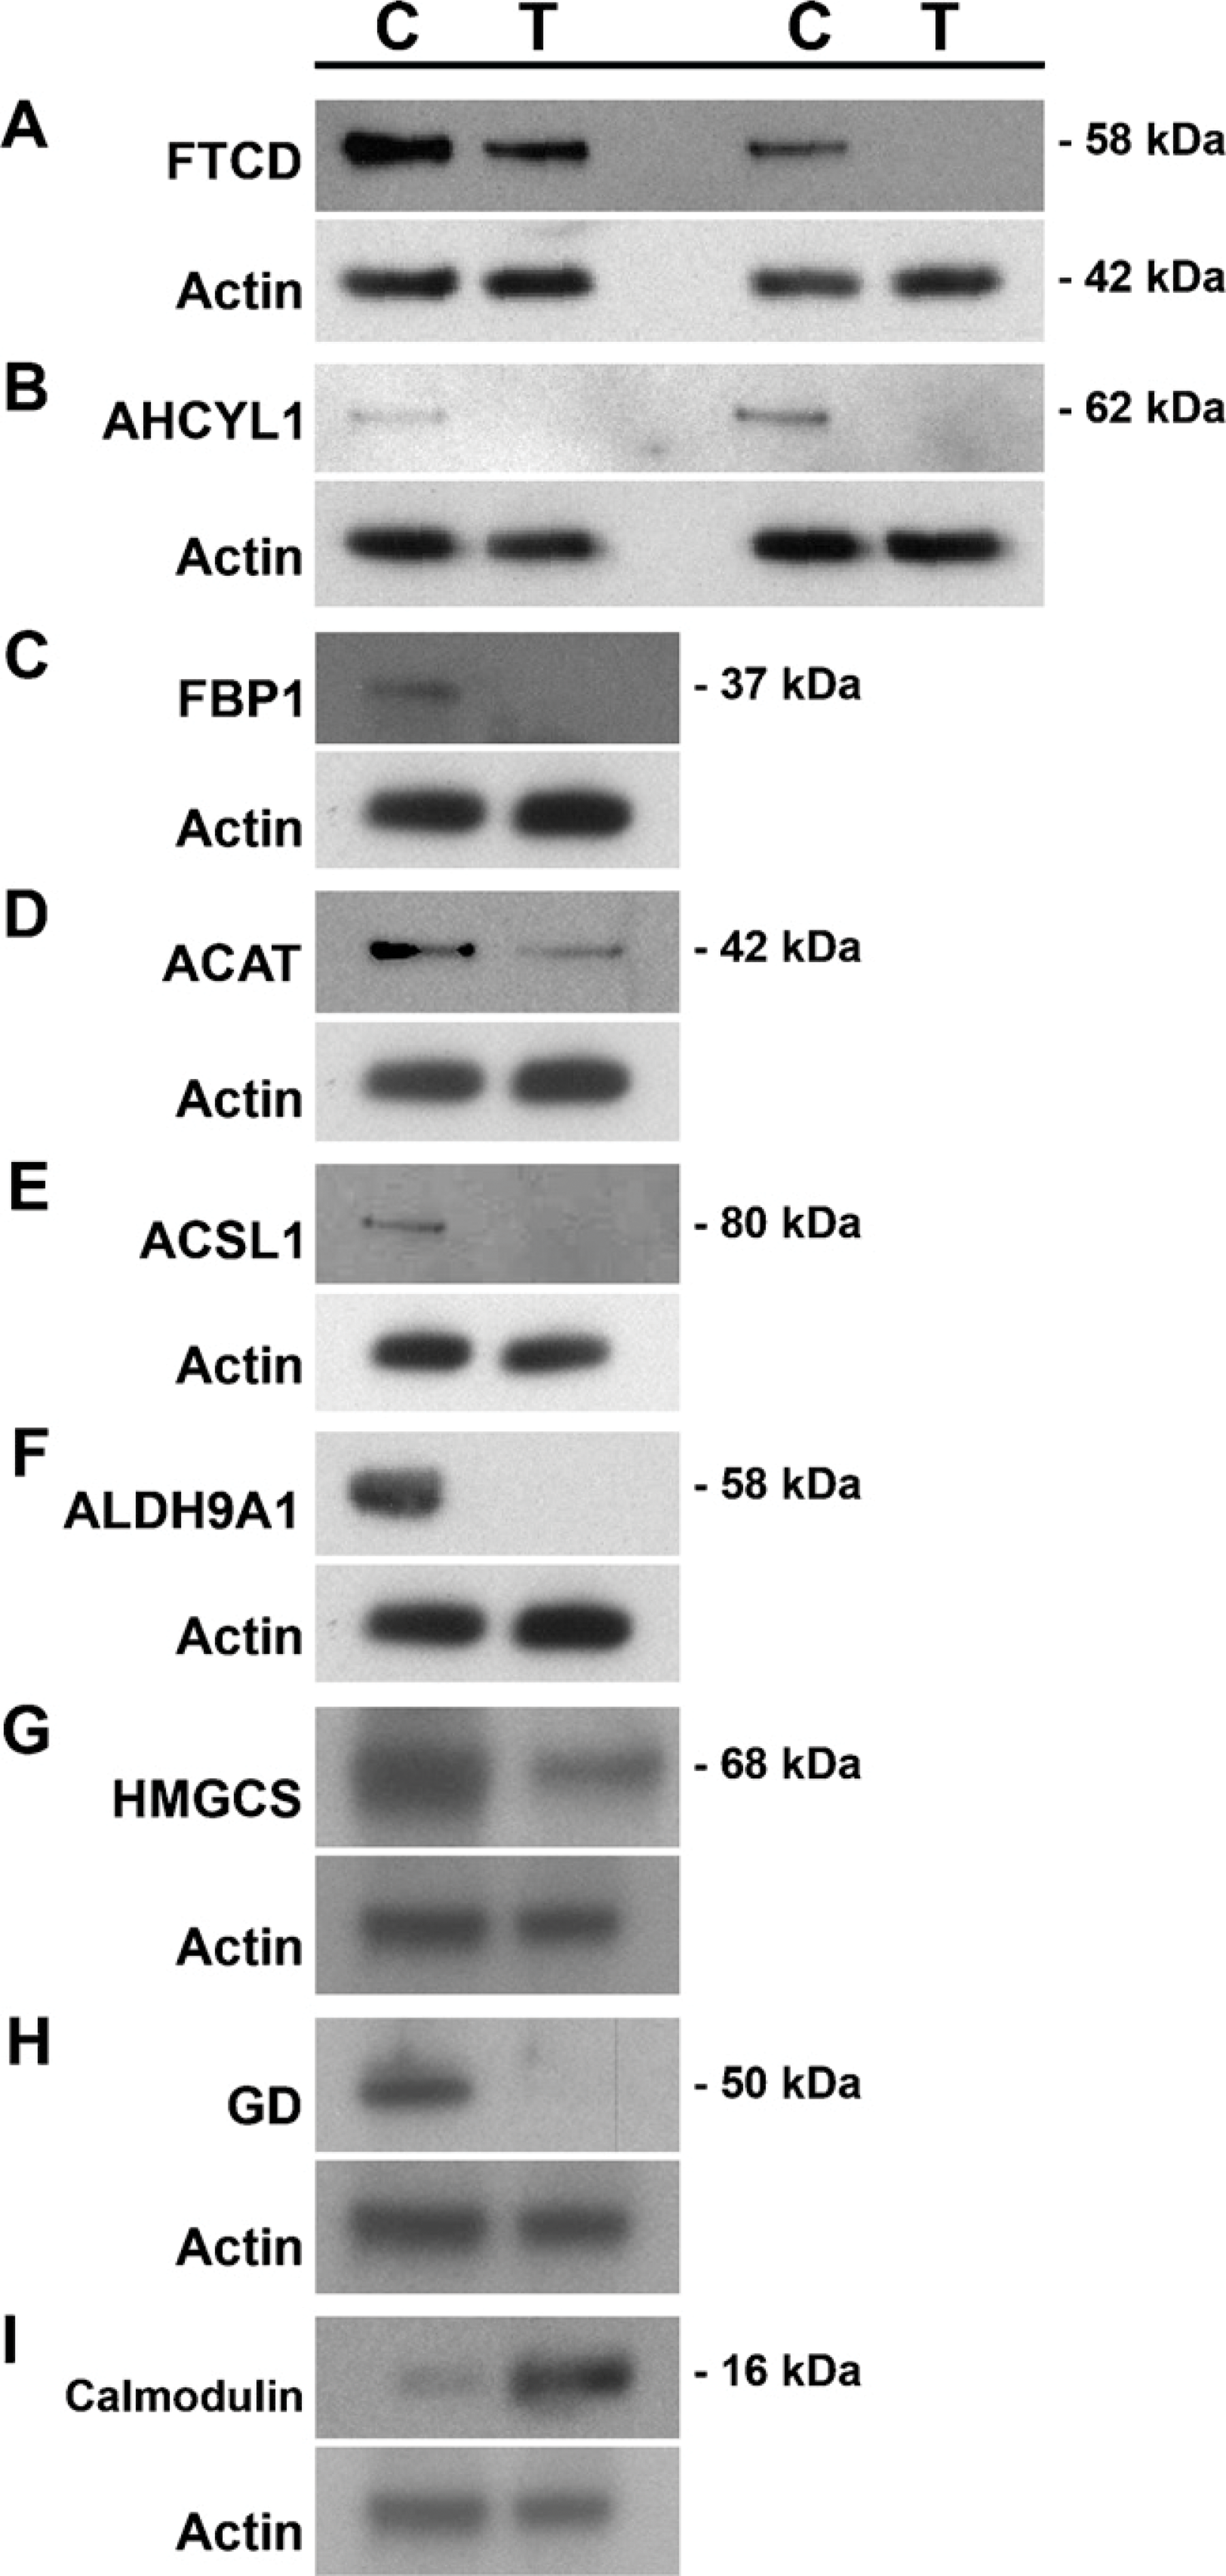
Western blot confirmation of atorvastatin-regulated proteins. Protein was isolated from vehicle-control (C) and atorvastatin-treated (T) FFPE tissue samples, and protein lysates were used for Western blots. Downregulation of (
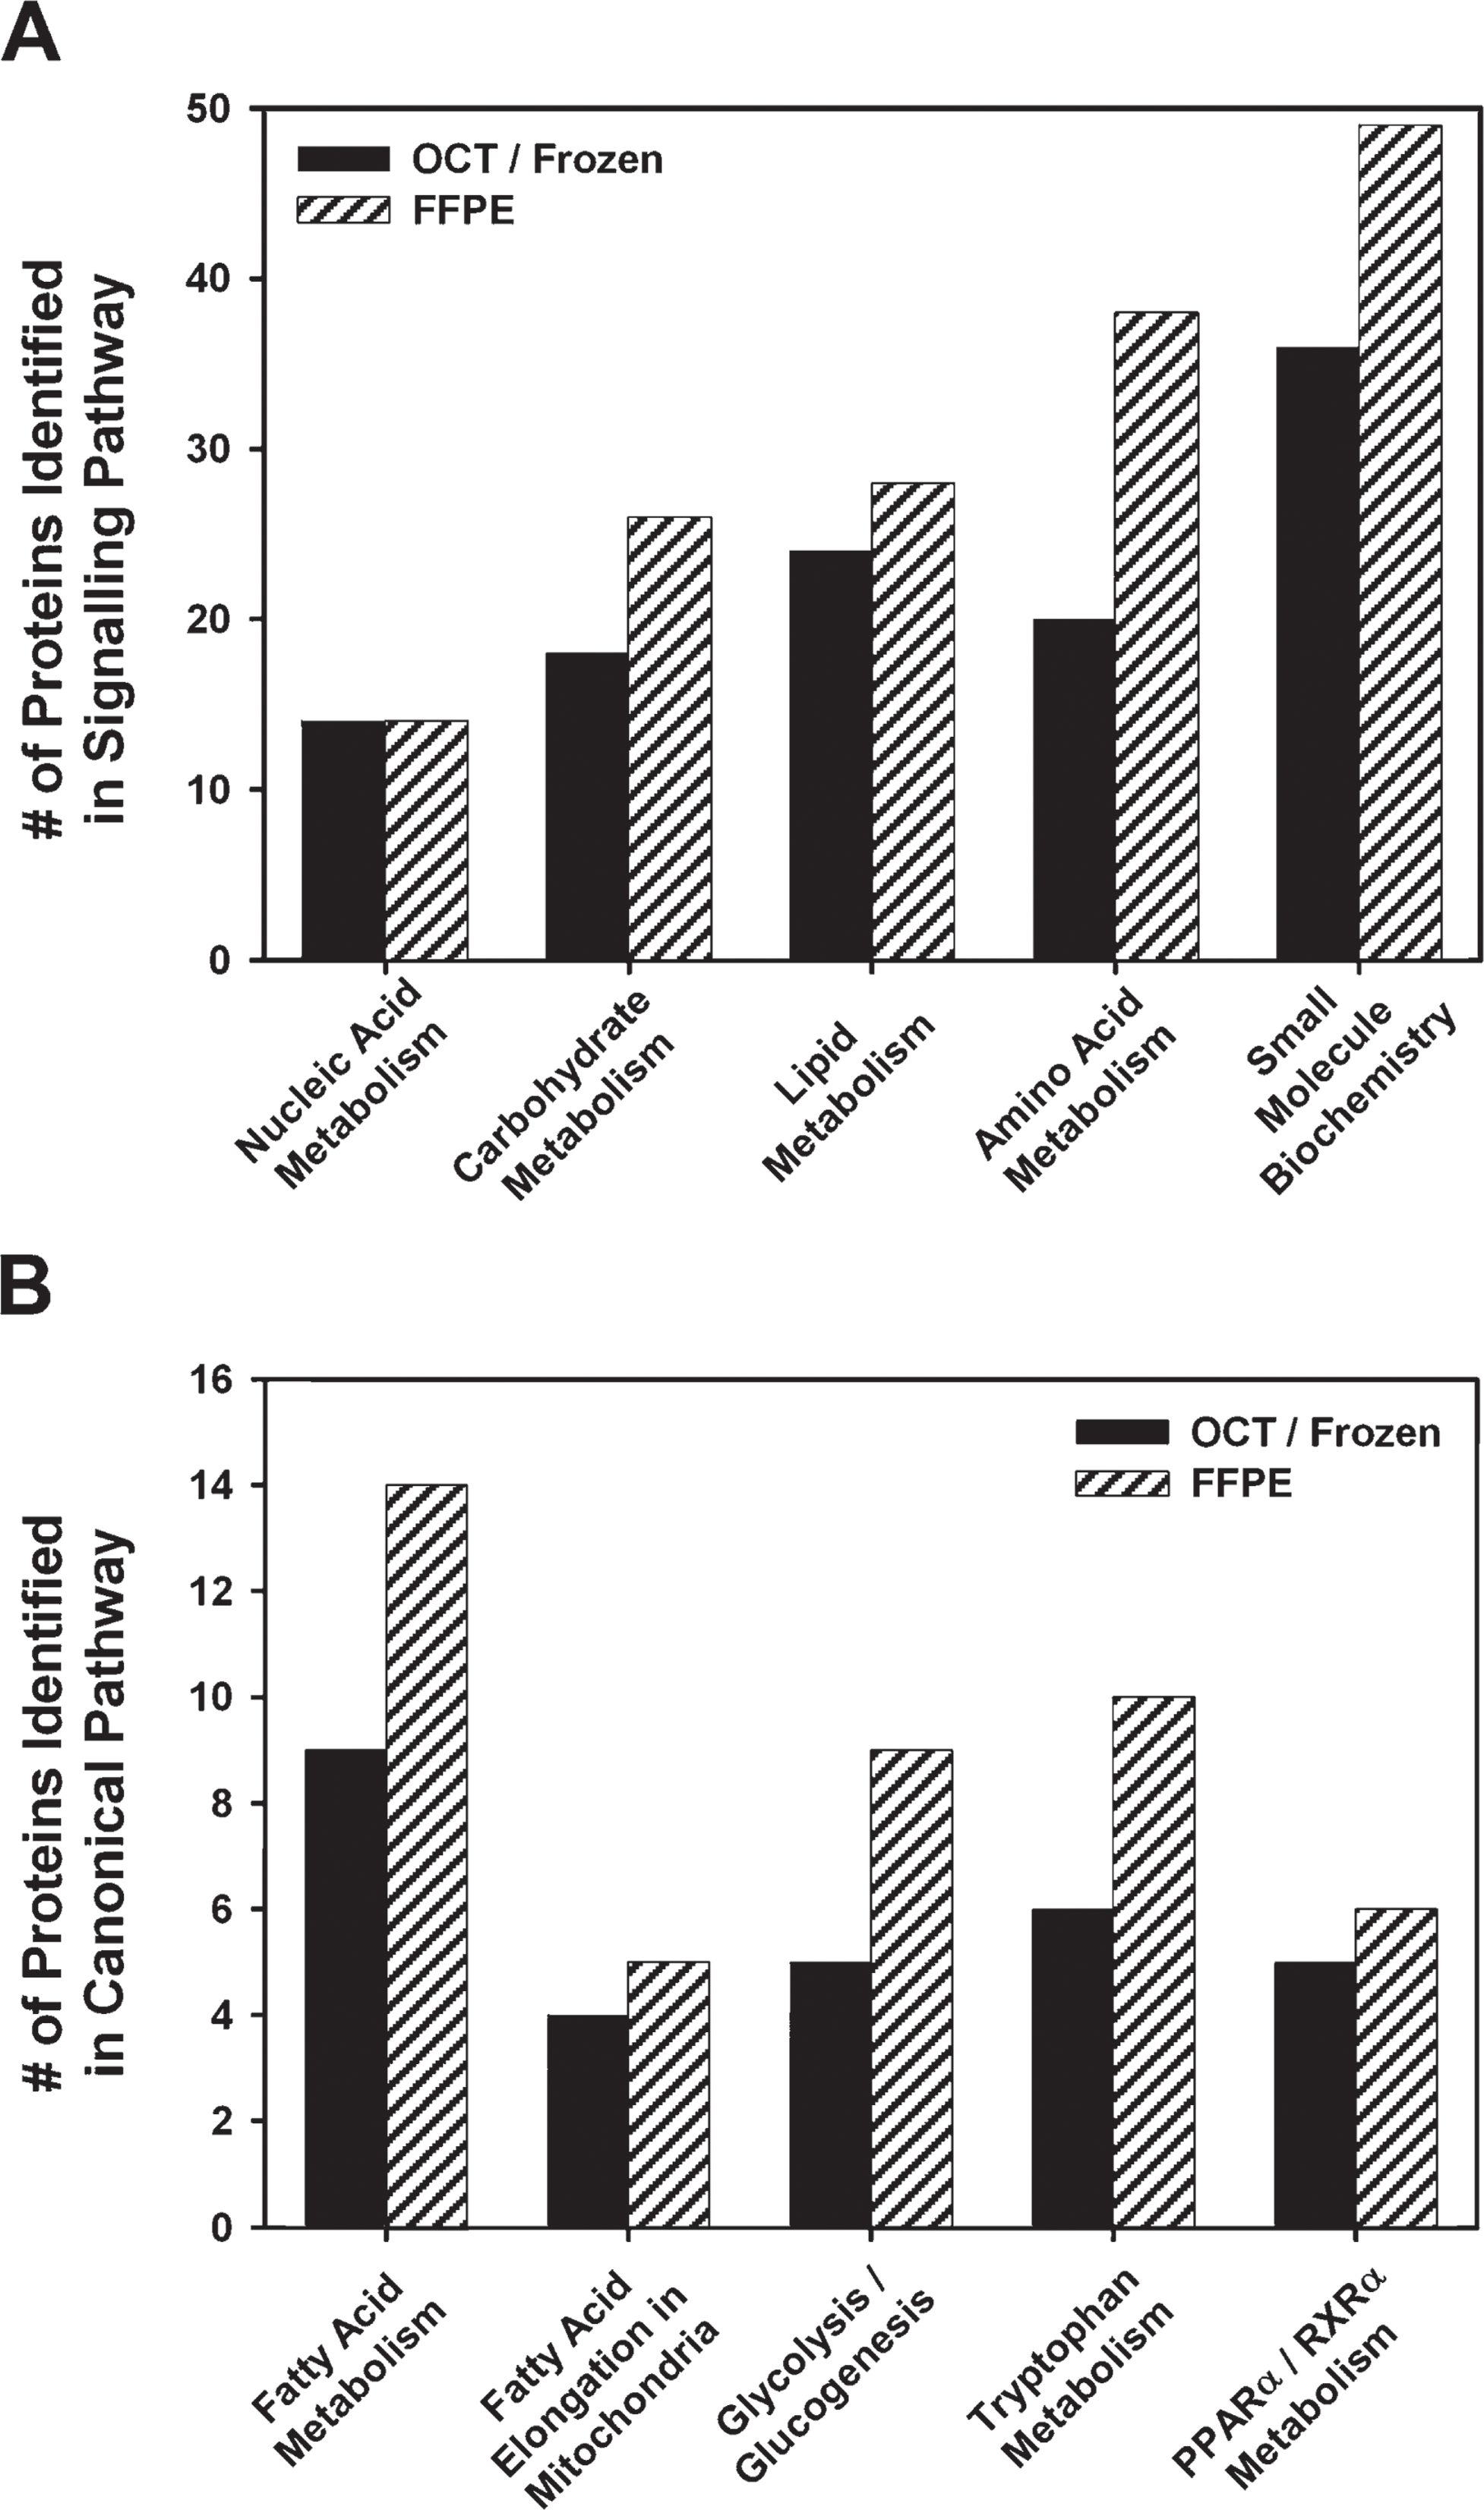
Ingenuity Pathway analysis of proteins identified from OCT-frozen and FFPE samples. (
Although proteins have previously been isolated from FFPE tissue and successfully used for Western blot analysis, antibody arrays, and studying protein-protein interactions, the application of MS techniques with FFPE tissue is still relatively novel (Seigneurin-Berny et al. 2001; Martinet et al. 2004; Vasilescu et al. 2004; Becker et al. 2007). Both Western blot and antibody array platforms require a priori knowledge of which proteins are to be analyzed, and are subject to the availability of antibodies for their detection. MS and other global proteomic profiling methodologies therefore have the advantage of assessing large numbers of proteins simultaneously, which is invaluable in investigations of biomarker identification or mechanistic toxicology.
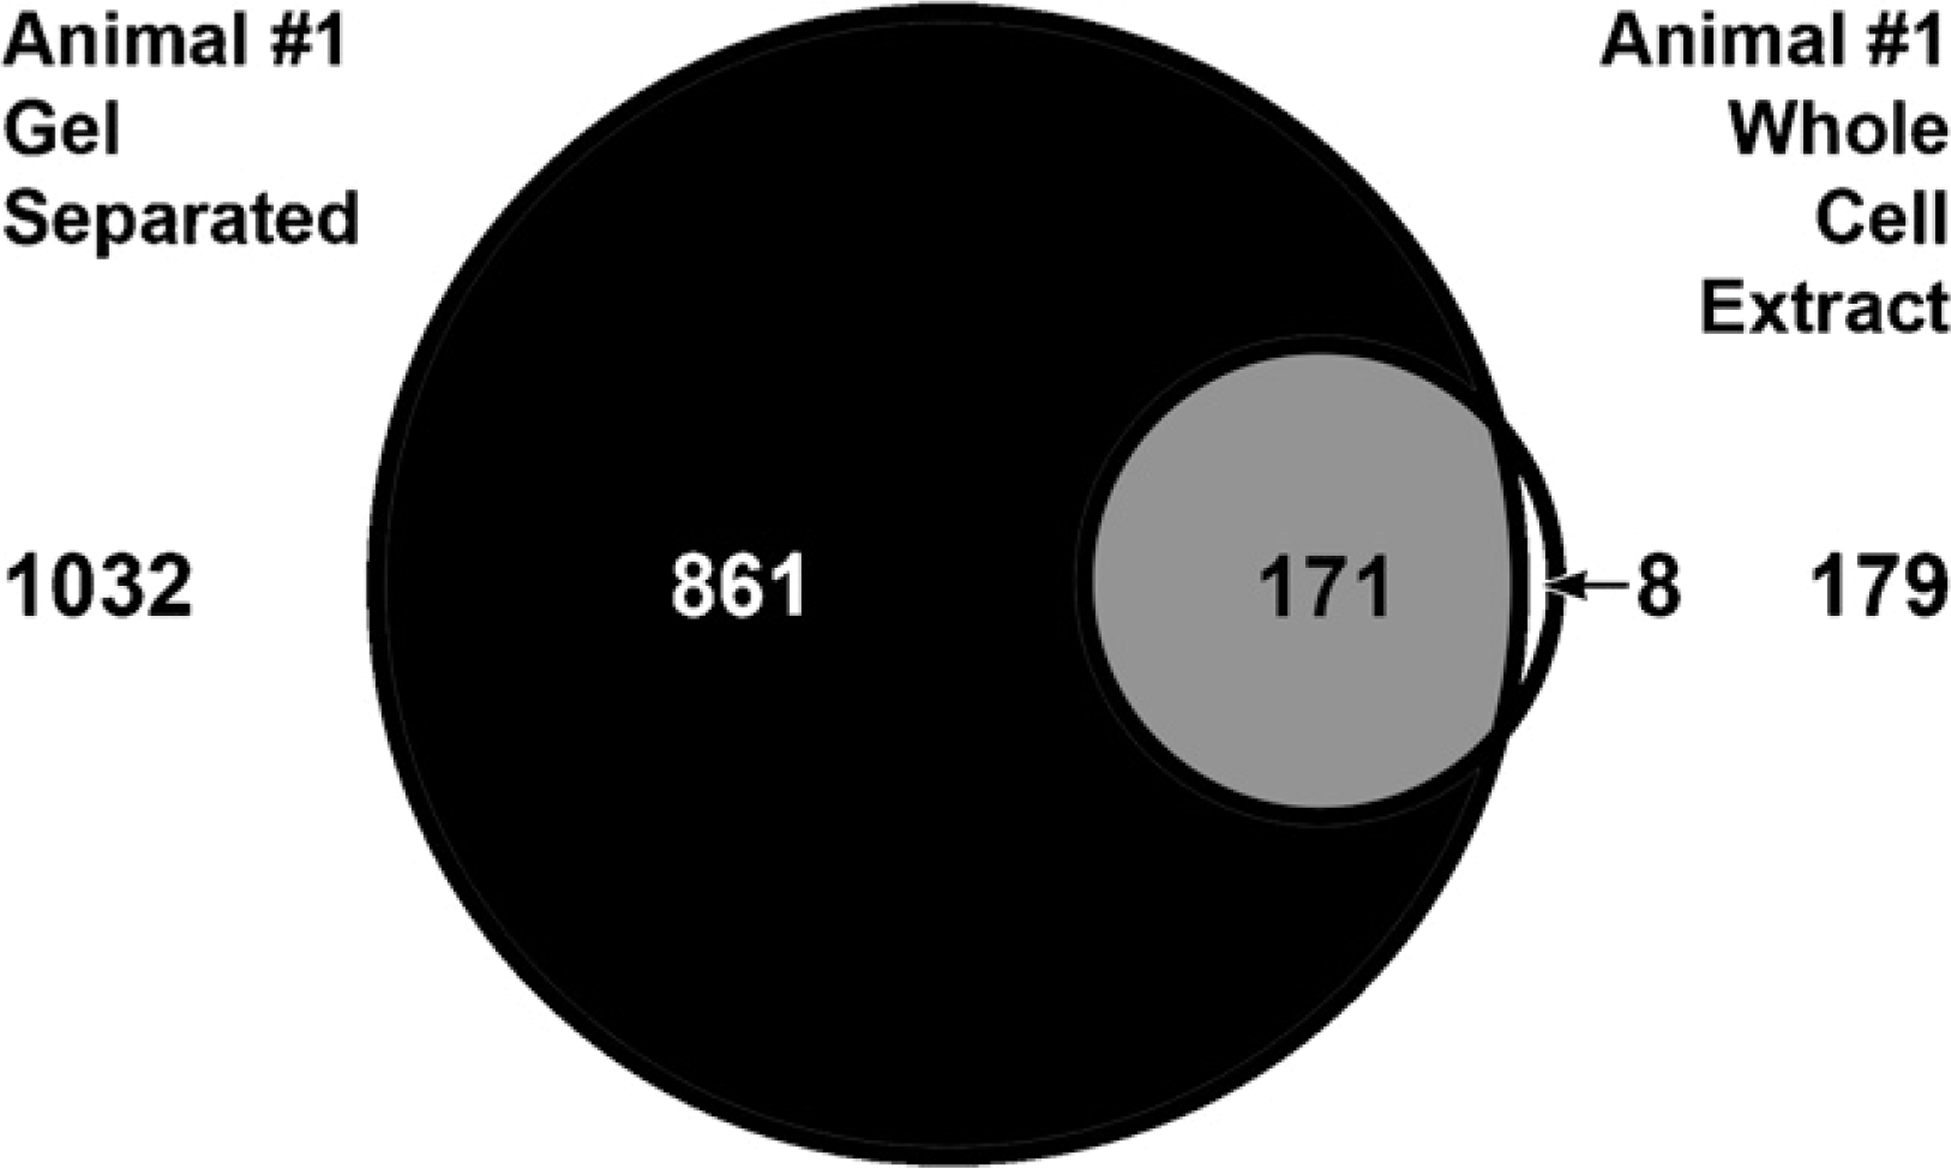
Venn diagram showing overlap in the proteins identified from liver from animal #1. MS was performed on the whole-cell extract and compared with gel separating the samples prior to MS analysis.
Analysis of archival FFPE tissue by high-throughput proteomics has been hampered by the adverse effects of formalin fixation. The efficiency of protein recovery is influenced by fixation protocols, fixation time, and sample age. Isolation methods are the key to successful protein extraction from FFPE tissue (Fowler et al. 2007; Lemaire et al. 2007). Heat-induced antigen retrieval techniques have been successfully utilized as protein extraction methods for FFPE tissue for MS analysis, similar to their use in immunohistochemistry and Western blot analysis (Hood et al. 2005; Shi et al. 2006). A unique proprietary lysis buffer (Liquid Tissue; Expression Pathology, Rockville, MD) has recently been developed for the extraction of proteins from FFPE tissue. When combined with heat, the buffer components assist in reversal of protein cross-links and increase protein yields for proteomic analysis. Several studies have reported successful results using this lysis buffer on FFPE tissue using various MS platforms (Hood et al. 2005; Prieto et al. 2005). In our current study, Liquid Tissue lysis buffer was used for the FFPE sample, and a sucrose-containing lysis buffer was used for the OCT-frozen samples. The sucrose buffer has been used successfully for MS analysis in several previous studies (Seigneurin-Berny et al. 2001; Suneja et al. 2006; Leme et al. 2008). In light of the results of the current study reporting robust proteomic information from both types of specimens, the Liquid Tissue lysis buffer appeared to substantially reduce cross-linking-related procedural problems and artifacts in FFPE tissue. Based on identified protein number, this buffer appeared to be a better extraction method for FFPE tissue than the sucrose buffer was for OCT-frozen tissue. A major hurdle encountered with clinical proteomics has been obtaining sufficient protein quantity to provide in-depth analysis. Protein yields from our studies ranged from 145 μg to 270 μg from two 7-μM tissue sections and 11 μg to 23 μg from the 7-μM LCM tissue sections. These yields are similar to those of Becker et al. (2007), who obtained 150 μg of protein from one 10-μM FFPE tissue section representing a 100-mm2 tissue area. The protein yield for non-LCM FFPE samples was less than that for OCT-frozen samples and is consistent with previous accounts in the literature showing lower yields in FFPE samples compared with matched frozen but not OCT-frozen samples (Belief et al. 2008; Nirmalan et al. 2009). The lower yields are thought to be due to the protein-protein cross-linking caused by formalin, which could lead to a biased proteomic representation from FFPE samples, and to the fact that different isolation buffers were used for the FFPE and OCT-frozen samples. Other studies have demonstrated equivalent yields from FFPE and frozen samples regardless of fixation time (Xu et al. 2008). Results from the current study show >140 μg from a 7-μM FFPE slide scrape. MS analysis required only 500 ng of protein per run, and therefore, the amount of isolated protein was sufficient for multiple MS experiments.
The results demonstrate that successful MS analysis can be performed on protein isolated from FFPE samples. The frozen sample had more-intact protein bands than did the FFPE sample, as assessed by SDS-PAGE, suggesting differences in protein quality or integrity. Assessment of protein quality from FFPE tissue revealed comprehensive molecular mass representation; however, protein banding patterns were less well defined. The latter may be a result of the different lysis buffer components used for FFPE samples, and/or the effect of formalin fixation on the isolated protein. Few FFPE MS articles have characterized the protein quality prior to MS analysis. In contrast to previous studies that reported no intact molecular mass bands while using other isolation buffers for FFPE samples (Ikeda et al. 1998; Guo et al. 2007; Nirmalan et al. 2009), we were able to demonstrate molecular mass bands of 10 kDa to 120 kDa.
Numbers of proteins identified were greater in FFPE and OCT-frozen tissue samples, indicating that fixation and tissue processing did not negatively impact protein quantity, even following LCM. The large number of proteins common to both samples indicates that robust proteomic representation was obtained from FFPE tissue. This is in contrast to a few previous studies reporting reduced number of proteins from FFPE tissue compared with a matched frozen sample. Our results are aligned with a more prevalent view reporting both similar numbers of proteins and quality of mass spectra data compared with frozen tissue (Shi et al. 2006; Bagnato et al. 2007; Guo et al. 2007). Moreover, in our current study, the number of proteins identified from FFPE tissue (both LCM and non-LCM) was slightly increased compared with OCT-frozen samples. Eighty-eight percent of the proteins identified in the OCT-frozen sample were identified in the FFPE sample, with 11% unique to OCT and 43% unique to FFPE (Figure 2A). These results are similar to those seen by Crockett et al. (2005), who showed a 50% overlap of proteins between FFPE and a matched frozen sample. A 30% greater yield of identified proteins/peptides from FFPE tissue compared with matched frozen tissue has been previously reported (Palmer-Toy et al. 2005). Possible explanations given by Palmer-Toy et al. (2005) for the relative increase in proteins from FFPE include: (1) enhanced extraction of selected proteins resulting from fixation, embedding, or depar-affinization; (2) degradation of unfixed tissue during the heat step with SDS; and/or (3) interference with LC-MS analysis by OCT tissue-embedding medium. It should be emphasized that OCT processing, although relatively comparable to fresh frozen sampling, may still introduce some variables that alter protein yields, and most previous studies only performed MS on fresh frozen samples. These explanations could contribute to why we are seeing more proteins being identified from the FFPE samples as compared with OCT-frozen samples. More importantly, in our current study, different isolation buffers were used for the OCT-frozen and FFPE samples. Although the cellular component representation is similar with both lysis buffers (Figure 3), the number of proteins in control FFPE samples is greater compared with matched OCT-frozen samples. In addition, the number of atorvastatin-regulated proteins is greater in the FFPE sample compared with the OCT-frozen sample.
We chose to compare FFPE liver sample performance compared with frozen/OCT-embedded liver samples instead of fresh frozen liver because archives of FFPE and OCT-embedded samples exist within safety assessment departments for most recent toxicology studies. FFPE samples from decades of toxicologic studies representing investigations into hundreds or thousands of compounds are available for retrospective analysis. OCT embedding is the standard for processing frozen tissue for analysis, and samples processed in this manner are likewise available, albeit in much smaller numbers. Results presented here are representative of OCT-frozen and FFPE blocks that were stored for approximately 4 years, and in the case of the latter, formalin fixed for 48 hr. There are numerous variables thought to confound FFPE MS data analysis, such as fixation time, block storage time, and variable cross-link reversal. All of these would need to be addressed when attempting to perform MS analysis on archived FFPE blocks when some of these specifics are not known. Recent data indicate that there are no significant differences in protein quality and quantity in FFPE tissue fixed from 6 hr to 14 days (Xu et al. 2008). It has also been shown that using tissue blocks stored for as many as 28 years, high confidence and comparative proteome analysis is achieved and that low-abundance proteins may be more susceptible to long-term storage, inasmuch as these proteins are more difficult to retrieve and extract as the tissue block ages in paraffin (Balgley et al. 2009).
There does not appear to be selective sampling of proteins using this methodology, because similar types of proteins were found using either fixed or frozen protocols. Equivalent subcellular compartmental representation was noted with both FFPE and OCT-frozen samples, with the majority of proteins identified originating from the cytoplasm. Ingenuity Pathway analysis of the proteins identified from FFPE and frozen tissue further demonstrated similar protein functions. Compared with OCT-frozen, the number of proteins identified for each network and canonical pathway was equivalent or greater in the FFPE lysate. This again contrasts with early reports in which FFPE samples had fewer proteins represented in each molecular function than did frozen samples (Crockett et al. 2005). More-recent reports agree with our findings. In a study using matched frozen and FFPE mouse liver samples, the percentage of proteins identified from both samples was equivalent (Hood et al. 2005).
Atorvastatin was used in this study as an example of a compound that alters the rodent proteome after treatment. It was chosen for several reasons, including (1) it is known to quantitatively affect specific enzymes and specific regulated metabolic pathways in the liver; (2) the mechanism of these changes is well characterized; and (3) although it has a well-established toxicologic effect on the liver in rats, it is generally well tolerated at toxicologic doses. Biologically relevant protein changes were detected in atorvastatin-treated FFPE liver samples, representing signaling/canonical pathways similar to those seen in OCT-frozen samples. Regulated pathways that included carbohydrate metabolism, amino acid metabolism, and lipid metabolism were similar to those reported for rat livers treated with two statins (fluvastatin and lovastatin) (Steiner et al. 2000,2001). Selected atorvastin-regulated proteins were further confirmed by Western blot analysis with 100% concordance. The concordance of data obtained between both methods underscores the fidelity of MS analysis.
In future studies, the complexity of the protein cell lysate could potentially be reduced prior to MS analysis by fractionation to effectively enhance the dynamic range and detection sensitivity. Fractionation may include chromatographic or molecular mass separation and/or removal of high-abundance proteins such as albumin and immunoglobulin that may mask the identification of less-abundant proteins (Liu et al. 2006). Additionally, differential ultracentrifugation (separating nuclei, membrane, and cytosolic fractions) prior to MS analysis could be employed to provide cell compartment-specific information from tissues.
This study describes methods for the successful extraction and MS analysis of peptides/proteins from FFPE tissue formalin fixed for 48 hr and stored in blocks for 4 years. Our results demonstrate that the quantity and quality of proteins identified by MS from FFPE tissue samples are not significantly impacted by formalin fixation and paraffin embedding when compared with matched frozen/OCT-embedded liver from either vehicle control or atorvastatin-treated rats. The number of identified proteins shared between OCT-frozen and FFPE samples confirms robust proteomic representation. The problem of formalin fixation-associated cross-linking of proteins can be overcome by these methods, making FFPE tissues amenable to global proteomic analysis. Because formalin fixation with paraffin embedding is the standard procedure for tissue preparation in pathology laboratories, the ability to obtain global proteomic profiles from these samples could facilitate retrospective biomedical investigations aimed at the discovery of molecular signatures associated with disease, classification of clinical phenotypes, or proteomic biomarker design.
Footnotes
Acknowledgements
This work was supported by GlaxoSmithKline.
The authors thank Janice Kane for technical assistance in preparing the OCT-frozen and FFPE tissue sections, Roberta Thomas for her technical assistance and reviewing the manuscript, and Beverly Maleeff for generating the figures.