
Abstract
Objective:
This study aimed to investigate the relationship between fibroblast growth factor 19 (FGF19) and the prognosis and immune infiltration of colorectal cancer (CRC) and identify the related genes and pathways influencing the onset and progression of CRC.
Introduction:
The potential of FGF19 to guide the prognosis of CRC and inform immunotherapeutic strategies warrants further investigation.
Methods:
We performed Quantitative Real-Time PCR to assess the expression of FGF19 and conducted a bioinformatics analysis to evaluate the impact of FGF19 expression on the clinical prognosis of CRC. We also analyzed the association between FGF19 expression and immune cell infiltration in CRC, and explored the related genes and pathways through which FGF19 influences CRC development.
Results:
CRC patients with higher FGF19 expression exhibited a poorer prognosis. In terms of the Receiver Operating Characteristic (ROC), FGF19 achieved an area under the curve (AUC) of 0.904. FGF19 expression correlated with the N stage, M stage, and pathological stage in patients with CRC. Functional enrichment analysis revealed significant enrichment of FGF19 in pathways associated with tumor development. ssGSEA and Spearman correlation analysis demonstrated that FGF19 expression was linked to tumor immune cells. We discovered that FGF19 is closely related to neutrophil extracellular traps (NETs), which play a significant role in the immune microenvironment.
Conclusion:
FGF19 is a key gene associated with immunity and prognosis in CRC patients. Our findings suggest that FGF19 may influence CRC progression by promoting NETs expression, which leads to suppression of immune cells.
Introduction
Colorectal cancer (CRC) is a common malignant tumor of the digestive tract, with rising morbidity and mortality rates. This trend poses a significant threat to human health and creates substantial economic burdens. According to global cancer data estimates from 2020, there were approximately 1.932 million new cases of CRC, accounting for about 10.0% of all new malignant tumors, and 935,000 deaths, representing 9.4% of all malignant tumor deaths. These figures place CRC third in incidence and second in mortality among all malignant tumors. 1 Recent data indicates a gradual increase in CRC incidence in China, with 2020 statistics ranking it second and fourth in terms of incidence and mortality, respectively, among all malignant tumors. 2 Globally, the incidence of CRC is increasing annually, affecting increasingly younger populations due to environmental factors. Research shows the immune system is crucial in the development of CRC. Immunotherapy is more effective and less harmful than other treatments for advanced CRC, with fewer side effects. 3
The FGF19 gene, located on chromosome 11 in the q13 region, encodes a protein of 216 amino acids with a signal peptide at the N-terminus, enabling both autocrine and paracrine functions. It is primarily expressed in the ileum and is also found in cartilage, skin, retina, kidney, and gallbladder. 4 Fibroblast growth factor receptors, which are tyrosine kinase receptors, include five subtypes: FGFR1, FGFR2, FGFR3, FGFR4, and FGFR5. These receptors consist of extracellular ligand-binding domains, intracellular tyrosine kinase domains, and a single transmembrane domain. 5 The signaling of fibroblast growth factors involves the Klotho family of single transmembrane proteins as coreceptors.6–9 FGF19 is closely related to FGFR4 and must bind β-Klotho to form the FGFR4-β-Klotho receptor complex, enhancing the affinity between ligands and receptors. Upon binding to FGFR4, FGF19 undergoes autophosphorylation and dimerization, promoting tumor cell proliferation, epithelial-mesenchymal transition, and inhibiting apoptosis by activating pathways such as mitogen-activated extracellular signal-regulated kinase (ERK), phosphatidylinositol 3-kinase (PI3K)-serine/threonine kinase (AKT), glycogen synthase kinase-3, β-catenin and other pathways. 10 FGF19 overexpression and its interaction with FGFR4 upregulate genes such as early growth response gene-1, interleukin-6, and connective tissue growth factor, inducing hepatoma cell proliferation.11–13 Aberrant signaling pathways of the FGF19-FGFR4 complex have been identified as oncogenic drivers in hepatocellular carcinoma. 11 Additionally, FGF19 and FGFR4 can promote gallbladder cancer progression through an autocrine pathway involving the G-protein coupled bile acid receptor 1 and cyclic adenosine monophosphate-recombinant early growth response protein 1 axis. 14 FGF19 may also serve as a new diagnostic marker for lung cancer, as its binding to FGFR4 drives the progression of lung squamous cell carcinoma. 15 In pancreatic cancer, high mobility group A1 has been shown to increase FGF19 expression and protein secretion by recruiting active histone markers, thus driving pancreatic carcinogenesis and matrix formation. 16 FGF19 also plays a role as an oncogenic driver in head and neck squamous cell carcinoma. 17 Moreover, FGF19 is closely linked to the immune microenvironment of tumors and tumor immune cells. 18
Precision medicine has advanced targeted therapy and immunotherapy in cancer research, making treatments more individualized and precise. Immunotherapy, recognized for its unique functions, has emerged as an effective clinical strategy for treating malignant tumors.19,20 Precision treatments for CRC offer initial benefits, but drug resistance quickly limits their effectiveness and prognosis. Thus, identifying new immunotherapy targets is crucial. FGF19 is significantly associated with the development of various cancers and the tumor immune microenvironment. However, research on FGF19 in CRC is limited. This study explores the prognostic role of FGF19 in CRC and its relationship with clinical pathology and the CRC immune microenvironment. This research aims to provide insights for developing effective molecular targets and immunotherapy strategies, benefiting more CRC patients.
Materials and methods
Screening of DEGs associated with prognosis and immunity in CRC
In TCGA (https://portal.gdc.cancer.gov/), 21 we obtained clinical and RNA sequencing data for 644 CRC patients, which included 647 CRC tissues and 51 normal colon tissues. The dataset also covered variables such as stage, age, N stage, gender, M stage, pathology, CEA level, and lymphatic invasion. Using the R software package DESeq2, we identified differentially expressed genes (DEGs) between tumor and normal tissues, setting the threshold at Log FC > 3, Padj < 0.05. We applied the “Survival” software package to analyze DEGs associated with the prognosis of CRC patients (p < 0.05). 22 Patients were categorized into high- and low-expression groups based on the median expression of these genes. We obtained immune-related genes in the Immport (https://www.immport.org/shared/home) database. 23 Venn diagrams were then utilized to explore the interactions between up-regulated DEGs, prognosis-related DEGs, and immune-related genes. We further analyzed the correlation between mRNA expression of six selected DEGs (TG, ULBP2, S100A7, FGF19, CXCL8, GAST) and CRC prognosis using CRC survival data from TCGA, employing the Kaplan-Meier method and the survival package [version 3.3.1]. The results were visualized using the survminer and ggplot2 packages. Additionally, we downloaded datasets GSE41328 and GSE71187 and extracted DEGs from tumor and normal tissues using the limma package. Volcano plots of the DEGs from the CRC data in the TCGA and GEO databases were created using the ggplot2 software package [version 3.3.6]. After a comprehensive comparison, FGF19 was selected as the gene for further investigation.
Analysis of FGF19 expression and prognosis in CRC
We utilized Timer2.0 (http://timer.comp-genomics.org/timer/) to analyze differential gene expression of FGF19 between pan-cancer tumor tissues and normal tissues. 24 Additionally, data were sourced from the UCSC database (https://xenabrowser.net/), where we downloaded a uniformly standardized pan-cancer dataset: TCGA TARGET GTEx (PANCAN, N = 19131, G = 60499). We extracted the expression data of the ENSG00000162344 (FGF19) gene for each sample, including categories such as Solid Normal, Primary Solid Tumor, and Blood Derived Peripheral Blood—Normal Blood. We then performed a log2 (x + 0.001) transformation on each expression value. Samples from cancer species with fewer than three samples were excluded, resulting in expression data for 34 cancer types. We employed R software (version 3.6.4) to calculate the expression differences between normal and tumor samples for each cancer type. Significance testing was performed using unpaired and paired Wilcoxon Rank Sum and Signed Rank Tests. We conducted unpaired and paired difference analysis of FGF19 expression in cancer and normal tissues using the CRC dataset from the TCGA database. Data visualization was achieved with ggplot2 [3.3.6]. Similar analyses were repeated with three additional datasets: GSE41328, GSE110224, and GSE41328. We also utilized the Human Protein Atlas (https://www.proteinatlas.org/) to investigate protein expression levels of FGF19 in CRC. In the HPA database, antibodies utilized for immunohistochemistry are labeled with DAB. The resulting brown staining precisely indicates the binding sites of the antibody to its corresponding antigen. For FGF19 immunohistochemistry, the Atlas Antibodies Cat# HPA036082 antibody was employed. All tissue images stained by immunohistochemistry underwent manual annotation by an expert, followed by validation by a second expert. Each distinct normal and cancerous tissue was annotated in strict accordance with a fixed classification guide for immunohistochemical results. Moreover, we performed ROC analysis using the pROC package and visualized the results with ggplot2 [3.3.6]. Lastly, we employed the survival analysis module of the GEPIA2 (http://gepia2.cancer-pku.cn/) database to analyze the disease-free survival (DFS) status of FGF19 in colorectal cancer. 25 GEPIA2, a web-based tool, facilitates cancer gene expression profiling and survival analysis based on RNA sequencing data from TCGA and GTEx projects, providing statistical significance testing through analysis of variance and t-tests, with correction for False Discovery Rate.
RNA extraction and qPCR
The study was approved by the Ethics Committee of the First Affiliated Hospital of Hebei North University (Approval No. K2024147). We selected three specimens of cancer and paracancerous tissue from patients diagnosed with adenocarcinoma of CRC. None of the patients had undergone preoperative radiotherapy; all underwent laparoscopic radical CRC surgery. Two patients were at pathologic stage IIIC and one at stage IIIA. The tissue samples were obtained from the Vascular Gland Surgery Department at the First Affiliated Hospital of Hebei North University. The inclusion criteria were: (1) a pathological diagnosis of CRC, (2) availability of both cancerous and paracancerous tissue in the samples, and (3) informed consent obtained from all patients. Total RNA was extracted using FreeZol reagent (017E3212KA2; Vazyme, China). Initially, the cell culture medium was discarded, and the cells were washed with 1 × PBS. The cells were then treated with FreeZol Reagent according to the culture specifications to detach them, followed by centrifugation. After lysis and the addition of Dilution Buffer, the upper layer containing RNA was collected. The RNA was further purified by repeated isopropanol treatments and centrifugation to discard the supernatant. The precipitate was washed twice with 75% ethanol, the supernatant was discarded, and the precipitate was dried and resuspended in RNase-free ddH2O. The RNA could be stored under various temperature conditions for extended or brief periods. The RNA was reverse transcribed into cDNA using HiScript II Q RT SuperMix for qPCR (017E2250LA; Vazyme, China), according to the manufacturer’s instructions. The reaction mixture, prepared in an RNase-free centrifuge tube, included RNase-free ddH2O, 5× HiScript II Select qRT SuperMix, Oligo (dT)18VN (10 μM) or Random Hexamers (50 ng/μl), and template RNA, totaling 20 μl. Reverse transcription was performed with two cycles: 50°C for 15 min and 85°C for 5 s. qRT-PCR was conducted using AceQ qPCR SYBR Green Master Mix (Without ROX) (037E32221A; Vazyme, China). The reaction mixture consisted of 2× AceQ qPCR SYBR Green Master Mix (Without ROX), Primer 1 (10 µM), Primer 2 (10 µM), template cDNA, and ddH2O, to a final volume of 20 µl. The qPCR protocol involved three stages: Stage 1: 1 cycle at 95°C for 5 min; Stage 2: 40 cycles at 95°C for 10 s and 60°C for 30 s; Stage 3: default melting curve acquisition. GAPDH served as the internal control. Primer sequences are listed in Supplemental Table 1. Relative expression levels were calculated using the 2−ΔΔCT method.
Analysis of FGF19 versus clinicopathologic parameters
Using the CRC dataset from TCGA, we analyzed the association between clinicopathological factors and FGF19 expression employing the chi-square test and single-gene logistic regression analysis with the R package “stats” [4.2.1]. Additionally, we used the R packages “car” [3.1-0] for diagnostic measures and the Wilcoxon rank sum test for statistical analyses. Data visualization was achieved using “ggplot2” [3.3.6]. We employed the “survival” [3.4.0] package for survival analysis, conducting proportional hazards hypothesis testing and Cox regression analysis. Variables were included in the multivariate Cox model if they met the p-value threshold of <0.1 in the univariate analysis.
Functional enrichment analysis of FGF19
Based on data from the TCGA database, we performed differential expression analysis for FGF19 in CRC, identifying 516 related genes (|LogFC| > 1, Padj < 0.05). For functional enrichment, we utilized the R packages “clusterProfiler” [4.4.4] and “org.Hs.eg.db” to conduct Gene Ontology (GO) and Kyoto Encyclopedia of Genes and Genomes (KEGG) analyses. The results were visualized using “ggplot2” [3.3.6]. Gene set enrichment analysis (GSEA) was also performed with the same packages, referencing the gene set: c2.Cp.All.V2022.1.Hs.Symbols.Gmt [All Canonical Pathways] (3050). The analysis results were again visualized using “ggplot2” [3.3.6]. Finally, we created a network diagram of the selected DEGs using the cytoHubba plugin of Cytoscape software. We investigated the association of FGF19 with a gene set linked to NETs in CRC, 26 as identified in the literature, using Spearman statistics for validation and “ggplot2” [3.3.6] for heatmap presentation.
Genetic variation analysis of FGF19 in CRC
We used cBioPortal (https://www.cbioportal.org/), to analyze genetic alterations in FGF19. Based on datasets from MSK, Nature Medicine 2019, 27 Sidra-LUMC AC-ICAM, 28 Nat Med 2023, MSK, JNCI 2021, 29 TCGA, and Nature 2012, 30 we calculated the frequencies of FGF19 gene mutations and copy number alterations using the “Cancer Type Summary” module. Mutation site maps for FGF19 were generated using the “Mutation” module, and a plot of FGF19 mutation counts versus cancer type was created with the “Plots” module. Additionally, we used COSMIC (https://www.example.com), to ascertain the type and frequency of FGF19 mutations in CRC, selecting the “tissue distribution” and “mutation distribution” modules for colorectal tissue analysis.
Immune checkpoint analysis for FGF19
Data were obtained from UCSC (https://xenabrowser.net/), where we downloaded a uniformly standardized pan-cancer dataset: TCGA Pan-Cancer (PANCAN, N = 10535, G = 60499). We extracted the expression data of ENSG00000162344 (FGF19) and 60 marker genes for two types of immune checkpoint pathway genes (Inhibitory, Tumor) from each sample. We selected samples from: Primary Derived Cancer-Peripheral Blood, Primary Stimulatory Samples, and excluded all normal samples. Each expression value was transformed using log2 (x + 0.001). Subsequently, we calculated the Spearman correlation between ENSG00000162344 (FGF19) and five types of immune pathway markers. Finally, we assessed the association between FGF19 expression and ICP genes in CRC using Spearman analysis.
Immunoinvasive assay for FGF19
We obtained data from UCSC (https://xenabrowser.net/), downloading a uniformly standardized pan-cancer dataset: TCGA Pan-Cancer (PANCAN, N = 10,535, G = 60,499). From this dataset, we extracted the expression data for the ENSG00000162344 (FGF19) gene from each sample, focusing specifically on metastatic samples from: Primary Blood Derived Cancer- Peripheral Blood (TCGA-LAML), Primary Tumor, and TCGA-SKCM. We performed a log2 (x + 0.001) transformation on each expression value and mapped the gene expression profiles to their corresponding Gene Symbols using the R software package ESTIMATE. 31 ESTIMATE scores were calculated for each CRC patient based on gene expression. Based on the ssGSEA algorithm provided in the R packet-GSVA [1.46.0], 32 we used the markers of 24 immune cells provided in the Immunity article. 33 We performed Spearman correlation analysis between the principal variables and the immune infiltration matrix data, visualizing the results with the ggplot2 package through rhoptry and scatter plots. We then assessed the enrichment of immune-infiltrating cells in CRC patients with high versus low FGF19 expression using the Wilcoxon rank sum test.
Drug sensitivity analysis of FGF19
GSCALite (http://bioinfo.life.hust.edu.cn/web/GSCALite/) 34 a tumor genomic analysis platform that integrates genomic data from 33 tumor types from the TCGA repository along with drug response data from GDSC and CTRP. We analyzed FGF19 drug sensitivity using data from GDSA and CRTP. Additionally, we created a network diagram between drugs using Cytoscape.
Analysis of tumor heterogeneity
We obtained data from UCSC (https://xenabrowser.net/), downloading a uniformly standardized pan-cancer dataset: TCGA Pan-Cancer (PANCAN, N = 10,535, G = 60,499). From this dataset, we extracted the ENSG00000162344 (FGF19) gene expression data for each sample, focusing on samples originating from Primary Blood Derived Cancer- Peripheral Blood and Primary Tumor. Additionally, we accessed data from the GDC (https://portal.gdc.cancer.gov/), downloading the Simple Nucleotide Variation dataset of Level 4 for all TCGA samples processed by MuTect2 software. We calculated the Mutant-Allele Tumor Heterogeneity (MATH) and Tumor Mutation Burden (TMB) for each tumor using the “tmb” and “Heterogeneity” functions of the R software package maftools (version 2.8.05). We also incorporated neoantigen (NEO) data and microsatellite instability (MSI) scores obtained from previous studies for each tumor. We integrated MATH, TMB, NEO, MSI, and gene expression data for the samples, performing a log2 (x + 0.001) transformation for each expression value. We excluded cancer types with fewer than three samples, ultimately obtaining expression data for 37 cancer types. We then calculated their correlation in each tumor using the Spearman method. For the heatmap of FGF19 in relation to mismatch repair (MMR)-related genes, we obtained data from the TCGA database (https://portal.gdc.cancer.gov/). We downloaded and sorted the RNA-seq data processed by the STAR method from the TCGA-COAD and TCGA-READ projects, extracting the data in FPKM format along with clinical data. After removing the normal group, we processed the data with a log2 (value + 1) transformation and performed Spearman correlation analysis of the variables using R (version 4.2.1) with the ggplot2 package [3.3.6]. The analysis results were visualized with a heatmap.
Single-cell analysis of FGF19 in CRC
We performed single-cell analysis through the Single Cell database (https://singlecell.broadinstitute.org/single_cell). 35 The parameters analyzed included FGF19 (gene), major lineage (cell-type annotation), and CRC (cancer type). This analysis allowed us to observe the distribution of different cell types in CRC and to assess the expression levels and distribution of FGF19 across these cell types. The expression and distribution were quantified and visualized using violin plots. Details on data collection, processing, and cell annotation procedures are provided in the documentation section of the Single Cell website (https://singlecell.zendesk.com/hc/en-us). Additionally, we explored FGF19 expression using the CancerSCEM database (https://ngdc.cncb.ac.cn/cancerscem/) 36 which hosts single-cell sequencing data. After comparing FGF19 expression across various datasets, we selected the dataset CRC-101-03-1A for further analysis. We examined the cellular interactions involving single cells and CD8+ T cells within this dataset, visualizing the results using Circos plots and Dot plots. Information on data collection, processing, and cell annotation is available in the documentation section of the CancerSCEM database (https://ngdc.cncb.ac.cn/cancerscem/documents).
Results
Screening of differential genes associated with prognosis and immunity in CRC
We began by identifying DEGs between CRC cancer and normal tissues, selecting a total of 537 up-regulated DEGs (LogFC>3, p < 0.05). We then identified DEGs associated with CRC prognosis, selecting 1706 DEGs (p < 0.05). Additionally, we downloaded 2438 immune-related genes from the ImmPort database. We performed a Venn overlap analysis of the selected up-regulated DEGs, prognostic DEGs of CRC, and immune-related genes (Figure 1(a)), identifying six intersection genes: TG, ULBP2, S100A7, FGF19, CXCL8, and GAST (Supplemental Table 2). We conducted survival analysis for these six genes and found that all were associated with overall survival (OS) in patients (p < 0.05). Specifically, TG and CXCL8 were associated with favorable prognoses for CRC patients (Figure 1(b, c)), while ULBP2, S100A7, FGF19, and GAST were associated with poorer prognoses (Figure 1(d–g)). To confirm the high expression of these genes, we performed volcano plots using CRC cancer and normal tissue datasets from TCGA, as well as GSE41328 and GSE71187. The analysis revealed that these six genes were up-regulated in the TCGA dataset (Figure 1(h)). ULBP2, CXCL8, and FGF19 were up-regulated in the GSE41328 dataset (Figure 1(i)), and GAST, ULBP2, and FGF19 were up-regulated in the GSE71187 dataset (Figure 1(j)). After a comprehensive comparison of prognostic analysis and gene expression data, we concluded that FGF19 was not only highly correlated with the prognosis of CRC patients but also highly expressed in the TCGA database and in the GSE41328 and GSE71187 datasets. Based on these findings, we selected FGF19 as our research target to further explore its relationship with the development of CRC.

Screening of up-regulated DEGs, prognostic analysis of DEGs in CRC, and volcano plot visualization of differential genes. (a) Venn diagrams of up-regulated DEGs, prognostic DEGs, and immune-related genes in CRC cancer and normal tissues. The green part represents up-regulated DEGs between cancer and normal tissues (LogFC > 3, Padj < 0.05), the pink part represents prognostic DEGs in CRC (p < 0.05), and the light blue part represents immune-related genes. (b–g) Prognostic analysis of six DEGs (TG, CXCL8, ULBP2, S100A7, FGF19, GAST) in CRC. p < 0.05 was statistically significant. (h) Volcano plot of DEGs selected based on the TCGA database. Up-regulated DEGs are colored red and down-regulated DEGs are colored blue. X-axis represents LogFC and Y-axis represents -Log10. (i) Volcano plot of DEGs selected based on GSE41328 dataset. Up-regulated DEGs are colored red and down-regulated DEGs are colored blue. X-axis represents LogFC and Y-axis represents -Log10. (j) Volcano plot of DEGs selected based on GSE71187 dataset. Up-regulated DEGs are colored red and down-regulated DEGs are colored blue. X-axis represents LogFC, and Y-axis represents -Log10.
In CRC, high expression of FGF19 is strongly associated with poor prognosis
To investigate the expression level of FGF19 in normal and tumor tissues, we analyzed its expression across various cancers using the TIMER2.0 database within the TCGA framework. The results indicated that FGF19 was significantly up-regulated in colon adenocarcinoma (COAD) and rectum adenocarcinoma (READ) (p < 0.001) (Figure 2(a)). Additionally, we utilized RNA-seq data from normal and tumor tissues of 34 cancers, sourced from both the TCGA and GTEx databases, performing significant difference analysis with the Wilcoxon test. This revealed substantial up-regulation of FGF19 in COAD, COADREAD, and READ (COAD: p = 1.4e-88, COADREAD: p = 1.7e-103, READ: p = 2.6e-6) (Figure 2(b)). Further analysis in the TCGA database showed that FGF19 expression was higher in CRC tissues compared to adjacent non-cancerous tissues, both in paired and unpaired differential analyses, with strong statistical significance (paired difference: p = 7.8e-09, unpaired difference: p = 5.7e-22) (Figure 2(c–d)). Similarly, analyses of the GSE41328, GSE110224, and GSE71187 databases confirmed that FGF19 was up-regulated in both paired and unpaired comparisons between cancerous and normal tissues, with significant correlations observed (paired difference analysis: p = 0.02; unpaired difference analysis: p = 0.0042) (Supplemental Figure 1(A and B)). We also collected cancer and adjacent normal tissues from CRC patients and performed qRT-PCR, which showed that FGF19 levels were higher in cancer tissues than in adjacent normal tissues (Figure 2(e)). In addition, protein expression data from the Human Protein Atlas (HPA) showed little difference in FGF19 protein levels in CRC tissues compared to normal tissues, which requires further validation using clinical samples (Figure 2(f)). Furthermore, protein expression data from the Human Protein Atlas (HPA) suggested an increase in FGF19 protein levels in CRC tissues compared to normal tissues, necessitating further verification with clinical specimens (Figure 2(f)). From the TCGA database, ROC curve analysis showed an AUC of 0.904 (Supplemental Figure 1(C)), suggesting that FGF19 could serve as a potential diagnostic biomarker. Our Kaplan-Meier survival curve analysis of FGF19 indicated that CRC patients with elevated FGF19 expression experienced lower overall survival rates (Figure 1(e)). Furthermore, our analysis of disease-free survival (DFS) demonstrated that high FGF19 expression was associated with a poor DFS prognosis (p = 0.011) (Supplemental Figure 1(D)).
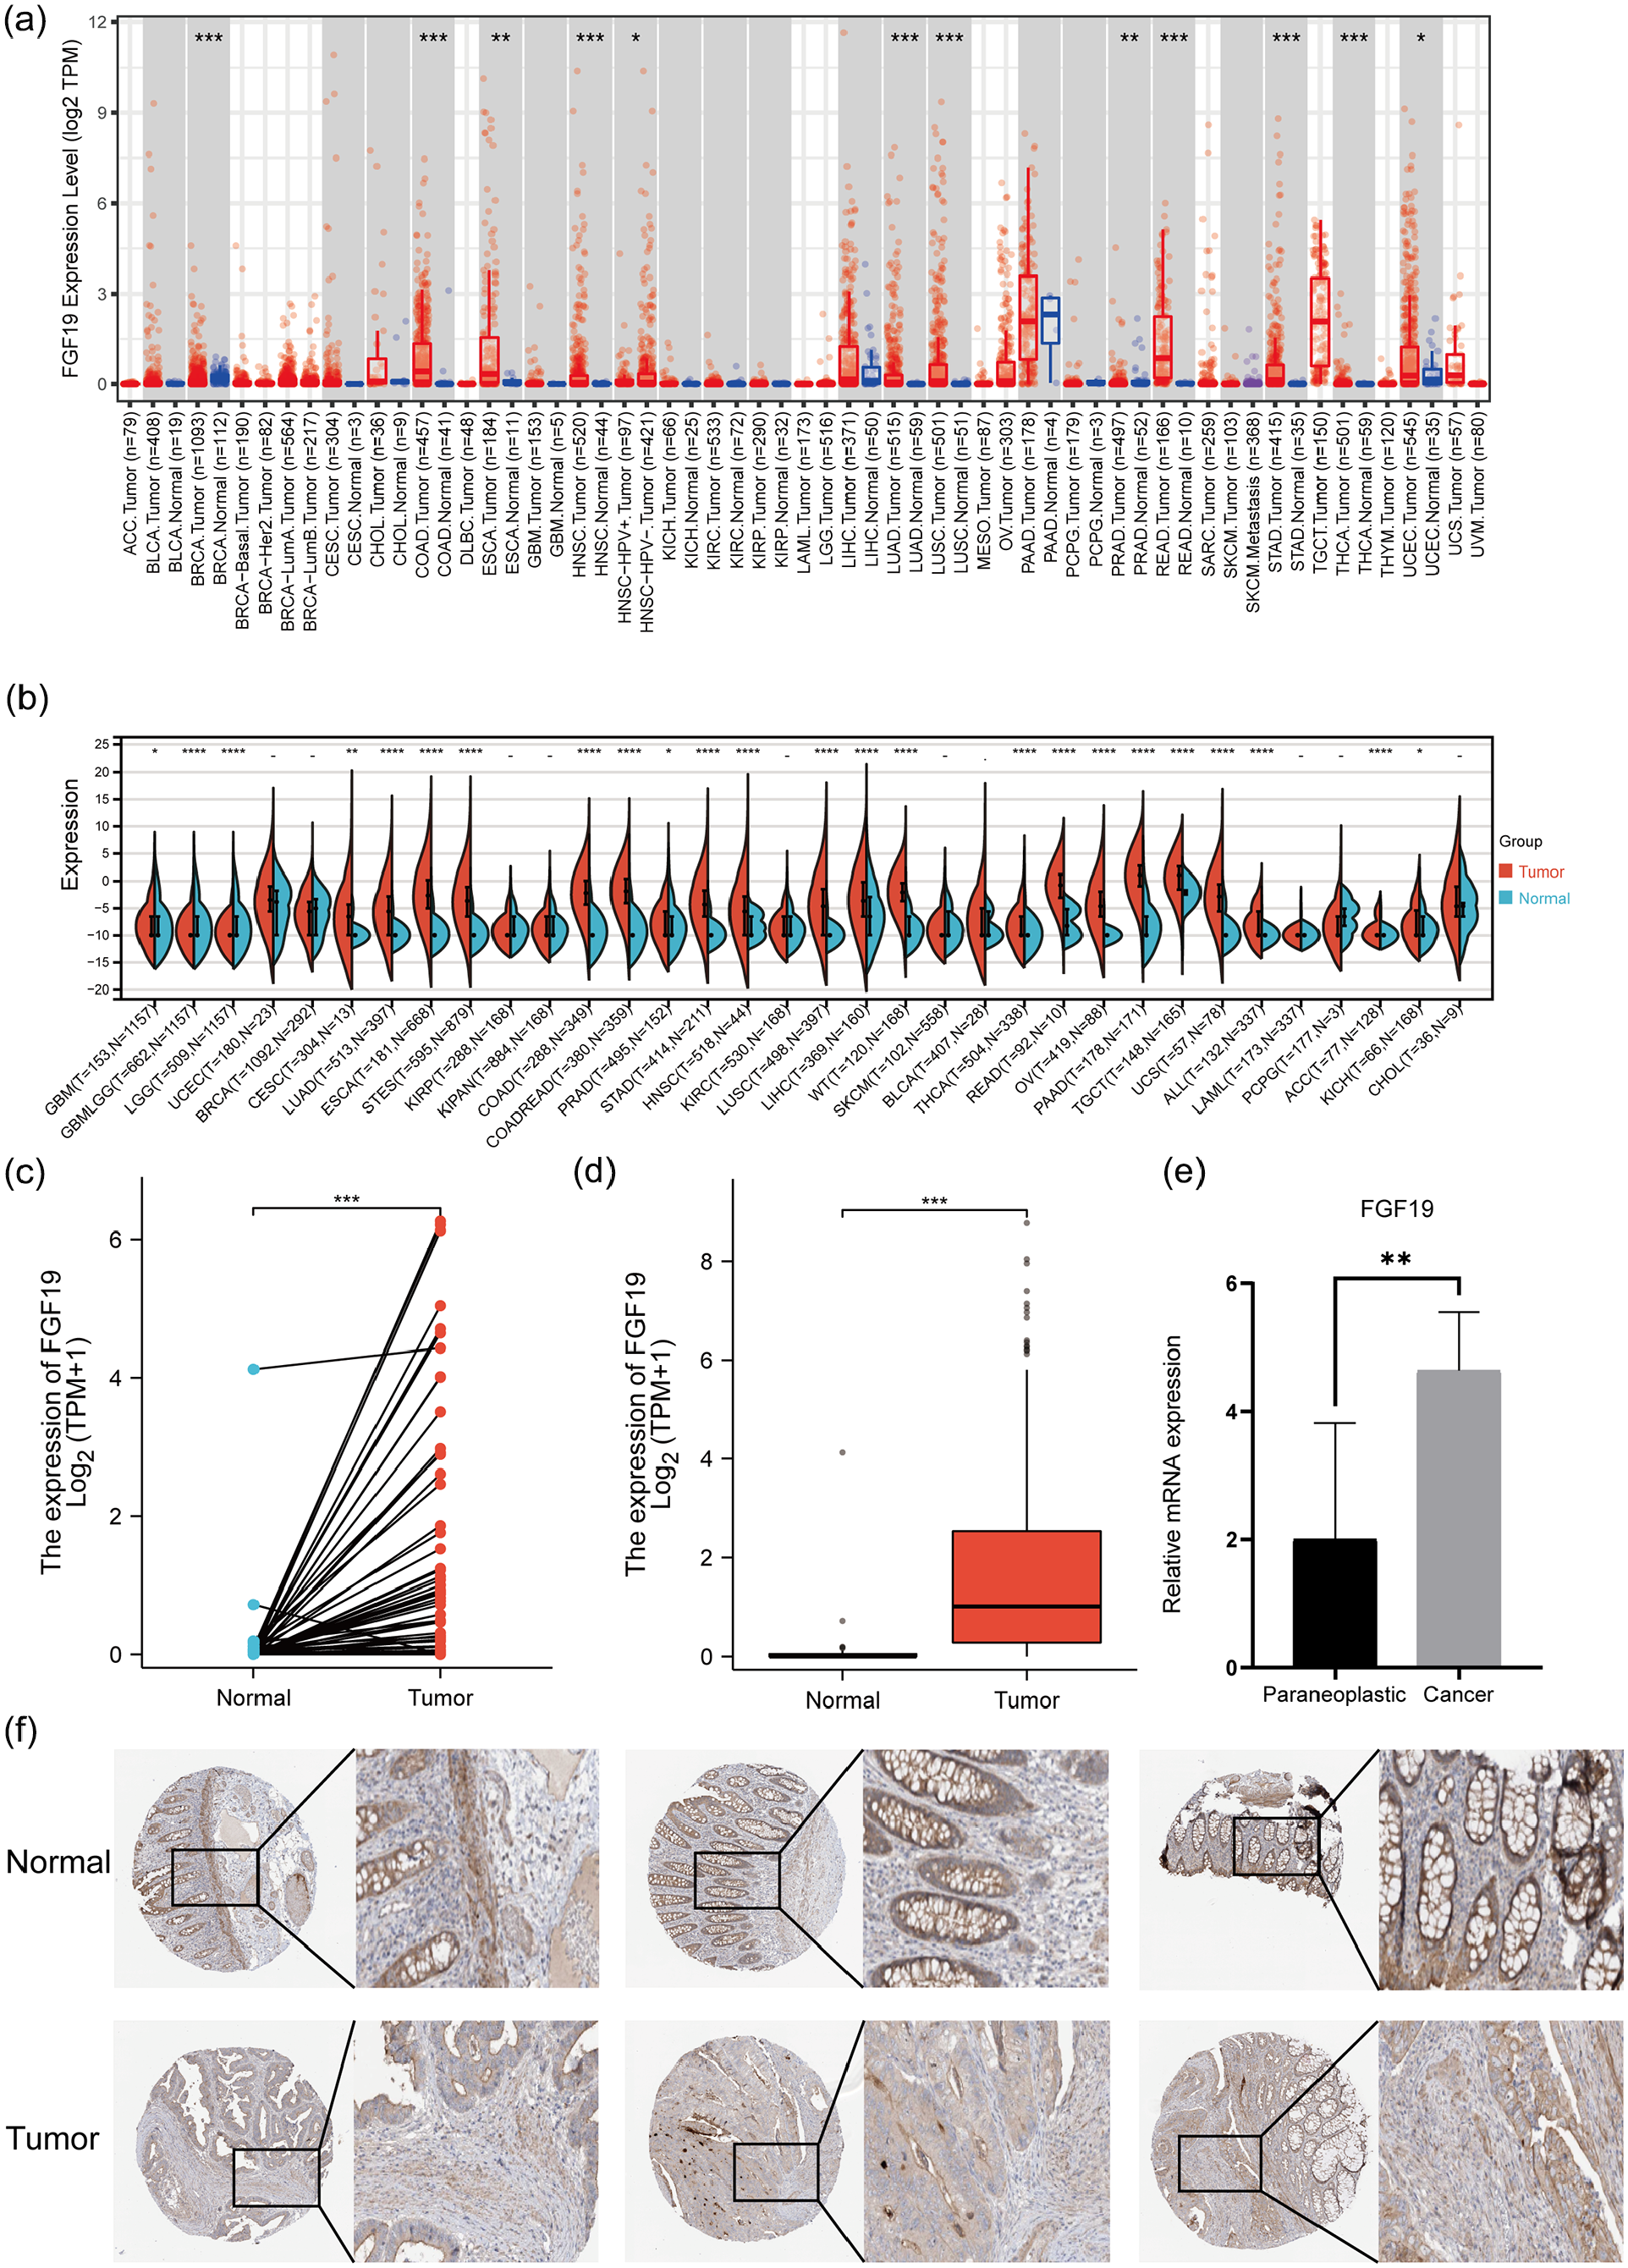
FGF19 expression and prognosis in CRC. (a) FGF19 mRNA expression in pan-cancer (Timer2.0 database). (b) FGF19 mRNA expression in pan-cancer (TCGA database, GTEx database). (c) Pairwise difference analysis of FGF19 mRNA in the TCGA database. *p < 0.05, **p < 0.01, ***p < 0.001. (d) Unpaired differential analysis of FGF19 mRNA in the TCGA database. *p < 0.05, **p < 0.01, ***p < 0.001. (e) Expression levels of FGF19 mRNA in the carcinomas and paracancers of CRC. *p < 0.05, **p < 0.01, ***p < 0.001. (f) FGF19 protein expression in cancer tissues and normal tissues of CRC (HPA database).
Relationship between FGF19 expression and clinicopathological parameters
We employed the Chi-square test and single-gene logistic regression analysis to examine the association between clinicopathological factors and FGF19 expression in patients with CRC (Tables 1 and 2). The Chi-square test indicated significant associations of FGF19 with N stage (p = 0.002), M stage (p < 0.001), pathological stage (p < 0.001), and degree of lymphatic invasion (p = 0.011). Similarly, single-gene logistic regression analysis revealed that FGF19 was significantly associated with N stage (p = 0.004), M stage (p < 0.001), pathological stage (p = 0.004), and degree of lymphatic invasion (p = 0.007). Further analysis demonstrated that FGF19 expression correlates with stages N0 and N2 (p < 0.001) (Figure 3(a)), suggesting that the number of lymph node metastases increases with higher FGF19 expression. A similar correlation was found between FGF19 expression and stages M0 and M1 (p < 0.001) (Figure 3(b)), indicating that higher FGF19 expression is associated with an increased risk of distant metastasis. Additionally, a relationship was observed between FGF19 expression and various pathological stages (Figure 3(c)), with significant differences noted between stages I and IV (p = 0.0031), II and IV (p = 3e-5), and III and IV (p = 0.01), suggesting that higher FGF19 expression correlates with more advanced disease stages. To assess the impact of FGF19 expression and clinicopathological parameters on survival, we conducted univariate and multivariate Cox regression analyses (Table 3). In the univariate model, factors such as age, T stage, N stage, M stage, pathological stage, CEA level, and lymphatic invasion were all significantly associated with overall survival (p < 0.05). These variables were then included in a multivariate Cox regression model, which identified age (p < 0.001), M stage (p = 0.035), pathological stage (p = 0.013), and lymphatic invasion (p = 0.006) as independent risk factors affecting overall survival in patients with CRC.
FGF19 expression associated with clinicopathological characteristics (chi-square test).

p < 0.05, and the results were statistically significant.
FGF19expression associated with clinicopathological characteristics (logistic regression).

p < 0.05, and the results were statistically significant.
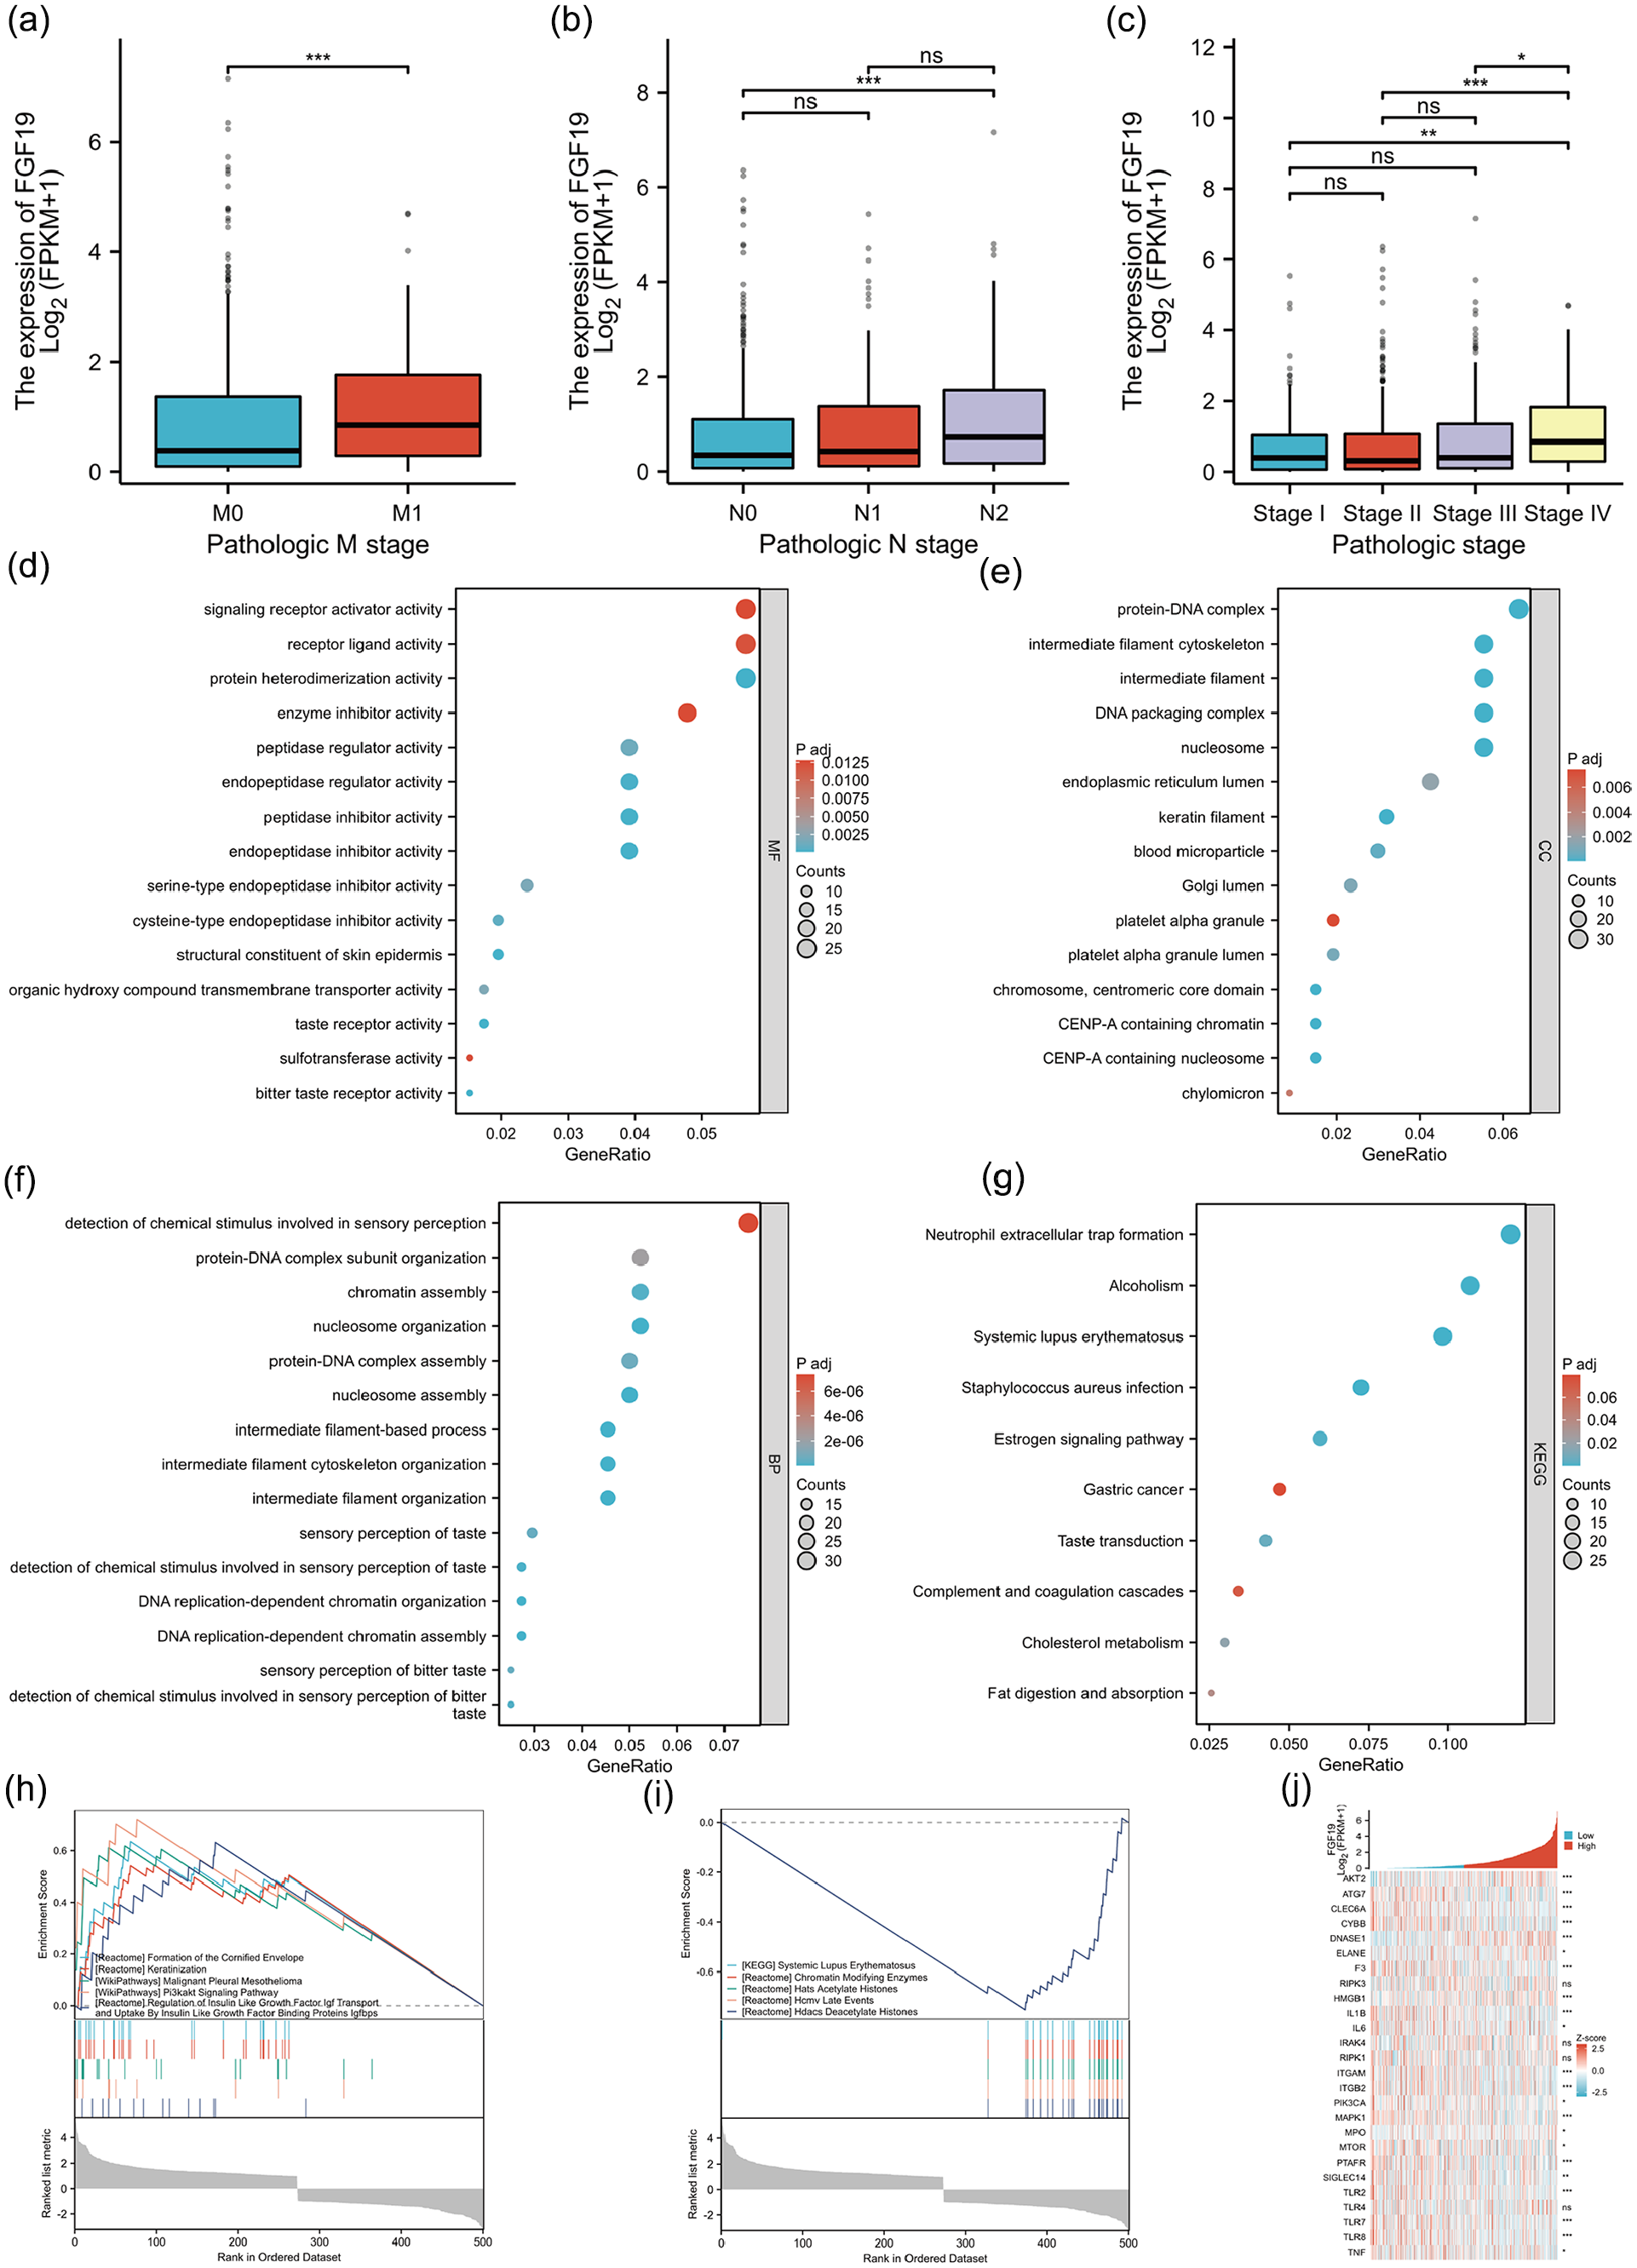
Relationship between FGF19 mRNA and clinical variable grouping and functional enrichment analysis of FGF19 in CRC. (a) Relationship between FGF19 mRNA expression and tumor M stage. *p < 0.05, **p < 0.01, ***p < 0.001. (b) Relationship between FGF19 mRNA expression and tumor N stage. *p < 0.05, **p < 0.01, ***p < 0.001. (c) Relationship between FGF19 mRNA expression and pathological stage of tumor. *p < 0.05, **p < 0.01, ***p < 0.001. (d) Molecular function analysis of FGF19 differential genes. (e) Cellular component analysis of FGF19 differential genes. (f) Bioprocess analysis of FGF19 differential genes. (g) KEGG analysis of FGF19 differential genes. (h) Heat map of correlation between FGF19 and NETs-related gene sets in CRC. (i) GSEA analysis of DEGs up-regulated by FGF19. (j) GSEA analysis of modulated DEGs under FGF19.
Univariate and multivariate analyses of clinicopathological parameters in patients with CRC.

p < 0.05, and the results were statistically significant.
Functional enrichment analysis of FGF19 in CRC
Based on the TCGA database, we identified 516 DEGs with significant expression differences between high and low FGF19 expression in CRC samples (|LogFC| > 1, Padj < 0.05) (Supplemental Table 3). We conducted gene ontology (GO) analysis and KEGG analysis on these 516 DEGs. The GO analysis covered molecular functions, cellular components, and biological processes (Figures 3(d–f)). We found that the molecular functions of FGF19 predominantly involve signal receptor activator activity, receptor ligand activity, and protein heterodimerization activity. The cellular components are mainly associated with protein-DNA complexes, intermediate filament cytoskeleton, and intermediate filaments. The biological processes primarily relate to the detection of chemical stimuli in sensory perception, organization of protein-DNA complex subunits, and chromatin assembly. Our KEGG analysis revealed 10 pathways relevant to FGF19 (Figure 3(g)). Notably, these pathways include NETs formation, alcoholism, systemic lupus erythematosus, Staphylococcus aureus infection, estrogen signaling pathway, gastric cancer, taste transduction, complement and coagulation cascades, cholesterol metabolism, and digestion and absorption of fats. Given the established link between NETs and various cancers, we further investigated the association of FGF19 with NETs-related genes in CRC (Figure 3(h)). The results demonstrated a strong association, suggesting that FGF19 might influence CRC progression by promoting NETs formation.
Additionally, to more comprehensively explore the pathways related to FGF19 in CRC, we conducted gene set enrichment analysis (GSEA) using data from the 516 DEGs. The GSEA results highlighted that pathways such as formation of the cornified envelope, keratinization, malignant pleural mesothelioma, Pi3K-Akt signaling pathway, regulation of Igf transport, and regulation of uptake of Igfbps were enhanced in samples with high FGF19 expression (Figure 3(i)). Conversely, pathways inhibited included systemic lupus erythematosus, chromatin-modifying enzymes, acetylated histones, late events in human cytomegalovirus, and histone deacetylases that deacetylate histones (Figure 3(j)) (Supplemental Table 4). We also analyzed the protein-protein interaction (PPI) network for FGF19-related genes (Supplemental Figure 1(E)).
FGF19 gene alterations in CRC
We investigated FGF19 variants in CRC using the cBioPortal database and selected four CRC datasets comprising 2405 samples. The results indicated that FGF19 mutations were present in 1.33% (32/2405) of CRC patients, with gene mutations and gene amplifications accounting for 0.67% of these cases (Figure 4(a)). We identified 18 mutation sites between amino acids 0 and 216, comprising 17 missense mutations and 1 truncating mutation. Notably, R43H emerged as the most common mutation site, primarily occurring in the first exon, and missense mutations were the predominant mutation type (Figure 4(b)). We also explored the relationship between cancer types and mutation count in the four CRC datasets, finding that mutation counts were highest in CRC adenocarcinoma (Figure 4(c)). Further analysis using the COSMIC database revealed that 62.96% of CRC samples exhibited missense substitutions, while 29.63% showed synonymous substitutions (Figure 4(d)). Additionally, base substitutions were predominantly C > T (46.15%), followed by G > A and T > C (both 15.38%) (Figure 4(e)).
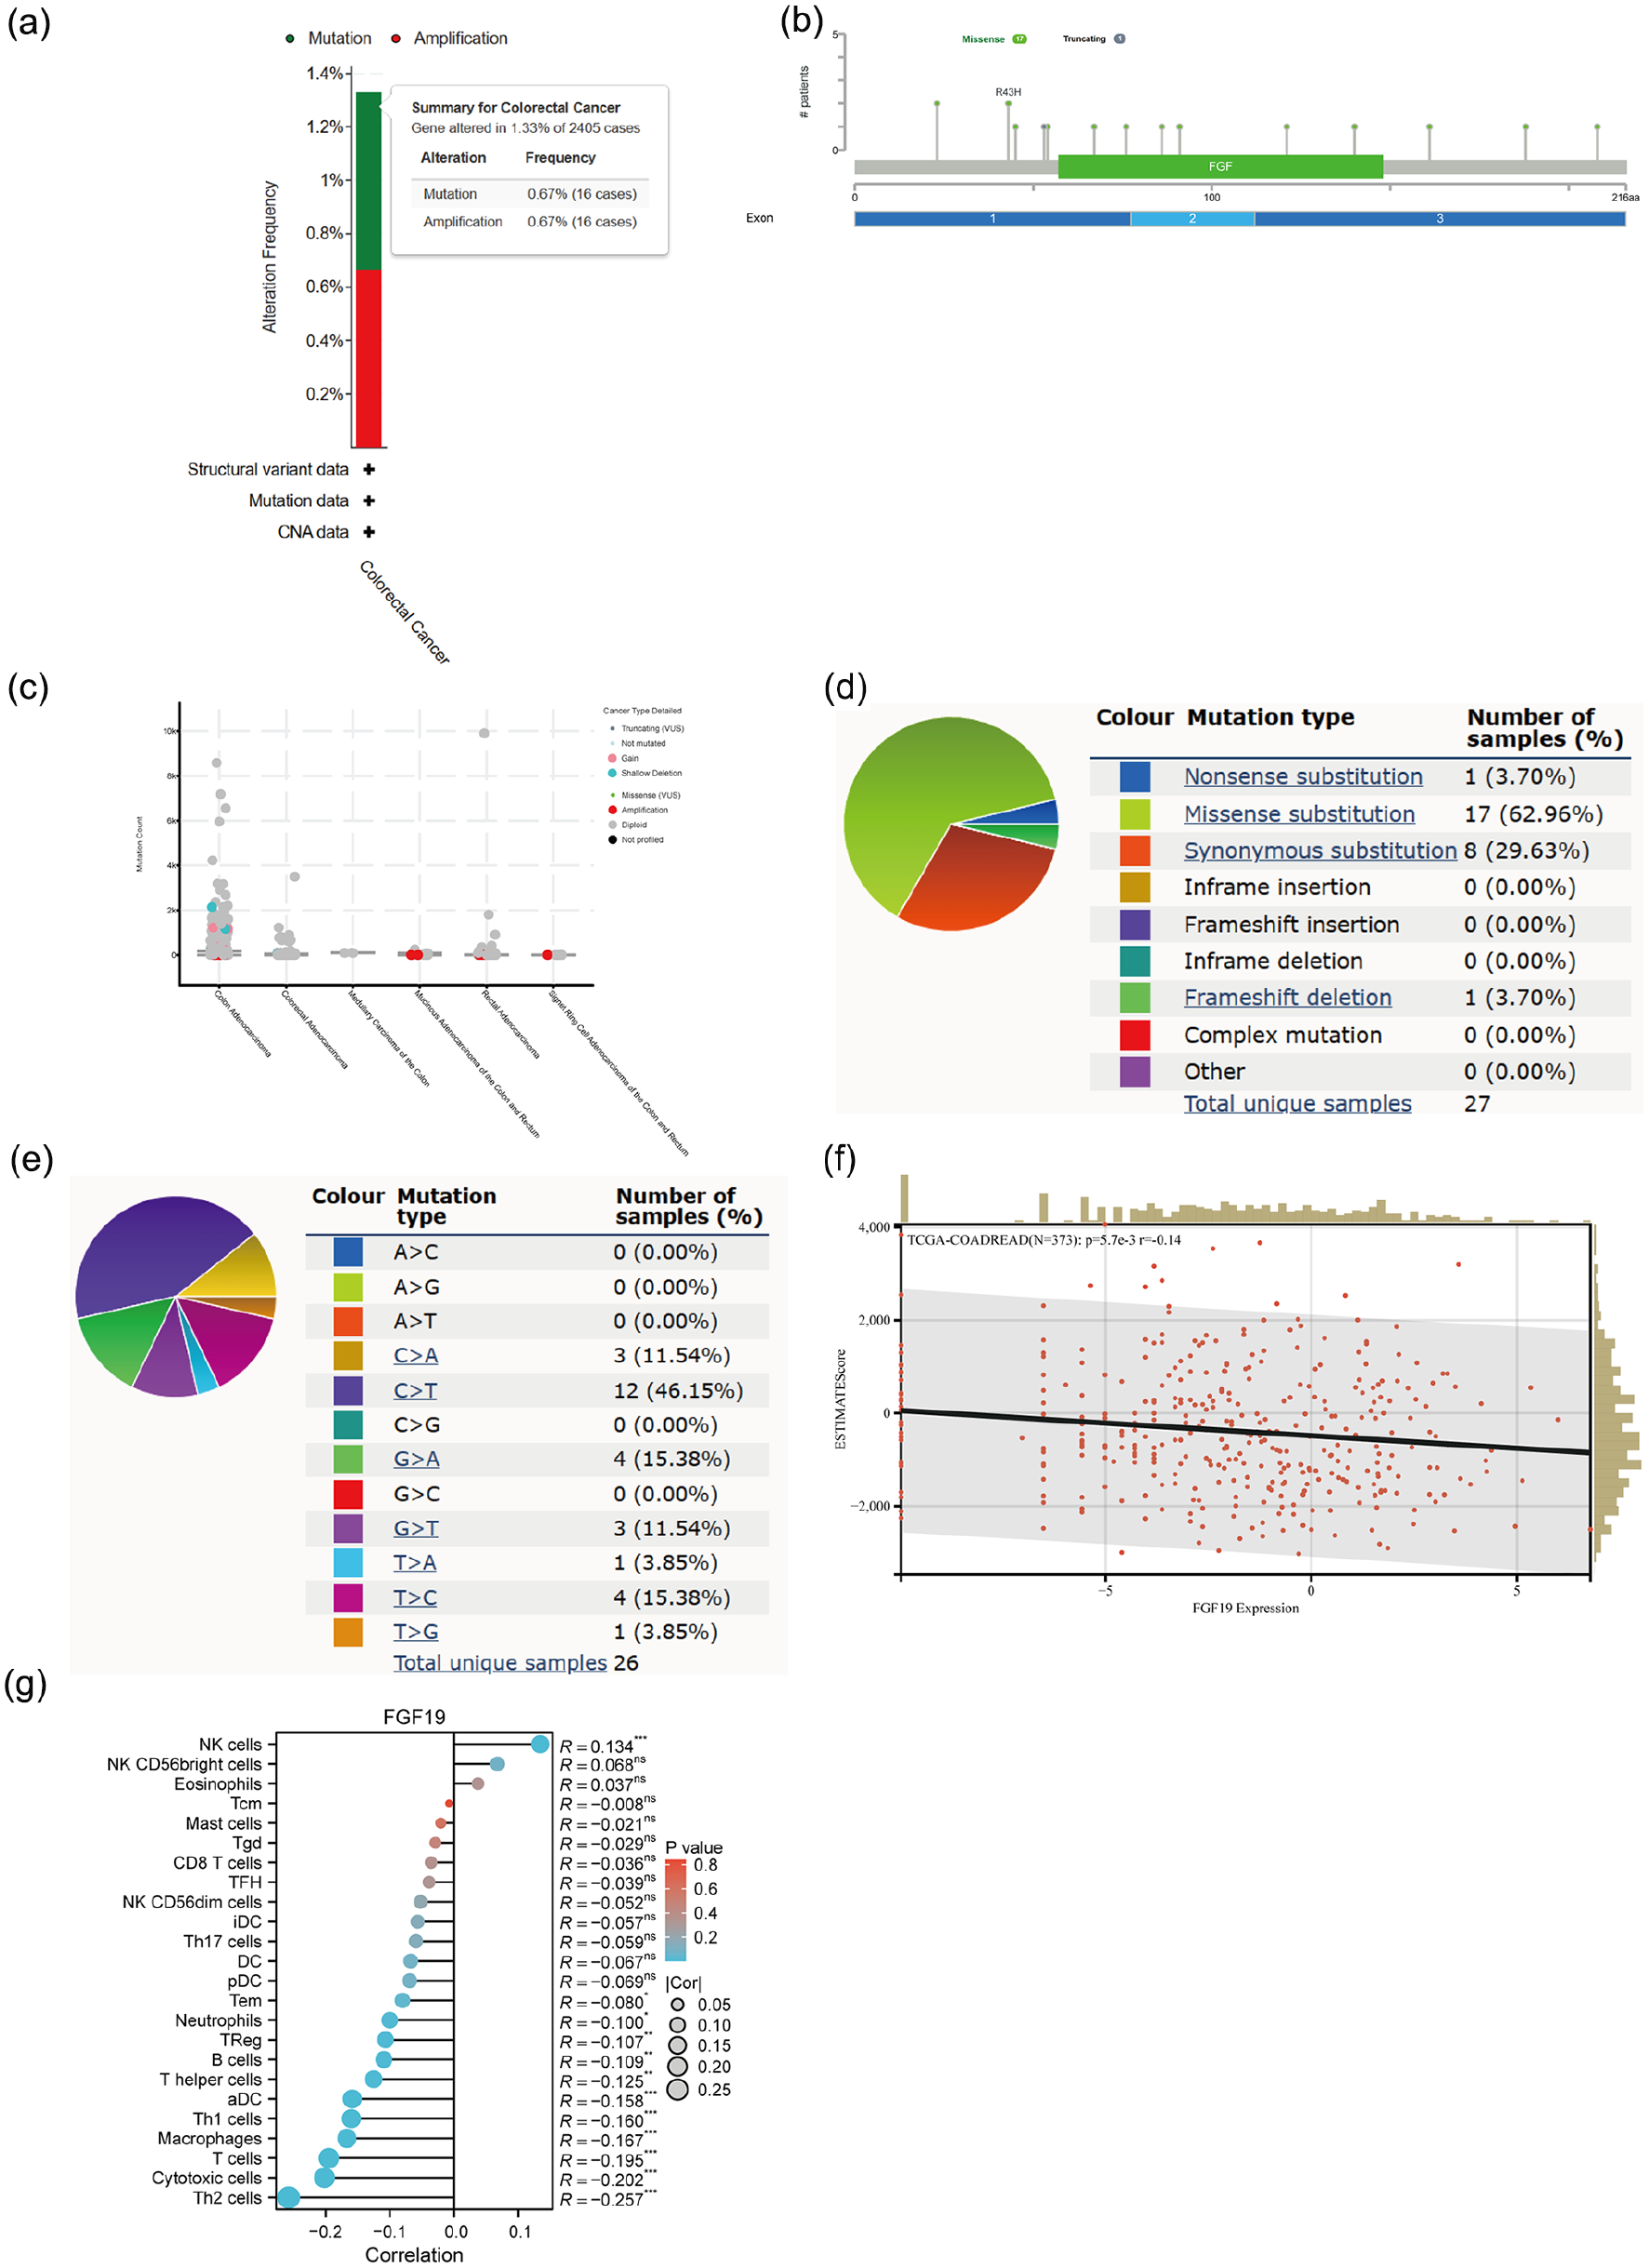
Genetic variation and immune infiltration of FGF19 in CRC. (a) Type and frequency of FGF19 variants in CRC in the cBioPortal database. (b) Mutation sites of FGF19 across protein domains in the cBioPortal database. (c) Relationship between CRC typing and FGF19 mutation count in cBioPortal database. (d and e) FGF19 mutation types in FGF19 gene cancer CRCs in the COSMIC database. (f) Correlation of FGF19 with ESTIMATE score in CRC. p < 0.05 was statistically significant. (g) FGF19 association with immune infiltrating cells in CRC. *p < 0.05, **p < 0.01, ***p < 0.001.
Relationship between FGF19 expression and tumor immune infiltration
To examine the impact of FGF19 changes on the tumor microenvironment, we analyzed the correlation between FGF19 expression and ESTIMATE scores in CRC. This gene expression presented a significant negative correlation with immune infiltration in CRC (N = 373, R = −0.14, p = 5.7e-3) (Figure 4(f)). We also employed the ssGSEA algorithm to assess the relationship between the relative abundance of 24 immune cells and FGF19 expression in CRC (Figure 4(g)). Additionally, we plotted scatter plots of FGF19 with various immune cells (Figures 5(a–d), Supplemental Figure 1(F–M) and observed different types of immune cells associated with FGF19 expression. FGF19 was positively correlated with NK cells (p < 0.001, r = 0.134) and negatively correlated with Tem cells (p = 0.042, r = −0.08), neutrophils (p = 0.011, r = −0.10), and significantly negatively correlated with regulatory T cells (p = 0.007, r = −0.107), Th1 cells (p < 0.001, r = −0.16), Th2 cells (p < 0.001, r = −0.257), B cells (p = 0.005, r = −0.11), helper T cells (p = 0.004, r = −0.113), activated dendritic cells (p < 0.001, r = −0.154), T cells (p < 0.001, r = −0.195), cytotoxic cells (p < 0.001, r = −0.202), and macrophages (p < 0.001, r = −0.167). Furthermore, we analyzed the expression of FGF19 across multiple immune cell groupings (Figure 5(e–h), Supplemental Figures 1(N–T), 2(A)), revealing that the proportion of NK cells in the FGF19 high expression group was significantly higher than that in the low expression group. Conversely, the proportion of macrophages, T cells, activated dendritic cells, helper T cells, B cells, Th1 cells, Th2 cells, regulatory T cells, neutrophils, Tem cells, and cytotoxic cells was lower in the FGF19 high expression group compared to the low expression group.

Analysis of FGF19 and immune infiltrating cells and the relationship between FGF19 and immune checkpoints. (a–d) Scatter plot of FGF19 association with immune cells (NK cells, Tem, Neutrophils, TReg). p < 0.05 was statistically significant. (e–h) Relationship between FGF19 high and low expression groups and immune cells (NK cells, Macrophages, T cells, aDC) *p < 0.05, **p < 0.01, ***p < 0.001. (i) FGF19 mRNA in relation to 60 immune checkpoints in pan-cancer. (j–o) Scatter plot of FGF19 mRNA and immune checkpoints (CD274, LAG3, HAVCR2, CTLA, PDCD1LG2, TIGIT). p < 0.05 was statistically significant.
Relationship between FGF19 expression and immune checkpoints
Given the increasing evidence that immune checkpoints are aberrantly expressed on cancer cells and that the expression of immune checkpoint genes is closely linked to the efficacy of immunotherapy, we explored the correlation between FGF19 and 60 immune checkpoint-related genes in CRC. Our analysis revealed that FGF19 was negatively correlated with most immune checkpoint genes (Figure 5I). We further investigated several important immune checkpoint genes, resulting in scatter plots of FGF19 with eight immune checkpoint genes (Figure 5(j–o), Supplemental Figure 2(B and C)). The findings indicated that FGF19 was negatively correlated with CD274 (p < 0.001, r = −0.226), LAG3 (p < 0.001, r = −0.174), HAVCR2 (p < 0.001, r = −0.220), CTLA-4 (p = 0.004, r = −0.113), PDCD1LG2 (p < 0.001, r = −0.219), and TIGIT (p < 0.001, r = −0.259). Conversely, there was a positive correlation between FGF19 and SIGLEC5 (p < 0.001, r = 0.130). FGF19 showed minimal relationship with PDCD1.
FGF19 in relation to tumor heterogeneity and chemosensitivity
Tumor genomic heterogeneity is closely associated with tumor development and progression. TMB, MSI, NEO, and MMR are considered promising biomarkers for predicting the efficacy of immunotherapy.37–40 We observed that FGF19 was negatively correlated with TMB, MSI, and NEO expressions in CRC (Figure 6(a–c)). Additionally, a negative correlation was found between FGF19 and MSH6, a key MMR-related gene (Figure 6(d)). These observations suggest that FGF19 may influence tumor immunity through its linkages with TMB, MSI, NEO, and MMR. Furthermore, mutant-allele tumor heterogeneity (MATH), which is also strongly associated with tumor heterogeneity, showed a positive correlation with FGF19 expression in CRC (Figure 6(e)). In terms of chemosensitivity, analysis from the CTRP dataset indicated a correlation between FGF19 expression levels and drug sensitivity. The top three drugs positively correlated with FGF19 expression were BRD-K99006945, PI-103, and AT7867; the top three drugs negatively correlated with FGF19 expression were afatinib, lapatinib, and linifanib (Figure 6(f), Supplemental Table 5). We also examined drug sensitivity results from the GDSC, where the drug positively correlated with FGF19 expression was JNJ-26854165, and the drug negatively correlated with FGF19 expression was VX-11e (Figure 6(h), Supplemental Table 6). For visual analysis, we also plotted the network diagram of FGF19-related chemotherapeutic drugs (Supplemental Figure 2(D)).

Relationship between FGF19 and tumor heterogeneity and between FGF19 and sensitivity to chemotherapeutic agents. (a) FGF19 mRNA in pan-cancer in relation to TMB. (b) FGF19 mRNA in pan-cancer in relation to MSI. (c) FGF19 mRNA in pan-cancer in relation to NEO. (d) FGF19 mRNA in pan-cancer in relation to MMR-related genes. p < 0.05 was statistically significant. (e) FGF19 mRNA in pan-cancer in relation to MATH. p < 0.05 was statistically significant. (f) Heat map of FGF19 and drug sensitivity correlation in CTPR database. p < 0.05 was statistically significant. p < 0.05 was statistically significant. (g) Network map of FGF19 and related chemotherapeutic drugs in CTPR database. (h) Heat map of FGF19 association with drug sensitivity in GDSC database. p < 0.05 was statistically significant.
Single cell analysis of FGF19 in CRC
To understand the predominant cell types expressing FGF19 within the cancer microenvironment, we performed single cell analysis using CRC samples from the GSE178341 dataset. We determined that the FGF19 gene is located on chromosome 11 and comprises three exons, spanning approximately 1821 bp. Genes interacting with FGF19 include FXR1, FGF2, and EGFR (Figure 7(a)). Figure 7(b) illustrates the distribution of all cells in CRC, while Figure 7(c) displays the distribution of FGF19 across these cells. Our analysis revealed that FGF19 is primarily expressed in squamous epithelial cells, myeloid cells, stromal cells, T cells, NK cells, and innate lymphoid cells (ILCs) (Supplemental Figure 2(E)). Additionally, we investigated the distribution of FGF19 among immune cells. Figure 7(d) shows the distribution of immune cells in CRC, and Figure 7(e) demonstrates the distribution of FGF19 within these immune cells. We found that FGF19 is mainly present in monocytes, cytotoxic T lymphocytes, cells expressing promyelocytic leukemia zinc finger protein, dendritic cells, and macrophages (Supplemental Figure 2(F)). Further, we specifically explored FGF19 distribution in T cells, NK cells, and ILCs. Figure 7(f) indicates the presence of T cells, NK cells, and ILCs in CRC, while Figure 7(g) highlights the distribution of FGF19 within these immune cells. FGF19 was predominantly found in cytotoxic T lymphocytes, CD4+ T cells, and cells expressing promyelocytic leukemia zinc finger protein (Supplemental Figure 2(G)). Given the significant presence of FGF19 in monocytes and cytotoxic T lymphocytes, we conducted a cell-interaction analysis for these cells in CRC. Initially, we compared single-cell sequencing data from various samples, ultimately selecting the CRC-101-03-1A sample for its high FGF19 expression (Supplemental Figure 2(H)). Considering that cytotoxic T lymphocytes primarily comprise CD8+ T cells, we analyzed the cellular interactions between monocytes and CD8+ T cells in the CRC-101-03-1A sample. Circos plots illustrating the interactions of monocytes and CD8+ T cells with other cells in CRC are shown in Figure 7(h), and dot plots detailing monocyte and CD8+ T cell interactions with other cells are presented in Figures 7(i) and Supplemental Figure 2(I), respectively.

Single-cell analysis of FGF19 in CRC. (a) Positional distribution of FGF19 mRNA on chromosomes and its interacting genes. (b) Distribution of all cells in CRC. (c) Distribution of FGF19 in all CRC cells. (d) Distribution of immune cells in CRC (e) Distribution of FGF19 in immune cells. (f) Distribution of T cells, NK cells, and Ilc cells in CRC. (g) Distribution of FGF19 in T cells, NK cells, and Ilc cells. (h) Circos plot of monocyte and CD8 + T cell interactions with other cells in CRC. (i) Punctate plot of monocyte interactions with other cells in CRC.
Discussion
Molecular targeted therapy and immunotherapy have played significant therapeutic roles for CRC in recent years. 41 For example, the development of immune checkpoint inhibitors has shown efficacy, but most CRC patients experience adverse events and do not benefit from them. 42 Therefore, further research into immune-related genes is necessary to improve the prognosis of CRC patients.
In the TCGA database, we obtained clinical and RNA sequencing data from 644 CRC patients, analyzed DEGs using the DESeq2 package, and studied DEGs associated with CRC patient prognosis using the Survival package. We also downloaded immune-related genes from the ImmPort database. A Venn diagram analysis of these datasets identified six genes, with FGF19 ultimately selected as the target gene based on its prognostic significance and expression levels in cancerous versus adjacent non-cancerous tissues. FGF19 is upregulated in various cancers and linked to poor outcomes, yet it is still under-investigated in CRC. According to both the GTEx and TCGA databases, FGF19 expression levels were higher in CRC tissues compared to normal tissues. This finding was validated using GSE41328, GSE110224, and a repeat analysis in GSE41328, which confirmed that FGF19 expression was increased in CRC tissues. FGF19 protein expression is elevated in CRC tissues, supporting the mRNA data from the HPA database. We observed that high FGF19 expression in CRC patients correlates with decreased overall survival, indicating a negative impact on prognosis. Our analysis revealed good diagnostic efficacy for FGF19 in CRC (AUC = 0.904). Furthermore, we found that FGF19 expression in CRC was associated with advanced T stage, N stage, M stage, and pathological stage. Higher FGF19 levels in CRC patients correlate with more advanced disease stages and poorer survival. Multivariate regression analysis identified age, M stage, pathological stage, and lymphatic invasion as independent risk factors for prognosis. FGF19 could serve as a biomarker for CRC diagnosis and prognosis, influencing outcomes through its association with advanced disease stages.
We have explored the impact of FGF19 on the prognosis and progression of CRC, prompting us to investigate the pathways through which FGF19 influences CRC. Analysis of FGF19-related genes via GO, KEGG, and GSEA revealed that FGF19 is linked to signal receptor activator activity, receptor-ligand activity, and protein heterodimerization. These functions are crucial in CRC formation, as many cellular processes, including those contributing to cancer development, depend on the interactions between signaling receptors, receptor ligands, and protein dimerization. Protein dimerization, which often occurs in cells, plays a significant role in various biological processes and cancer development,43–47 and proteomic studies have indicated that a large proportion of mammalian proteins function as dimers or multimers within cells. Thus, proper dimer formation is essential for maintaining a healthy proteome and overall body health. 48 Through KEGG and GSEA analyses, we identified that FGF19 is involved in pathways predominantly associated with tumors, such as the NET network, the Pi3K-Akt signaling pathway, regulation of insulin-like growth factor (Igf) transport, and the regulation of uptake by insulin-like growth factor binding proteins (Igfbps). NETs, fibrous mesh-like structures released into the extracellular space by neutrophils, 49 consist of components like nuclear DNA and granular proteins including matrix metalloproteinase-9, myeloperoxidase, neutrophil elastase, and cathepsin G. 50 NETs are prevalent in various malignant tumors. They are influenced by systemic tumor effects that regulate their expression. Two neutrophil phenotypes, anti-tumor N1 and tumorigenic N2, both capable of producing NETs, 51 are linked to cancer. NETs have been shown to promote the development of various cancers,52,53 and are specifically implicated in the progression and metastasis of CRC.54,55 Our analysis revealed a significant association between FGF19 and NETs-related gene sets, suggesting that FGF19 may influence CRC progression through its impact on NETs. Additionally, the Pi3K-Akt signaling pathway, 56 along with the insulin-like growth factor and its binding proteins, are known to be involved in cancer progression, indicating that FGF19 could influence CRC development through these pathways as well. Moreover, we identified the top three genes most associated with FGF19 in CRC as ALB, IL1B, and H3C12.
In this study, we analyzed four CRC gene sets from the cBioPortal database to investigate FGF19 variants. We found a low mutation frequency of 1.33%, with consistent rates of mutations and gene amplifications. A total of 18 mutation sites were identified between amino acids 0 and 216, with missense mutations being the most common. We also analyzed the relationship between specific CRC classifications and mutation count, finding that simple CRC adenocarcinoma had the highest mutation count. In contrast, other types of CRC adenocarcinoma had fewer mutations. We found that 62.96% of CRC samples in the COSMIC database exhibited missense mutations, the most common mutation type, consistent with cBioPortal findings. Among these, base substitutions were primarily C > T (46.15%). Through genetic variation analysis of FGF19 in CRC, we concluded that FGF19’s effects on CRC are not due to genetic mutations.
We found that FGF19 was mostly negatively correlated with various immune-infiltrating cells. Interestingly, FGF19 was positively correlated with NK cells, which are critical for inhibiting cancer progression. There are numerous immunosuppressive agents targeting the mechanisms involving NK cells. Prompted by this observation, we hypothesized that a factor might be inhibiting the action of NK cells. Literature reviews suggest that NETs could inhibit NK cell function. We also found that FGF19 was negatively correlated with CD8+ T cells. Studies have shown that NETs can encapsulate and coat tumor cells, protecting them from the cytotoxicity mediated by CD8+ T cells and NK cells. This mechanism hinders the interaction between immune cells and the surrounding tumor cells, further obstructing the control of tumor metastasis by immune cells. 57 FGF19 showed negative correlations with macrophages and dendritic cells, which are crucial for regulating anti-tumor immune responses. It has been documented that NETs can activate macrophages and dendritic cells (DCs) by up-regulating co-stimulatory molecules such as CD80 and CD86 early on (within 30 min). However, prolonged exposure to NETs leads to apoptosis in these cells. Furthermore, FGF19 is associated with negative correlations with various immune cells, including Tem cells, neutrophils, TH1 cells, TH2 cells, regulatory T cells (Treg), B cells, helper T cells, T cells, and cytotoxic cells. The relationship between NETs and these cells in the context of cancer remains unclear. Considering that NETs are associated with these immune cells in both healthy individuals and in autoimmune diseases,58,59 further research is needed to determine whether NETs also affect these cells during tumor development. We found a negative correlation between FGF19 expression and ESTIMATE scores in CRC, indicating that immune cell proportions decrease as FGF19 levels rise. Overall, the increase in FGF19 levels correlates with a decrease in most immune cells, suggesting that FGF19 may contribute to CRC development and progression by suppressing immune responses. FGF19 may promote CRC development by enhancing NET expression and inhibiting immune cell activity.
We investigated the relationship between FGF19 and immune checkpoints and found that FGF19 negatively correlated with most, but positively correlated with SIGLEC5 among eight key checkpoints. SIGLEC5 has already been shown to influence CRC and holds potential as an effective prognostic indicator. The positive correlation between FGF19 and SIGLEC5 suggests that their combined detection could serve as a reliable prognostic marker for CRC. Additionally, we explored the relationship between FGF19 and tumor heterogeneity. FGF19 was negatively correlated with TMB, MSI, NEO, and MMR, indicating that FGF19 is not highly sensitive to immunosuppressive agents. Furthermore, analysis of FGF19 and MATH showed a positive correlation, suggesting that higher FGF19 levels are associated with greater tumor heterogeneity in CRC. This increased heterogeneity is less conducive to the success of immunotherapy. Given FGF19’s insensitivity to immunosuppressive agents, we analyzed its sensitivity to drugs using the GDSA and CTRP databases. In the CTRP database, FGF19 was found to be highly sensitive to BRD-K99006945, PI-103, and AT7867, while in the GDSA database, it was highly sensitive to JNJ-26854165. These findings suggest that the therapeutic potential of these drugs in CRC patients warrants further investigation to validate their efficacy and broaden their scope of use.
Finally, we analyzed the single-cell distribution of FGF19 and found that it is primarily located in squamous epithelial cells, pith cells, stromal cells, T cells, NK cells, and innate lymphocytes. Myeloid cells, which include erythrocytes, granulocytes, monocytes, and macrophages, were also examined. FGF19 may be distributed around granulocytes to promote the formation of NETs and around NK cells to inhibit their function. Further analysis of FGF19 in CRC immune cells revealed that it is primarily distributed around monocytes, cytotoxic T lymphocytes, promyelocytic leukemia zinc finger protein, dendritic cells, and macrophages. Its distribution near CD8+ T cells and macrophages may contribute to NET formation and provide protective effects for tumor cells. Additionally, we explored FGF19 distribution in T cells, NK cells, and innate lymphocytes and found that it is mainly localized around cytotoxic T lymphocytes, CD4+ T cells, and promyelocytic leukemia zinc finger protein.
The study has several limitations. First, although FGF19 expression in CRC was analyzed using bioinformatics and validated through qPCR, further in vitro and in vivo studies are necessary. Second, we hypothesize that FGF19 may promote CRC by suppressing immune cells through the formation of NETs; however, this requires additional validation. Lastly, the mechanisms underlying FGF19’s role in CRC immunity and tumor progression remain unclear and necessitate further investigation.
Conclusion
In summary, FGF19 is significantly overexpressed in CRC tissues compared to normal tissues. Elevated levels of FGF19 are associated with advanced N stage, M stage, and pathological stage, as well as poorer prognosis in CRC. FGF19 may facilitate the occurrence and progression of CRC by suppressing immune cell activity through the promotion of NETs formation. Furthermore, FGF19 exhibits a negative correlation with most immune cells in CRC, indicating its potential as a target for molecular inhibitor development. We believe that further investigation into FGF19 will yield substantial benefits for CRC patients, alleviating their suffering and enhancing treatment outcomes.
Supplemental Material
sj-docx-5-iji-10.1177_03946320251324401 – Supplemental material for FGF19 is a biomarker associated with prognosis and immunity in colorectal cancer
Supplemental material, sj-docx-5-iji-10.1177_03946320251324401 for FGF19 is a biomarker associated with prognosis and immunity in colorectal cancer by Peng Wang, Zhenpeng Zhu, Chenyang Hou, Dandan Xu, Fei Guo, Xuejun Zhi, Weizheng Liang and Jun Xue in International Journal of Immunopathology and Pharmacology
Supplemental Material
sj-tif-1-iji-10.1177_03946320251324401 – Supplemental material for FGF19 is a biomarker associated with prognosis and immunity in colorectal cancer
Supplemental material, sj-tif-1-iji-10.1177_03946320251324401 for FGF19 is a biomarker associated with prognosis and immunity in colorectal cancer by Peng Wang, Zhenpeng Zhu, Chenyang Hou, Dandan Xu, Fei Guo, Xuejun Zhi, Weizheng Liang and Jun Xue in International Journal of Immunopathology and Pharmacology
Supplemental Material
sj-tif-2-iji-10.1177_03946320251324401 – Supplemental material for FGF19 is a biomarker associated with prognosis and immunity in colorectal cancer
Supplemental material, sj-tif-2-iji-10.1177_03946320251324401 for FGF19 is a biomarker associated with prognosis and immunity in colorectal cancer by Peng Wang, Zhenpeng Zhu, Chenyang Hou, Dandan Xu, Fei Guo, Xuejun Zhi, Weizheng Liang and Jun Xue in International Journal of Immunopathology and Pharmacology
Supplemental Material
sj-tif-3-iji-10.1177_03946320251324401 – Supplemental material for FGF19 is a biomarker associated with prognosis and immunity in colorectal cancer
Supplemental material, sj-tif-3-iji-10.1177_03946320251324401 for FGF19 is a biomarker associated with prognosis and immunity in colorectal cancer by Peng Wang, Zhenpeng Zhu, Chenyang Hou, Dandan Xu, Fei Guo, Xuejun Zhi, Weizheng Liang and Jun Xue in International Journal of Immunopathology and Pharmacology
Supplemental Material
sj-tif-4-iji-10.1177_03946320251324401 – Supplemental material for FGF19 is a biomarker associated with prognosis and immunity in colorectal cancer
Supplemental material, sj-tif-4-iji-10.1177_03946320251324401 for FGF19 is a biomarker associated with prognosis and immunity in colorectal cancer by Peng Wang, Zhenpeng Zhu, Chenyang Hou, Dandan Xu, Fei Guo, Xuejun Zhi, Weizheng Liang and Jun Xue in International Journal of Immunopathology and Pharmacology
Supplemental Material
sj-xlsx-10-iji-10.1177_03946320251324401 – Supplemental material for FGF19 is a biomarker associated with prognosis and immunity in colorectal cancer
Supplemental material, sj-xlsx-10-iji-10.1177_03946320251324401 for FGF19 is a biomarker associated with prognosis and immunity in colorectal cancer by Peng Wang, Zhenpeng Zhu, Chenyang Hou, Dandan Xu, Fei Guo, Xuejun Zhi, Weizheng Liang and Jun Xue in International Journal of Immunopathology and Pharmacology
Supplemental Material
sj-xlsx-11-iji-10.1177_03946320251324401 – Supplemental material for FGF19 is a biomarker associated with prognosis and immunity in colorectal cancer
Supplemental material, sj-xlsx-11-iji-10.1177_03946320251324401 for FGF19 is a biomarker associated with prognosis and immunity in colorectal cancer by Peng Wang, Zhenpeng Zhu, Chenyang Hou, Dandan Xu, Fei Guo, Xuejun Zhi, Weizheng Liang and Jun Xue in International Journal of Immunopathology and Pharmacology
Supplemental Material
sj-xlsx-6-iji-10.1177_03946320251324401 – Supplemental material for FGF19 is a biomarker associated with prognosis and immunity in colorectal cancer
Supplemental material, sj-xlsx-6-iji-10.1177_03946320251324401 for FGF19 is a biomarker associated with prognosis and immunity in colorectal cancer by Peng Wang, Zhenpeng Zhu, Chenyang Hou, Dandan Xu, Fei Guo, Xuejun Zhi, Weizheng Liang and Jun Xue in International Journal of Immunopathology and Pharmacology
Supplemental Material
sj-xlsx-7-iji-10.1177_03946320251324401 – Supplemental material for FGF19 is a biomarker associated with prognosis and immunity in colorectal cancer
Supplemental material, sj-xlsx-7-iji-10.1177_03946320251324401 for FGF19 is a biomarker associated with prognosis and immunity in colorectal cancer by Peng Wang, Zhenpeng Zhu, Chenyang Hou, Dandan Xu, Fei Guo, Xuejun Zhi, Weizheng Liang and Jun Xue in International Journal of Immunopathology and Pharmacology
Supplemental Material
sj-xlsx-8-iji-10.1177_03946320251324401 – Supplemental material for FGF19 is a biomarker associated with prognosis and immunity in colorectal cancer
Supplemental material, sj-xlsx-8-iji-10.1177_03946320251324401 for FGF19 is a biomarker associated with prognosis and immunity in colorectal cancer by Peng Wang, Zhenpeng Zhu, Chenyang Hou, Dandan Xu, Fei Guo, Xuejun Zhi, Weizheng Liang and Jun Xue in International Journal of Immunopathology and Pharmacology
Supplemental Material
sj-xlsx-9-iji-10.1177_03946320251324401 – Supplemental material for FGF19 is a biomarker associated with prognosis and immunity in colorectal cancer
Supplemental material, sj-xlsx-9-iji-10.1177_03946320251324401 for FGF19 is a biomarker associated with prognosis and immunity in colorectal cancer by Peng Wang, Zhenpeng Zhu, Chenyang Hou, Dandan Xu, Fei Guo, Xuejun Zhi, Weizheng Liang and Jun Xue in International Journal of Immunopathology and Pharmacology
Footnotes
Acknowledgements
We thank The First Affiliated Hospital of Hebei North University for their approval of the study. We would like to express my sincere gratitude to Mrs Xiran Wang for her meticulous review and revision of the article. This study was supported by the Zhangjiakou City Key R&D Plan Project (No.2322088D, No.2421118D and No.2311038D), Medical Science Research Subject Plan Project of Hebei Provincial Health Commission (No.20240805 and No.20240782), Natural Science Project of Hebei North University (No.XJ2024034 and No.XJ2024035), Hebei Health Commission Scientific Research Foundation Project (No.20240240), Hebei Provincial Administration of Traditional Chinese Medicine Research Project (No.2024062), Hebei Provincial Administration of Traditional Chinese Medicine Project (No.2022147 and No.2023331), Central Government Guides Local Science and Technology Development Fund Projects (No.246Z7768G), Hebei Provincial Administration of Traditional Chinese Medicine Project (No.2025392 and No.2025395), Hebei North University 2024 school-level cultivation research project (XJPY2024026), Medical Science Research Subjects of Hebei Provincial Health and Wellness Commission (No.20251351), Hebei Province Innovation Capacity Enhancement Program Project (No.24457711K), The Provincial Funding Project for Cultivating the Innovation Ability of Postgraduate Students Reading in 2025 (CXZZSS2025120), 2025 Hebei Province Graduate Education Project (CX202410), Research Project of Medical Innovation for Chinese Youth (Project Leader: Jun Xue). Research Project of Medical Innovation for Chinese Youth (Project Leader: Xuejun Zhi).
Author contributions
Weizheng Liang: Conceptualization, funding acquisition. Jun Xue and Xuejun Zhi: Supervision, funding acquisition. Peng Wang: Data curation, Writing-Original draft preparation. Zhenpeng Zhu: Methodology, Software. Chenyang Hou: Writing - Reviewing and Editing. Dandan Xu: Software, Validation, funding acquisition. Fei Guo: Supervision. All authors have reviewed the results and approved the final version of the manuscript.
Declaration of conflicting interests
The author(s) declared no potential conflicts of interest with respect to the research, authorship, and/or publication of this article.
Funding
The author(s) disclosed receipt of the following financial support for the research, authorship, and/or publication of this article: This study was supported by2025 Government-funded Training Project for Outstanding Clinical Medicine Talents (ZF2025264).
Ethical considerations
The study was approved by the Ethics Committee of the First Affiliated Hospital of Hebei North University (Approval No. K2024147).
Consent to participate
Written informed consent was obtained from all subjects before the study.
Consent for publication
Not applicable.
Trial registration
Not applicable.
Supplemental material
Supplemental material for this article is available online.
References
Supplementary Material
Please find the following supplemental material available below.
For Open Access articles published under a Creative Commons License, all supplemental material carries the same license as the article it is associated with.
For non-Open Access articles published, all supplemental material carries a non-exclusive license, and permission requests for re-use of supplemental material or any part of supplemental material shall be sent directly to the copyright owner as specified in the copyright notice associated with the article.