
Abstract
This study demonstrates a low-cost, portable diagnostic system for rapid antimicrobial susceptibility testing in resource-limited settings. To determine the antimicrobial resistance phenotypically, the growth of pathogens in microwell arrays is detected under different antibiotic conditions. The use of a colorimetric cell viability reagent is shown to significantly improve the sensitivity of the assay compared with standard absorbance spectroscopy. Gas-permeable microwell arrays are incorporated for facilitating rapid bacterial growth and eliminating the requirement of bulky supporting equipment. Antibiotics can also be precoated in the microwell array to simplify the assay protocol toward point-of-care applications. Furthermore, a low-cost cell phone–based microphotometric system is developed for detecting the bacterial growth in the microwell array. By optimizing the operating conditions, the system allows antimicrobial susceptibility testing for samples with initial concentrations from 101 to 106 cfu/mL. Using urinary tract infection as the model system, we demonstrate rapid antimicrobial resistance profiling for uropathogens in both culture media and urine. With its simplicity and cost-effectiveness, the cell phone–based microphotometric system is anticipated to have broad applicability in resource-limited settings toward the management of infectious diseases caused by multidrug-resistant pathogens.
Introduction
The increased prevalence of infectious diseases caused by multidrug-resistant pathogens is a major global health problem.1,2 Growing demand for rapid and accurate antimicrobial susceptibility testing (AST) techniques has paralleled the significant increase in the number of multidrug-resistant pathogens, such as ciprofloxacin-resistant Escherichia coli, methicillin-resistant Staphylococcus aureus, and extended-spectrum β-lactamase–producing Enterobacteriaceae. 3 These pathogens are known to cause serious infections in high-risk areas and management challenges in nontraditional health care settings. As early and appropriate antimicrobial treatment targeting these bacteria can significantly reduce the infection-associated morbidity and mortality, there is a clear need for developing rapid and reliable AST approaches. This capability will allow health care providers to make informed decisions about the use of antibiotics.4,5 The proper usage of antibiotics will in turn reduce the emergence of multidrug-resistant pathogens, which are largely driven by the widespread use of antibiotics worldwide.
Conventional approaches for phenotypic AST include agar/disk diffusion and broth dilution. 6 These assays are inexpensive but are time-consuming and labor intensive. In the clinical microbiology laboratory, automated test methods, such as spectroscopic, turbidometric, cytometric, and colorimetric assays, have been introduced to simplify the labor-intensive procedures for AST. 7 These methods generally measure the concentration of bacteria or their activity. However, the systems for performing these tests are usually expensive and have large footprints, which are not suitable for applications outside the centralized clinical microbiology laboratory. Furthermore, these techniques require a bacteria isolation step, which involves overnight or even longer culture. A low-cost, portable system that is capable of AST directly with physiological samples in resource-limited settings is therefore highly sought after.
To address the global challenge of multidrug-resistant pathogens, innovative biosensing and microfluidic approaches have been developed for rapid AST.8–10 For instance, microfluidic stochastic confinement has provided a novel approach for determining antibiotic resistance at the single-cell level. 11 In this approach, antibiotic resistance of bacteria can be determined in 7.5 h using a fluorescence indicator. Gas-permeable polydimethylsiloxane (PDMS) microchannels with high surface-to-volume ratios have also been demonstrated to perform AST in 2 h. 12 To enable point-of-care applications, an electrochemical biosensor has been demonstrated to determine the pathogen antibiotic resistance profiles from clinical urine samples within 3.5 h. 13 Furthermore, impedance spectroscopy can also be applied to detect the bactericidal and bacteriostatic effect of antibiotics. 14 Recently, single-cell AST approaches with agarose or microfluidic confinements have also been reported.15,16 An alternative approach to avoid bulky, expensive optical equipment is to develop cell phone–based diagnostic systems. With proper modification, a cell phone can be transformed into a microscope or visible light spectrometer.17–19 For instance, camera-enabled cell phones can be integrated with mobile applications for immediate data processing in microchip enzyme-linked immunosorbent assay. 18 Despite their potential, the applicability of cell phone–based diagnostic systems for rapid AST in resource-limited settings has not been explored. The challenges of sensitivity, system integration, and complicated sample preparation procedures should be addressed systematically toward cell phone–based AST in resource-limited settings.
In this study, we develop a rapid AST system that can be deployed in resource-limited settings by incorporating gas-permeable microwell arrays, a colorimetric cell viability reagent, and a cell phone–based microphotometric system. In the rapid AST system, bacteria are cultured in gas-permeable microwell arrays to allow rapid bacterial growth without the requirement of oxygenation or external agitation. 12 To simplify the assay protocol, appropriate antibiotics are precoated on the wall of the microwells. In the microwell array, a light yellow cell viability reagent, water-soluble tetrazolium salts-8 (WST-8), is reduced by the metabolic activity of the bacteria to produce the soluble orange formazan dye. 20 The amount of the formazan dye, which exhibits a maximum absorbance at 450 nm, is quantified using an iPhone-based microphotometric system (iPhotometer). The applicability of the system is demonstrated by rapid antimicrobial resistance profiling of pathogens from patients with urinary tract infection (UTI).
Materials and Methods
iPhotometer
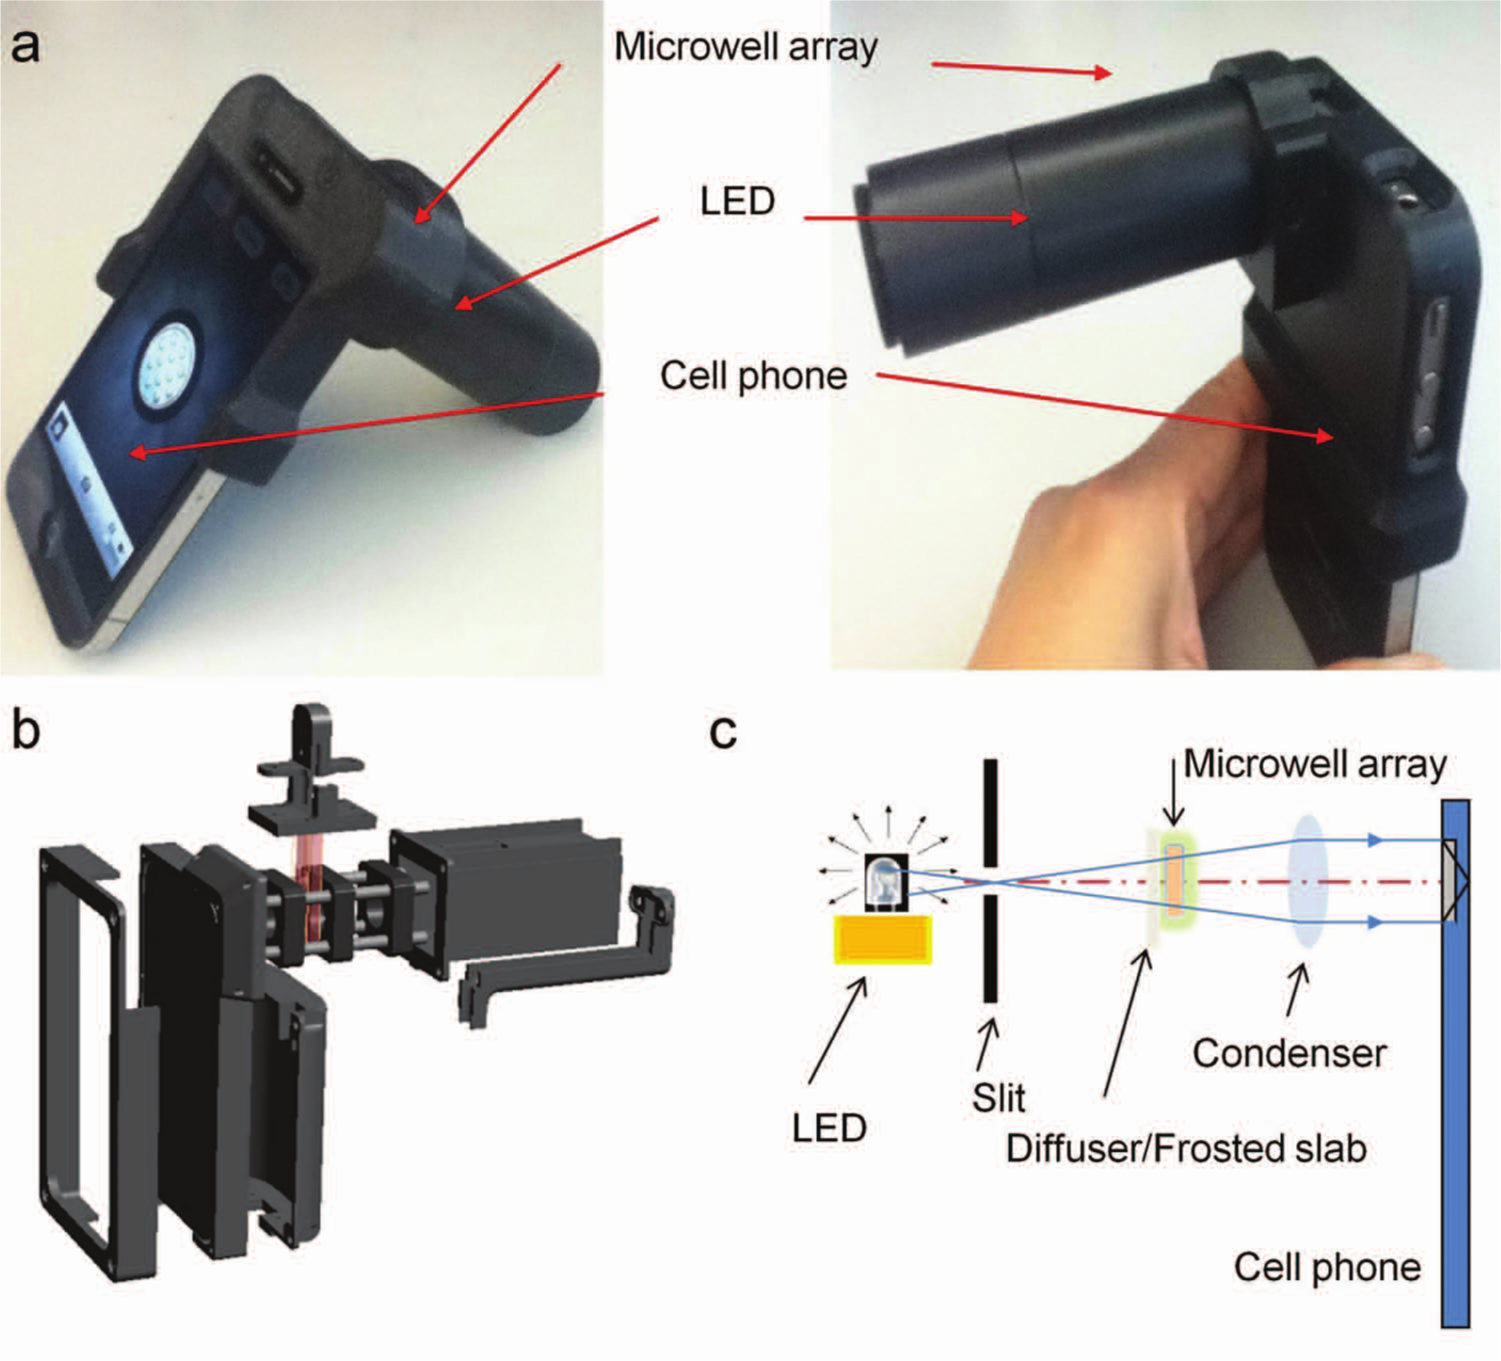
The iPhotometer consisted of a rapid prototyped housing for aligning the cell phone, the optical components, and the microwell array ( Fig. 1a ). The housing was designed using Solidworks 2010 (Solidworks, Waltham, MA) and stereolithographically printed using a Dimension 1200ES 3D printer (Stratasys, Rancho Cucamonga, CA) with acrylonitrile butadiene styrene polymer. The housing included a lens tube for holding the lens, and an iPhone (fourth generation; Apple, Cupertino, CA) was inserted into the housing ( Fig. 1b ). Background irradiation requirements were fulfilled with a 3 mm diameter white LED (Sparkfun Electronics, Boulder, CO) housed in a rear portion of the tube. The white LED light source emitted light, which passed through a narrow slit ( Fig. 1c ). The light continued to travel through a diffuser/frosted slab to the microwell array with samples. A condenser lens was placed in front of the cell phone camera to gather sufficient light, which was collimated before it reached the camera. The camera then collected the transmitted light. The intensity values were stored in the images, which were analyzed using NIH ImageJ. The intensity of the blue channel was used for absorbance measurement.
(
Microwell Fabrication
A CO2 laser machining system (Universal Laser Systems Inc., Scottsdale, AZ) was applied to engrave the mold on a polycarbonate substrate. A negative mold was then formed by urethane molding. A second molding process was performed to create the gas-permeable PDMS microwells. The microwell chip consisted of a 4 × 4 array of circular wells (
Fig. 2
). The top of the microwell was covered with a piece of 2 mm thick PDMS during incubation to avoid evaporation and contamination (see supporting information in
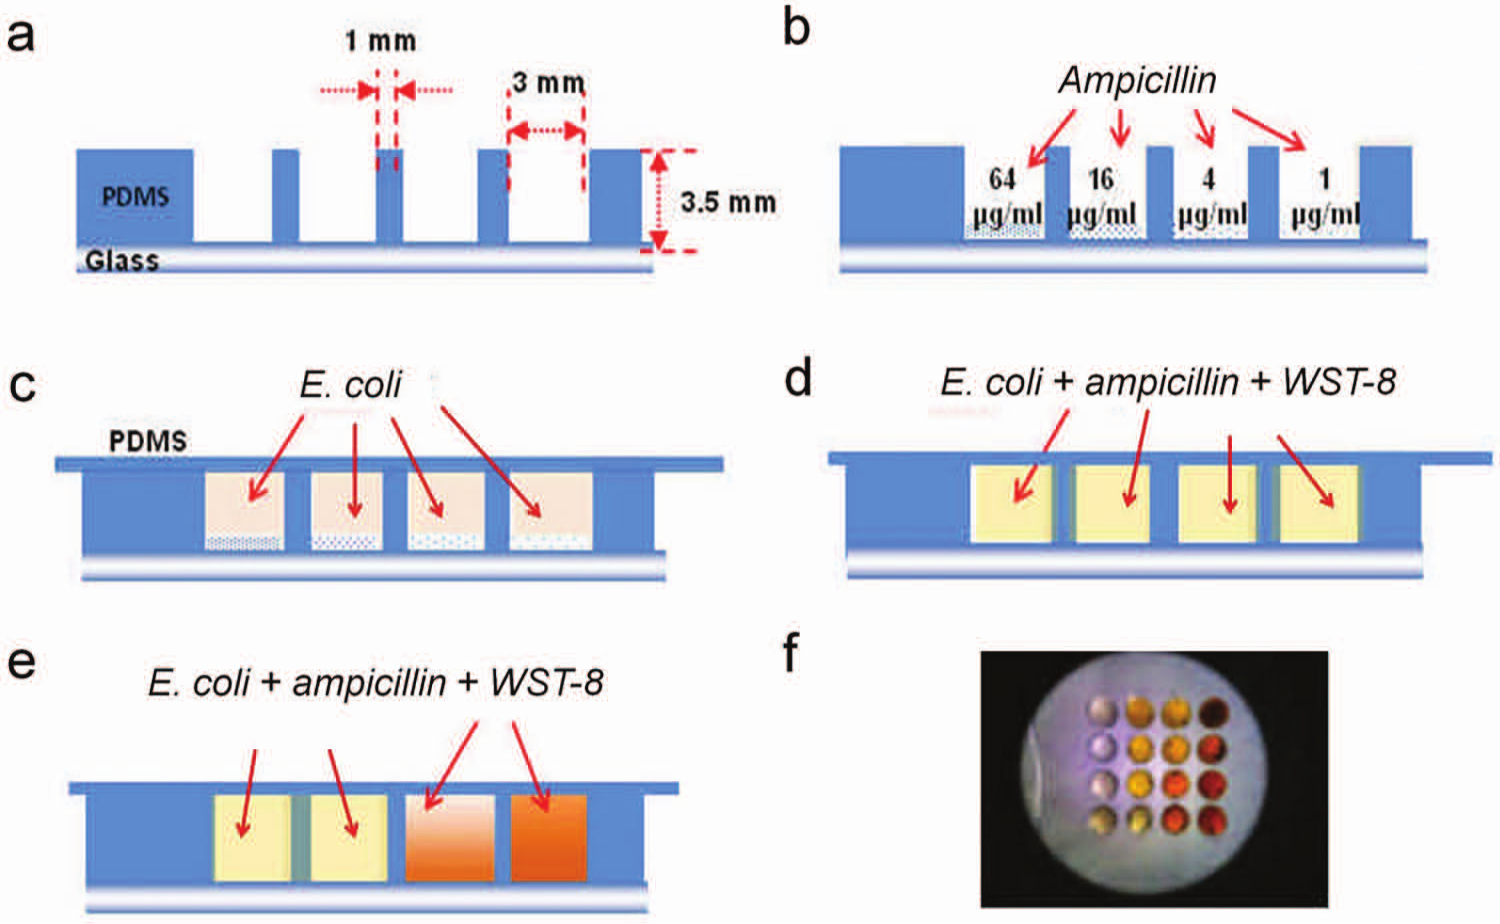
Polydimethylsiloxane microwell assay with precoated antibiotics for minimum inhibitory concentration determination and antimicrobial resistance profiling. (
Pathogens and Reagents
In this study, common antimicrobial agents for UTI treatment including ampicillin (AMP), ciprofloxacin (CIP), and trimethoprim/sulfamethoxazole (SXT) were investigated. Four uropathogenic E. coli strains (EC132, EC136, EC137, and EC462) were isolated from clinical urine samples from patients with UTI, as part of a research protocol approved by the Stanford University Institutional Review Board. The antimicrobial resistance profiles of these pathogens were previously determined by the clinical microbiology laboratory. 13 EC132 is resistant to AMP and CIP but not SXT. EC136 is resistant to AMP only. EC137 is sensitive to all the antibiotics tested. EC462 is resistant to AMP and SXT but not CIP. The bacteria were cultured in Mueller-Hinton (MH) broth (Difco Laboratories, Detroit, MI). The water-soluble tetrazolium salt, 2-(2-methoxy-4-nitrophenyl)-3-(4-nitrophenyl)-5-(2,4-disulfophenyl)-2H-tetrazolium, monosodium salt (WST-8) was chosen as the colorimetric cell viability reagent to increase the overall sensitivity of the system.20,21 The assay kit included the WST-8 solution and an electron mediator reagent. The WST-8 solution was mixed with the electron mediator at a ratio of 9:1.
Antimicrobial Susceptibility Testing
To perform the proliferation assay, E. coli freshly grown on agar were suspended in prewarmed (37 °C) MH broth. The samples were incubated in an orbital shaker at 37 °C with 120 rpm. The absorbance of the culture was monitored with a spectrophotometer (Nanodrop 2000, Thermo Scientific, Waltham, MA) at 600 nm until a value of 0.1 (approximately 2.5 × 10⁸ cfu/mL) was reached. The sample was then diluted serially from 1.5 × 10⁷ cfu/mL to 1.5 × 101 cfu/mL with MH broth and incubated at 37 °C for 6 h. The absorbance values of the samples were then measured after 2 h of incubation with WST-8. In the proliferation assay, the absorbance values were measured every hour for 7 h. Determination of minimum inhibitory concentration (MIC) was performed using AMP against bacterial strain E. coli in three different incubation conditions: (A) centrifugal tube, (B) PDMS microwell, and (C) PDMS microwell with antibiotics dehydrated. For centrifugal tube and PDMS microwell, a twofold serial dilution of AMP was performed in MH broth. For the microwell with precoated antibiotics, the wells were incubated with serially diluted antibiotics added to each well of the microwell chip and allowed to air dry for a few hours. For antimicrobial resistance profiling experiments, the wells were precoated with different antibiotics. The concentrations of antibiotics applied were 128 µg/mL (AMP), 4 µg/mL (CIP), and 16/304 µg/mL (SXT). Precoated chips were used within 24 h in this study. After incubation with WST-8, an image of the PDMS microwell array was captured using the iPhotometer, and the absorbance was determined using the intensity of the blue channel. Experiments were done in triplicate and reported as mean ± SD.
Results and Discussion
Cell Viability Reagent
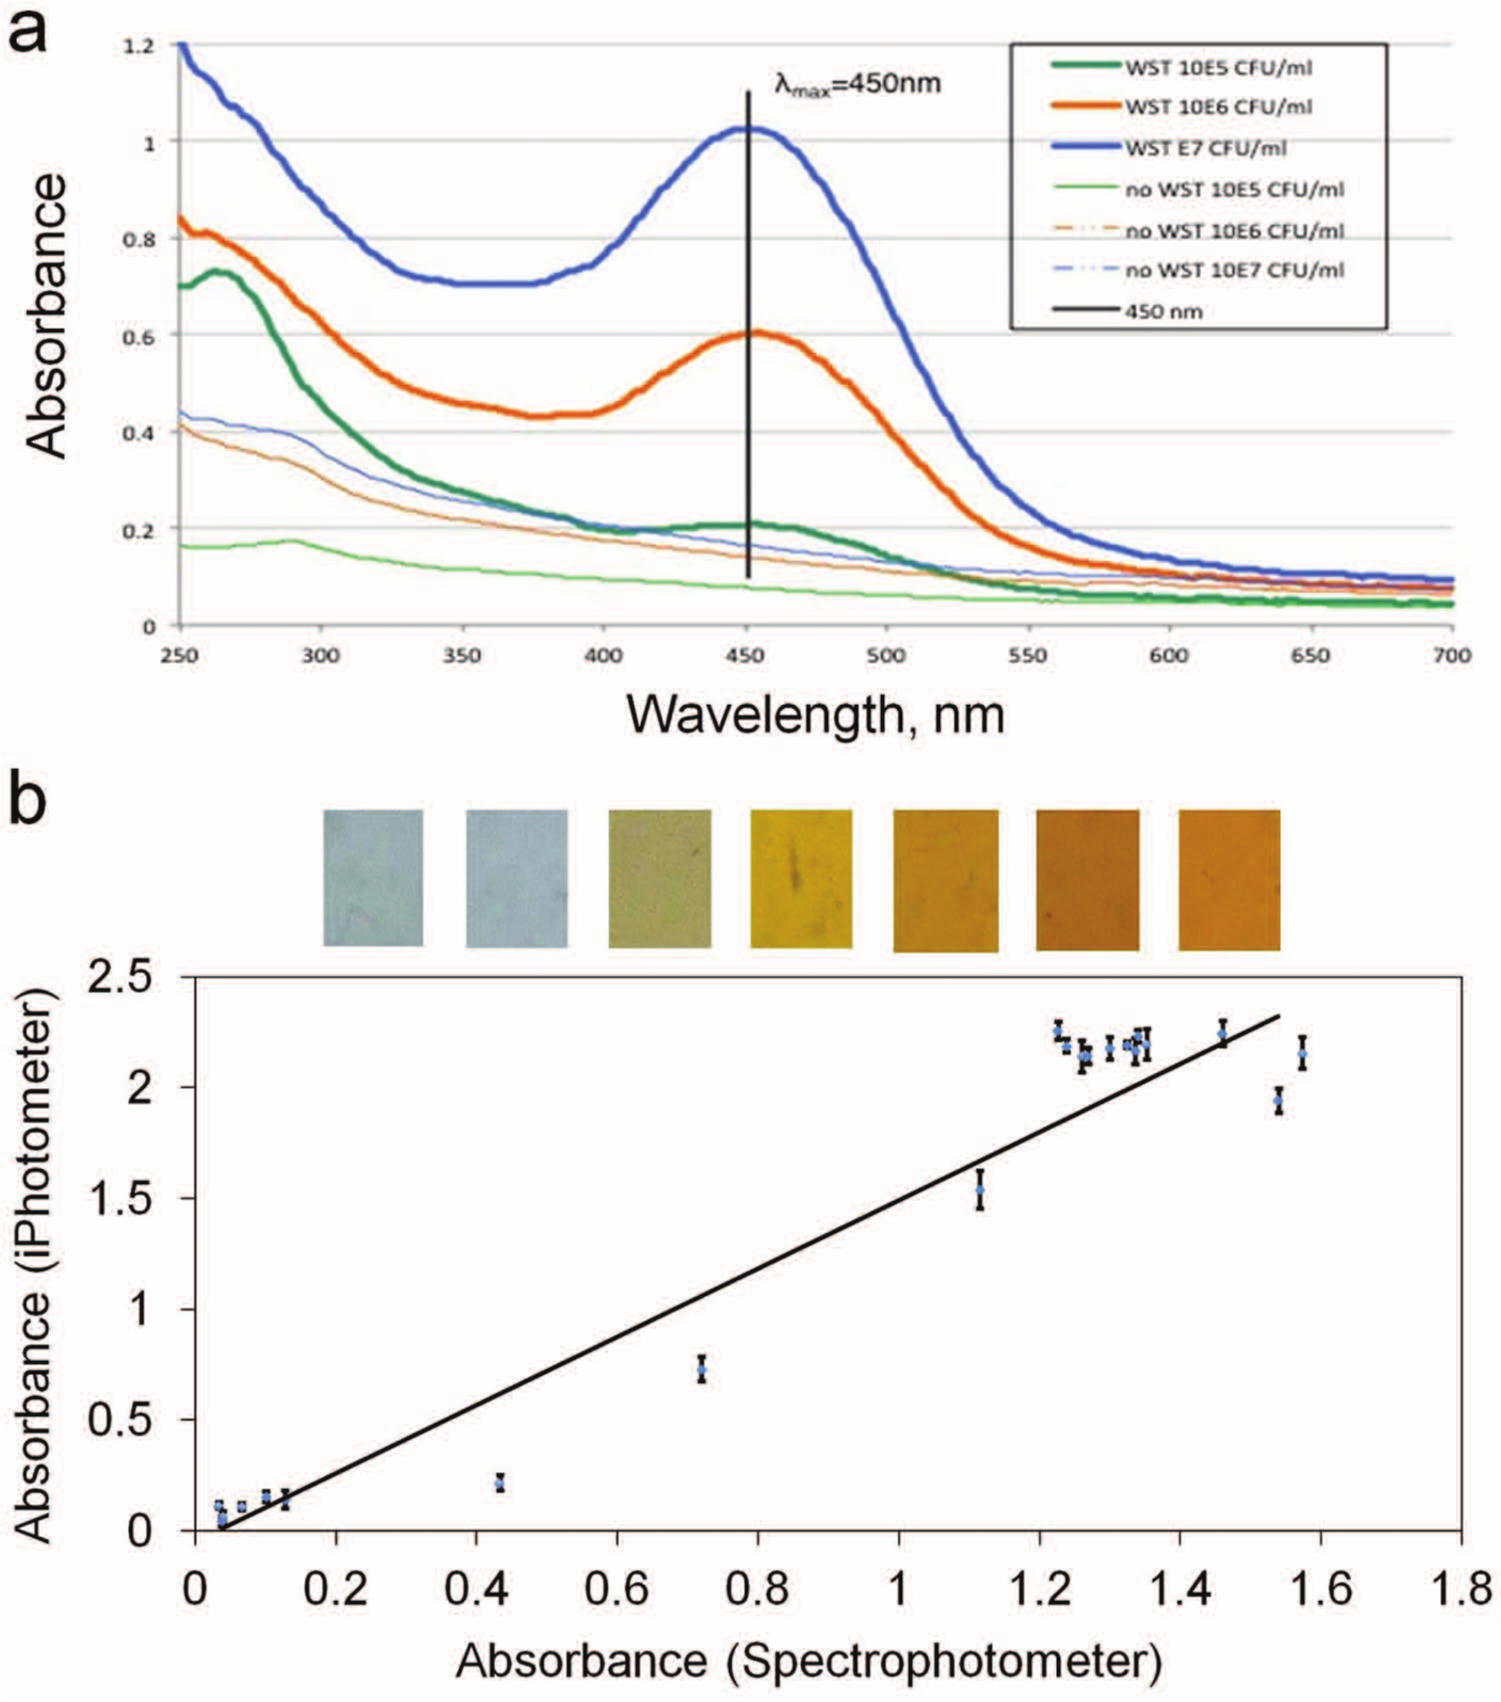
We first evaluated the performance of the WST-8 reagent for estimating the concentration of the bacteria. In particular, we performed an E. coli proliferation assay with various initial concentrations of bacteria. In the experiment, the absorbance values for bacteria samples with and without WST-8 reagent were observed using the Nanodrop spectrophotometer ( Fig. 3a ). For samples without WST-8, the absorbance was relatively low, and the initial concentrations of the bacteria could be distinguished consistently only at relatively high concentrations. Because the cell viability reagent exhibited the highest absorbance at ~450 nm, the intensity of the blue channel was chosen for absorbance measurement using the iPhotometer. A significantly higher absorbance (up to eightfold increase) was observed with the same bacteria concentrations. Therefore, these results indicate that the WST assay can improve the sensitivity of the assay, consistent with previous studies.20,21 The high absorbance values will facilitate the implementation of the assay using the iPhotometer.
(
Absorbance Measurement Using iPhotometer
The absorbance, A, of a sample can be described by the Lambert-Beer law (equation 1).


where ϵ is the specific extinction coefficient of the absorbing substance at the selected wavelength, b is the path length, and c is the analyte concentration. Because the camera of the iPhone does not measure the absorbance directly, the intensity value should be converted to absorbance. The absorbance can be expressed in terms of the transmission, T, which is linearly proportional to the intensity, I. Isample, Idark, and Iref are the intensity with the sample, the background intensity, and the reference intensity without the sample. The background intensity can be obtained by switching off the LED. By comparing the intensity of the light source with and without the sample in the light path, the absorbance can be determined. 22 To evaluate the performance of the iPhotometer, E. coli samples cultured with WST-8 for different durations were applied to calibrate the system. The absorbance measurements were taken simultaneously with both the iPhotometer and Nanodrop spectrophotometer at 450 nm for comparison. As shown in Figure 3b , the absorbance values correlated with each other and showed an approximately linear relationship between the systems, with error up to 15% of the full-scale value. The Pearson product-moment correlation coefficient is estimated to be 0.9662. The factor between the absorbance values could be a result of the different wavelengths considered in the instruments. The error of the measurement is possibly due to the uncertainties and uniformities of the illumination, optics, and the camera. Nevertheless, these data suggest that the iPhotometer is capable of performing absorbance measurements for monitoring bacterial growth.
Bacterial Proliferation Assay
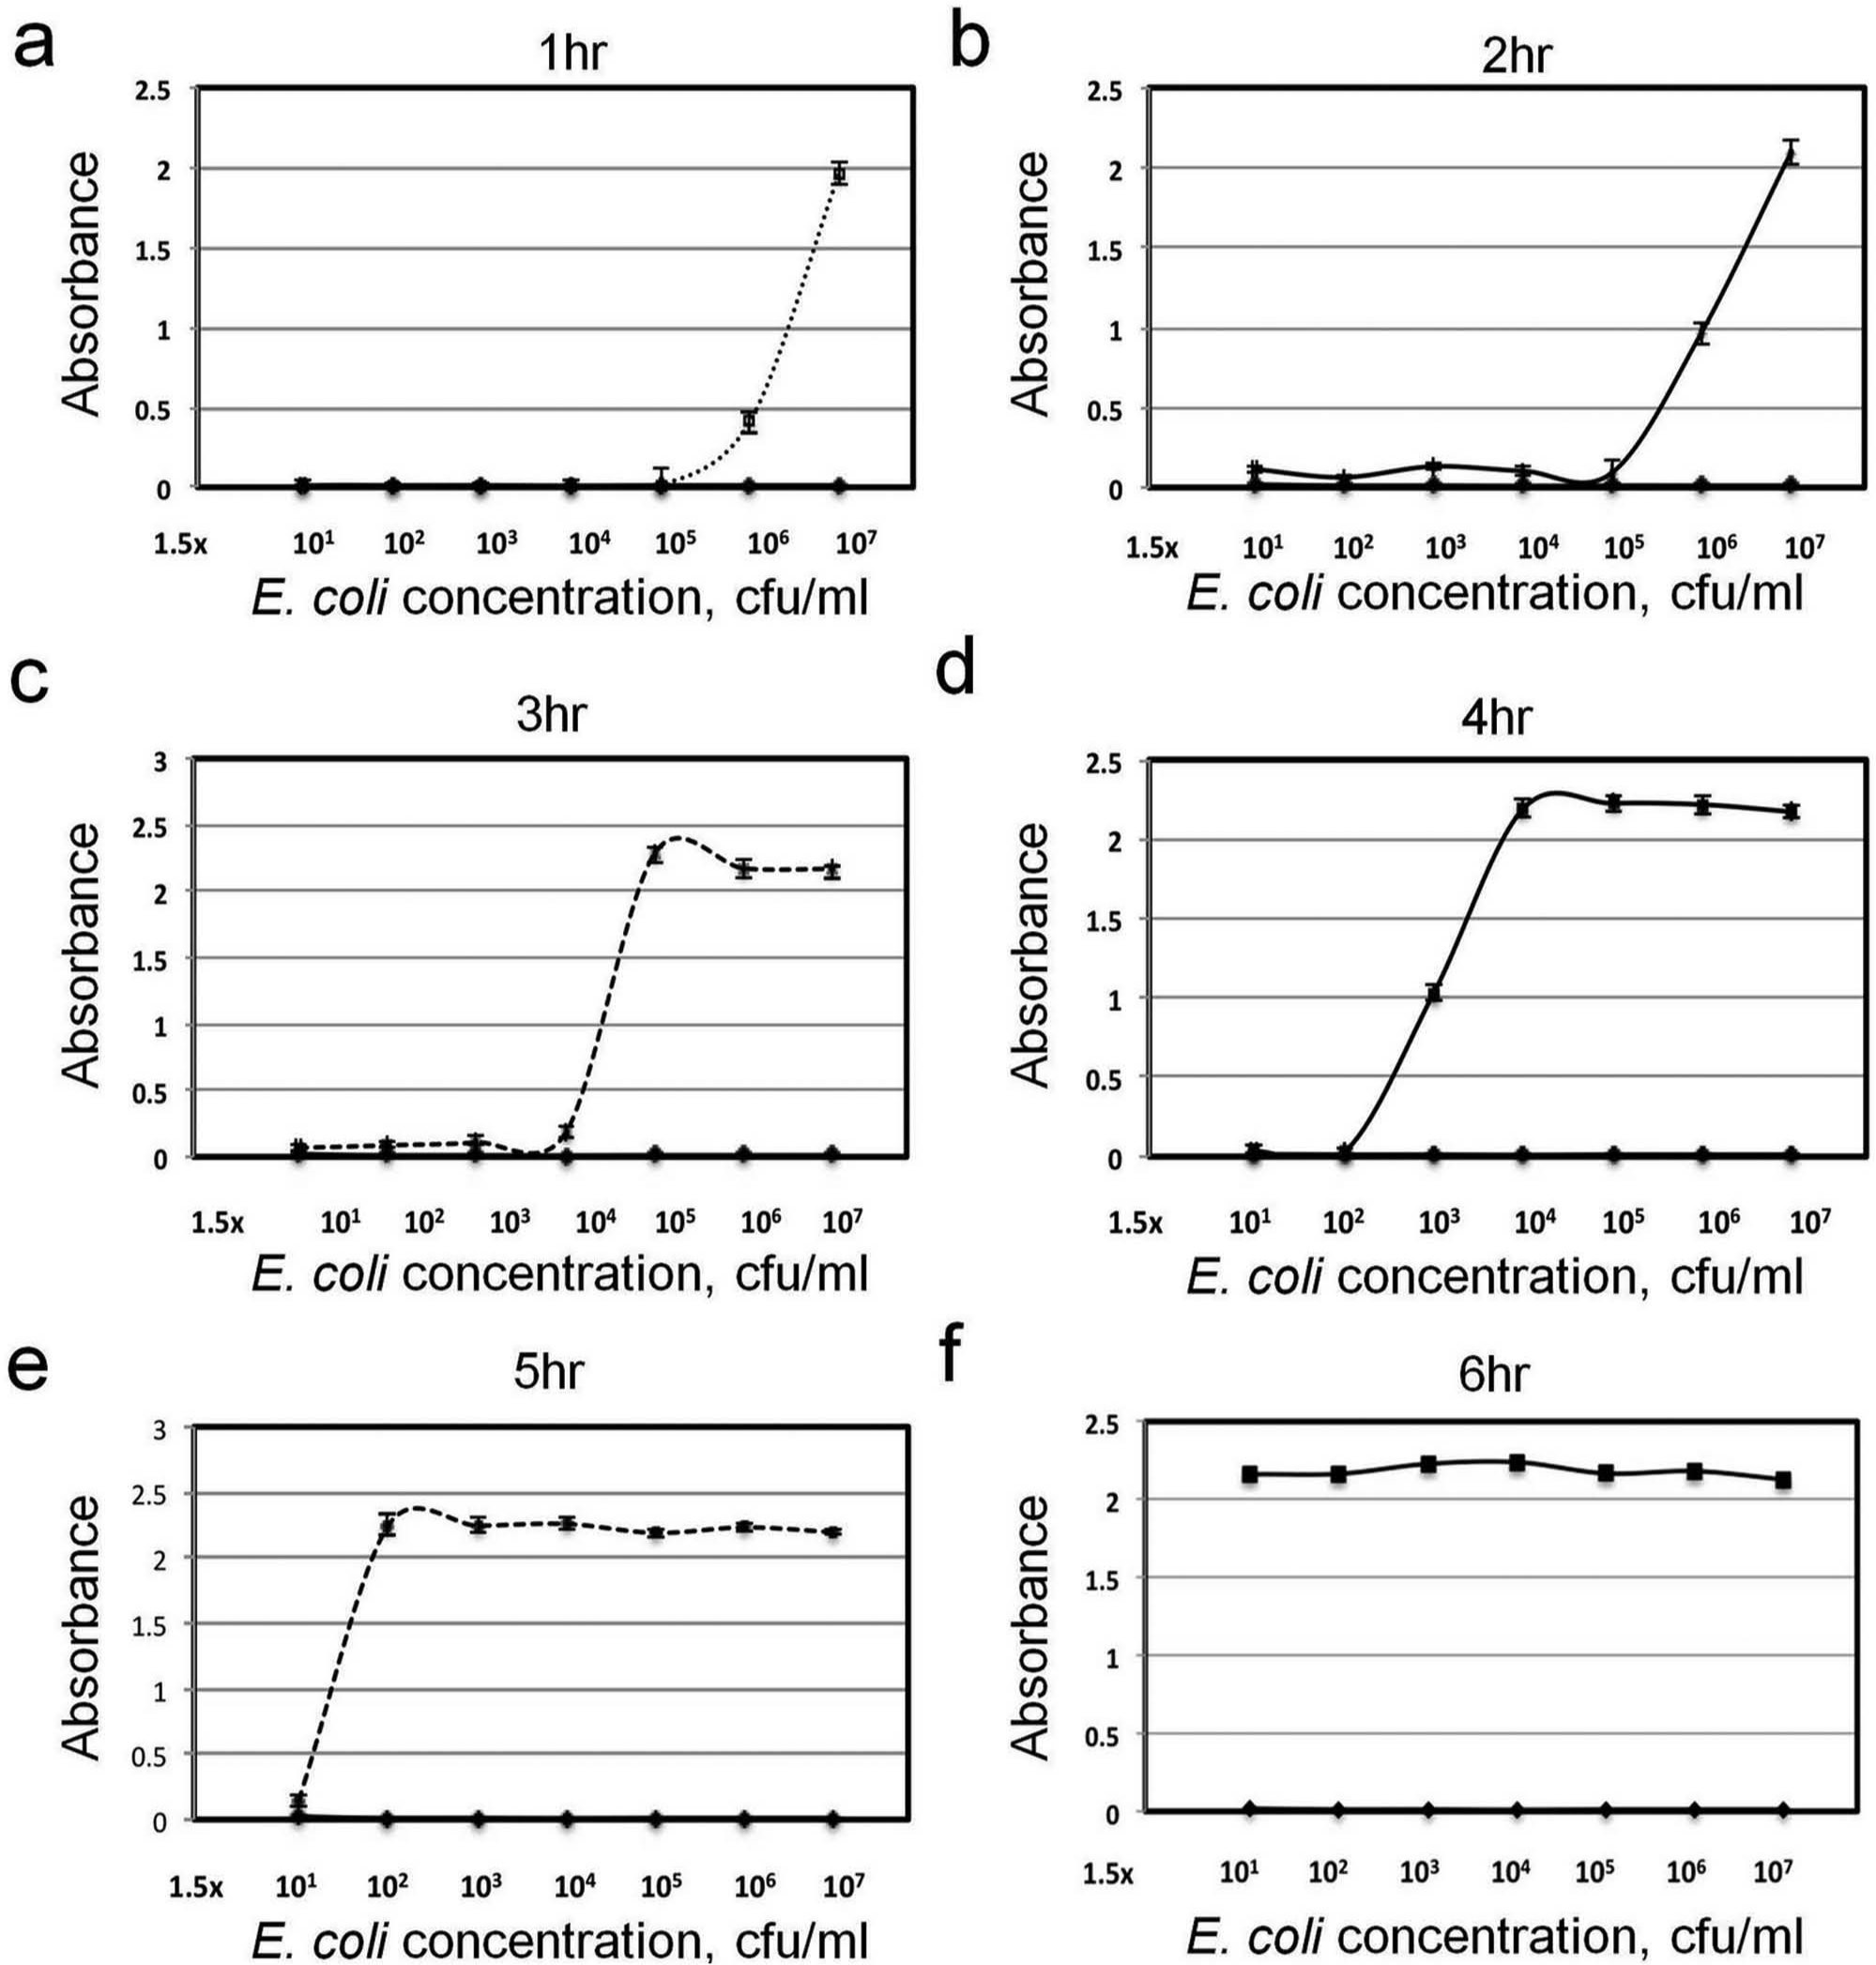
To further evaluate the performance of the iPhotometer and optimize the assay protocol for rapid AST, the growth behavior of E. coli with WST-8 was monitored hourly. Figure 4 shows the absorbance values with different initial E. coli concentrations and incubation times. In general, a higher initial bacteria concentration reaches a detectable absorbance in a shorter incubation time with WST-8, because a high concentration of bacteria can quickly metabolize the WST-8 reagent. Similar results were obtained using the Nanodrop spectrophotometer (not shown). To estimate the culture time required for AST, the time to reach an absorbance value 0.5 (where the linear growth phase began 23 ) was determined for bacteria concentrations from 101 to 106 cfu/mL ( Fig. 5 ). For a high concentration (e.g., 5 × 10⁵ cfu/mL or greater), a WST-8 incubation time of only 2 h or less is required to reach an observable absorbance value. For lower concentrations, the WST-8 incubation time can be increased to allow additional cell growth to obtain an observable value. For instance, it is possible to detect an initial concentration as low as 1.5 × 101 cfu/mL, in which only a few bacteria are in the sample.
Standard bacterial growth curves of the cell viability assays with different water-soluble tetrazolium salts-8 incubation times.
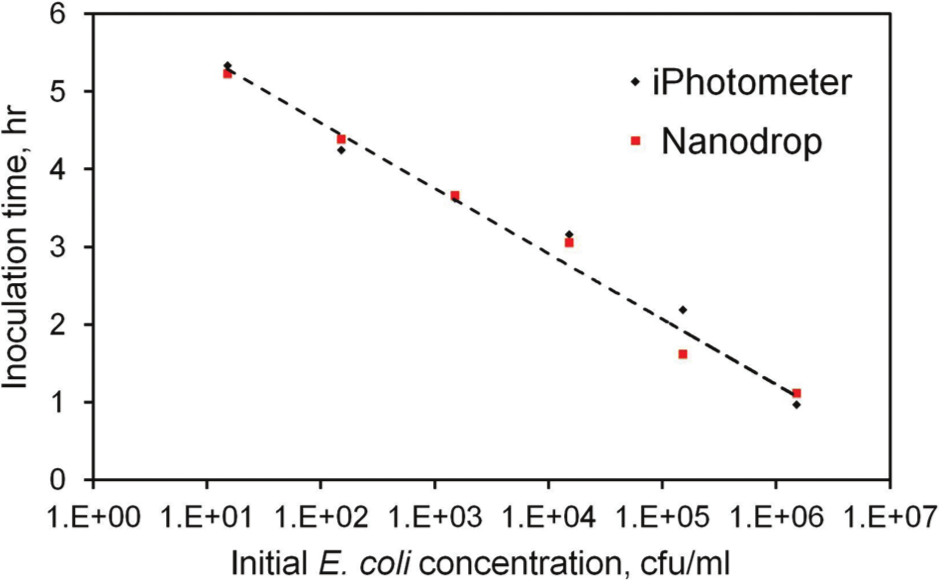
Water-soluble tetrazolium salts-8 incubation time to reach 0.5 optical density for various initial bacteria concentrations determined by the iPhotometer and the Nanodrop spectrophotometer.
Antibiotic Precoated PDMS Microwell Arrays
We have previously demonstrated that gas-permeable microchannels allow effective oxygenation for facilitating rapid bacteria growth. 12 For point-of-care diagnostic applications, the assay protocol should be simplified to minimize operation errors. Microwell arrays precoated with antibiotics on the wall were therefore developed in this study. To evaluate the effects of the microwell array and antibiotic coating, bacteria growth experiments were carried out under with different conditions. In the first condition, bacteria (EC137) were mixed with different concentrations of AMP in centrifuge tubes and monitored using a spectrophotometer ( Fig. 6a ). Total inhibition of EC137 by AMP was observed in 4 µg/mL. In the second condition, the same samples were cultured in microwell arrays to study the effect of bacteria culture in microwell ( Fig. 6b ). Absorbance values in the microwell array were measured using the iPhotometer. Total inhibition is achieved at 8 µg/mL. The discrepancy in the experiments could be a result of the increase in the surface-to-volume ratio, which may lead to absorbance of the antibiotic on the wall of the microwell. PDMS microwell arrays with precoated antibiotics were also tested ( Fig. 6c ). In this case, total inhibition occurs in 16 µg/mL, which is twofold higher than the premix case. This suggest ~50% of the antibiotics can be recovered from the microwell. The solubility of antibiotics, antibiotic release rate, and surface properties of PDMS all might contribute to this recovery rate.24,25 It should be noted that the recommended concentration for AMP is 128 µg/mL, which is eightfold higher than the MIC observed. Therefore, the precoating should have a minimal effect on the result of AST. If necessary, the loss in antibiotic activity may also be compensated for by a higher concentration of antibiotic.
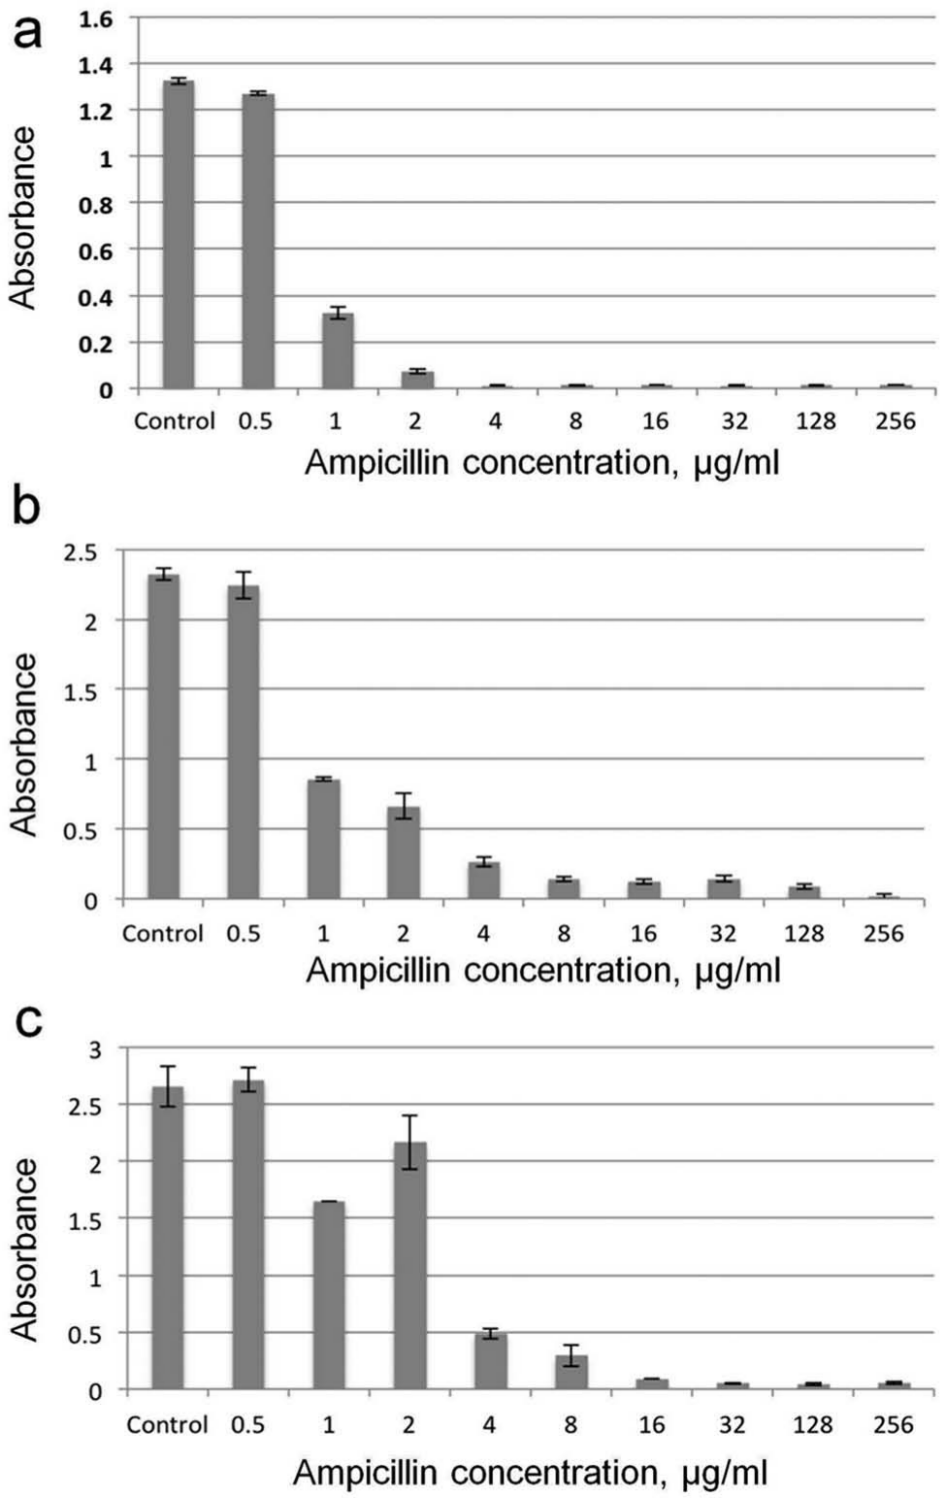
Comparison of minimum inhibitory concentration under different growth conditions: (
Antimicrobial Resistance Profiling
To demonstrate applicability of the system, we performed antibiotic resistance profiling of uropathogenic clinical isolates. Three different antibiotic conditions were tested against four E. coli isolates (EC132, EC136, EC137, and EC462), which are known to have different antibiotic resistance profiles. Figure 7a shows the antimicrobial resistance profiling results for the isolates cultured in MH broth. When the bacteria are sensitive to the antibiotics, the absorbance values are at least 10-fold lower than control and in other antibiotics. Therefore, the antimicrobial resistance of the bacteria can be easily determined, and the result is comparable with the antimicrobial resistance profiles determined in the clinical microbiology laboratory. To evaluate the applicability of the system for testing pathogens in urine, the bacteria were spiked in urine from healthy human volunteers and mixed with MH broth at a 1:1 ratio. Interestingly, higher absorbance values were observed for the uropathogens in urine ( Fig. 7b ). We have also observed a larger variation in the absorbance value, which could be due to the matrix effects of urine. Nevertheless, more than sixfold separations are observed between sensitive and resistant strains, demonstrating the feasibility of handling physiological samples using the iPhotometer-based rapid AST system.
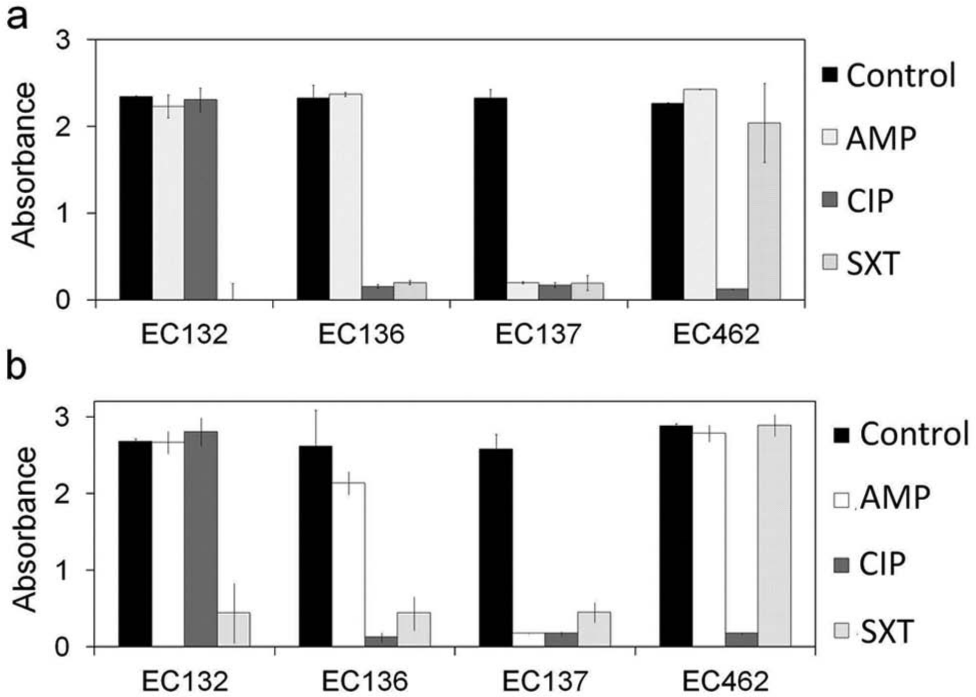
Antimicrobial resistance profiling for four uropathogenic clinical isolates in Mueller-Hinton broth (
In this study, we have demonstrated a low-cost, portable system for addressing key challenges of rapid AST in resource-limited settings. Our rapid AST approach does not require complicated sample preparation procedures by directly determining the antibiotic resistance of bacterial in physiological samples. With WST-8 reagent, samples with bacterial concentration from 101 to 106 cfu/mL can be tested directly by adjusting the incubation time. This capability allows us to avoid the requirement in standardizing the initial concentration in typical AST approaches. Furthermore, we have demonstrated the feasibility of the antibiotic precoating approach, which could be applied for simplifying the operation in resource-limited settings. In the future, further research is required to optimize the precoating procedure. Lyophilization strategy and binding/stabilizing agents may also be incorporated into the PDMS microwell array for long-term storage and effective recovery of the antibiotic in the wall.
In summary, we demonstrated that an integrated, portable, cell phone–based microphotometric system together with gas-permeable microwell arrays allows rapid determination of the antibiotic-resistance profiles of pathogens. This low-cost, field-deployable technology will enable an effective approach toward telemedicine applications to address various global health diseases and facilitate common tests performed at hospital and field environments.
Footnotes
Acknowledgements
The authors thank Dr. Jian Sun and Dr. Yin Zheng for their helpful suggestions and technical support.
Declaration of Conflicting Interests
The authors declared no potential conflicts of interest with respect to the research, authorship, and/or publication of this article.
Funding
The authors disclosed receipt of the following financial support for the research, authorship, and/or publication of this article: This work was supported by the NIH Health Director’s New Innovator Award (1DP2OD007161-01) and NIAID (1U01AI082457-01 and 2R44AI088756-03).
References
Supplementary Material
Please find the following supplemental material available below.
For Open Access articles published under a Creative Commons License, all supplemental material carries the same license as the article it is associated with.
For non-Open Access articles published, all supplemental material carries a non-exclusive license, and permission requests for re-use of supplemental material or any part of supplemental material shall be sent directly to the copyright owner as specified in the copyright notice associated with the article.