
Abstract
One high-throughput technology gaining widespread adoption in industry and academia is acoustic liquid dispensing, in which focused sound waves eject nanoliter-sized droplets from a solution into a recipient microplate. This technology allows for direct dispensing of small-molecule compounds or reagents dissolved in DMSO, while keeping a low final concentration of organic solvent in an assay. However, acoustic dispensing presents unique quality control (QC) challenges when measuring the accuracy and precision of small dispense volumes ranging from 2.5 to 100 nL. As part of an effort to develop a rapid and cost-effective QC method for acoustic dispensing of 100% DMSO, we implemented the first high-throughput photometric dual-dye–based QC protocol in the nanoliter volume range. This technical note validates the new photometric 100% DMSO QC method and highlights its cost-effectiveness when compared with conventional low-throughput fluorimetric QC methods. In addition, a potential software solution is described for the analysis, storage, and display of accumulated high-throughput QC data, called LabGauge. As the need for high-throughput QC grows, conventional low-throughput methods can no longer meet demand. Validated high-throughput techniques, such as the dual-dye photometric method, will need to be implemented.
Introduction
In high-throughput drug discovery, assays, compound management and screening rely on precise and accurate liquid handling of increasingly small volumes.1–4 As the industry pushes to further miniaturize experiments, dependencies on technology increase and, in turn, the need grows for compatible high-throughput quality control (QC) processes to measure instrument accuracy and precision. 2 Accuracy is the degree of measurement correctness relative to an exact standard, whereas precision is the agreement of repeated measurements relative to the each other. Both properties are essential in modern high-throughput screening operations, and recently there has been a renewed focus on tracking the performance of liquid handlers. 5 Acoustic dispensing technology uses focused sound waves to eject nanoliter-sized droplets from a source plate into an inverted recipient microplate. This technology allows for the direct dispensing of compounds or reagents dissolved in DMSO while maintaining low final DMSO concentrations. Low DMSO concentrations are particularly important for many cell-based assays, which would normally require an additional intermediate dilution step when adding test compounds. With the increase in popularity of acoustic liquid dispensing in both industry and academia, the need for a high-throughput QC procedure in 100% DMSO increases.
There are several methods for quantifying accuracy and precision of liquid-handling dispensers. The four most common techniques are gravimetric, absorbance, fluorescence, and ratiometric photometry,1,6 but each has its limitations. Gravimetric techniques are time-consuming, have a large margin of error, and cannot determine precision on a well-by-well basis. 4 Evaporation also becomes a factor at or below the 100-nL range, depending on the temperature and humidity of the environment. 2 Absorbance and fluorescence are “gold standard” methods requiring manually prepared, highly accurate standard curves to analyze the QC data 2 and can produce erroneous results if prepared incorrectly. Fluorescence signals can also be quenched by DMSO. Dual-dye, or ratiometric, photometry uses two dyes and produces two absorbance readings that are combined to generate an absorbance ratio. Since the absorbance readings are measured simultaneously, the ratio is more accurate than absorbance measured individually because the errors introduced by optical imperfections, path length variation, and photometer nonlinearity affect both signals equally, effectively canceling them out. Dual-dye photometry requires two highly accurate stock solutions that may still exhibit variation in plate-to-plate dispensing, depending on the process performed by the user. 1 Finally, for all of these methods, it can be difficult to mimic the exact DMSO concentration of compounds. For fluorophore- and absorbance-based methods, it is straightforward to use 80% to 100% DMSO solutions,5,7 while measuring nanoliter volumes in more than 80% DMSO with ratiometric photometry presents technical challenges.2,4,6 In fact, validated commercial ratiometric photometry solutions above 75% DMSO have previously not been available. 6
For high-throughput applications, dual-dye photometric methods are superior. This technical note compares a conventional low-throughput single-wavelength fluorescence method using Alexa Fluor (Invitrogen, Madison, WI) with an improved dual-dye photometric high-throughput method that employs a newly developed 100% DMSO reagent (R&D DMSO E; ARTEL, Westbrook, ME). The new reagent in the dual-dye photometric method is compared with the traditional fluorophore method based on effectiveness, cost, and time demands. The results demonstrate that the methods are equivalent in determining the accuracy and precision of the devices; however, the dual-dye method is significantly faster than the Alexa Fluor method. This speed comes at the expense of higher reagent costs, but the dual-dye method saves considerable amounts of time and labor.
As a consequence of the improved high-throughput QC method, managing, cataloging, and maintaining the quality control data can become a logistical bottleneck. The QC data needs to be retrieved and analyzed to create process control charts in order to monitor instrument performance over time. We collaborated with a software design firm to create a tool called “LabGuage” that automates this process by reading the QC data files directly—eliminating the need to cut and paste results into an Excel sheet or macro and improving the speed of analyzing the QC results. The tool also allows the user to visualize, retrieve, and share data on the fly.
Materials and Methods
In comparing the Alexa Fluor method and the ARTEL Multichannel Verification System (MVS) using the R&D DMSO E method, it is critical to conduct both experiments using identical protocols. The validation experiments consisted of stamping three replicates of 25 nL (Labcyte standard calibration volume) per well using three different 384 source plate types across three models of Labcyte Echo instruments (Labcyte, Sunnyvale, CA). The Echo models 520, 550, and 555 cover a range of effective dispensing speeds, with the 520 requiring about 2 s per well and the 555 dispensing in under a second per well (the 550—the original model—has an intermediate speed). Both QC methods used the same three stamping protocols on all three Echos, one protocol for each source plate type ( Fig. 1 ).
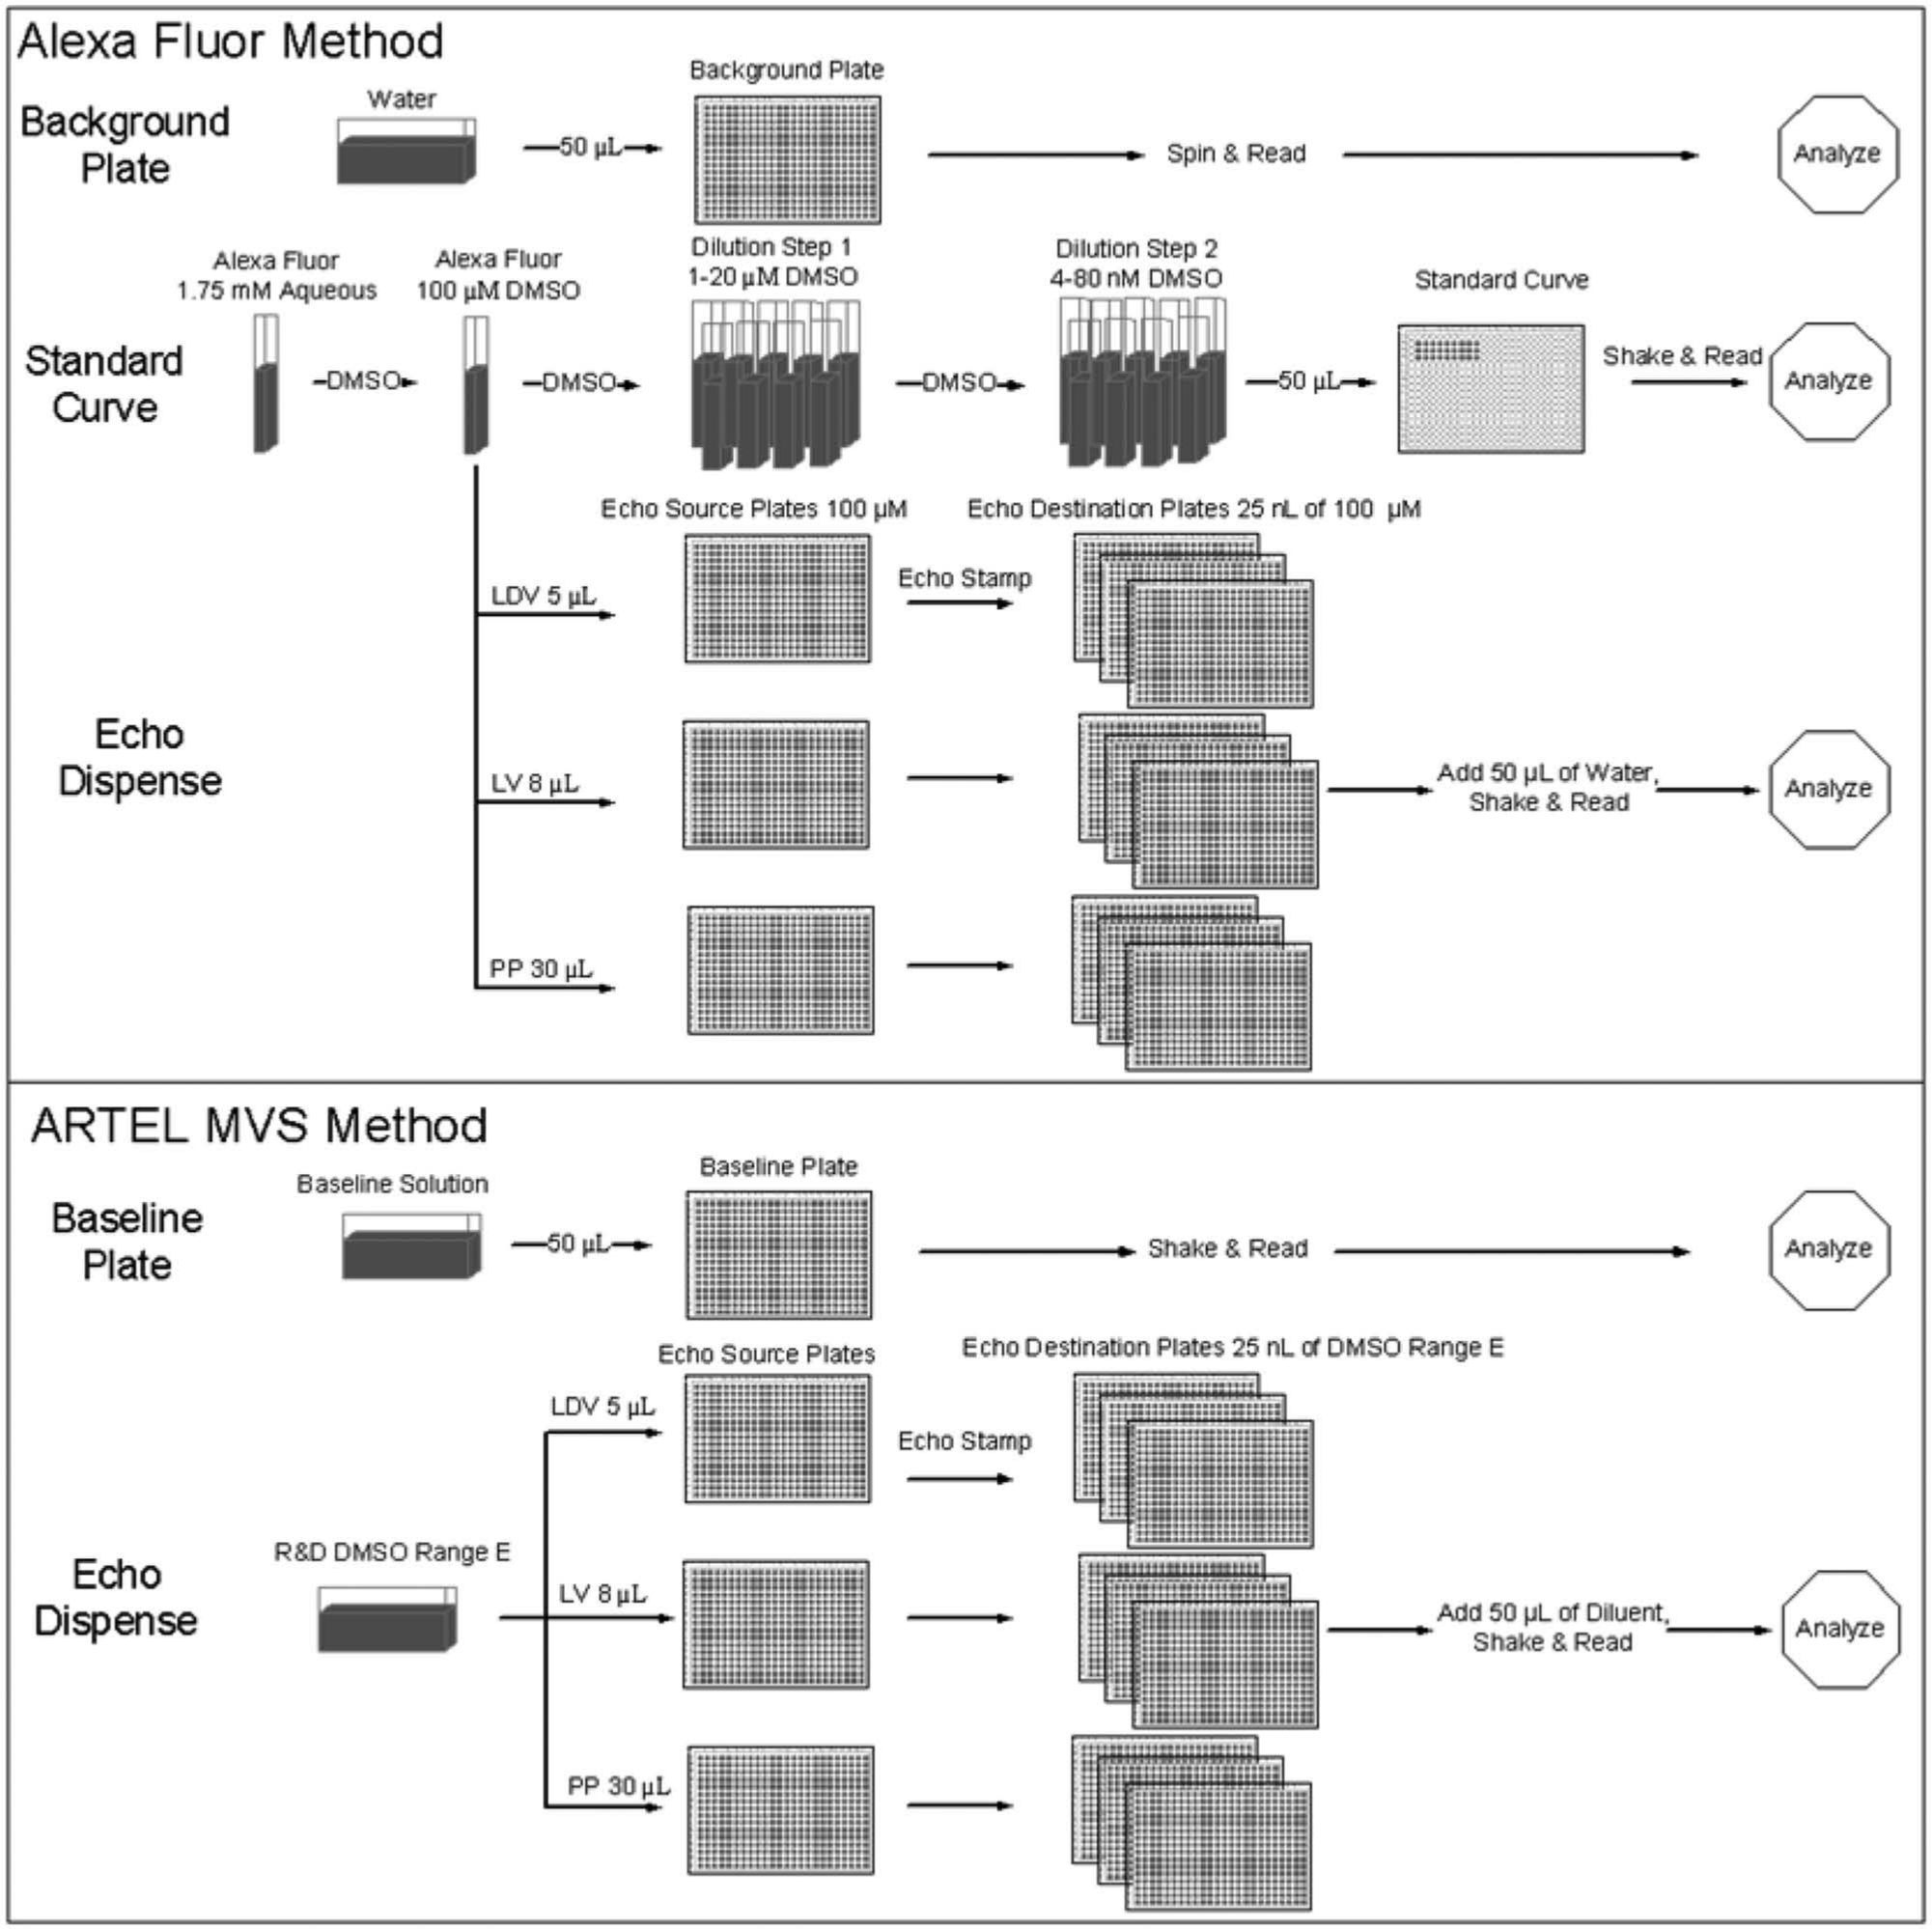
Diagram of photometric quality control (QC) experiments for both the Alexa Fluor method and the Multichannel Verification System (MVS) method. In both QC methods, three independent destination plates were stamped from three unique source plate types. Both methods also run a control plate to account for reader background. A standard curve, with final concentrations ranging from 4 to 80 nM, was produced for the Alexa Fluor method to analyze accuracy and precision.
In both methods, a survey was performed before each dispense to determine the volume and DMSO concentration in each well of the source plate. This allows the Echo device to select the appropriate power setting to dispense the 2.5-nL droplets. The accuracy of this power selection is affected by the coupling fluid temperature. Therefore, during this experiment, all Echo devices were calibrated and maintained at a temperature between 21.5 °C and 22.5 °C.
Alexa Fluor Method
Preparation of Stock Solution
Alexa Fluor 488 Hydrazide (A10436; Invitrogen) was chosen over fluorescein due to the higher quantum yield and greater resistance to photo-bleaching 8 The Alexa 488 hydrazide was dissolved by mixing 1 mg with 1 mL distilled water to create a 1.75-mM aqueous solution. Subsequently, 1 mL of the 1.75-mM aqueous solution was diluted into 16.5 mL of extra dry DMSO 99.7% (CAS:67-68-5; Acros Organics, Geel, Belgium), generating a 100-µM Alexa 488 working stock solution (94% DMSO).
Preparation of Standard Curve
The standard curve preparation required an intermediate dilution step to create a final set of test solutions. The dilutions, shown in Table 1 , were performed using a 20- to 100-µL range single-channel manual pipette (P100; Gilson, Middleton, WI). The first set of solutions was created in 15-mL centrifuge tubes (339650; Thermo Fisher, Pittsburg, PA) using the 100-µM Alexa 488 stock solution and distilled water (15230-147; Life Technologies, Madison, WI), in concentrations ranging from 1 to 20 µM. The intermediate set was further diluted in 50-mL centrifuge tubes (339652; Thermo Fisher) at a ratio of 1:250 with distilled water to make a final set of discrete solutions, ranging from 4 to 80 nM.
Two-Step Discrete Solutions.
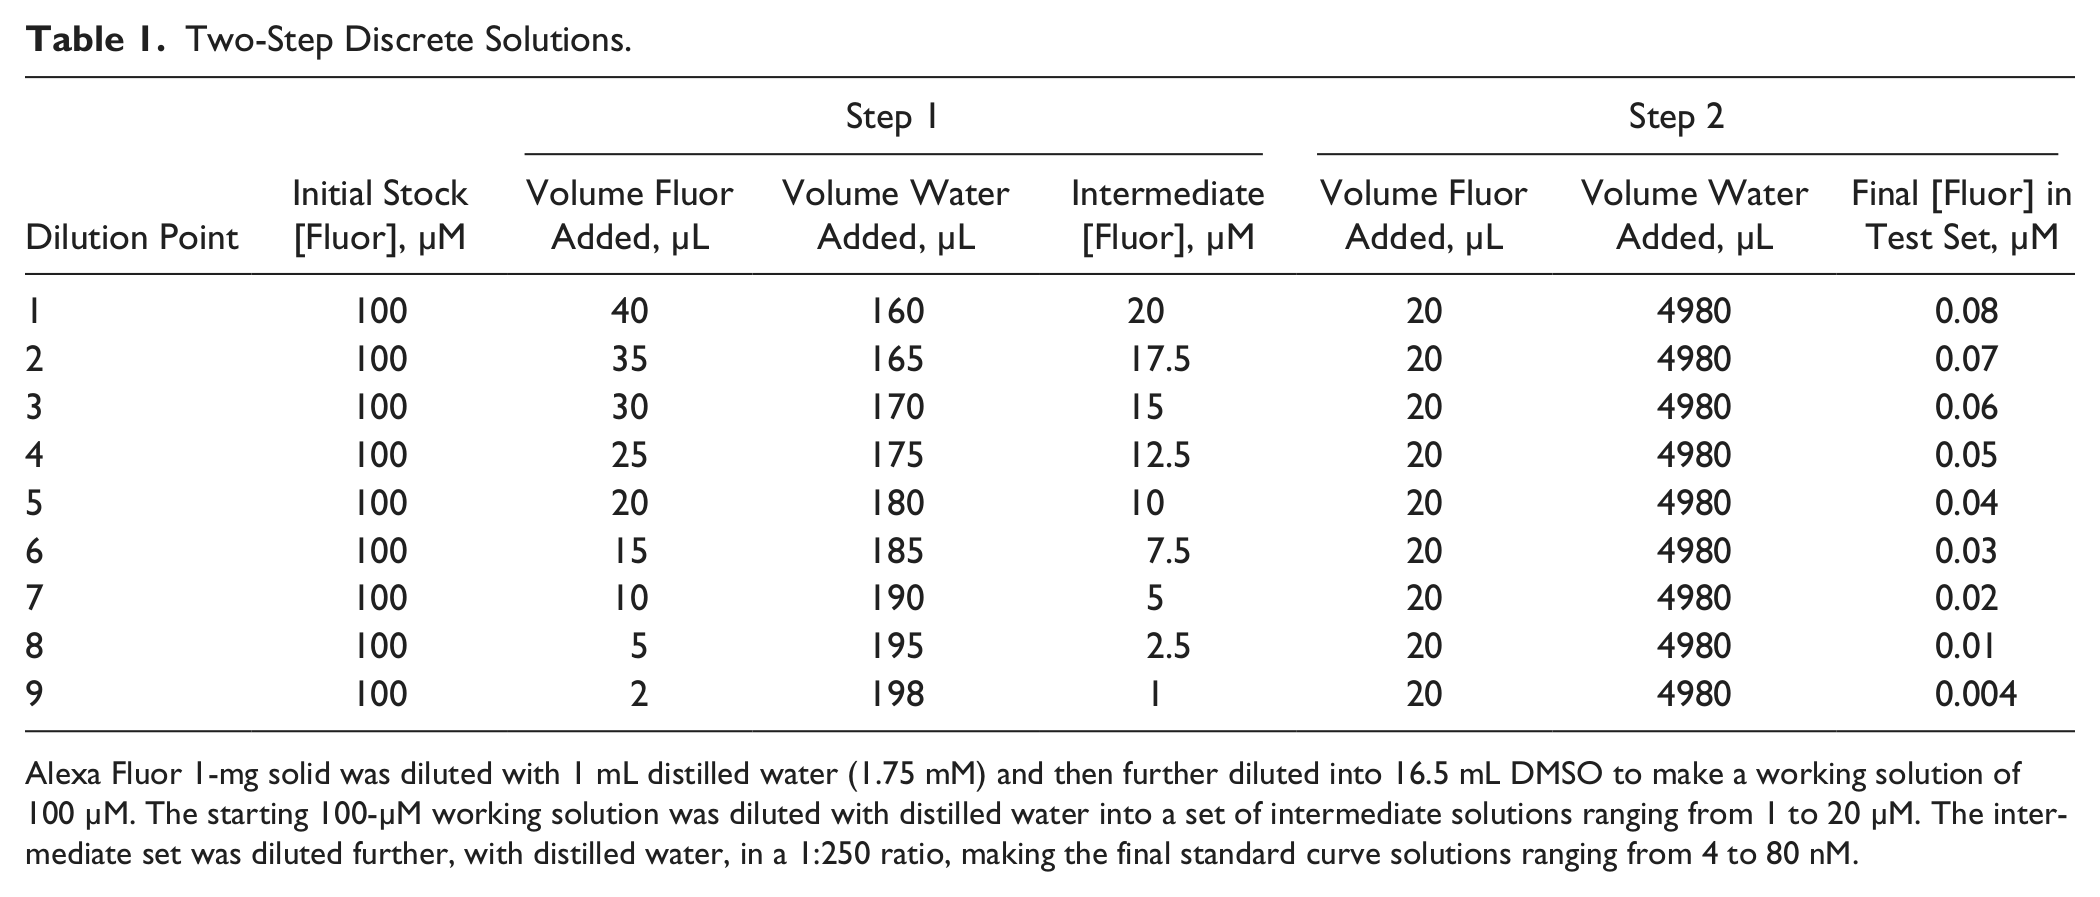
Alexa Fluor 1-mg solid was diluted with 1 mL distilled water (1.75 mM) and then further diluted into 16.5 mL DMSO to make a working solution of 100 µM. The starting 100-µM working solution was diluted with distilled water into a set of intermediate solutions ranging from 1 to 20 µM. The intermediate set was diluted further, with distilled water, in a 1:250 ratio, making the final standard curve solutions ranging from 4 to 80 nM.
Reader calibration
Before creating the standard curve plate, 50 µL of the 100-µM Alexa stock solution was dispensed into all wells of a black flat-bottom 384-well plate (781076; Greiner Bio-One, Monroe, NC) using a 16-channel electronic pipette (Matrix Impact2 125 µL; Thermo Fisher, Hudson, NH). This plate was used to optimize the protocol on the fluorescent reader (EnVision 2103 Multilabel Reader; PerkinElmer, Boston, MA), which measures relative fluorescent units (RFU). The reader optimization performed for a Greiner black flat-bottom plate is an automated process on the EnVision that consists of aligning plate dimensions, measurement heights, and setting detector gain for optimal signal detection.
Standard curve
Finally, to create the standard curve, 50 µL of each dilution in the final solution test set was dispensed into a black flat-bottom 384-well plate (781076; Greiner Bio-One) in columns 3 through 11, rows B though D. The standard curve solution signals were read on the EnVision and fit to a straight line using Microsoft (Redmond, WA) Excel’s linear regression function. A standard curve was accepted if the linear regression R2 value was ≥0.99.
Dispensing Using Echo Acoustic Liquid Handlers
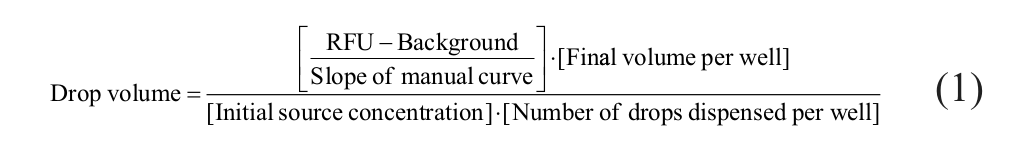
Acoustic liquid handlers focus sound energy to dispense DMSO solution in nanoliter-sized droplets. The fluid-specific acoustic pulse propels the droplet from the surface of the source liquid up to an inverted destination plate. Each Echo instrument (2.5 nL drop size) used in this work was calibrated by the manufacturer to enable dispensing from three source plates: a 384-well polypropylene (PP) standard volume plate (P-05525; Labcyte), a 384-well cyclic olefin copolymer low-volume (LV) plate (P-05710; Labcyte), and a 384-well low dead volume (LDV) plate (LP-0200; Labcyte). The source plates were filled with volumes within the Labcyte recommended range of 30 µL, 8 µL, and 5 µL of 100 µM Alexa 488 DMSO stock solution, respectively, and then spun at 2000 rpm in a microplate centrifuge (Centrifuge 5810R; Eppendorf, Westbury, NY). After surveying each source plate on the Echo models, the individual source plates were used to create three independent destination plates by programming each Echo to stamp 25 nL onto a 384-well black flat-bottom plate (781076; Greiner Bio-One), resulting in a total of 27 destination plates. After the initial 25-nL dispense, all destination plates were backfilled with 50 µL distilled water using a Matrix PlateMate 2 × 2 (Thermo Fisher, Hudson, NH) with a 384-tip head and 100-µL DART (Thermo Fisher) tips, bringing the final concentration to 50 nM. The plates were then spun at 2000 rpm for 1 min using the same centrifuge and shaken for 10 min at approximately 850 rpm (Titer Plate Shaker; Thermo Scientific, Waltham, MA). After shaking, the plates were spun again at 2000 rpm for 1 min and read on the EnVision, measuring relative fluorescence using the optimized protocol described previously. The data for each well in the plate were analyzed for precision and accuracy in Excel. Precision was calculated using the percent coefficient of variance (CV) for each measurement, with the standard deviation divided by the mean and multiplied by 100. Accuracy was calculated based on the difference between the target and actual drop volume divided by the actual volume and multiplied by 100. Equation (1) was used to determine the actual drop volume. Actual drop volume was used to calculate inaccuracy when compared with the target volume of 2.5 nL.
ARTEL Multichannel Verification System (MVS)
The MVS was used for dual-dye photometric QC, which requires instrument profiles and protocol setup. An instrument profile was created for each device; this included the name, model, serial number, and number of channels. Due to a limitation in the MVS software in which interplate statistical calculations are not automatic for one-channel devices, the Echos were set up in the MVS as if there were 384 individual channels to capture plate-to-plate and well-to-well statistics. Once the instruments are defined, the MVS protocol must then be created. For this experiment, three protocols were defined, one for each source plate (LV, LDV, and PP), consisting of three replicates of a 25-nL transfer dispense into a 384-well verification plate (ME MVS-245; ARTEL), with a tolerance of 10% for both CV and relative inaccuracy. The use of the verification plate is necessary because a plate characterization is performed for each well, and a measurement correction factor is applied to address imperfections in the molding process. The characterization method accounts for variability of well size within plates by defining the precision and the accuracy variability within each cavity mold of each lot. A well-by-well performance definition is assigned to each lot and passed to the system software via the barcode reader, where it is integrated into the calculations used to determine sample volume dispensed.
Reader calibration
The plate reader was calibrated using a calibration plate included in the MVS. The baseline plate was creating dispensing 50 µL of baseline solution (ARTEL) using a 16-channel electronic pipette (Matrix Impact2 125 µL; Thermo Fisher).
The same source plate types were used as described in the Alexa Fluor method and were filled with R&D DMSO E using the same electronic pipette as the baseline. Each source was centrifuged at 1700 to 2000 rpm for 15 s and surveyed on each Echo before dispensing to verify volumes. Each source plate was used three times to create independent destination plates. After 25 nL of the R&D DMSO E was stamped onto the destination plates, 50 µL of the diluent solution (ARTEL) was dispensed in each plate using the Matrix PlateMate 2 × 2 (Thermo Fisher) with a 384-tip head and 100-µL DART tips and centrifuged at 1500 rpm for 15 s. The plates were then processed on the MVS, a shaker (HT-91100 Titer Plate Shaker; Big Bear Automation, Santa Clara, CA), for 2 min at 2600 rpm; loaded on the plate reader (ELXnb; BioTek, Winooski, VT); and then analyzed using the MVS software. At the time of this work, the MVS software’s lowest allowed target volume to determine accuracy and precision was 30 nL. Therefore, the QC plates were read and analyzed using 30 nL as the target volume in the software, and the calculations were manually redone offline using the actual MVS-measured mean volume compared with the 25-nL target volume. Currently, the lowest allowed target volume in the MVS software is 10 nL; therefore, all accuracy and precision measurements at this volume can now be performed automatically by the MVS.
LabGauge
The LabGauge (StackWave, Louisville, KY) application was built to analyze and organize QC data as described in the text above. It is structured as a three-tiered application: web, business, and database layers. LabGauge was written in C# using a MongoDB database (10gen, New York, NY), 10gen drivers for database programming, and StackWave developed core libraries. Each component was specifically chosen to optimize the application. It was written in C# because of the built-in software capabilities for processing XMLs, database programming, and web application development. The MongoDB database was used since it is easily scalable and allows flexibility if changes in the schema are needed.
The application is currently designed to work with the output files from the ARTEL MVS software but can be modified to accept any XML or CSV file. The MVS software produces a QC XML file describing the instrument, process, and results for each experiment. LabGauge reads the XML, converts its contents into a format understood by the application, and stores it in the MongoDB database. Since the user maps unique identifiers for each instrument through an alias table, the application will automatically update the stored instrument information from the new data being uploaded. The application programming interface (API) allows additional information to be stored; this is used to produce process control charts and events for instruments such as crashes and preventative maintenance (PM).
Results and Discussion
As drug discovery advances, there is a need to find new faster and high-throughput methods to QC instruments. Traditional fluorescent methods are effective but do not scale up efficiently. To replace conventional methods, new high-throughput methods must be proven to be equivalently effective, faster, and preferably less expensive. Therefore, we compared methods based on three factors: equivalency of results, time to complete, and total cost. These factors define which method is optimal for the routine QC procedure for the acoustic dispensers. The results of these experiments demonstrate that the dual-dye photometric method matched the conventional fluorophore method in determining the accuracy and precision of the Echo models, while providing higher throughput at a lower overall cost.
The QC methods described in this article use Labcyte Echos; however, the methods are designed to work for any acoustic dispenser. The Materials and Method section is completely interchangeable for any static drop size and single transducer acoustic dispenser, such as the EDC ATS-100, that can use the Echo source plates. If the acoustic dispenser has other plate restrictions, adjustments will need to be made accordingly to the materials. Devices with multiple or adjustable drop sizes or with more than one transducer would require slight modifications in the testing method. These modifications would be made by determining how to test each drop size and transducer thoroughly—for example, how many drop size volumes to test, how many plates to run for a statistical significance, and whether to test the transducers within the same plate or different plates.
To analyze the data for this experiment, each of the three source plate types is grouped with an instrument, creating nine combinations. These combinations are referred to in all of the data analysis tables and figures as source plate/instrument combinations. Accuracy (vs. the standard curve), percent CV and the difference in means of each method were used to validate the new high-throughput QC protocol. Table 2 lists the data obtained using the ARTEL MVS and the Alexa Fluor methods. The data indicate that all of the Echo devices performed within the manufacturer’s specification of ±10% for accuracy and 8% CV for precision. Using the MVS method, the observed accuracy was within ±6%, and CVs were all below 5.1%. For the Alexa Fluor QC method, the accuracy was within ±9%, with calculated CVs under 5.2% for all of the Echo models. More important, there was good agreement between the two methods (see Fig. 2 ).
Echo Accuracy and Precision Statistics for the ARTEL MVS and Alexa Fluor.
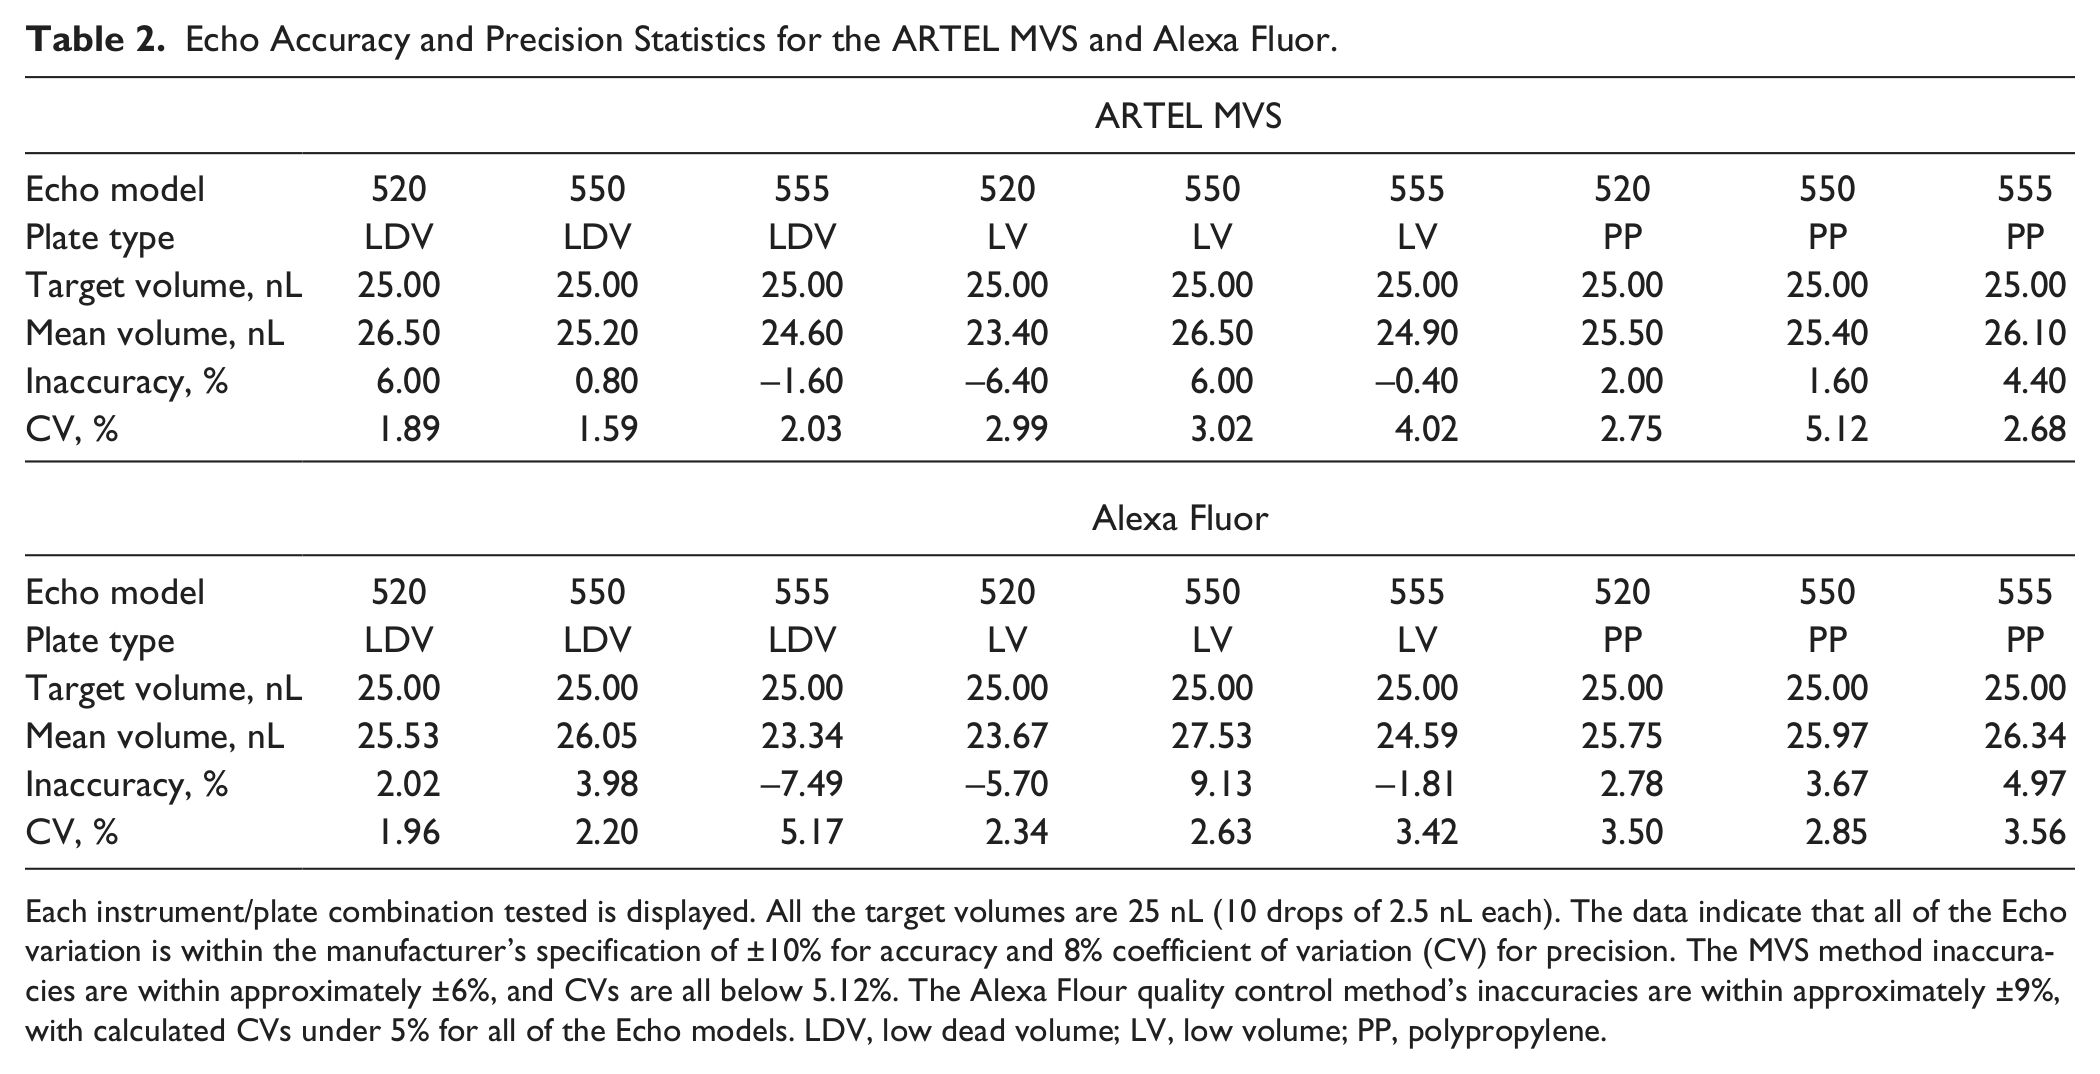
Each instrument/plate combination tested is displayed. All the target volumes are 25 nL (10 drops of 2.5 nL each). The data indicate that all of the Echo variation is within the manufacturer’s specification of ±10% for accuracy and 8% coefficient of variation (CV) for precision. The MVS method inaccuracies are within approximately ±6%, and CVs are all below 5.12%. The Alexa Flour quality control method’s inaccuracies are within approximately ±9%, with calculated CVs under 5% for all of the Echo models. LDV, low dead volume; LV, low volume; PP, polypropylene.
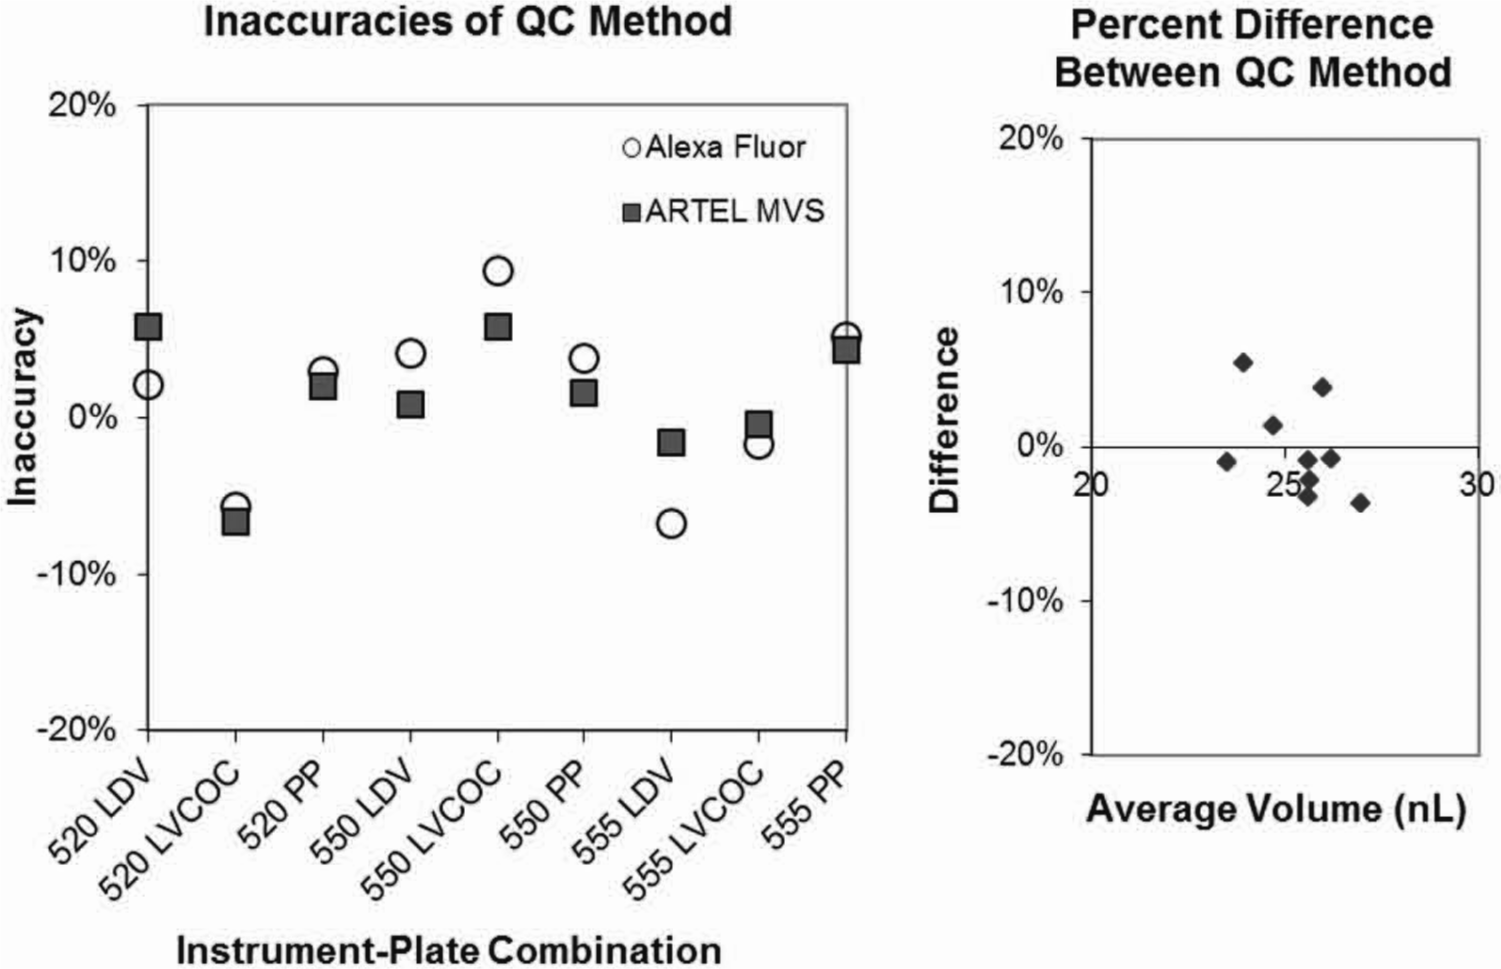
Comparison of inaccuracy per source plate/instrument combination of both quality control (QC) methods (left). The graph shows each instrument variability was within 10%. The graph on the right displays the percent difference of mean volumes between the ARTEL MVS method and the Alexa Flour method for each instrument/source plate combination. The percent difference between the two methods remains within 6%.
The left graph of Figure 2 shows the methods correlate with one another at each data point. When the Alexa Fluor method indicates overdispensing, the MVS or dual-dye photometric method agrees, and the same is true for underdispensing. Mean differences between each source plate/instrument combination for each method were also compared. Figure 2 (right graph) shows that the differences in mean between the methods are within ±6% of 25 nL and are equally distributed around the 25-nL point. There is no shift or skew, and differences are within an acceptable range, further confirming equivalency.
Figure 2 shows the new ARTEL reagent is an adequate substitute for fluorophores, with only a slight difference in precision and accuracy. These differences could be a due to factors affecting fluorophores, such as signal drift, photo-bleaching, or degradation. 9 The results for fluorophores are also dependent on the reader and need a precise standard curve. 9 Another potential reason for the minor discrepancies could be due to differences in percent DMSO or the ARTEL plate characterization. When performing QC on an instrument, the process and solution composition should mimic the liquid used in the actual experiments run on that instrument. 3 The MVS method uses 100% DMSO (the actual concentration used in our production assays), whereas the Alexa Fluor method uses 94%. The R&D DMSO E mimics test compounds in 100% DMSO the closest, giving the dual-dye system an advantage. The ARTEL plate characterization also applies a correction factor due to imperfections in the molding process for each well in the plate. The plates in the Alexa Flour method do not undergo this process. Despite rather minor variances, the overall results show the high-throughput method is as effective in determining the accuracy and precision of the Echo device.
The second dimension for comparing the two methods is the amount of time to complete each experiment, displayed in Table 3 . The MVS dual-dye photometric method has a time advantage since the preparation of standard curve solutions is not required, and shaking and data analysis are much faster. The user spends 2.3 fewer hours running 1 plate on the MVS than with the Alexa Fluor method, 4.3 fewer hours running 9 plates, and with 27 plates, there is an 8.8-hour difference in favor of the MVS. If QC is performed on the equipment twice a month with 27 plates, the user will save 210 hours in a year. The data in Table 3 show that the dual-dye photometric method is faster than the Alexa Fluor, independent of the number of plates. The difference in time when running a smaller number of plates is due to the set up of preparations of solutions and standard curve, which is a labor-intensive process that affects the results of the entire experiment. If there is an error at this step, the entire process can be invalid. When running a larger number of plates with the Alexa Fluor method, shaking and data analysis become the lengthier steps. Since the dual-dye photometric method is a certified commercial product, there is no risk of preparing the solutions incorrectly. However, the rate-limiting step in the ARTEL MVS method is the plate reading, regardless of the number of plates.
Comparing Each Step in Both the Alexa Fluor and MVS QC Methods Based on Time and Number of Plates.
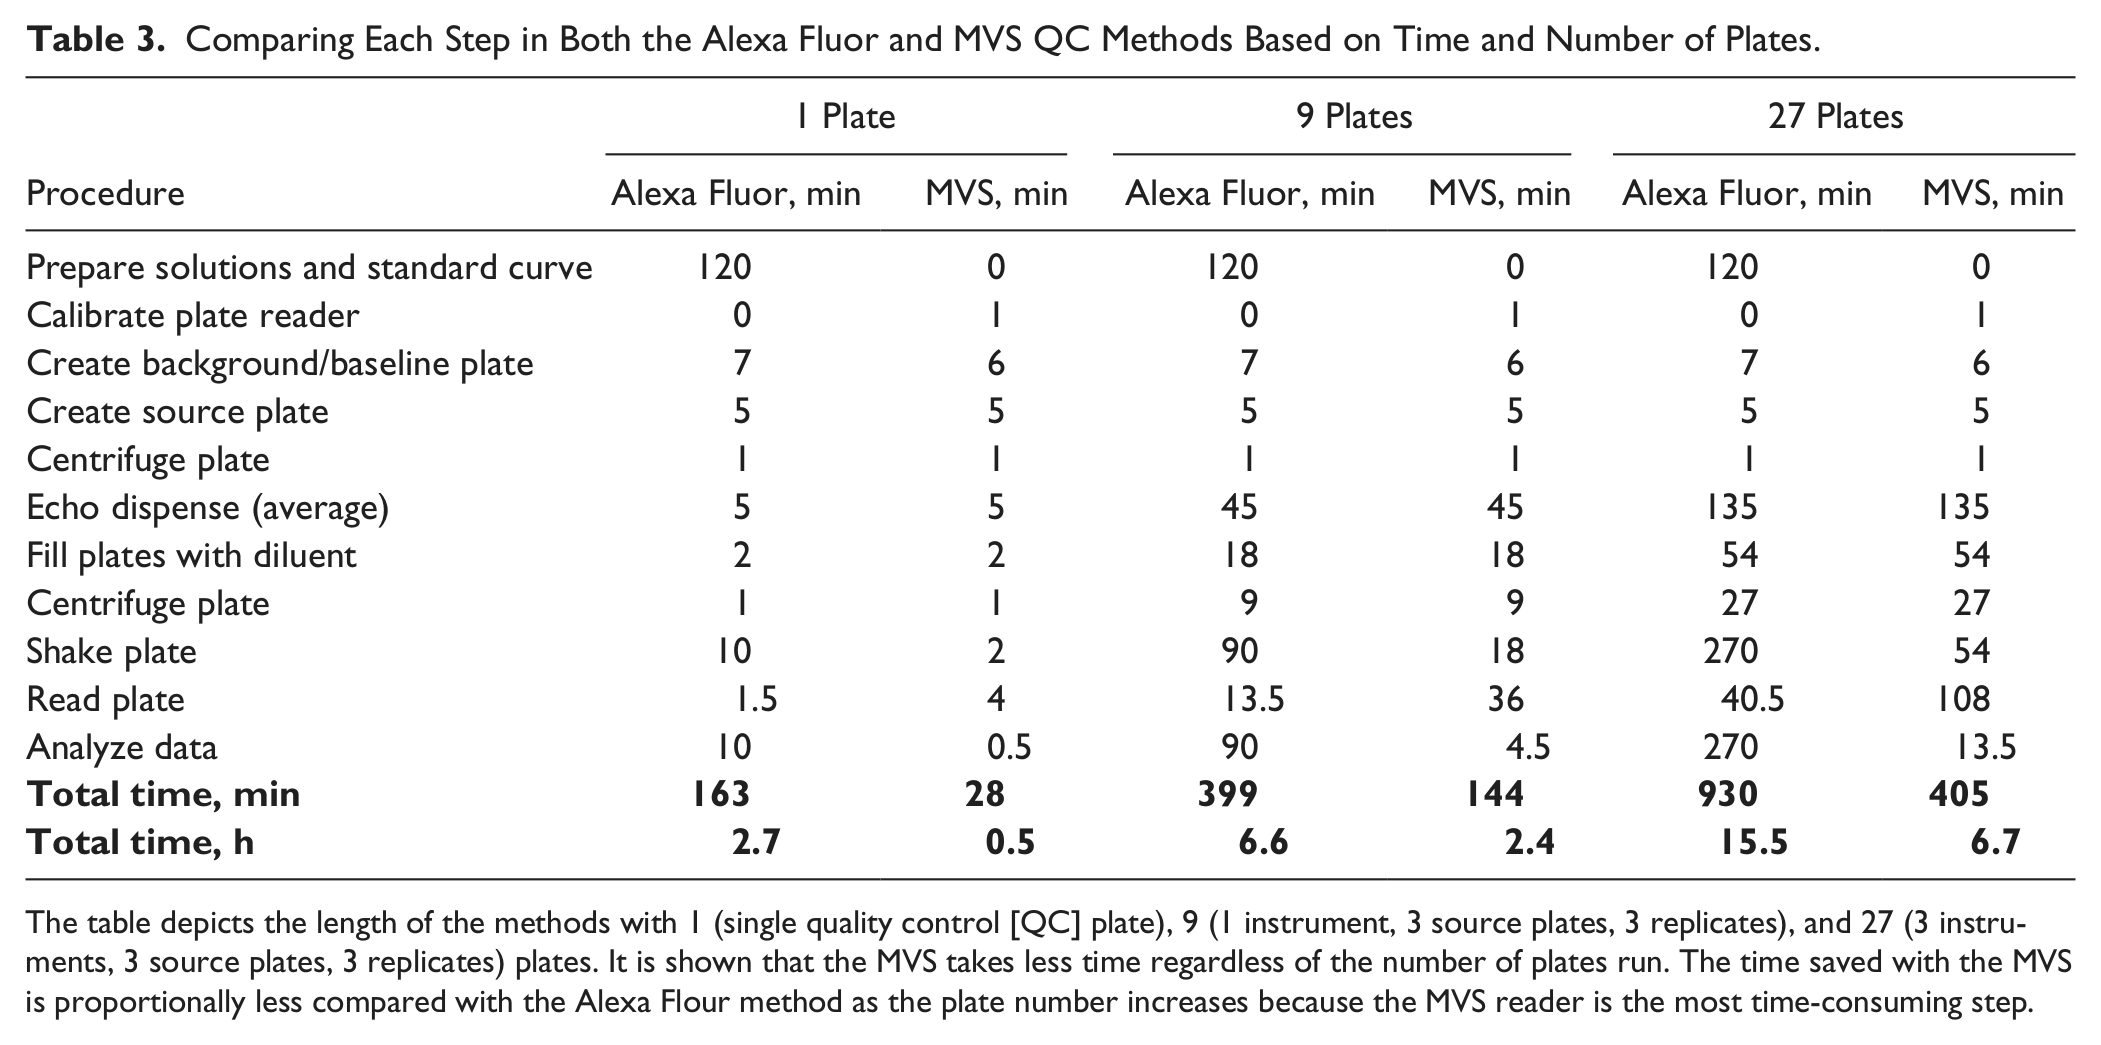
The table depicts the length of the methods with 1 (single quality control [QC] plate), 9 (1 instrument, 3 source plates, 3 replicates), and 27 (3 instruments, 3 source plates, 3 replicates) plates. It is shown that the MVS takes less time regardless of the number of plates run. The time saved with the MVS is proportionally less compared with the Alexa Flour method as the plate number increases because the MVS reader is the most time-consuming step.
The last factor used to the compare the methods is total cost. Material costs alone for each method are calculated in Table 4 . The MVS method is approximately 1.4 times more than the Alexa Fluor method when testing one Echo and three sources with three replicates ( Table 4 , 9 plates) and approximately 3 times more expensive if three Echos are tested ( Table 4 , 27 plates). Although the Alexa Fluor 488 hydrazide is more than $200, the costs for ARTEL plates and diluent far exceed the Alexa Fluor method consumables.
Real-World Costs for 1 Echo Dispenser with 3 Source Plates and 3 Replicates (9 Plates) and 3 Echo Dispensers with 3 Source Plates and 3 Replicates (27 Plates) for Both the Alexa Fluor and MVS Quality Control Methods.
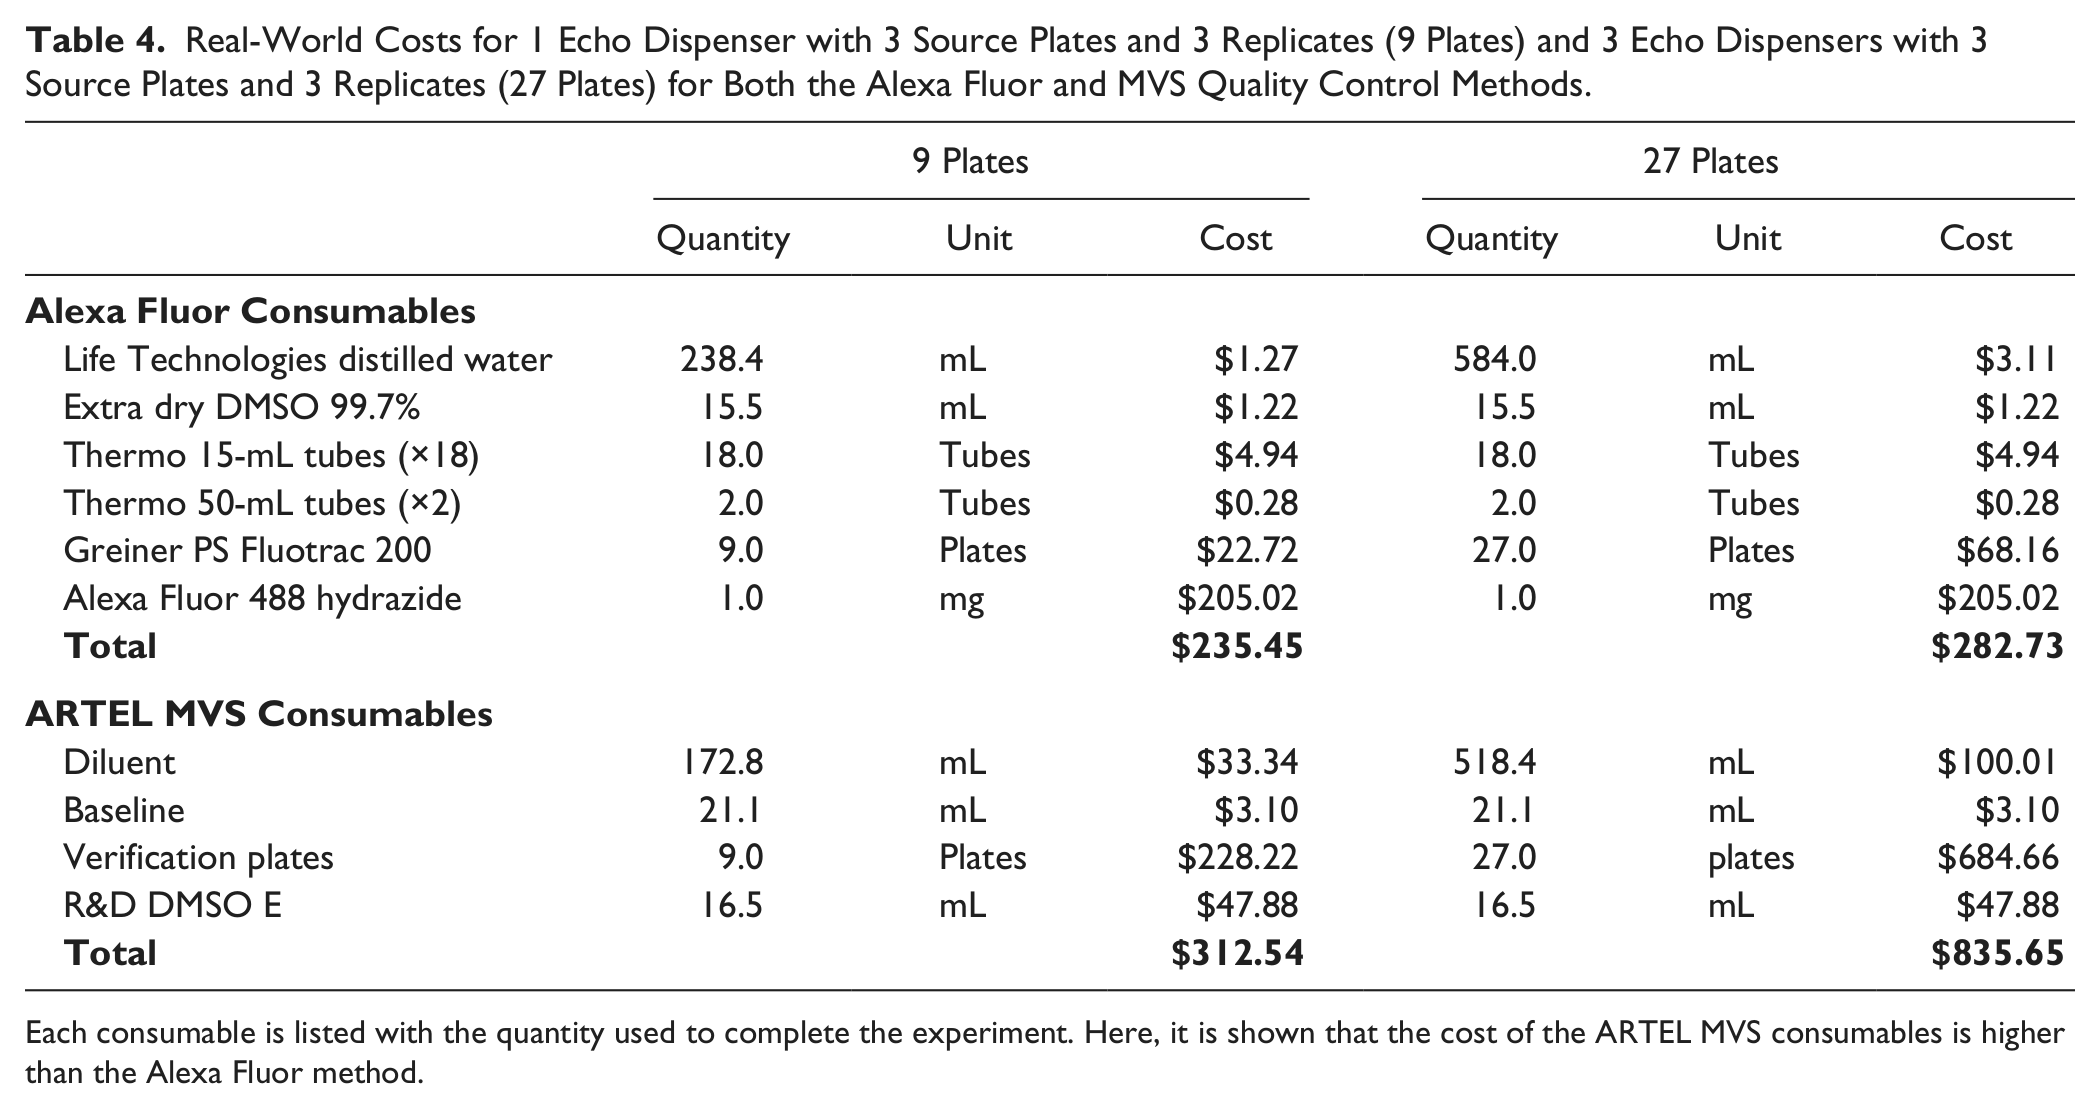
Each consumable is listed with the quantity used to complete the experiment. Here, it is shown that the cost of the ARTEL MVS consumables is higher than the Alexa Fluor method.
Considering only consumable expenses, it seems that the ARTEL MVS is more expensive. However, to compare total cost, labor expense needs to be included ( Fig. 3 ). Using a conservative value of $120 opportunity cost per man hour, the labor cost of the Alexa Fluor method is approximately twice the labor cost of the MVS method. The total cost, consumables, and labor ( Fig. 3 ) for 9 plates of the Alexa Flour is $1034, and the MVS method is $600. For 27 plates, the Alexa method is $2145, and the MVS method is $1646, for a savings of $499. Therefore, the Alexa Fluor method is more expensive regardless of the number of plates in the experiment (e.g., for 54 plates, the cost would be $3800 for Alexa Fluor and $3200 for MVS). Overall, the MVS method is the most cost-effective option.
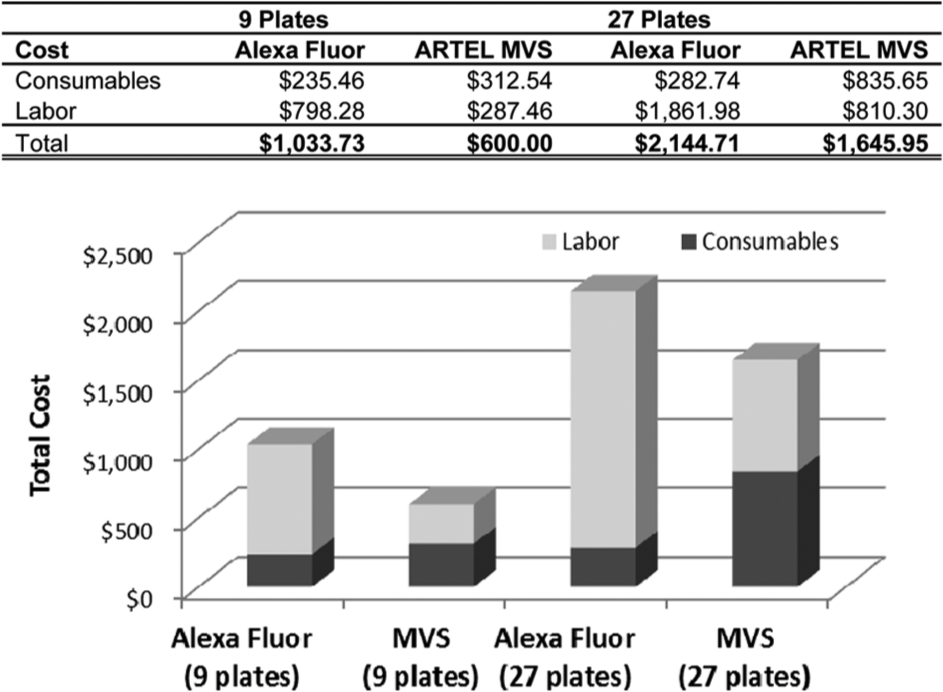
Total cost table and bar graph analysis of the Alexa Fluor and MVS method combining labor and consumables. The total cost shows that the ARTEL MVS method is more cost-effective than the Alexa Fluor method.
Especially with the high-throughput method, QC data storage and tracking can be a bottleneck. A method is needed to organize, display, and analyze data produced during QC and create process control charts that are retrievable on the fly. In collaboration with a software design firm, we took our manual procedures and translated them into software designed to eliminate these needs, “LabGauge.” LabGauge provides an instrument dashboard that allows users to display the QC status of all registered instruments, upload new reports, view past reports, add/delete instruments, and retrieve process controls charts. By using the “QC Priority” feature in the software, the user can quickly assess the status of each device and schedule QC as needed. Instruments that have failed QC or are past due for QC are prioritized and displayed in a different color at the top of the list. The frequency of which QC should be performed is set by the user and is used to determine when it is past due. The upload function enables the user to upload multiple XML files at a time as well as add comments to each file. The “QC Runs” feature summarizes all of the past QC runs and allows users to review reports and visualize the data. An “Instruments” menu lists all devices tracked by the software and allows the addition and deletion of instruments. The “Process Control Charts” tab displays plots that are a summary of the QC runs uploaded for a particular device ( Fig. 4 ). The charts are interactive and allow users to click on a point to view the corresponding report.
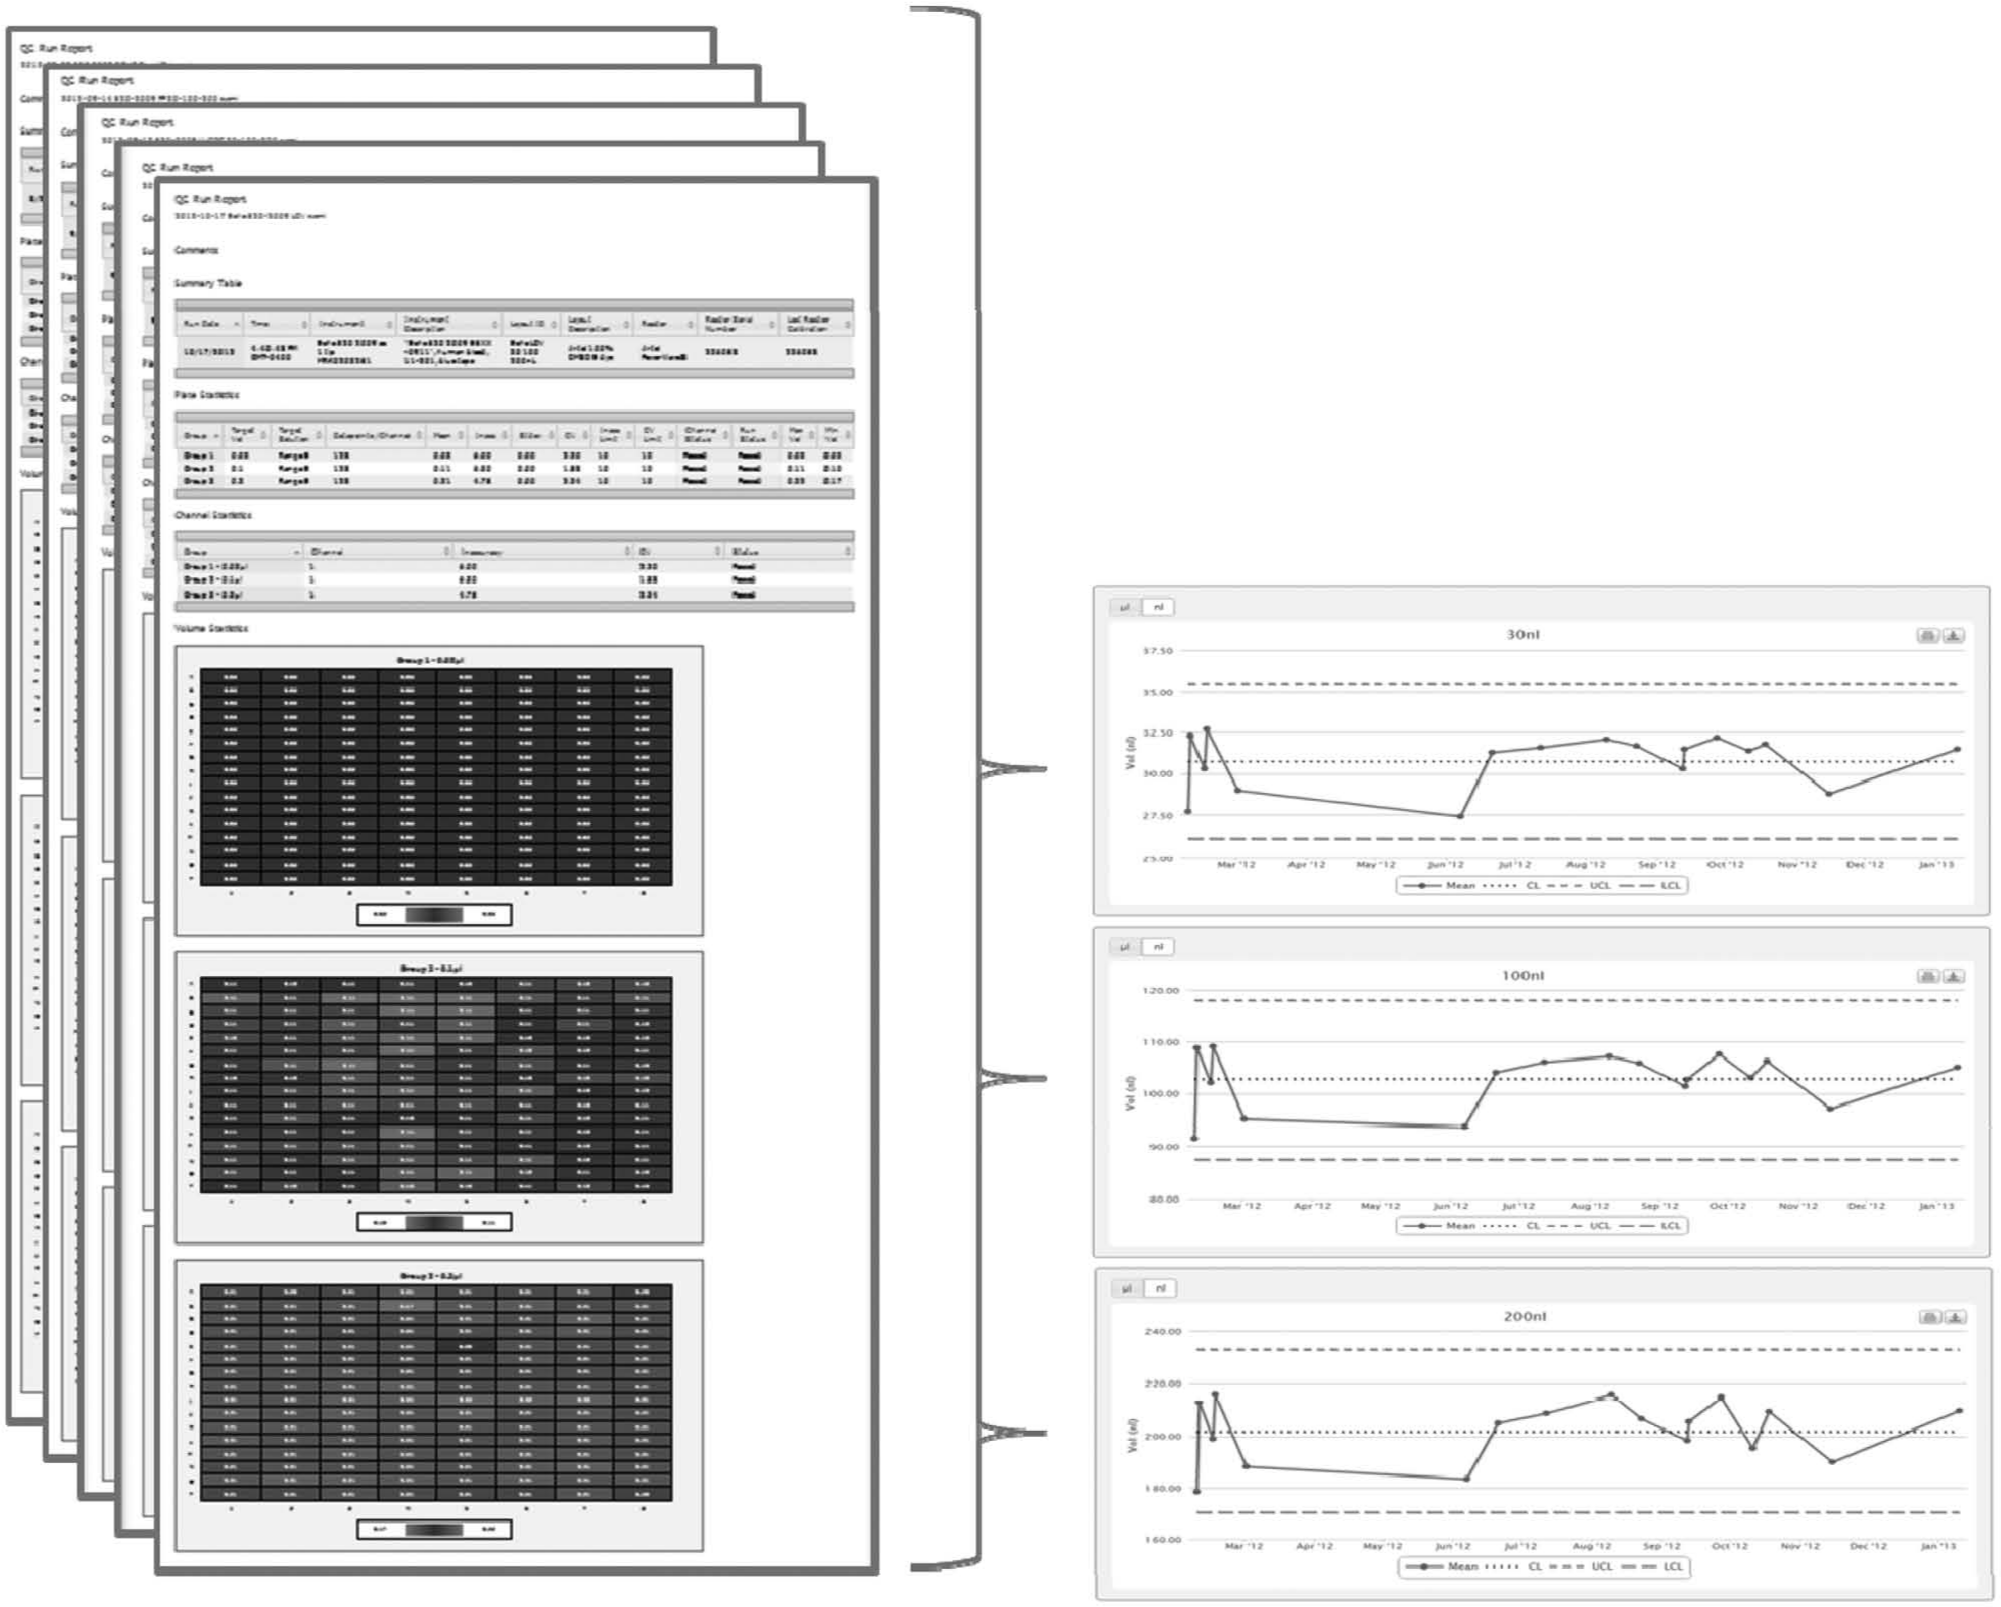
LabGauge software process is depicted in the diagram; it takes multiple ARTEL MVS quality control (QC) reports (left) and produces an interactive process control chart (right). This example is of the Echo 520 dispenser. The chart plots the mean volume (average of 384 wells) dispensed on the date the QC method was performed for the instrument. The mean and upper and lower control limits are also calculated by LabGauge and displayed in the process control chart. The upper and lower control limits are calculated as three times the standard deviation of the displayed points.
By using this software, the time it takes to review the reports and analysis of the data has been reduced by 90%, from approximately an hour to 5 min per instrument (these additional time savings are not included in our cost comparison calculations). This tool saves the scientist a great deal of analysis time, in addition to the experimental time savings by using the MVS method.
As miniaturization and throughput increase, rigorous testing procedures are required to maintain confidence in instrumentation. Equipment that is not maintained or monitored can be a source of significant error in an experiment. 10 Quality control is used to measure and track the performance of the instrumentation compared with manufacturing specifications and is implemented to avoid experimental failures. 11 The dual-dye photometric method, newly developed to determine volumes on the nanoliter scale in 100% DMSO, has proven to be a reliable and more efficient and cost-effective technique for high-throughput QC as validated against the Alexa Fluor method.
With today’s research environment, staff time is at a premium, and running long QC processes and/or repeating experiments on failing equipment can cause significant delays and increase overhead for research projects. To avoid experimental failures, a QC process must be in place, 10 and time and cost are critical factors to consider when selecting a method. The Alexa Fluor method is more time-consuming due to the time it takes to create a standard curve, shake, and analyze the plates. Despite the higher price of ARTEL consumables, the MVS method is actually less expensive when taking labor cost into account. Instead of the scientist spending time to QC instruments, he or she can focus on higher value tasks.
For the past 5 years, the Alexa Fluor method was used at our facility, but we recently have switched to the ARTEL MVS, using the newly developed ARTEL R&D DMSO E. Performing QC on equipment increases the confidence in the device by determining reliability, increasing experimental accuracy, and minimizing downtime. 11 We have found that with constant monitoring of nanoliter dispensers, issues are caught before experiments are compromised. On one occasion, an Echo instrument was found to be overdispensing by 40%. After the overdispensing was reported to the manufacturer, Labcyte had to repeat the process with its own QC method to prove the issue was real, using more resources and time. Ideally, we would recommend that manufacturers and ARTEL work together to detail an exact QC method that both companies can rely on, making it easier for customers to report issues without the need for Labcyte to repeat the experiment.
Footnotes
Acknowledgements
We acknowledge ARTEL and StackWave for their collaboration. We thank Ilona Kariv for a critical reading of the manuscript.
Declaration of Conflicting Interests
The authors declared no potential conflicts of interest with respect to the research, authorship, and/or publication of this article.
Funding
The authors received no financial support for the research, authorship, and/or publication of this article.