
Abstract
We have discovered that the immunoreactivity of the fluorophore Alexa Fluor 488 survives glutaraldehyde and osmium tetroxide fixation and epoxy resin embedding and etching. We have developed new localization methods that for the first time take advantage of this property. The antigen is localized in cryosections using suitable primary antibody and an Alexa Fluor 488-conjugated secondary antibody. Cryosection fluorescence can be photographed for later correlation with electron microscopy (EM) findings. The sections are then further fixed with glutaraldehyde and OsO4, if desired and flat-embedded in epoxy resin. Semi-thin sections are etched completely with sodium ethoxide, whereas thin sections are partially etched. Alexa Fluor 488 is then localized with rabbit anti-Alexa Fluor 488 and goat anti-rabbit conjugated to Alexa Fluor 488 [light microscopy (LM)] or to colloidal gold (EM). A second antigen may also be localized using Alexa Fluor 568. When used without postfixation, these methods produce high-resolution semi-thin, or even thin, sections that retain a high level of fluorescence for LM observations. These methods allow highly sensitive immunolocalizations in tissue while preserving cell fine structure through traditional fixation and epoxy embedding. In demonstration of the methods, we describe the localization of the thiazidesensitive sodium/chloride cotransporter and the epithelial sodium channel in rat kidney.
Keywords
I
We have developed new preembedding localization methods for LM and EM immunolocalization that are highly sensitive even when used with fixations that well preserve tissue structure. Central to these methods are amplification methods that rely on the resistance of the immunoreactivity of the fluorophore, Alexa Fluor 488 (Molecular Probes Invitrogen Detection Technologies; Carlsbad, CA) to glutaraldehyde and osmium fixation and epoxy resin embedding. We have used these methods to demonstrate the localization of the thiazide-sensitive sodium/chloride cotransporter (NCC) and the epithelial sodium channel (ENaC) in the rat kidney. NCC is known to be located in the distal convoluted tubule (DCT) of the rat kidney (Costanzo 1985; Obermuller et al. 1995; Plotkin et al. 1996) where it functions to reabsorb sodium chloride from the urine. ENaC is amiloride-sensitive and is found in the kidney (Canessa et al. 1994) and regulated primarily by aldosterone (Pacha et al. 1993; Masilamani et al. 1999). In the cortex, it is found in the most distal portion of the DCT (DCT2), the connecting tubule (CNT) (Bachmann et al. 1999), and the cortical collecting duct (CCD) (Palmer and Frindt 1986) of the nephron and functions to reabsorb sodium from the urine.
Materials and Methods
Tissue
Sprague Dawley rats weighing 100-150 g were fed either a control diet (3.9 g Na/kg) or a low sodium diet (3.8 mg/kg) for 10 days. Kidneys of ketamine/pentobarbital-anesthetized rats were perfused for 2 min with PBS followed by 5 min perfusion with 2% paraformaldehyde in PBS. All animal treatments were reviewed and approved by the University of Maryland and conform to federal guidelines. Fixed kidneys were removed from the animal, cut into 3- to 4-mm-thick sections, and further fixed for 60 min in the same fixative. The fixed kidney slices were rinsed in PBS and immersed in cryoprotectant (10% EDTA in 0.1 M Tris buffer) for 60 min. This cryoprotectant solution is also a strong chelating agent for divalent cations, even being used to decalcify compact bone (Fullmer and Link 1964). Evidence has been presented by others that a critical step in some antigen retrieval procedures is the removal of tissue-bound calcium (Morgan et al. 1994), which suggests that the cryoprotectant in our procedure may also serve as an effective retrieval agent. After treatment of the tissue with EDTA solution, 20-μm-thick cryostat sections were cut, picked up on untreated coverslips, and immediately covered with PBS.
Preembedding Localization
Unless otherwise noted, all solutions in the localization procedures contained 0.05% saponin, 0.1% Tween-20, and 2 mM sodium azide. Each 20-μm section, in suspension in a small volume of reagent, was treated with blocking solution (PBS containing 1% BSA and 1% human serum) for 30 min, then with the primary antibodies diluted in incubation medium (IM; PBS containing 0.1% BSA) overnight at 4C. Primary antibodies used were rabbit anti-NCC (diluted 1:100; gift of M. Knepper, NHLBI, NIH) together with mouse anti-calbindin (diluted 1:50; Sigma, St Louis, MO), or rabbit anti-β-ENaC (diluted 1:110; gift of M. Knepper, NHLBI, NIH) together with mouse anti-calbindin. The next day the sections were washed with high-salt wash (50 ml PBS + 1.13gNaCl + 0.5 g BSA) three times for 5 min each, once for 15 min, and once for 30 min. Secondary antibodies were then applied. In both cases, IM contained goat anti-rabbit IgG Alexa Fluor 488 (diluted 1:200; Molecular Probes Invitrogen Detection Technologies) and goat anti-mouse IgG1 Alexa Fluor 568 (diluted 1:200; Molecular Probes Invitrogen Detection Technologies). Method controls consisted of substitution of preimmune serum for the specific antibody preparations, equivalently diluted. These controls were negative. Also, in single-labeling experiments, when primary antibody and Alexa Fluor 568-labeled secondary antibody (both from species other than rabbit) were applied to sections, then rabbit anti-Alexa Fluor 488 and anti-rabbit Alexa Fluor 488 were applied, no cross-reactivity of anti-Alexa Fluor 488 with Alexa Fluor 568 was observed.
Before postfixation and embedding of the sections for EM, they were photographed by fluorescence microscopy to keep a record of the labeling pattern for future reference when selecting areas for semi-thin or thin sectioning.
Postfixation and Embedding
For EM of thin sections, samples were postfixed 15 min at room temperature in 2% glutaraldehyde (in 0.1 M sodium cacodylate, pH 7.4). After thorough washing in PBS, the samples were fixed for 15 min at 0C in 0.3% OsO4, freshly diluted from 2% stock, in cacodylate, then washed in PBS. Some samples were prepared only for LM examination of semi-thin sections. These samples were not postfixed but were embedded in epoxy resin, as described below. All samples were dehydrated in ethanol, then propylene oxide, and finally infiltrated with EMbed-812 (soft formulation; Electron Microscopy Sciences, Ft. Washington, PA). The fully infiltrated cryostat sections were pressed between two sheets of polyethylene film, which in turn were pressed between two glass slides, producing very flat samples for selection of areas of interest. Samples were polymerized 18 hr at 60C.
Sectioning
The flat-embedded cryostat sections were compared with the fluorescence images obtained before postfixation for selection of suitable areas to thin section. These areas were cut out and glued to the flat end of specimen blanks. Semi-thin sections (1 μm) were then cut at a depth into the section that would contain the tubules of interest. Finally, a semi-thin section was cut from each block and attached to a coverslip coated with Histogrip (Zymed; South San Francisco, CA), and thin sections were immediately cut from the same block face and picked up on uncoated 200-mesh nickel grids. Thus, the structures in the thin sections could be directly compared with the structures in the semi-thin and cryostat sections.
Postembedding Labeling
The semi-thin sections—both for fluorescence only and those serving as companions to the thin sections—and thin sections were subjected to the following antibody localization procedures. The EMbed-812 was dissolved from the semi-thin sections by treating them for 15 min with 1/6 saturated sodium ethoxide freshly diluted with ethanol. Sodium ethoxide was produced by allowing a saturated solution of NaOH in ethanol to age at room temperature in the dark for several days, until a burgundy color developed. This stock solution was diluted for use. The thin sections were etched in freshly diluted 1% saturated sodium ethoxide for times determined for each localization experiment. Because of small differences in the sodium ethoxide and/or the embedding plastic, optimal etching times varied from 5 sec to 60 sec. Etching times that were too long reduced the sample resolution, produced large holes in the sections, or dissolved them completely, whereas too-short times resulted in decreased labeling intensity.
Alexa Fluor 488 was localized in the semi-thin sections and in the thin sections using nearly identical protocols. The etched sections were first treated for 20 min with blocking solution, then with rabbit anti-Alexa Fluor 488 (diluted 1:400) for 2 hr at room temperature. After washing with five changes of high-salt wash over a 30-min period, the sections were treated with goat anti-rabbit Ig conjugated to Alexa Fluor 488 for LM or to 10-nm colloidal gold (Sigma) for EM. After 2 hr, the sections were washed as before and then rinsed with PBS. Semi-thin sections were mounted in Vectashield anti-fade medium (Vector Laboratories; Burlingame, CA) on glass slides, while the thin sections were further rinsed in distilled water, air dried, and stained with uranyl acetate and lead citrate.
Results
Initial experiments with rabbit antibody to Alexa Fluor 488 were performed to test the feasibility of our post-embedding labeling strategy for EM. NCC and calbindin were localized in 5-μm paraffin sections on slides according to the protocol given above for 20-μm sections (without saponin). The resulting fluorescence for Alexa Fluor 488 and for Alexa Fluor 568 was photographed, and the same region was photographed again after glutaraldehyde fixation and again after OsO4 fixation. Finally, the immunoreactive Alexa Fluor 488 remaining in the sections was localized with rabbit anti-Alexa Fluor 488 and goat anti-rabbit IgG conjugated to Alexa Fluor 488 as above. Figure 1 shows fluorescence of a section subjected to these procedures. The fluorescence intensity in this figure is semi-quantitative in that the conditions of gain, exposure time, and magnification were the same for all images of each primary antibody. Fluorescence after the initial localization procedure is strong and specific for both NCC (Figure 1A) and calbindin (Figure 1B). After glutaraldehyde fixation (Figures 1C and 1D), considerable background fluorescence has been introduced such that, particularly in the case of NCC, specific labeling is obscured. OsO4 treatment almost completely eliminates all background fluorescence and Alexa Fluor 488 fluorescence (Figure 1E). Alexa Fluor 568 fluorescence is more resistant but is also reduced (Figure 1F). Subsequent localization of Alexa Fluor 488 with rabbit anti-Alexa Fluor 488 and Alexa Fluor 488-labeled anti-rabbit results in a strong specific label (Figure 1G, compare with Figure 1A). Similar experiments substituting Alexa Fluor 568-labeled anti-rabbit in the final step and omitting calbindin localization gave identical labeling patterns, except that the strongest component of labeled NCC fluorescence was red rather than green (data not shown). Together these observations show that the fluorophore Alexa Fluor 488 survives glutaraldehyde and OsO4 fixation. This labeling can be dramatically intensified by use of antibody to Alexa Fluor 488.
The fluorescence intensity of these two Alexa dyes, especially Alexa Fluor 568, appears to be little affected by embedding in EMbed-812 and complete etching by diluted sodium ethoxide. When cryostat sections in which NCC and calbindin had been localized were embedded in EMbed-812 without glutaraldehyde and OsO4 postfixation and were then sectioned at 1 μm and the EMbed-812 completely removed, Alexa Fluor 488 and Alexa Fluor 568 fluorescence was easily detectible (Figure 2A). The resulting signal-to-noise ratio with Alexa Fluor 488 is considerably improved by enhancing the Alexa Fluor 488 with anti-Alexa Fluor 488 and anti-rabbit Alexa Fluor 488 (Figure 2B).
The survival of Alexa Fluor 488 immunoreactivity and Alexa Fluor 568 fluorescence after the complete procedure of glutaraldehyde and osmium fixation and epoxy resin embedding and etching was tested by localizing NCC and calbindin in 20-μm cryosections, fixing the sections, and embedding them in EMbed-812. One-μm sections were cut, EMbed-812 was completely removed, and Alexa Fluor 488 was localized with anti-Alexa Fluor 488 and anti-rabbit Alexa Fluor 488. These samples had strong Alexa Fluor 488 fluorescence and sufficient residual Alexa Fluor 568 fluorescence to identify calbindin-positive tubules, whereas sections identically treated except with non-immune rabbit serum substituted for rabbit anti-Alexa Fluor 488 had a very low level of Alexa Fluor 488 fluorescence. A section in which Alexa Fluor 488 was relocalized using specific antibody in this procedure is shown in Figure 3B, whereas the original 20-μm section from which it was cut is shown in Figure 3A as it appeared before postfixation and embedding in EMbed-812. In this section, NCC is strongly labeled in DCT1 and DCT2 of the cortex, whereas calbindin is found in DCT2 and CNT (Figure 3A), resulting in double labeling of DCT2. One-μm sections of this same area, after complete etching and relocalization of NCC with rabbit anti-Alexa Fluor 488 and goat anti-rabbit Alexa Fluor 488, had strong label (Figure 3B) of the same tubules identified in the 20-μm sections (Figure 3A). In the 1-μm section, it is apparent that label for NCC is in the apical region of the cell (Figure 3B; see also Figure 2). The NCC-containing tubule indicated by single arrows in Figures 3A and 3B is a DCT1, as demonstrated by an absence of staining for calbindin. Thin-section localization of NCC in this same tubule reveals the typical DCT1 cell structure, with numerous apical projections and tall, vertical mitochondria within infoldings of the basal membrane (Figure 4A). Colloidal gold particles indicate an apical membrane localization of NCC (Figures 4A and 4B), along with labeling of vesicles in the apical cytoplasm (Figure 4B). Thin sections of DCT2, identified by colabeling of NCC and calbindin (Figure 3), also demonstrate an apical localization of NCC (Figure 4C). The structure of the DCT2 cells is quite variable, ranging from that of DCT1 with tall mitochondria and highly elaborated apical membrane to the type of cell shown in Figure 4C, which has shorter, more horizontally oriented mitochondria and less elaboration of the apical membrane. The DCT2 also has intercalated cells, unlike the DCT1, as previously described (Obermuller et al. 1995).
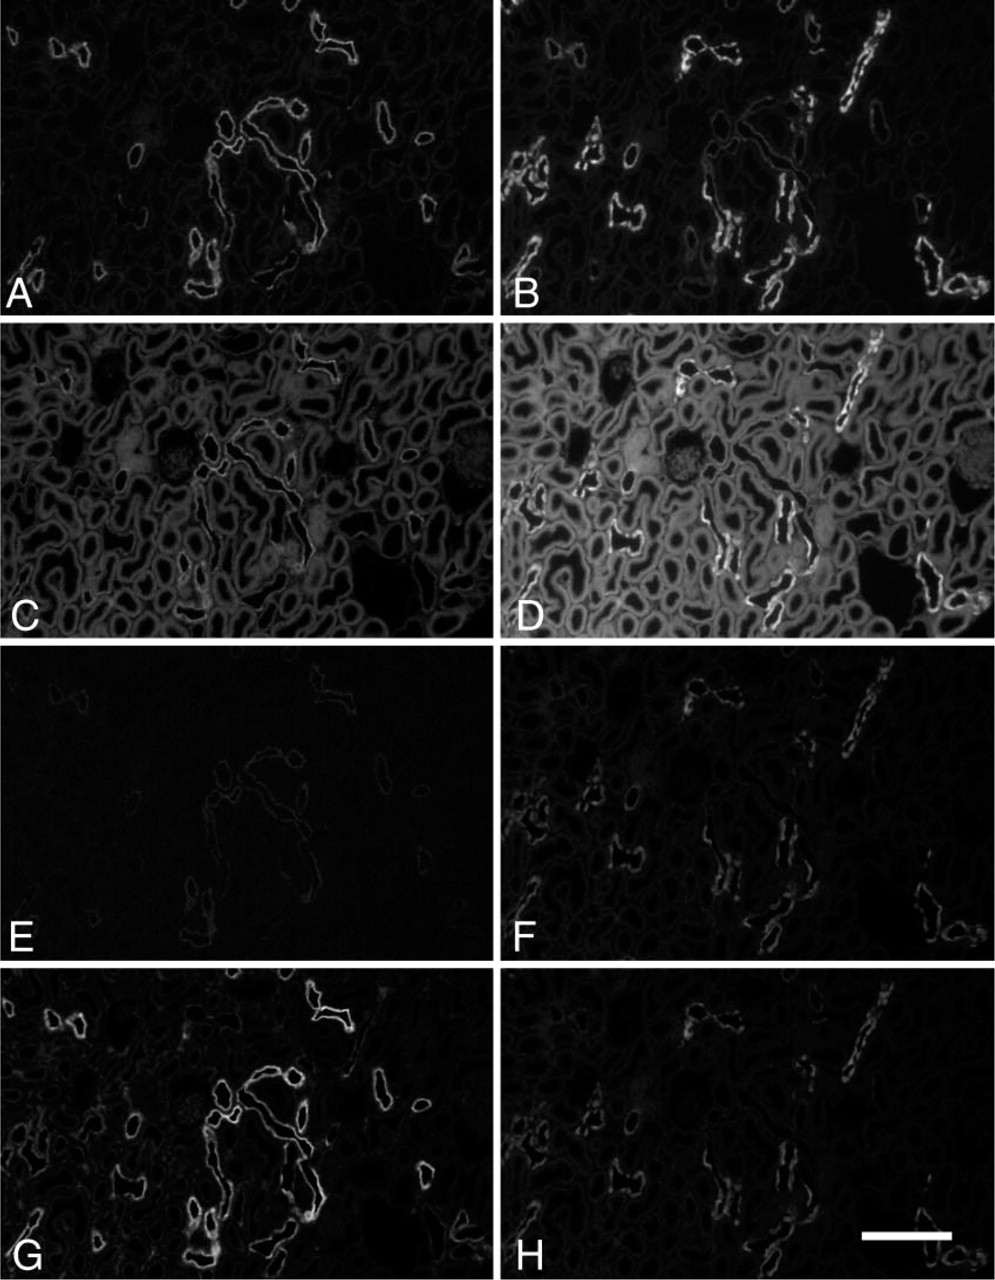
Fluorescence light micrographs (LM) showing effects of fixation on Alexa Fluor 488 immunoreactivity and fluorescence and on Alexa Fluor 568 fluorescence. Control rat kidneys were fixed in formaldehyde, embedded in paraffin, and sections attached to glass coverslips. Sodium/chloride cotransporter (NCC) and calbindin were localized in the deparaffinized sections. NCC is shown in
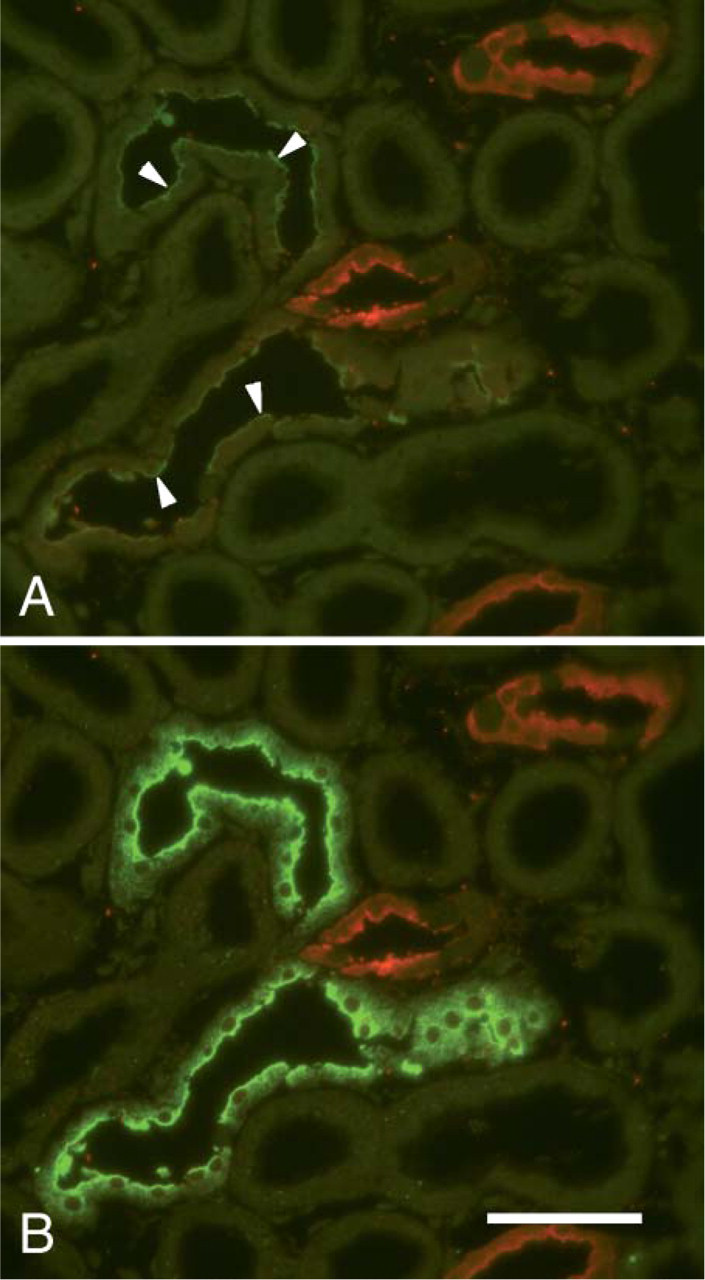
Fluorescence LM showing resistance of Alexa Fluor 488 immunoreactivity and Alexa Fluor 568 fluorescence to epoxy embedding and etching. The rat kidney was fixed in formaldehyde; cryostat sections were cutand NCC (green) and calbindin (red) were localized in the sections. These were then embedded in Ebed without postfixation in glutaraldehyde and OsO4, and 1-μm sections were cut and completely etched with sodium ethoxide, resulting in the image shown in
The label for β-ENaC in 1-μm sections was distributed throughout the cytoplasm of principal cells in CNT and CCD (Figure 5), but not in intercalated cells (Figure 5). The fingers of cytoplasm produced by infolding of the basal membrane can be seen in principal cells (Figure 5). Nuclear membrane labeling is apparent in some cells (Figure 5). In electron micrographs of thin sections of these tubules, the label is found predominately associated with vesicles and endoplasmic reticulum (ER) (Figure 6). Low magnification images of thin sections not poststained with uranium and lead but in which the colloidal gold has been enlarged by brief exposure to GoldEnhance EM (Nanoprobes, Inc.; Yaphank, NY) give an overview of the distribution of label (Figure 7). An unlabeled intercalated cell, as well as unlabeled mitochondria and nucleus in the principal cell in Figure 7, show that the amount of nonspecific label observed in these preparations is very low. Very little label can be found associated with the apical membrane of labeled cells. The nuclear membrane in these preparations often appears to be labeled, consistent with a strong ER localization (Figure 8).
When rats are fed a low-sodium diet, there is a shift in label toward the apical region of the cell as seen in 1-μm sections (Figure 9) and in thin sections, where a modest amount of label can be found in discontinuous groups associated with the apical membrane of principal cells (Figure 10).
Discussion
We have developed methods that not only produce EM localizations with high sensitivity and structural preservation but also allow correlation of localization patterns in thick cryostat sections with findings in semi-thin and thin sections. The strategy takes advantage of the commercial availability of a wide range of secondary antibodies conjugated with the Alexa Fluor 488 fluorophore and antibodies directed against this group. Others have used anti-fluorophore antibodies for EM localizations, using anti-FITC (van Dam et al. 1991) or anti-Alexa Fluor 488 (Esselens et al. 2004). However, we believe that this is the first reported case that uses the relative chemical resistance of Alexa Fluor 488 to localize this group on thin sections of tissue prepared by conventional EM methods. Thus, the cell fine structure is generally superior to methods that do not include osmium fixation, as with postembedding labeling methods.
Osmium tetroxide fixation is considered to be a very harsh treatment for most antigens and is traditionally avoided in immunolocalization procedures. Methods for using osmium-fixed tissue in EM localization procedures have been described (Bendayan and Zollinger 1983; Stirling and Graff 1995; Morris and Ciraolo 1997), but we have found these methods to be unsatisfactory for studying sparse antigens such as ion channels. The method we describe allows use of osmium fixation to improve cell structure by labeling the primary antibody with an Alexa Fluor 488-conjugated secondary antibody before osmium fixation and epoxy embedding. A similar method has been described (Pathak and Anderson 1989) in which an osmium-resistant localization was achieved by using a dinitrophenol (DNP)-labeled secondary antibody, followed by localizing the DNP in thin sections. Their report demonstrated the generally superior structure and sensitivity of the strategy. An additional contribution to the sensitivity of the method is the possibility of lightly etching and exposing both sides of the epoxy thin section to the antibodies. This method produces about the same labeling intensity as complete removal of the epoxy resin from sections on coated grids and yields much better ultrastructural preservation (Brorson 2001). In addition, labeling both sides of the section approximately doubles the labeling intensity over labeling only one side that has been equivalently treated.
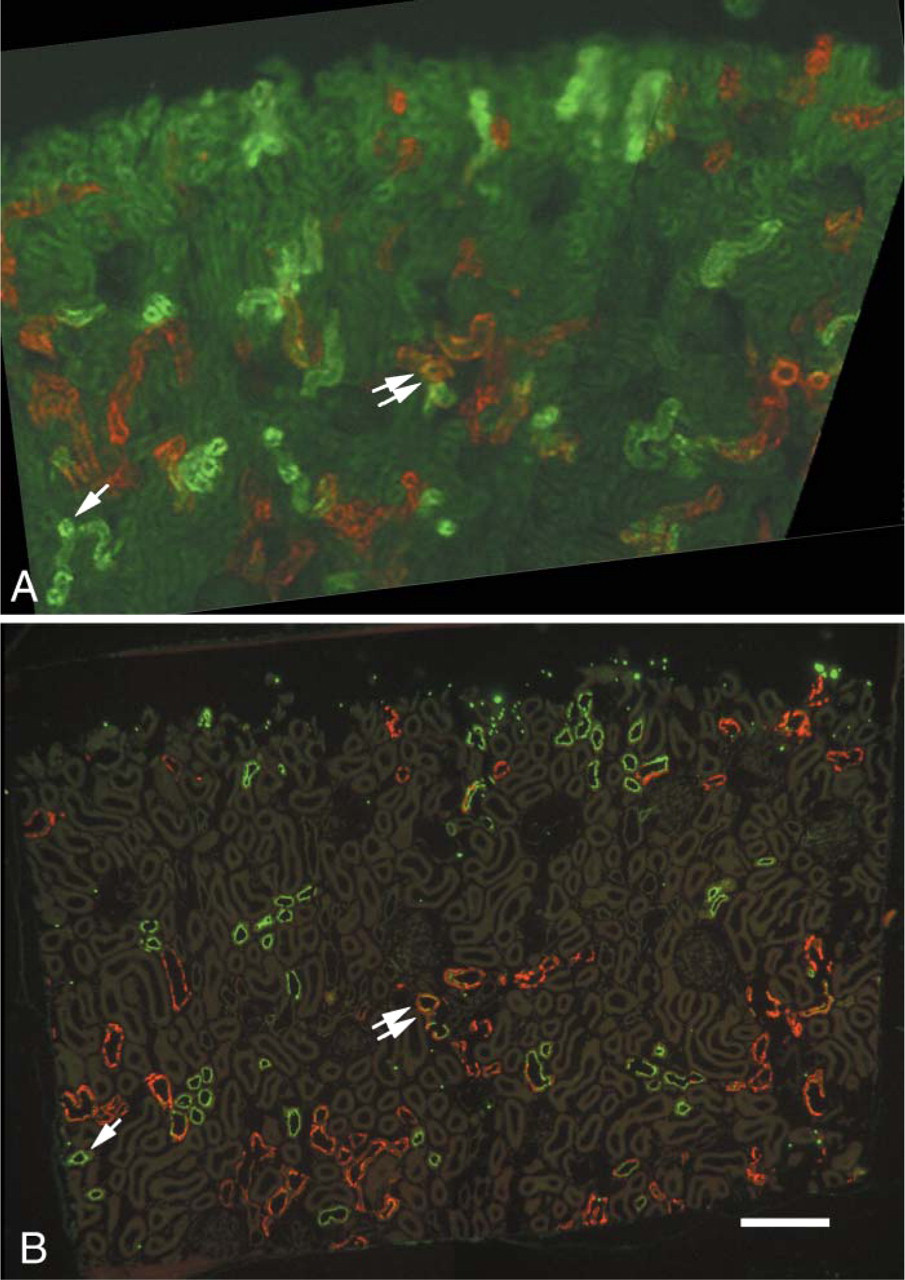
Fluorescence LM showing comparison of fluorescence in a 20-μm section before postfixation (
The fluorescent group, Alexa Fluor 488, unlike DNP, makes possible the detection and recording of localization patterns before embedding the tissue. This allows specific tubules—even cells—to be easily found, sectioned, and their immunolocalization patterns examined in semi-thin and thin sections. The importance of using the adjacent semi-thin section in studies cannot be overemphasized. On thin sections, finding particular labeled tubules that were identified in thick cryostat sections proved to be unexpectedly challenging because of the tangle of tubules in the renal cortex. However, by superimposing the image of the 1-μm section over the image of the 20-μm section from which it came, tubule correspondence could be easily determined.
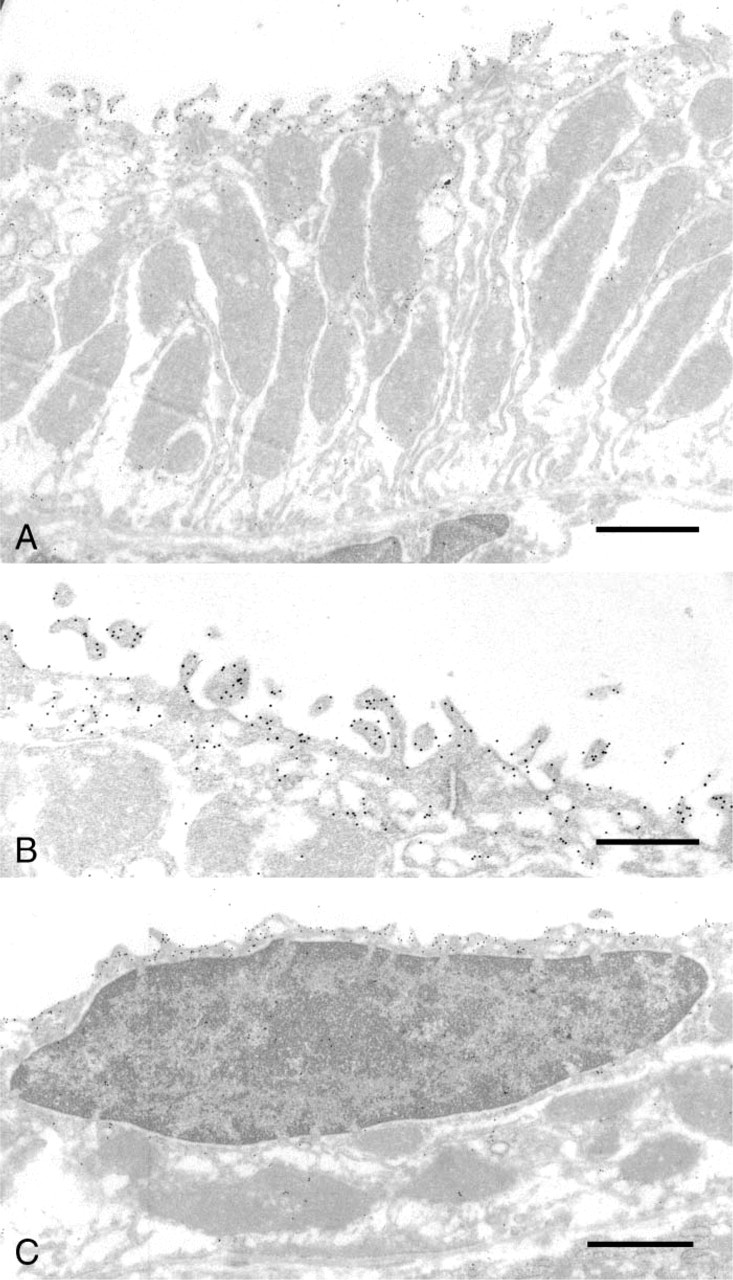
Transmission EM of NCC localization rat kidney. These images are from a thin section that was a neighboring section to the 1-μm section shown in Figure 3B. The thin section was etched lightly with sodium ethoxide and NCC was localized with rabbit anti-Alexa Fluor 488 and 10-nm-gold-conjugated anti-rabbit. The tubule in (
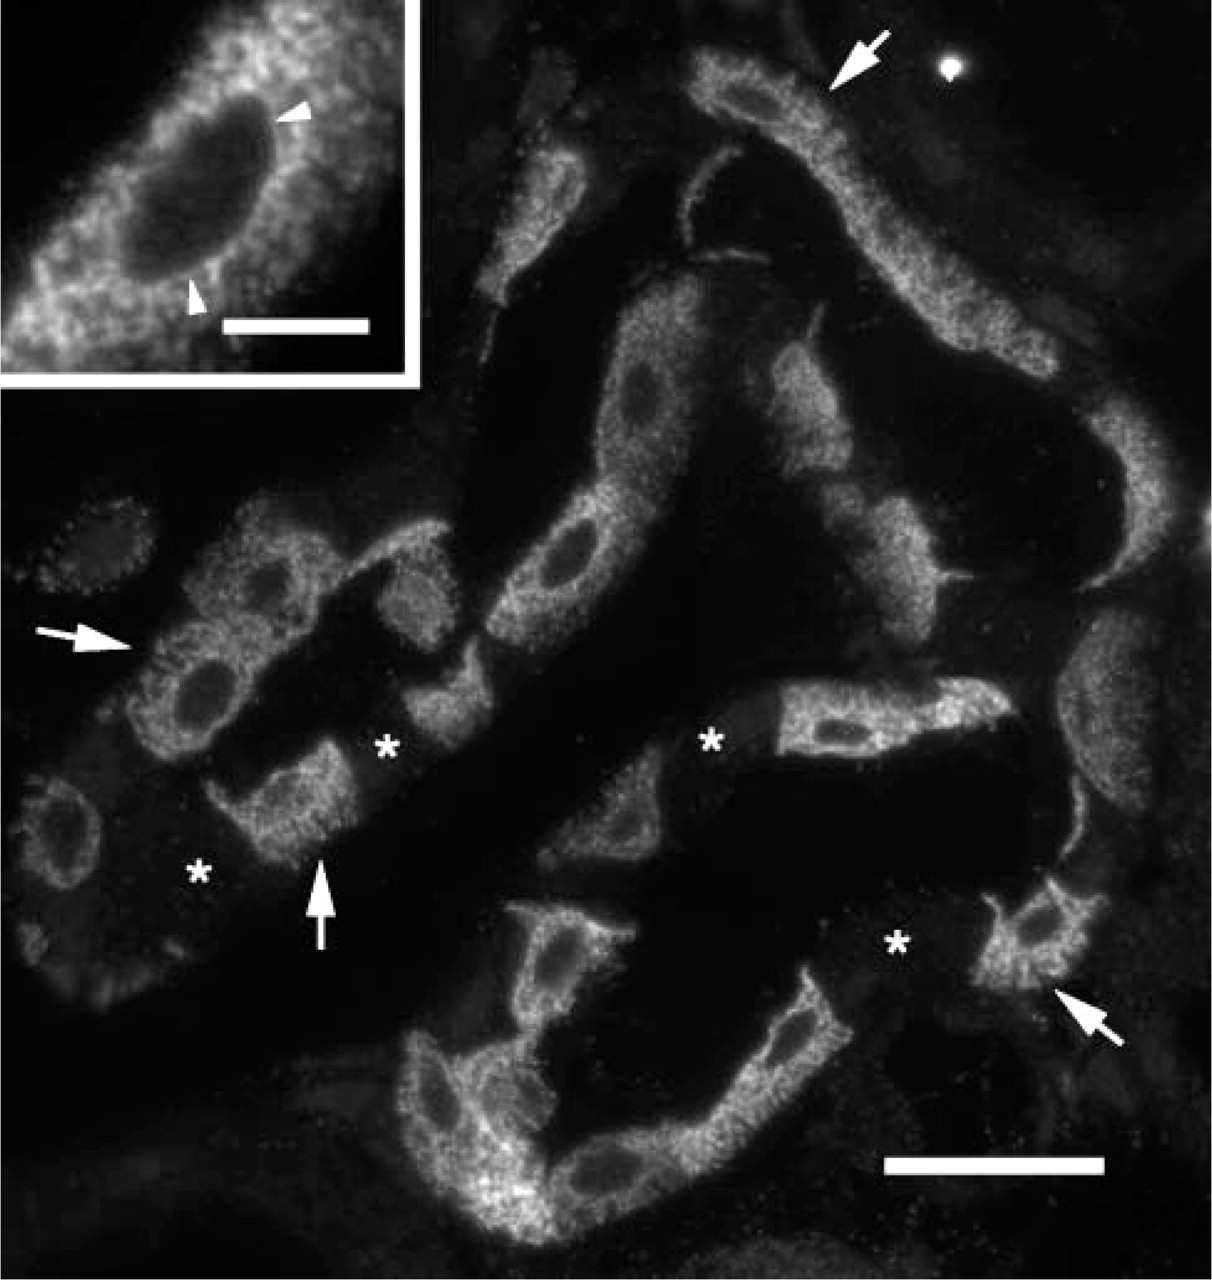
Fluorescence LM showing localization of the endothelial sodium channel (β-ENaC) in the connecting tubule (CNT) in 1-μm section. The complete procedure as described above for semi-thin section (1 μm) localizations was followed. This high-resolution LM shows the cytoplasmic distribution of the label, including the cytoplasmic fingers that extend basally from many principal cells (arrows). Several of the intercalated cells, which are unstained, are indicated with asterisks. An apparent nuclear membrane localization is indicated (arrowheads, inset). Bar = 20 μm; inset bar = 5 μm.
There is substantially a one-to-one correspondence between labeled tubules in cryostat sections, 1-μm sections, and thin sections. The fluorescence of even the most weakly labeled tubules in 20-μm sections can be detected in the corresponding 1-μm sections. However, specific label in thin sections of these weakly labeled tubules may or may not be detected, depending on the amount of background label.
These new methods are useful for LM as well as for EM. The ability to produce extremely thin sections for light microscopic examination is important for resolution of cell structure because of interfering, out-of-focus structures above and below the plane of focus in commonly used cryo- and paraffin sections. Although this problem can be considerably reduced by use of a confocal microscope, the associated methods do not allow EM examination of the samples. A useful alternative is to use thin cryosections produced with a cryo-ultramicrotome (Takizawa and Robinson 2003,2004), which can also be used to correlate fluorescence and EM localizations. Our epoxy resin embedding method, although not examining exactly the same section with fluorescence and EM, offers an alternative that allows both fluorescent and high-resolution EM localizations to be carried out on the same samples, surveying large areas by fluorescence microscopy for possible EM study. All that is needed is the usual equipment found in a basic EM facility.
The use of epoxy resins in postembedding labeling, similar to paraffin embedding, has been previously reported (Groos et al. 2001). This type of method shows promise when localizing antigens that react strongly with their specific antibody. However, of the 36 combinations of primary antibodies and retrieval methods that we have tested, the combinations that were weakly positive with cryostat sections were negative with epoxy resin postembedding labeling. On the other hand, labeling of semi-thin epoxy sections pre-labeled with Alexa Fluor 488, using anti-Alexa Fluor 488 and Alexa Fluor 488-labeled secondary antibody, gave fluorescence labeling that appeared to be comparable to, or stronger than, cryostat or paraffin sections alone.
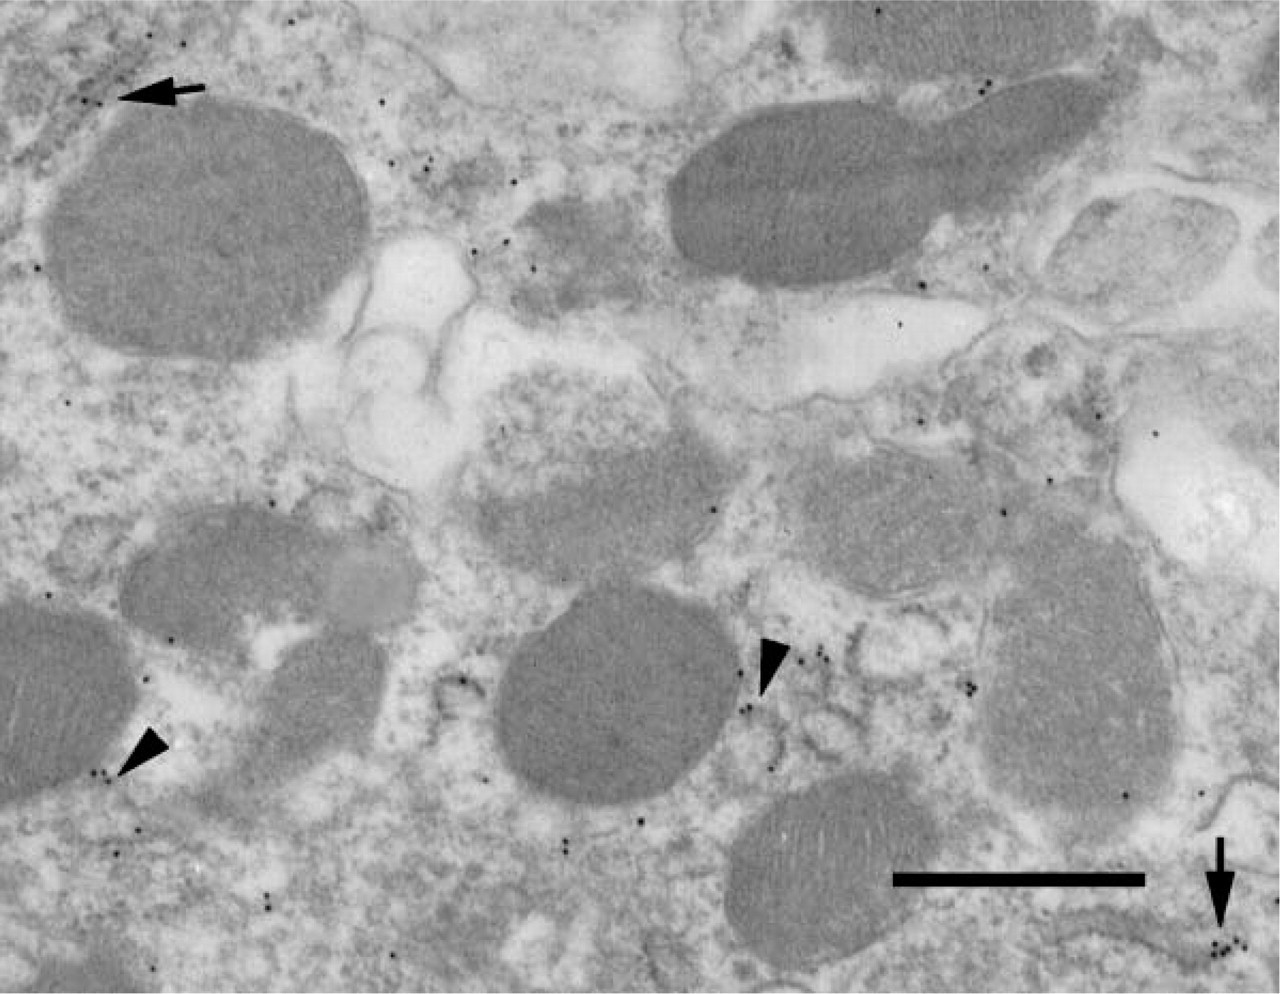
Transmission EM showing localization of β-ENaC. The localization procedure was asapplied in Figure 4. Vesicle label is indicated with arrowheads and rough endoplasmic reticulum label with arrows. Bar = 0.5 μm.
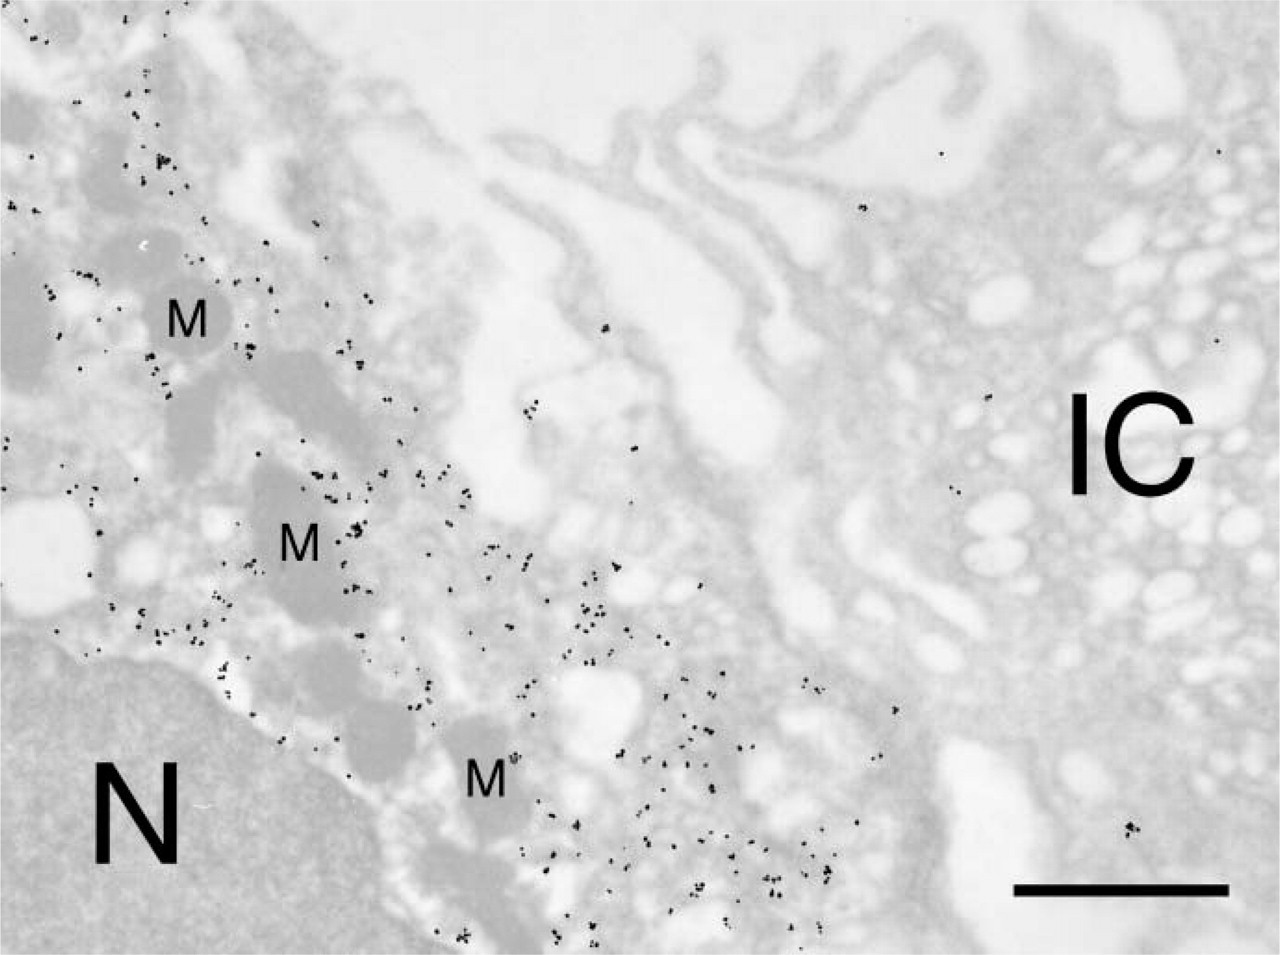
Transmission EM showing overview of tubule labeling for β-ENaC. The sample was treated as in Figure 4 except that the colloidal gold was enlarged by a 30-sec treatment with Gold Enhance and the thin section was not stained with U and Pb. A general cytoplasmic label is indicated. The interior of the nucleus (N) of the principal cell and mitochondria (M) are not labeled. The adjacent intercalated cell (IC) serves as an internal method control and indicates a low level of background label. Bar = 1 μm.
For multiple fluorophore, fluorescence-only studies using this anti-Alexa Fluor 488 method, we generally recommend against using glutaraldehyde and OsO4 fixation because there is some attenuation of the fluorescence of the second label by osmium. However, the quenching of fluorescence by OsO4 fixation can be an advantage in cases of interfering autofluorescence. In these cases, the antigen of interest can be localized in the tissue using an Alexa Fluor 488-conjugated secondary antibody, and then the autofluorescence (or other background fluorescence, as in Figure 1) can be quenched by fixation with osmium. Subsequent incubation of the tissue with rabbit anti-Alexa Fluor 488 and fluorophore-conjugated secondary antibody relocalizes the specific label in the absence of autofluorescence.
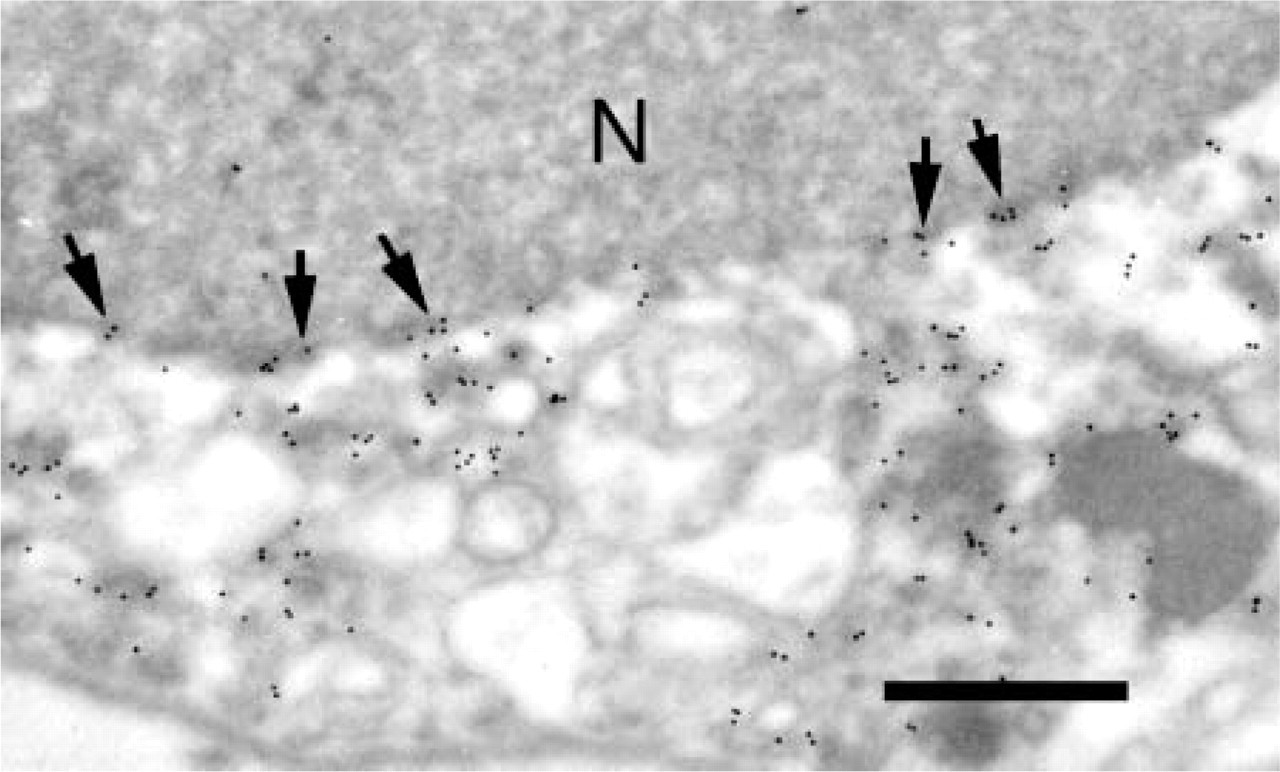
Transmission EM showing localization of β-ENaC. Localization as in Figure 4. The nuclear membrane of this principal cell is labeled (arrows). N, nucleus. Bar = 0.5 μm.
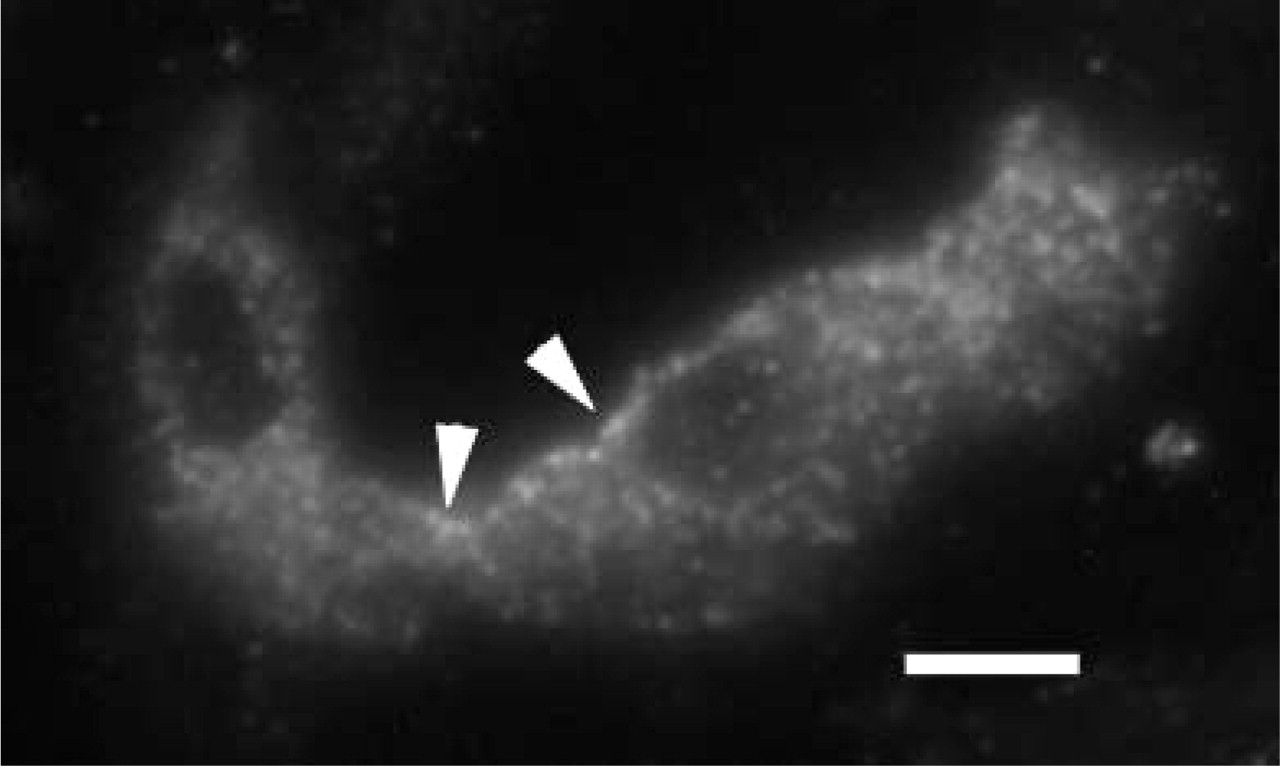
Fluorescence LM showing localization of β-ENaC in CNT in 1-μm section from kidney of rat fed a low sodium diet. Other than the diet, the sample was treated as in Figure 5. There is an apparent shift of β-ENaC toward the apical region of the cells, where there is a discontinuous layer of label in the region of the apical membrane (arrowheads). Bar = 10 μm.
The methods described here are, for the most part, combinations of preembedding and postembedding labeling methods and avoid the use of colloidal gold-labeled antibodies prior to embedding. This is important because even smaller sizes of colloidal gold produce large complexes when stabilized by immunoglobulin molecules (Hainfeld and Powell 2000) that can interfere with penetration by the labeled antibody. Although FluoroNanoGold (Nanoprobes, Inc.) appears to overcome this problem (Robinson and Vandre 1997; Hainfeld and Powell 2000), penetration by the primary antibody is limiting as with our method and, additionally, enhancement of the gold is required except in specialized cases. Enhanced gold tends to be of variable size and shape (Jensen and Norrild 2005), and the enhancement method can cause spurious nucleation. Because of the variable size and shape, we sometimes have had trouble distinguishing enhanced gold from dense inclusions, stain, etc. Thus, we prefer the postembedding use of colloidal gold, which has relatively uniform size and spherical shape on thin sections where the antigen has been labeled prior to embedding using Alexa Fluor 488.
EM localization of NCC was previously reported by Verlander et al. (1998) using a postembedding labeling method. Their results showed a convincing apical membrane localization, but our method shows more intense labeling. Also, without a second marker antigen such as calbindin, they were not able to distinguish the two regions of the DCT, i.e., the DCT1 and DCT2 (Obermuller et al. 1995). We have found that much of the label for NCC can occur in tubules that do not have the classical DCT morphology and thus could be missed in studies that rely on morphological criteria to identify DCT. Our method, using two marker antigens, unambiguously identifies DCT1 and DCT2 segments for study.
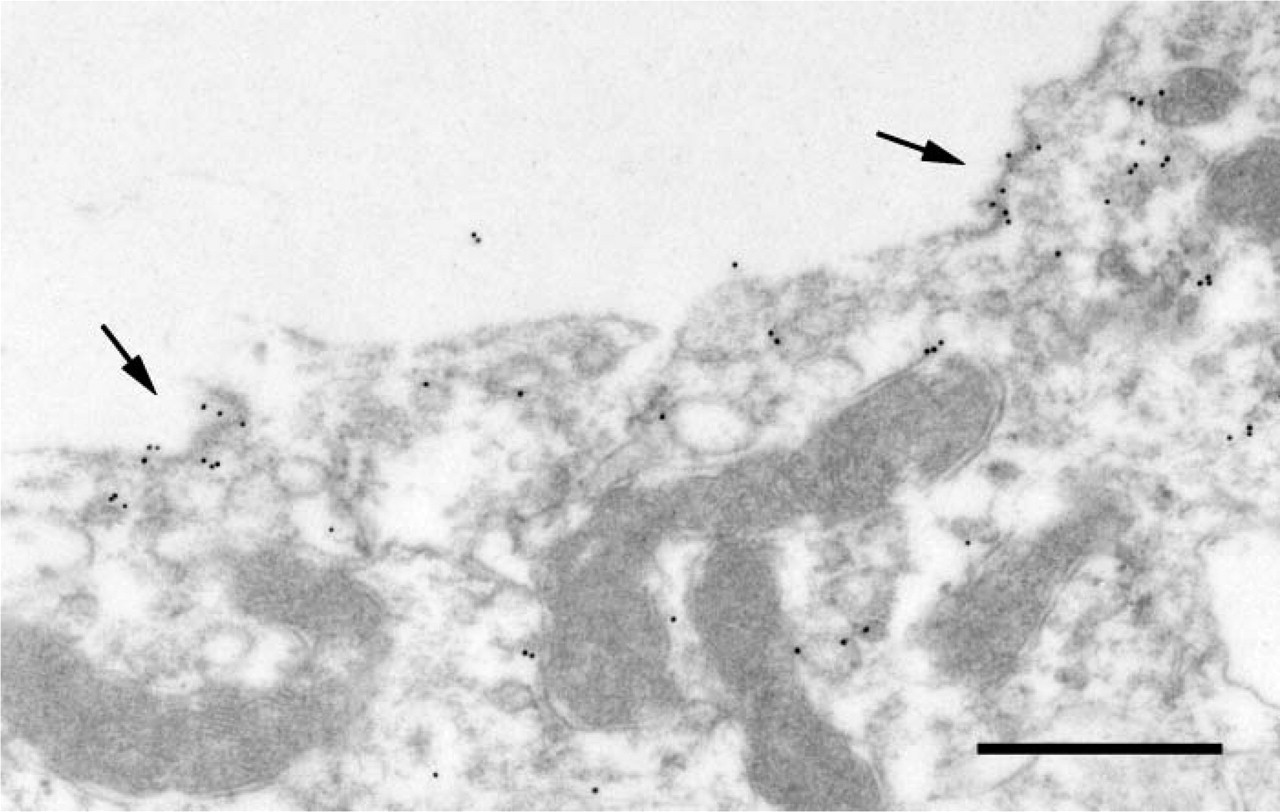
Transmission EM showing localization of β-ENaC in thin section from kidney of a rat fed a low sodium diet. Sample prepared as in Figure 4. There are scattered groupings of gold particles (arrows) associated with the apical membrane. Bar = 0.5 μm.
We have confirmed the vesicular localization of β-ENaC reported by Hager et al. (2001) in EM studies of kidneys for animals on a control diet and extend the fine structural observations to demonstrate ENaC labeling in rough ER (including the nuclear membrane). In addition, we observed a distinct patchy apical localization of the channel in kidneys of rats fed a low sodium diet. Previous physiological (Frindt et al. 2001) and LM (Loffing et al. 2001) studies suggested an apical plasma membrane localization of ENaC in rodents fed a low sodium diet. We believe that the additional label that we detected is due to the increased sensitivity of our method compared with the earlier study (Hager et al. 2001).
Footnotes
Acknowledgements
This work was supported by Grant DK-32839 from the National Institutes of Health, Bethesda, MD and by a grant from the American Heart Association (AHA-0255587N).