
Abstract
Amine-reactive N-hydroxysuccinimidyl esters of Alexa Fluor fluorescent dyes with principal absorption maxima at about 555 nm, 633 nm, 647 nm, 660 nm, 680 nm, 700 nm, and 750 nm were conjugated to antibodies and other selected proteins. These conjugates were compared with spectrally similar protein conjugates of the Cy3, Cy5, Cy5.5, Cy7, DY-630, DY-635, DY-680, and Atto 565 dyes. As N-hydroxysuccinimidyl ester dyes, the Alexa Fluor 555 dye was similar to the Cy3 dye, and the Alexa Fluor 647 dye was similar to the Cy5 dye with respect to absorption maxima, emission maxima, Stokes shifts, and extinction coefficients. However, both Alexa Fluor dyes were significantly more resistant to photobleaching than were their Cy dye counterparts. Absorption spectra of protein conjugates prepared from these dyes showed prominent blue-shifted shoulder peaks for conjugates of the Cy dyes but only minor shoulder peaks for conjugates of the Alexa Fluor dyes. The anomalous peaks, previously observed for protein conjugates of the Cy5 dye, are presumably due to the formation of dye aggregates. Absorption of light by the dye aggregates does not result in fluorescence, thereby diminishing the fluorescence of the conjugates. The Alexa Fluor 555 and the Alexa Fluor 647 dyes in protein conjugates exhibited significantly less of this self-quenching, and therefore the protein conjugates of Alexa Fluor dyes were significantly more fluorescent than those of the Cy dyes, especially at high degrees of labeling. The results from our flow cytometry, immunocytochemistry, and immunohistochemistry experiments demonstrate that protein-conjugated, long-wavelength Alexa Fluor dyes have advantages compared to the Cy dyes and other long-wavelength dyes in typical fluorescence-based cell labeling applications.
Keywords
B
This work compares newly available, water-soluble, amine-reactive N-hydroxysuccinimidyl esters (SEs, also known as NHS esters) of Alexa Fluor dyes (Molecular Probes; Eugene, OR) with the SEs of the Cy series of dyes and some other currently available long-wavelength dyes. Except for Alexa Fluor 633, which is a sulfonated rhodamine derivative, all of these new Alexa Fluor dyes are sulfonated carbocyanine molecules. The dyes in both series can be grouped by absorption maxima and are referred to here as Cy3-like, Cy5-like, and so forth. In the Cy3-like group, the Alexa Fluor 555, DY-550, and Atto 565 dyes are spectrally comparable to Cy3 (Cy 3.18, 3.29). The Alexa Fluor 633, Alexa Fluor 647, DY-630, and DY-635 dyes can be compared to Cy5 (Cy 5.18, 5.29) (Cy5-like), and in the Cy5.5-like group, the Alexa Fluor 660, Alexa Fluor 680, and DY-680 dyes are comparable to Cy 5.5. In the last group, Cy7-like, the Alexa Fluor 700 and Alexa Fluor 750 dyes can be compared to Cy7. The dyes and protein conjugates of the dyes were compared spectrally, and the functionality of dye–protein conjugates was examined in several applications. Flow cytometry and fluorescence microscopy were used to compare dye conjugates, which are composed of a dye covalently linked to a protein, such as goat anti-mouse IgG antibody (GAM), goat anti-rabbit IgG antibody (GAR), streptavidin (SA), concanavalin A (ConA), or transferrin (Tf), at similar degrees of labeling. The results indicate that Alexa Fluor dyes, whose absorption and emission spectra are spectrally similar to those of the Cy dyes, are more resistant to fluorescence quenching and absorption spectral artifacts on conjugation to proteins. At high degrees of labeling, the Alexa Fluor dyes undergo much less self-quenching than the other dyes tested. For protein labeling, the ability of Alexa Fluor dyes to retain their intense fluorescence even when the conjugates are heavily labeled suggests that the long-wavelength Alexa Fluor dyes have advantages compared to the Cy dyes and spectrally similar long-wavelength dyes.
In addition to the conventional conjugates, tandem conjugates were also analyzed. These tandem conjugates consist of three components: an absorber [a phycobiliprotein, either R-phycoerythrin (R-PE) or allo-phycocyanin (APC)], an emitter (one of the long-wavelength Alexa Fluor or Cy dyes), and a protein (e.g., streptavidin) for conferring bioaffinity. Phycobiliproteins, which are fluorescent light-harvesting proteins from cyanobacteria and some eukaryotic algae, act first as an energy absorber, then as a donor transferring energy to the dye. Tandem fluorescent molecules result in an increase in the effective Stokes shift of the reagent. The fluorescence emission peak of the reagent is effectively extended, by means of fluorescence resonance energy transfer (FRET), to a longer wavelength than that of the phycobiliprotein alone (Glazer and Stryer 1983). The tandem conjugates of an Alexa Fluor dye, a phycobiliprotein, and an anti-IgG antibody or streptavidin were compared to tandem conjugates containing Cy dyes. The tandem constructs involving Alexa Fluor dyes displayed higher FRET efficiencies and were functionally brighter in flow cytometry applications than comparable tandem constructs of the Cy dyes.
Materials and Methods
Reagents
SE derivatives of Alexa Fluor dyes with absorption maxima near 555 nm, 633 nm, 647 nm, 660 nm, 680 nm, 700 nm, and 750 nm from Molecular Probes were compared to SE derivatives of Cy3, Cy5, Cy5.5, and Cy7 from Amersham Biosciences, SE derivatives of DY-630, DY-635, and DY-680 from Dyomics (MoBiTec; Göttingen, Germany), and the SE derivative of Atto 565 from Fluka (Milwaukee, WI). Unlabeled GAM, GAR, and streptavidin (SA) starting materials were from Molecular Probes. Concanavalin A (ConA) was purchased from EY Laboratories (San Mateo, CA), and human holo-transferrin was from Sigma/Aldrich (St Louis, MO). Alexa Fluor dye conjugates of GAM, GAR, or SA from Molecular Probes were compared to Cy3 and Cy5 dye conjugates of GAM, GAR, or SA from several vendors, including Rockland Immunochemicals (Gilbertsville, PA), Amersham Biosciences, Kirkegaard & Perry Laboratories (Gaithersburg, MD), Chemicon International (Temecula, CA), Zymed Laboratories (South San Francisco, CA), Abcam (Cambridge, UK), Jackson ImmunoResearch Laboratories (West Grove, PA), and Caltag Laboratories (Burlin-game, CA). The degree of labeling (DOL = the number of moles of dye incorporated per mole of protein) provided by the manufacturers for each of the Cy3 and Cy5 conjugates was compared to the DOL determined independently for this study. The tandem conjugates analyzed were Alexa Fluor 647 R-PE SA, Alexa Fluor 680 APC SA, Alexa Fluor 700 APC SA, Alexa Fluor 750 APC SA (Molecular Probes), Cy5 R-PE SA (BD Biosciences; San Jose, CA), and Cy7 APC SA (Caltag Laboratories and BD Biosciences). All other laboratory reagents were the highest grade commercially available and were used as received.
Instrumentation
Absorption spectra were acquired with a U-2000 spectrophotometer (Hitachi Instruments; Boulder, CO). Fluorescence absorption and emission data were obtained with an Aminco-Bowman Series II Luminescence Spectrometer (Thermo Spectronic; Rochester, NY).
Flow cytometry experiments were performed using a Coulter Elite flow cytometer (Beckman Coulter; Miami Lakes, FL) equipped with a 488-nm argon ion laser and a 575-nm bandpass filter for detecting cells labeled with the Alexa Fluor 555 or Cy3 dye conjugates. To detect far-red fluorescence in cells labeled with the Alexa Fluor 647 or Cy5 dye conjugates, the Coulter Elite flow cytometer was equipped with a 633-nm He-Ne laser, a 675-nm bandpass emission filter, and a 640 nm dichroic longpass filter. EXPO32 software (Beckman Coulter, version 1.0) was used for sample acquisition and analysis. The fluorescence intensity of cells labeled with Alexa Fluor 647 R-PE SA or Cy5 R-PE SA tandem conjugates was measured with a FACSCalibur benchtop flow cytometer (BD Biosciences) equipped with a 635-nm red diode laser. Data were acquired and analyzed with CellQuest v. 3.3 software (BD Biosciences).
The fluorescence microscopes (Meridian Instrument Company; Kent, WA) used were a Nikon Eclipse E400 for photobleaching and immunofluorescence brightness determination and a Nikon Eclipse E800 for cell and tissue imaging. Optical filters (Omega Optical; Brattleboro, VT) used to visualize Alexa Fluor 555 and Cy3 dye conjugates were the Omega XF32 and XF102 filters, and the filter used to detect Alexa Fluor 647 and Cy5 dye conjugates was the Omega XF110. Images were acquired with a MicroMAX digital camera (Princeton Scientific Instruments; Monmouth Junction, NJ) with a ×1300 1030 charged-coupled device (CCD) array (Roper Scientific; Trenton, NJ), controlled by Meta-Morph software (Universal Imaging; Downingtown, PA).
Fluorescence Spectral Profiles
Extinction coefficients for all unconjugated dyes in methanol were provided by the manufacturers. The relative quantum yield (RQY, the integrated photon emission relative to that of an appropriate dye standard) of each conjugate was calculated using the following standard dyes: 5-(and-6)-carboxytetramethylrhodamine (Molecular Probes) for the Cy3, Atto 565, and Alexa Fluor 555 dyes; DDAO (7-hydroxy-9H(1,3-dichloro-9,9-dimethylacridine-2-one)) (Molecular Probes) for the Alexa Fluor 633, Alexa Fluor 647, Alexa Fluor 660, Alexa Fluor 680, Cy5, Cy5.5, DY-630, DY-635, and DY-680 dyes; oxazine 1 perchlorate (Eastman Kodak; Rochester, NY) for the Alexa Fluor 700 dye; and IR125 (Lamda Physik; Ft Lauderdale, FL) for the Alexa Fluor 750 and Cy7 dyes. For fluorescence analysis, the conjugates were matched at identical absorbance to that of the standard dye at the appropriate excitation wavelength. The total fluorescence (TF, the product of the RQY and the DOL) was used to measure fluorescence output (brightness) of the conjugate (Haugland 2000).
Photobleaching
Glass capillary tubes filled with 0.5 μM solutions of Alexa Fluor 555, Alexa Fluor 647, Cy3, or Cy5 SE dye derivatives in PBS, pH 7.5, were excited with light emitted by the 100-W mercury arc lamp of the Nikon Eclipse E400 fluorescence microscope. Using the ×40 objective, integrated fluorescence emission intensity under continuous illumination was measured initially and then every 5 sec for 95 sec, and the observed fluorescence intensities were normalized to the initial values.
Labeling Reactions
Protein conjugates containing the Alexa Fluor dyes were prepared, purified, and characterized as described previously (Panchuk-Voloshina et al. 1999; Haugland 2000; Hahn et al. 2001). Cy, Atto, and Dyomics dye conjugates were prepared according to manufacturers' instructions. The DOL of each conjugate was determined spectrophotometrically as previously described (Panchuk-Voloshina et al. 1999; Haugland 2000). To evaluate dye R-PE SA tandem conjugates by FRET, samples were matched for equal absorption by equalizing their optical density at the excitation wavelength of 488 nm.
Flow Cytometry
Flow cytometry was used to compare the fluorescence intensity of cells labeled with dye-protein conjugates prepared for this study as described above or labeled with commercially available conjugates. For comparison of dye-GAM conjugates, human peripheral blood was collected in a Vacutainer tube containing sodium heparin (BD Biosciences). An aliquot (100 μl) of the whole blood was added to a 3-ml plastic tube and blocked with 10% normal goat serum (NGS) in PBS on ice for 10 min. After addition of mouse anti-human CD3 antibody (1 μg) (Caltag Laboratories) to label T-cells, or PBS (5 μl) as a control, the tubes were incubated on ice for 30 min. Cells were washed, resuspended to 100 μl with PBS, and incubated with secondary reagent (dye-GAM conjugates; 0.5 μg) on ice for another 30 min. Erythrocytes in the sample were lysed by the addition of 2.5 ml ammonium chloride lysis buffer (0.15 M ammonium chloride, 0.01 M potassium bicarbonate, and 0.1 mM EDTA) (Stewart and Stewart 2001). The labeled cells were analyzed by flow cytometry with gating for lymphocytes.
The fluorescence intensity of cells labeled with Alexa Fluor 647 R-PE SA or Cy5 R-PE SA tandem conjugates was compared by flow cytometry as described previously (Telford et al. 2001a, b). Briefly, washed EL4 lymphoma cells (ATCC; Manassas, VA) were incubated first with a biotinylated anti-CD44 mouse monoclonal antibody, then labeled with either the Alexa Fluor 647 R-PE SA tandem conjugate or the Cy5 R-PE SA tandem conjugate and analyzed.
Flow cytometry was also used to compare a Cy7 APC SA tandem conjugate to APC SA conjugates of Alexa Fluor 680, Alexa Fluor 700, or Alexa Fluor 750 dye. For tandem conjugates, human peripheral blood was collected in a Vacutainer tube as above and centrifuged at 3300 × g for 30 min at room temperature (RT). Mononuclear cells were harvested from the white-colored layer directly below the plasma layer. The cells were washed once with PBS (pH 7.2), counted with a Z1 Coulter particle counter (Beckman-Coulter), and resuspended to a concentration of 1 × 10⁷ cells/ml. An aliquot (100 μl) of cell suspension was transferred to a reaction tube and blocked for 10 min at RT with nonspecific mouse IgG antibody (0.1 μg). Cells were washed, resuspended to 100 μl with PBS, and then incubated with 5 μl of either biotinylated mouse anti-human CD3 antibody (Caltag Laboratories) to label T-cells or with PBS as a control, at RT for 15 min. Cells were washed and secondary reagents containing streptavidin (tandem constructs) (0.1–1 μg per reaction) were added. Samples were protected from light, incubated at RT for 15 min, washed, and analyzed by flow cytometry with gating for lymphocytes.
Immunofluorescence Microscopy
Immunocytochemistry experiments with the bioconjugates were conducted on prepared slides with fixed HEp-2 human epithelial cells in wells (INOVA Diagnostics; San Diego, CA). The cells were incubated first with a human anti-nuclear antiserum (ANA) (INOVA Diagnostics) (30 μl/well) as the primary antibody for 30 min, then with biotinylated protein G (Molecular Probes) (0.2 μg/well) for 30 min, followed with a dye-labeled SA conjugate (0.2 μg/well) (Panchuk-Voloshina et al. 1999) for 30 min. Cells were extensively washed with PBS between incubations. Coverslips were applied with Prolong antifade mounting medium (Molecular Probes). Stained cell nuclei were visualized against a black or lightly stained cytoplasmic background. Five images were acquired for each bioconjugate. In each image, brightness values (mean ± SD) for the nucleus and cytoplasm of 10 representative cells were computed. The ratio of the fluorescence intensity of the nucleus to that of the cytoplasm was defined as the signal-to-noise ratio (S/N).
Immunofluorescent staining of the inhibitory protein of mitochondrial oxidative phosphorylation complex V [ATP-ase inhibitor protein (IF1)] and α-tubulin in bovine pulmonary artery endothelial (BPAE) cells (ATCC) was performed as described previously (Hirsch et al. 2002) using the appropriate primary antibodies (Molecular Probes). Briefly, BPAE cells were grown in Dulbecco's modified minimal essential Eagle's medium supplemented with 20% fetal bovine serum (FBS) (both from Invitrogen Life Technologies; Carlsbad, CA), plated onto 18-mm × 18-mm glass coverslips in 100-mm diameter Petri dishes, and cultured to 50–60% confluency. Cultures were fixed in 4% formaldehyde (Poly-sciences; Warrington, PA) in PBS at 37C for 20 min. Cells were permeabilized with 0.1% Triton X-100 (Sigma/Aldrich)/PBS for 10 min, then incubated in 10% NGS/0.1% Triton X-100/PBS blocking buffer (BB1) for 30 min. Cells were incubated with monoclonal mouse anti-α-tubulin (2 μg/ml) or mouse anti-complex V inhibitory protein (5 μg/ml) antibodies in BB1 for 30 min with gentle rocking, then incubated with a secondary antibody GAM conjugate containing Alexa Fluor 555 dye (DOL = 6.3), Cy3 dye (DOL = 5.3), Alexa Fluor 647 dye (DOL = 5.7), or Cy5 dye (DOL = 5.5) (5 μg/ml in BB1) for 30 min, and then finally incubated with DAPI (Molecular Probes; 0.2 μg/ml in PBS) for 2 min. Cells were extensively washed with PBS between incubations. Cover-slips were mounted on microscope slides as described above.
For immunohistochemical studies, a fluorescently labeled antibody against HuC/HuD, an RNA-binding protein specific to neuronal cells, was used to detect neuronal cell bodies in rat brain tissue sections. Perfused and frozen brain tissue from a postnatal day 24 rat (a generous donation from Woody Hopf; Ernst Gallo Clinic and Research Center, University of California, San Francisco) was transferred to Peel-Away molds (Polysciences), embedded in Sakura Finetek's Tissue-Tek OCT compound (VWR; West Chester, PA), and frozen in liquid nitrogen. Coronal sections (10 μm) were cut with a Leica CM3050S cryostat, collected on Superfrost Plus slides (VWR), air-dried, desiccated, and stored in slide boxes at −85C. For staining, slides were brought to RT and then rehydrated in PBS for 15 min. Tissue sections were permeabilized in 0.2% Triton X-100/0.2% bovine serum albumin (BSA) (Sigma/Aldrich)/PBS (PBT) for 15 min, then blocked with 5% NGS/PBT (BB2) for 30 min.
Sections were incubated with monoclonal mouse anti-HuC/HuD antibody (Molecular Probes; 5 μg/ml in BB2) overnight at 4C. Slides were washed four times for 15 min each in PBT and then incubated with dye-labeled GAM secondary antibodies (5 μg/ml in PBT) for 2 hr. After again washing four times for 15 min each in PBT, sections were counterstained with DAPI as described above, then washed in PBS and sealed with a coverslip as described above. For each pairwise dye comparison, optimized camera exposure times were obtained for the cell or tissue sample with the brighter labeling by identifying the exposure setting that produced a minimal level of pixel saturation in a 12-bit image. Once the sample with the brightest fluorescent signal intensity was identified, the identical camera setting was then used to acquire images from the other sample in the comparison. In addition, the preparations with the weaker signal intensities were imaged with a range of longer exposure times to identify exposure conditions that produced levels of pixel saturation comparable to those of the brightest samples. For the preparation of figures, the images were re-sized in Adobe Photoshop (San Jose, CA) with no adjustment to the level, brightness, and contrast values.
Results
Spectral Profiles
The absorption and fluorescence properties, as provided by the manufacturers of the dyes evaluated in this study, are shown in Table 1. Their absorption maxima ranged from 550 nm for the Cy3 dye to approximately 750 nm for the Alexa Fluor 750 dye. The Alexa Fluor 555 had the smallest Stokes shift (→10 nm), and the rest of the dyes had Stokes shifts ranging from 15 to 30 nm. These data indicate that, in the unconjugated Cy3-like group, the Cy3, Dy-550, Alexa Fluor 555, and Atto 565 dyes have similar absorption and fluorescence emission properties. The DY-550 and Atto 565 dyes had larger Stokes shifts but lower extinction coefficients than the Alexa Fluor 555 and Cy3 dyes. Likewise, in the Cy5-like group, the DY-630, Alexa Fluor 633, DY-635, Cy5, and Alexa Fluor 647 dyes had similar absorption and fluorescence emission properties. The DY-630 and DY-635 dyes had larger Stokes shifts but lower extinction coefficients than the Alexa Fluor 647 and Cy5 dyes. In the Cy5.5-like group of dyes consisting of Alexa Fluor 660, Alexa Fluor 680, and Cy5.5, the latter had the lowest Stokes shift and highest extinction coefficient, while DY-680 had the highest Stokes shift but the lowest extinction coefficient. In the Cy7-like group, the Alexa Fluor 700 and Alexa Fluor 750 dyes bracket the Cy7 dye in absorption and emission maxima and Stokes shift.
Photobleaching
After 95 sec of constant illumination, the fluorescence emission of the Cy3 dye retained about 75% of its initial fluorescence. In contrast, the Alexa Fluor 555 dye photobleached at a slower rate than the Cy3 dye and retained almost 90% of its fluorescence (Figure 1A). The photobleaching rates of the Alexa Fluor 647 and Cy5 dyes (Figure 1B) were more rapid than those of the Alexa Fluor 555 and Cy3 dyes. The Alexa Fluor 647 dye was considerably more photostable than the Cy5 dye over the duration of the photobleaching experiments and retained about 80% of the initial fluorescence, whereas the Cy5 dye retained only 55%.
Spectral properties of N-hydroxysuccinimidyl esters of long-wavelength fluorescent dyes
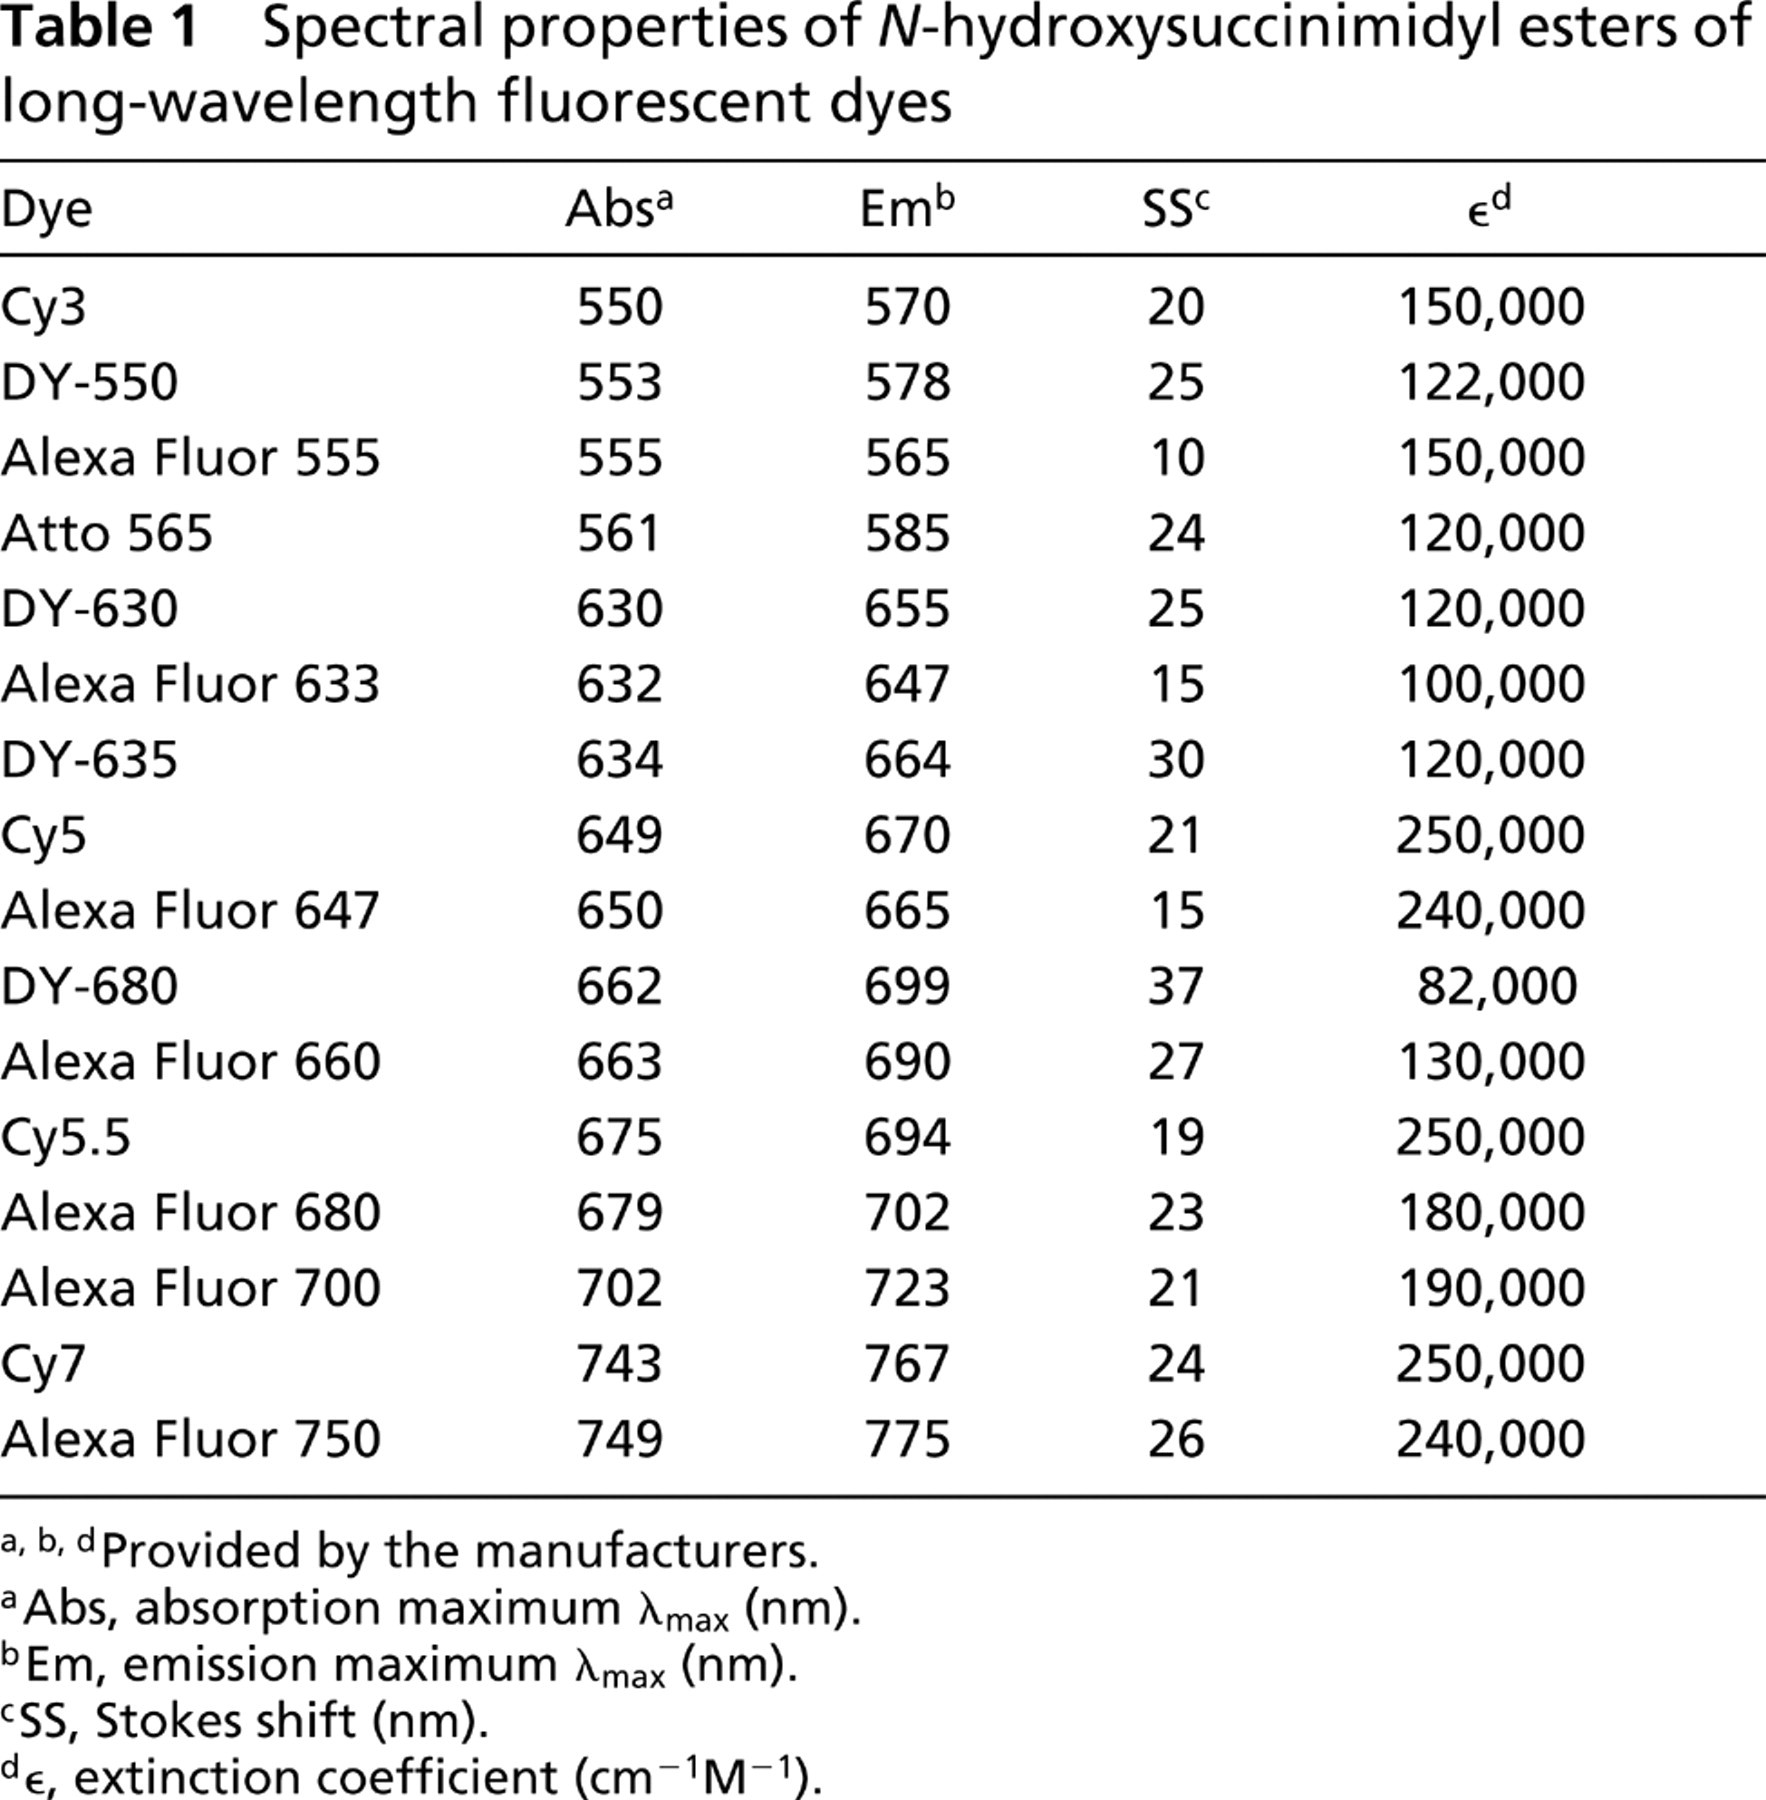
a,b,dProvided by the manufacturers.
aAbs, absorption maximum λmax (nm).
bEm, emission maximum λmax (nm).
cSS, Stokes shift (nm).
d∊, extinction coefficient (cm–1M–1).
Dye–Protein Conjugates
Over a wide range of DOL values, the Alexa Fluor 555 and Alexa Fluor 647 dyes conjugated to proteins were significantly brighter than the corresponding Cy3 and Cy5 dye conjugates in terms of both RQY and TF (Figure 2). The RQY of Alexa Fluor 555 GAR at all DOL values remained high and decreased only slightly with increasing DOL. For Cy3 GAR, the RQY at a DOL near 1 was similar to that of the Alexa Fluor 555 GAR conjugate but then decreased steadily with increasing DOL values. The TF of Alexa Fluor 555 GAR conjugates increased approximately fourfold over the DOL values of 1 to 9, whereas the TF for Cy3 GAR conjugates increased less than twofold over the same range (Figure 2A). When Alexa Fluor 647 and Cy5 dye conjugates were compared, the brightness differences were also striking and the Alexa Fluor 647 dye conjugates, unlike the Cy5 conjugates, showed only minor fluorescence quenching (Figures 2B–2F). When GAR conjugates of the Alexa Fluor 647 and Cy5 dyes were compared, the RQY of Alexa Fluor 647 GAR was higher than the RQY of Cy5 GAR conjugates at similar DOL values. The TF of Alexa Fluor 647 GAR remained high regardless of the DOL value. In contrast, the TF of all Cy5 GAR conjugates was less than the least fluorescent Alexa Fluor 647 GAR conjugate, and the TF of most Cy5 conjugates at higher DOL decreased dramatically from the initial fluorescence at a DOL of 2. In fact, two Cy5 GAR conjugates near a DOL of 6 were essentially nonfluorescent and one near a DOL of 10 was only slightly fluorescent. To determine whether the difference in fluorescence between the Alexa Fluor 647 and Cy5 dye conjugates at higher DOL values also occurs with other proteins, these dyes were conjugated to GAM (Figure 2C), SA (Figure 2D), ConA (Figure 2E), and Tf (Figure 2F). The RQYs for all the Cy5 conjugates were well below those of Alexa Fluor 647 dye conjugates at all DOL values, as were their TFs at higher DOL values, except for the case of SA. At DOL values >4, all Alexa Fluor 647 conjugates were quite fluorescent, whereas the Cy5 conjugates of ConA, Tf, and some GAR were only slightly fluorescent.
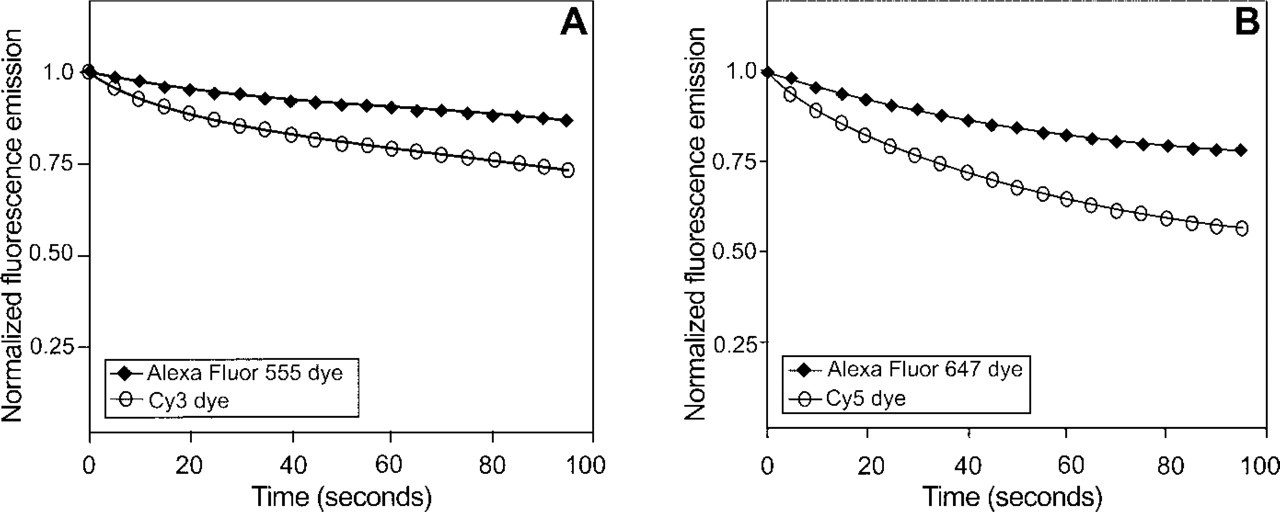
Relative photobleaching profiles of the Alexa Fluor 555 and Cy3 dyes and of the Alexa Fluor 647 and Cy5 dyes. Equimolar concentrations of the dyes were placed in capillary tubes, continuously illuminated, and fluorescence was measured every 5 sec. Fluorescence values were normalized to the initial intensity. (
Absorption spectra of the dyes and their GAR conjugates were then evaluated to determine possible reasons for this difference in fluorescence (Figure 3). In the absorption spectra of the unconjugated dyes, Alexa Fluor 555 and Cy3 dyes have a shoulder at ∼520 nm (Figure 3A). This shoulder can also be found in the absorption spectra of the GAR conjugates of Cy3 dye or of the Alexa Fluor 555 dye, but the peak is higher in the case of the Cy3 GAR conjugate and increases with increasing DOL (Figure 3B). A blue-shifted peak also occurs in the absorption spectra of Alexa Fluor 647 or Cy5 conjugates (Figure 3D). For the Alexa Fluor 647 GAR conjugates, this peak at ∼600 nm is quite similar to the shoulder found in the unconjugated dye absorption spectrum (Figure 3C), but for the Cy5 GAR conjugates this shoulder peak is much more prominent than in the absorption spectrum of the unconjugated Cy5 dye. This secondary absorbance peak at ∼600 nm occurs when the Cy5 dye is conjugated to GAR and other proteins at relatively high DOL (Gruber et al. 2000; Anderson and Nerurkar 2002). Direct comparison of absorption and excitation spectra of this Cy5 GAR conjugate revealed that the ∼600 nm absorbing species is nonfluorescent (data not shown).
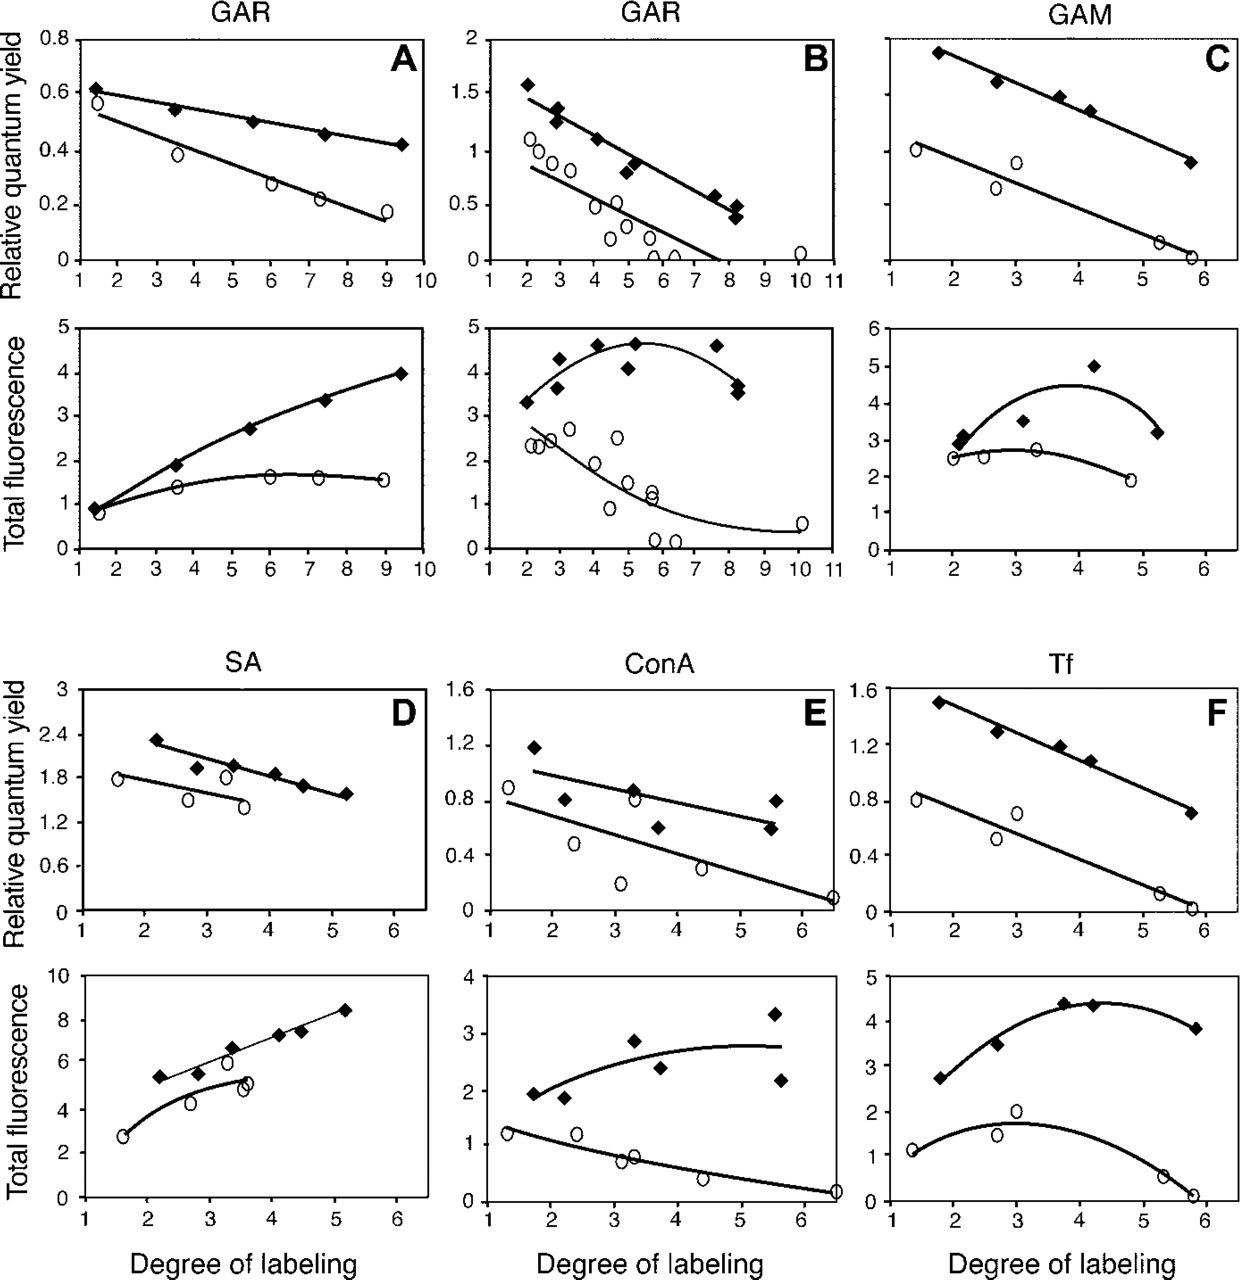
Comparison of relative quantum yield and total fluorescence of Alexa Fluor 555 GAR and Cy3 GAR and of Alexa Fluor 647 and Cy5 dyes conjugated to various proteins at different degrees of labeling (DOL, the mol fluorophore:mol protein ratio). (
Flow Cytometry
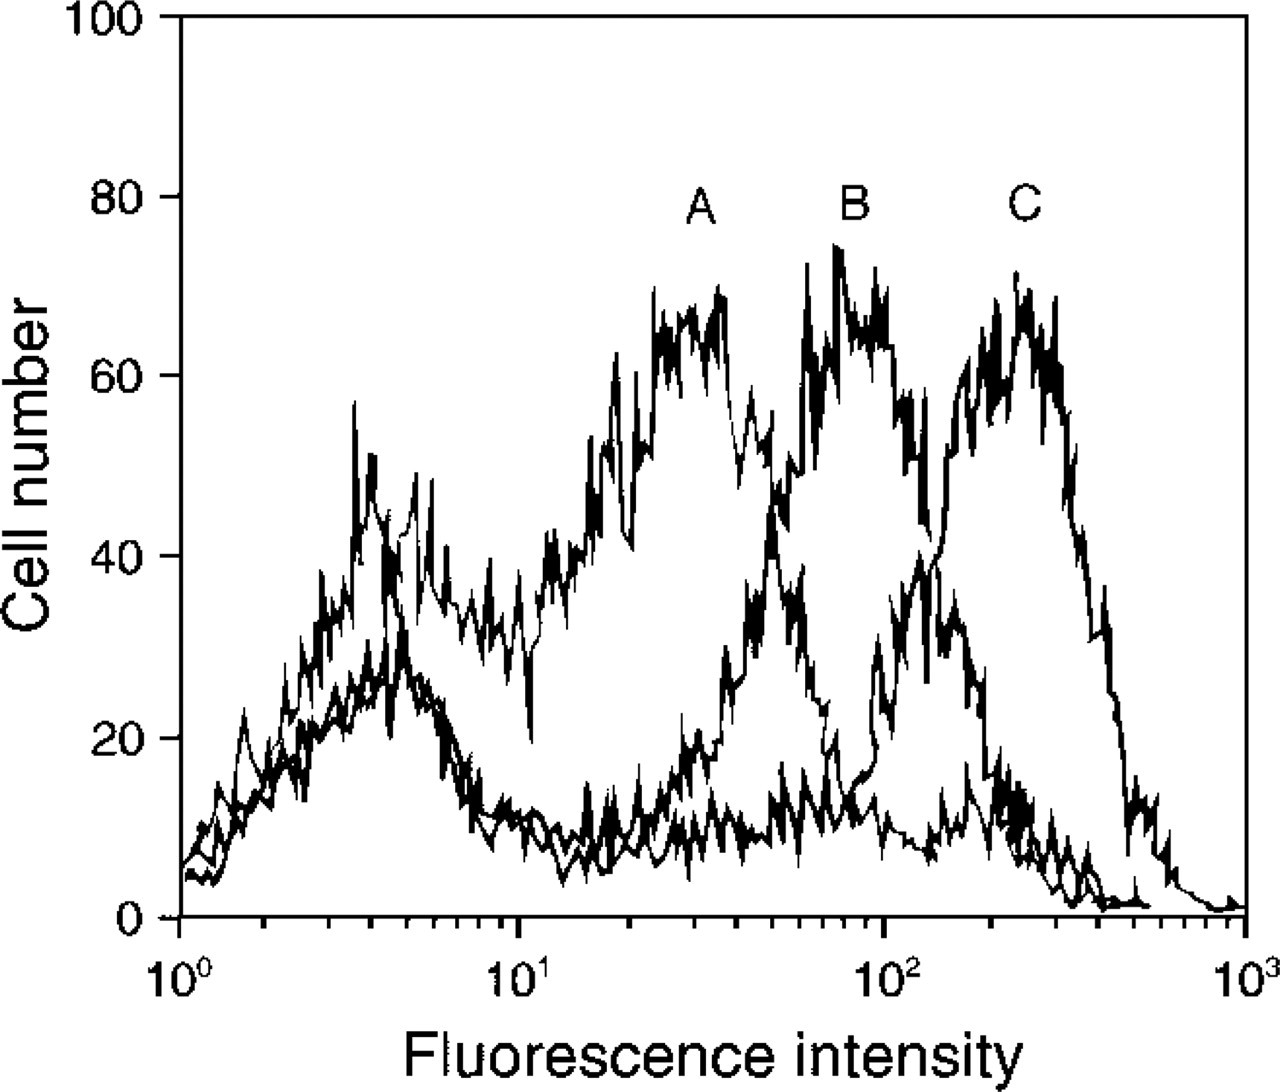
To determine if the fluorescence intensity was influenced by the way in which the conjugate was prepared, cells labeled using commercial conjugates were compared to cells labeled with dye-protein conjugates prepared as described in Materials and Methods (Figure 4). This also enabled a comparison of dyes conjugated to a protein from a single source (a control for the possibility that the differences in conjugates might be due to differences in the biological activity of the protein). Regardless of whether commercially available conjugates or conjugates prepared for this study were used, the cells labeled with the Cy5 GAM conjugates (A, DOL = 2; B, DOL = 11) had less fluorescence than the cells labeled with the prepared Alexa Fluor 647 GAM (C, DOL = 3). For the same number of lymphocytes, the prepared Cy5 GAM showed the least fluorescence, the purchased Cy5 GAM conjugate had an intermediate level of brightness, and the prepared Alexa Fluor 647 GAM was the brightest (approximately 10-fold brighter than the dimmer Cy5 GAM conjugate).
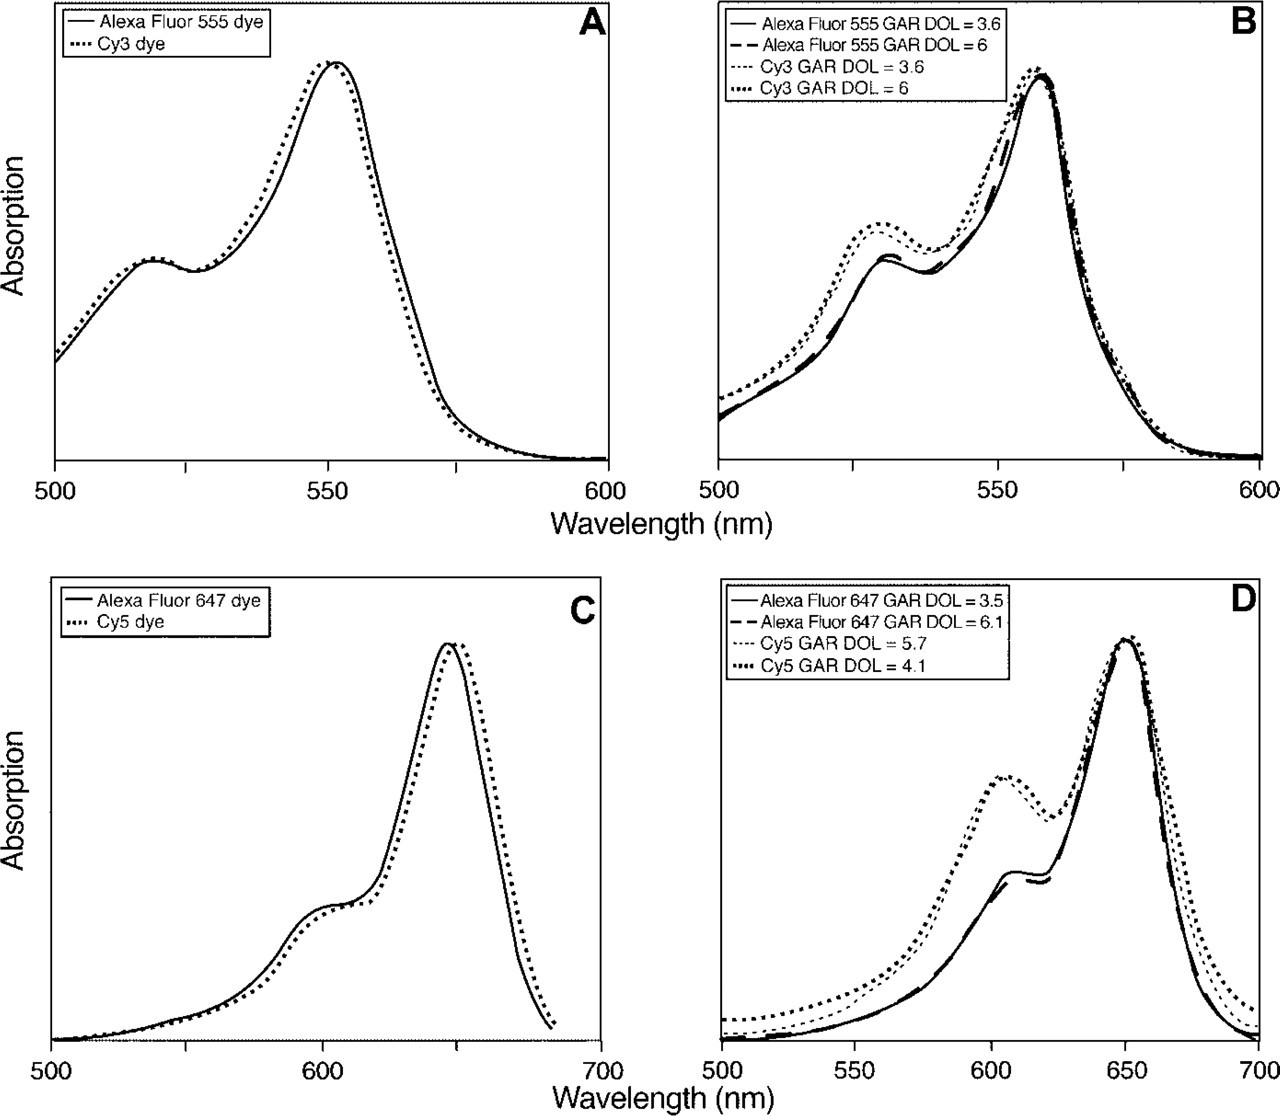
Comparison of normalized absorption spectra of unconjugated and conjugated Alexa Fluor and Cy dyes. (
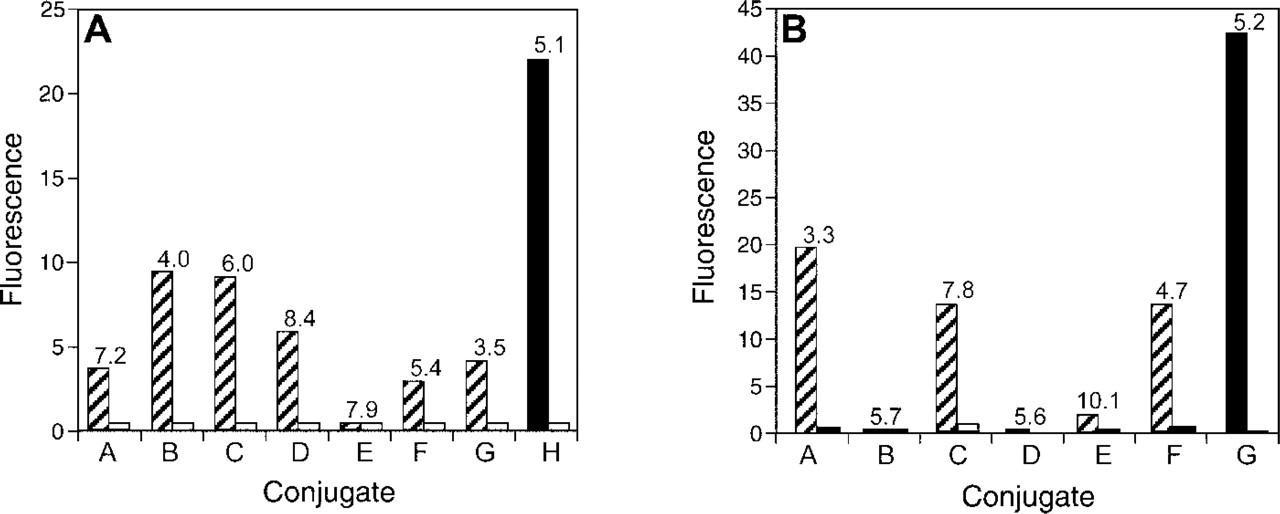
To determine the variability, in terms of fluorescence, of the commercially available conjugates, panels of Cy3 and Cy5 conjugates were compared to prepared Alexa Fluor 555 and Alexa Fluor 647 dye conjugates, respectively (Figures 5A and 5B). The comparison of cells labeled with several commercially available Cy3 GAM conjugates and the Alexa Fluor 555 GAM conjugate showed that the conjugates varied widely in fluorescence and DOL, even though all had similar amounts of background fluorescence. The Cy3 GAM conjugates ranged from 1 to 10 in arbitrary units of fluorescence intensity, whereas the Alexa Fluor 555 GAM conjugate (sample H) was at 22, twice as bright as the most fluorescent Cy3 GAM conjugate (sample B). The other Cy3 GAM conjugates were also significantly less bright than the Alexa Fluor 555 conjugate. The respective DOL values for the Alexa Fluor 555 and Cy3 GAM conjugates we used are provided in Figure 5A.
Similarly, the comparison of commercially available Cy5 GAM conjugates (intensity range of 0 to 20) to the Alexa Fluor 647 GAM conjugate (sample G, intensity of 42) demonstrated that the Alexa Fluor 647 GAM conjugate was more than twice as bright as the brightest commercial Cy5 GAM conjugate (sample A). Three of the purchased conjugates had intermediate values of 15 to 20, and three had negligible fluorescence (Figure 5B). The respective DOL values for the Alexa Fluor 647 and Cy5 GAM conjugates we used are provided in Figure 5B. In addition to the Alexa Fluor 647 GAM conjugate (DOL = 3.2) compared to the Cy5 GAM conjugates above, independently prepared Alexa Fluor 647 GAM conjugates at DOL 2–7 were evaluated and were all 1.4–5.9-fold brighter than the commercial Cy5 GAM conjugates (data not shown).
Flow cytometric analysis of the fluorescence intensity of T-cells incubated with an anti-CD3 mouse MAb and labeled with either an Alexa Fluor 647- or Cy5 dye-labeled GAM secondary antibody. Samples are (
Fluorescence Microscopy
Dyes belonging to the Cy3-like, Cy5-like, and Cy5.5-like groups were conjugated to SA and evaluated as described in Materials and Methods for nuclear staining of HEp-2 cells (Table 2). Nine Cy3-like, ten Cy5-like, and two Cy5.5-like SA conjugates were compared. In the Cy3-like group, nuclei stained with Alexa Fluor 555 SA (DOL = 2.5) were the brightest (fluorescence intensity of the nucleus = 3.7 × 10³) and had a high S/N ratio (8.8 in a range of 3.4–12.1). Nuclei stained with Cy3 SA ranged in fluorescence from 1.4–3.2 × 10³ with high S/N ratios. The fluorescence intensity of nuclei stained with Atto 565 SA was the second highest in the Cy3-like group, whereas staining with DY-550 SA produced the lowest intensity. In the Cy5-like group, nuclei stained with SA conjugates of Alexa Fluor 633 SA and Alexa Fluor 647 SA had much greater fluorescence (2.6–3.5 × 10³) and S/N ratios (6.5–18.3) than the nuclei stained with the SA conjugates of Cy5, DY-630, and DY-635 (fluorescence = 0.3–1.8 × 10³ and S/N ratios = 1.5–4.6). In the Cy5.5-like group, nuclei stained with Alexa Fluor 680 SA (fluorescence = 1.1 × 10³) were twice as bright as nuclei stained with DY-680 SA (fluorescence = 0.5 × 10³), but both were less fluorescent than the most intensely fluorescent nuclei of the other two groups.
Comparison of the fluorescence of nuclei in HEp-2 human epithelial cells incubated with anti-nuclear antibody, then with a biotinylated protein G, and finally with various dye-labeled SA conjugates
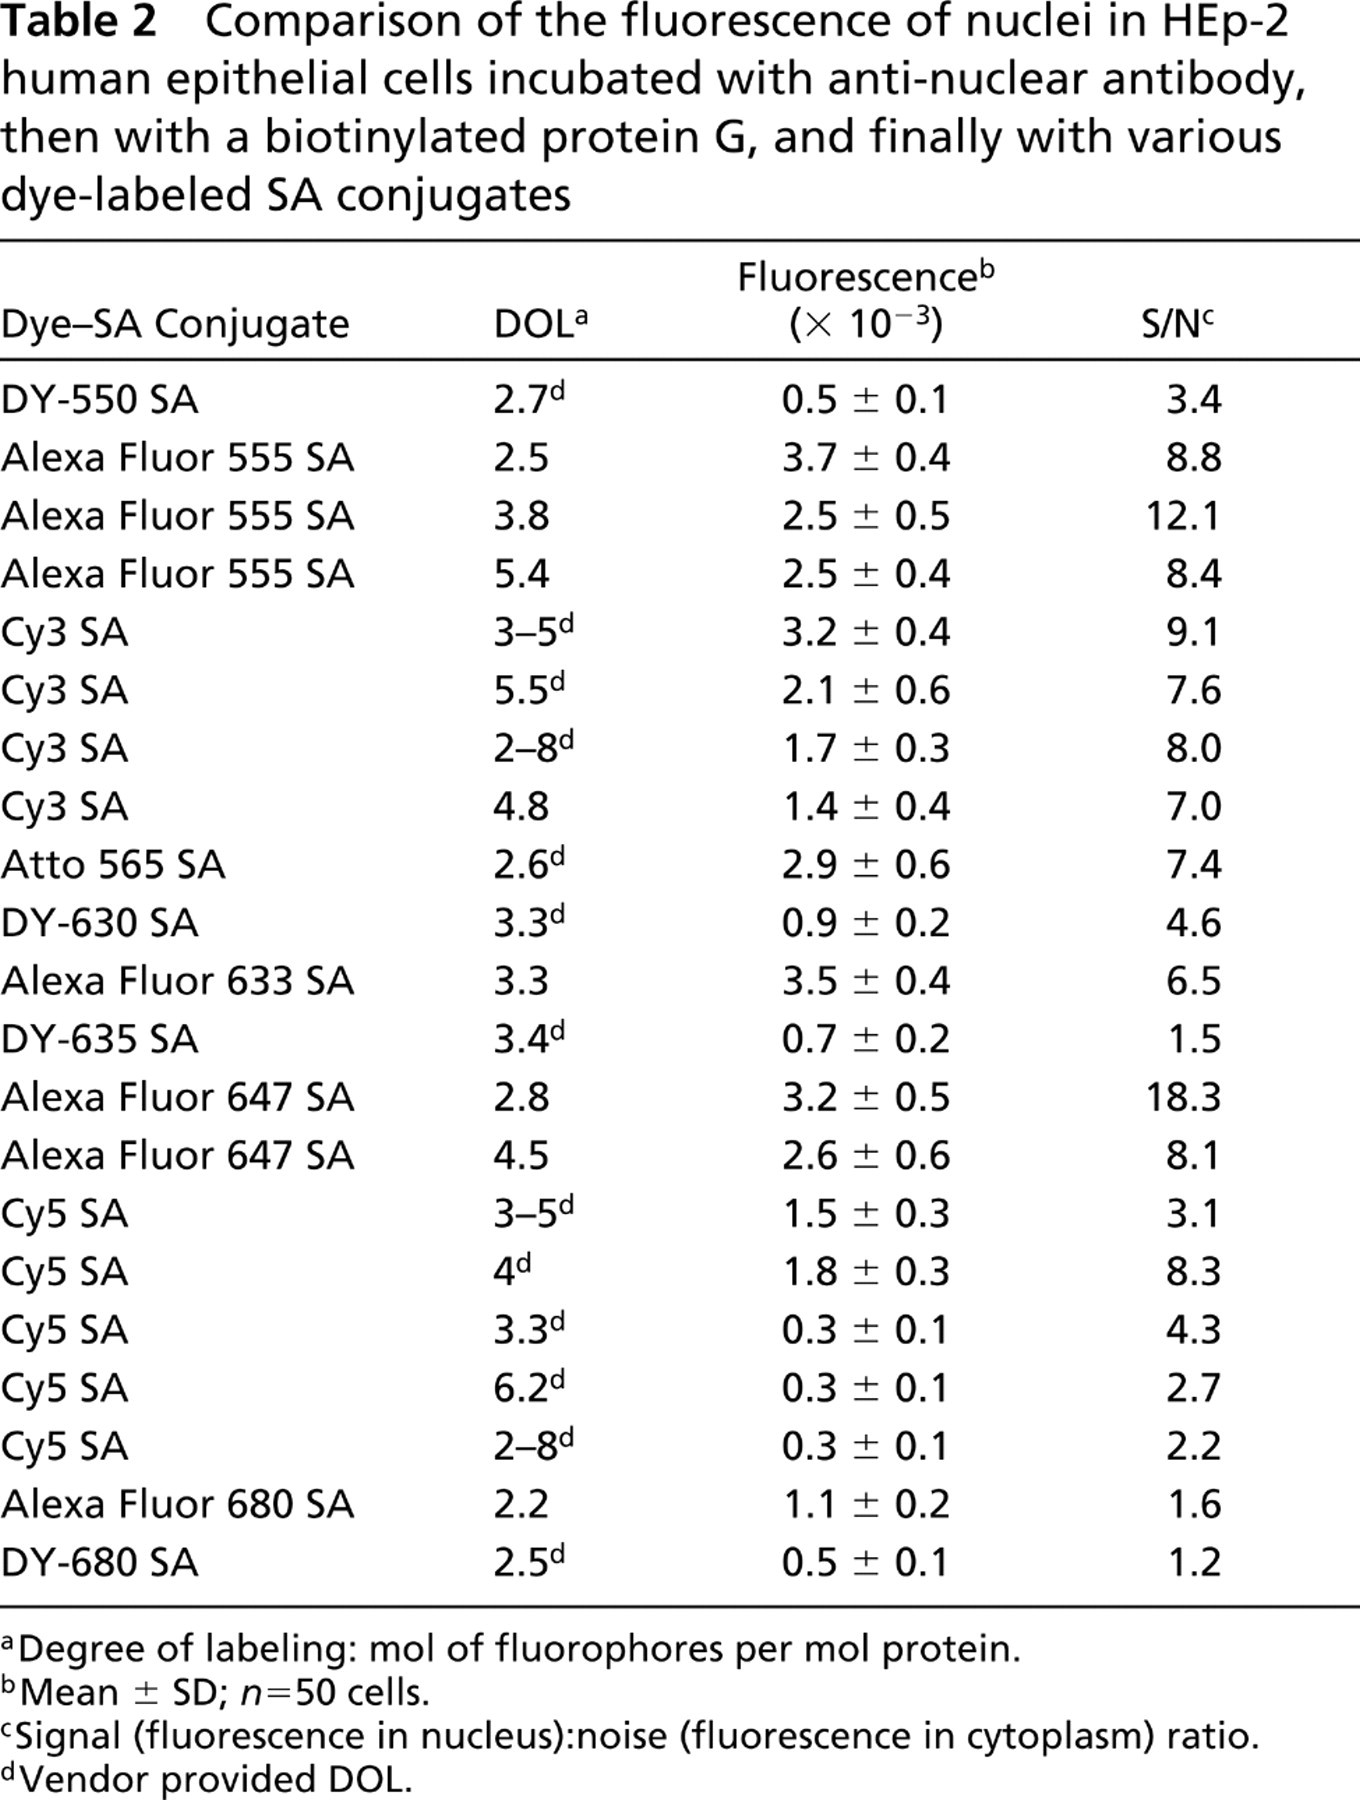
aDegree of labeling: mol of fluorophores per mol protein.
bMean ± SD; n=50 cells.
cSignal (fluorescence in nucleus):noise (fluorescence in cytoplasm) ratio.
dVendor provided DOL.
Re ative f uorescence emission (brightness) comparison by flow cytometry of T-cells incubated with an anti-CD3 mouse MAb and labeled with a dye–GAM secondary reagent. (
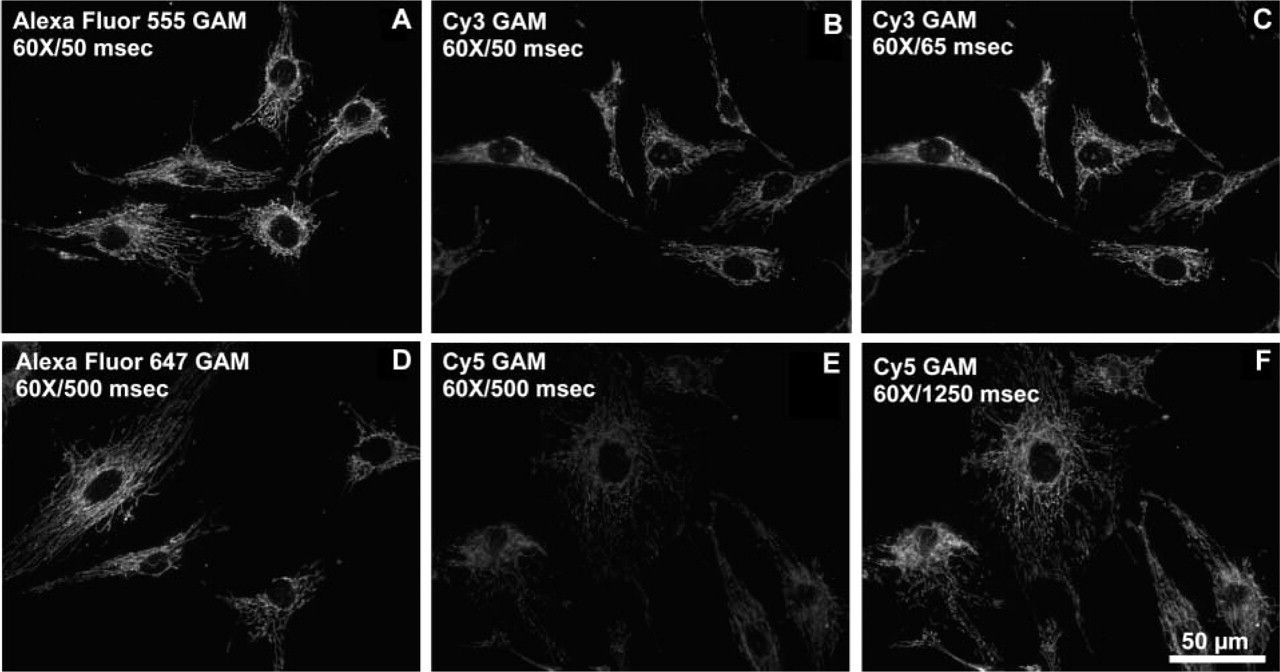
Fluorescence brightness of fluorophore-conjugated secondary reagents was also used to detect other protein targets in cells and tissues. The immunofluorescence detection of an inhibitory protein of oxidative phosphorylation complex V, localized in mitochondria, demonstrated that labeling with Alexa Fluor 555 or Alexa Fluor 647 GAM conjugates was brighter than with the corresponding Cy3 or Cy5 conjugates at similar DOL values and equal concentrations (Figure 6). To obtain comparable pixel saturation to that obtained with the Alexa Fluor 555 GAM conjugate using the Cy3 GAM conjugate, the exposure time needed to be increased by a factor of 1.3 (Figure 6C). To obtain comparable pixel saturation to that obtained with the Alexa Fluor 647 GAM conjugate with the Cy5 GAM conjugate, an increase in exposure time of about 2.5-fold was required (Figure 6F). When α-tubulin was labeled with a monoclonal anti-α-tubulin primary antibody followed by staining with the Alexa Fluor 555 GAM (Figure 7A) or Cy3 GAM (Figure 7B) conjugates, staining with the Alexa Fluor 555 GAM resulted in a significantly brighter image than with the Cy3 GAM, although the brightness difference between the two with this target was not as pronounced as with the inhibitory protein of complex V. Similar results were obtained with the Alexa Fluor 647 GAM (Figure 7D) and Cy5 GAM (Figure 7E) conjugates. The same conjugates shown in Figures 6 and 7 were used to localize the HuC/HuD protein in rat brain tissue sections, and the results were similar to that of cells. At identical concentrations and exposure times, both the Alexa Fluor 555 GAM and Alexa Fluor 647 GAM conjugates resulted in brighter images than with the corresponding Cy3 GAM and Cy5 GAM conjugates (Figure 8). Similar to what was observed in the immunocytochemical studies, optimal exposure time for samples labeled with the Cy3 conjugate was approximately 1.3-fold greater than that required with the Alexa Fluor 555 conjugates (Figure 8C), and samples labeled with Cy5 conjugates required approximately 2.5-fold greater exposure time than with Alexa Fluor 647 conjugates to produce a comparable level of pixel saturation (Figure 8F).
Immunofluorescence localization of an inhibitory protein of mitochondrial oxidative phosphorylation complex V (IF1) in BPAE cells. The cells were incubated with mouse anti-IF1 antibodies and labeled with dye–GAM secondary reagents. (
FRET
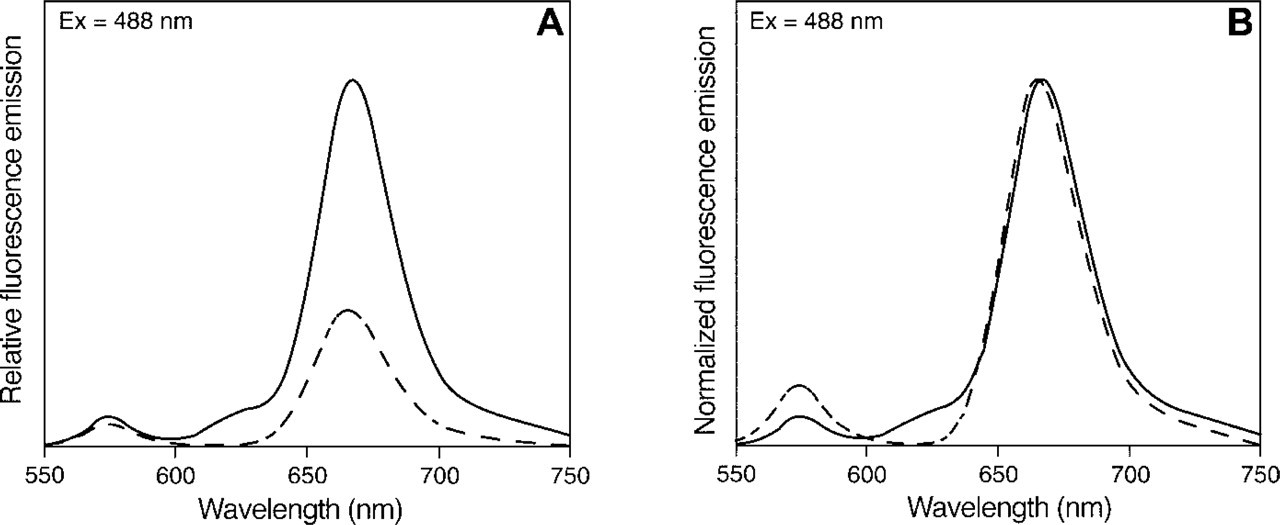
For the tandem conjugates consisting of the Cy5 or Alexa Fluor 647 dyes, R-PE, and SA, FRET analysis showed that the Alexa Fluor 647 R-PE SA tandem conjugate was about threefold more efficient in fluorescence emission than Cy5 R-PE SA tandem conjugate (peak at ∼670; Figure 9A). To show the difference in undesired emission at the lower wavelength (∼575 nm), the emission values of the same data were normalized to the peak intensity value of the larger peak (Figure 9B). The greater height of the Cy5 R-PE SA tandem conjugate peak at ∼575 nm shows that FRET efficiency of the Cy5 R-PE SA tandem conjugate construct is less than that of the Alexa Fluor 647 R-PE SA tandem construct.
The intensity of EL4 cells labeled with Alexa Fluor 647 R-PE SA or Cy5 R-PE SA tandem conjugates is shown in Figure 10. The brightness of the cell populations stained with the Alexa Fluor 647 R-PE SA tandem conjugate (Figure 10A) was about eightfold greater than that obtained with the Cy5 R-PE SA tandem conjugate (Figure 10B). For unstained cells, the mean channel fluorescence intensities were virtually identical in both experiments (left peaks in Figures 10A and 10B).
Because the Cy7 dye is commercially available only as an acceptor dye in tandem conjugates containing either R-PE or APC and SA (Roederer et al. 1996), a tandem conjugate of Cy7 dye with APC and SA was compared by flow cytometry to tandem constructs of the Alexa Fluor 680, Alexa Fluor 700, or Alexa Fluor 750 dyes, APC, and SA (Figures 11A–11C). Figure 11A compares Alexa Fluor 680 APC SA and Cy7 APC SA tandem conjugates. At all amounts tested, the Alexa Fluor 680 tandem conjugates resulted in significantly brighter staining than did the commercial Cy7 tandem conjugate and, at equal amounts of conjugate per assay (1 μg), the fluorescence with the Alexa Fluor 680 APC SA tandem conjugate was almost sixfold brighter than with the Cy7-containing counterpart. Similar results were obtained with the Alexa Fluor 700 APC SA (Figure 11B) and Alexa Fluor 750 APC SA (Figure 11C) tandem conjugates. At 0.25 μg per assay, the Alexa Fluor 700 APC SA tandem conjugate resulted in about threefold brighter staining than did the Cy7 APC SA tandem at 2.0 μg per assay (Figure 11B). In the comparison of Alexa Fluor 750 and Cy7 tandem conjugates, the fluorescence labeling with the Alexa Fluor 750 APC SA tandem conjugate was 1.4-fold higher than with the Cy7 tandem counterparts at 0.1 μg per assay, the lowest level of Alexa Fluor 750 APC SA tandem conjugate tested. Higher concentrations of Alexa Fluor 750 APC SA tandem conjugate resulted in further increases (up to approximately 1.8-fold brighter) at 1.0 μg per assay. In the three experiments, no compensation for background fluorescence was necessary because all samples had low background signals.
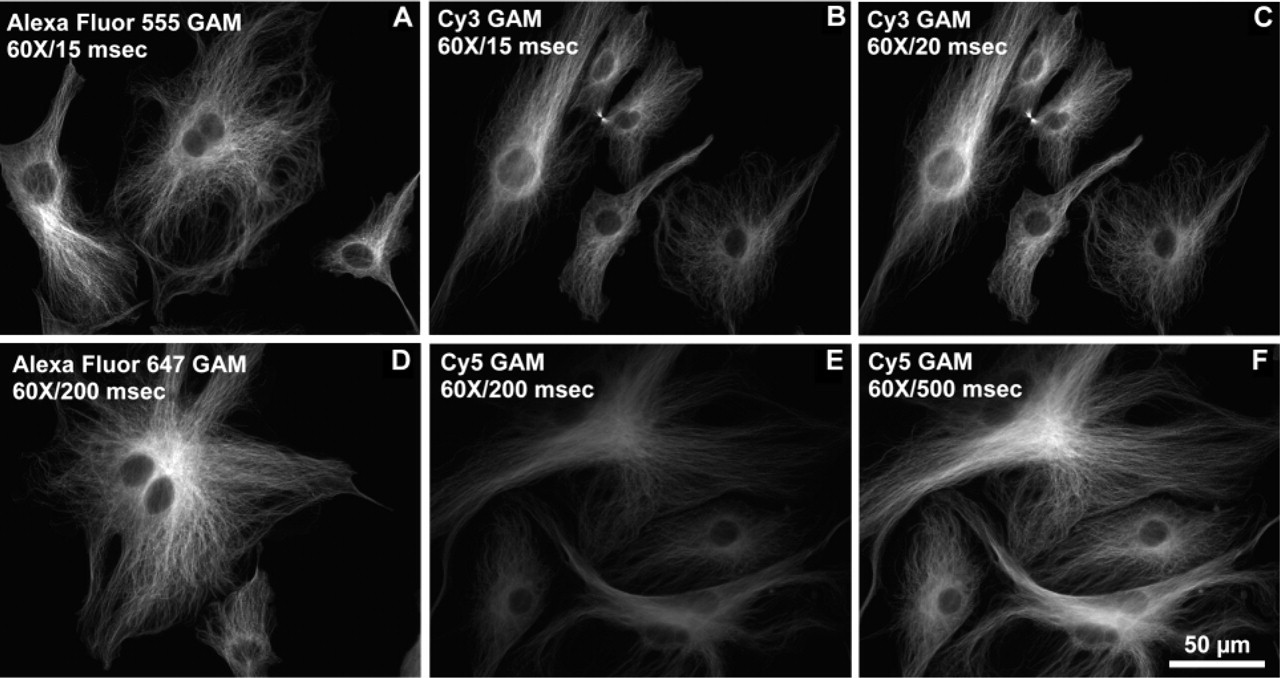
Immunofluorescence localization of α-tubulin in BPAE cells incubated with mouse anti-α-tubulin and labeled with dye-GAM conjugates. (
Discussion
The new long-wavelength Alexa Fluor dyes described here are similar to the Cy dyes in terms of their absorption and fluorescence emission properties (Table 1). However, as shown here, the fluorescence properties of the dyes can be dramatically affected by conjugation to proteins, especially at high degrees of labeling. The goal in labeling, whether researchers prepare their own conjugates (Gruber et al. 2000; Hahn et al. 2001; Pragl et al. 2002) or use commercially available versions, is to obtain an optimal DOL and to minimize fluorescence quenching. Conjugation at high molar ratios of the fluorophore to the protein, resulting in high DOLs, can lead to fluorescence quenching, presumably due to dye–dye interactions, such as the stacking of proximal dyes or H-aggregate formation (Randolph and Waggoner 1997). To determine the fluorescence and self-quenching properties of dye–protein conjugates, long-wavelength SE dyes and dye–protein conjugates prepared from these dyes were compared in a variety of quantitative fluorescence-based applications. The Alexa Fluor 555 and Cy3 dyes are spectrally very similar, as are the Alexa Fluor 647 and Cy5 dyes, so these two pairs were selected for more detailed studies.
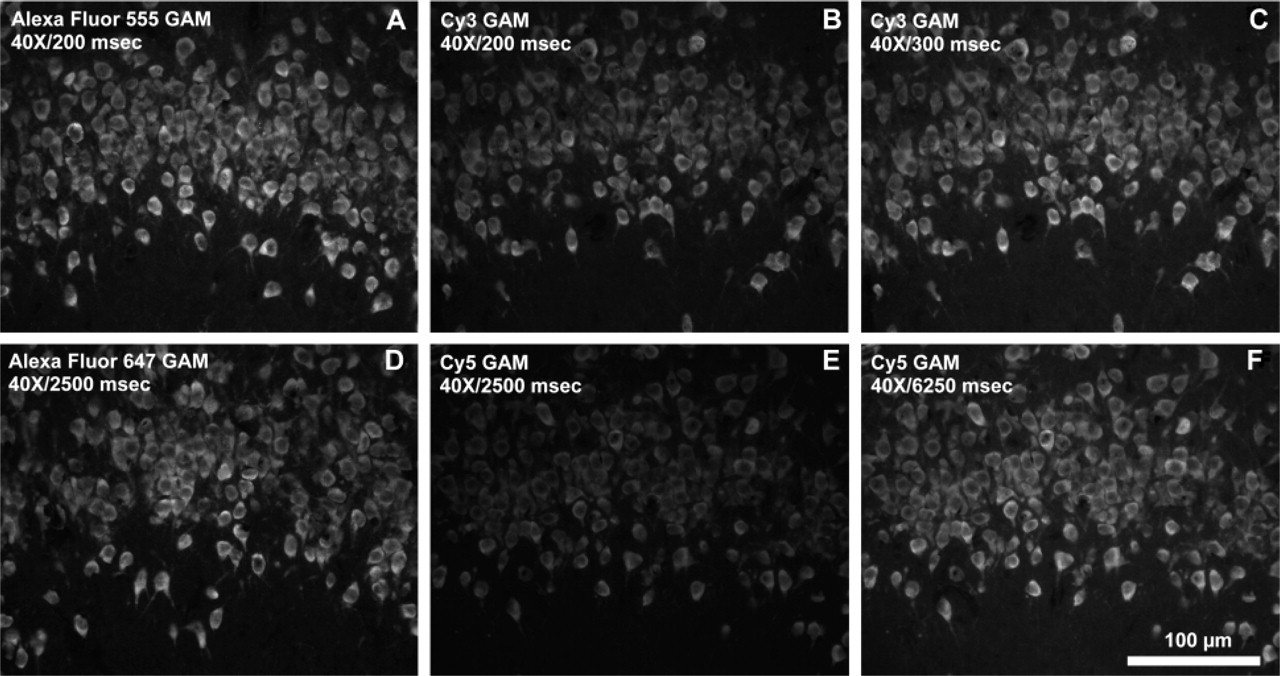
Immunofluorescence localization of the neuronal HuC/D protein in rat brain tissue incubated with anti-HuC/D antibodies and labeled with dye–GAM conjugates. (
Although the Alexa Fluor 555 and Alexa Fluor 647 dyes have fluorescence emission properties similar to those of Cy3 and Cy5 dyes, respectively, quantitative analyses of photobleaching demonstrated that the Alexa Fluor 555 and Alexa Fluor 647 dyes were more photostable than their Cy3 and Cy5 counterparts (Figure 1). The decreased photobleaching seen with the Alexa Fluor dyes suggests that Alexa Fluor dye–protein conjugates may be more photostable than the Cy3 and Cy5 dye conjugates, which would allow more time for repeated viewing of labeled samples and image capture.
To assess the fluorescence properties of dyes conjugated to proteins, dyes were conjugated to several proteins at various DOLs (Figure 2). In the Cy3-like comparison at DOL values higher than 2, the Alexa Fluor 555 dye conjugates were significantly brighter than the Cy3 dye conjugates and, at higher DOL values, the difference in fluorescence between the Alexa Fluor 555 GAR and the Cy3 GAR sharply increased (Figure 2A). This trend continued and was even more pronounced in comparisons of Alexa Fluor 647 GAR and Cy5 GAR (Figure 2B). In particular, the fluorescence of the Alexa Fluor 647 GAR remained high at all DOLs, whereas the Cy5 GAR conjugates at higher DOLs had significantly less fluorescence and some conjugates were virtually nonfluorescent. This difference in fluorescence intensities between the Alexa Fluor 647 and Cy5 dye conjugates was also observed with other proteins (GAM, SA, ConA, and Tf) (Figures 2C–2F), particularly at higher DOLs. Quenching appeared to be an important factor in this difference in brightness. Conjugates containing Alexa Fluor 555 or Alexa Fluor 647 dyes were brighter, at least in part, because they exhibited much less of the self-quenching characteristic of Cy dye conjugates (Gruber et al. 2000; Hahn et al. 2001; Anderson and Nerurkar 2002) (Figure 3).
When commercially produced, dye conjugates are sold at a predetermined and presumably optimal DOL. However, by constructing their own conjugates, researchers have the flexibility to optimize DOLs for their particular needs. To compare commercially prepared conjugates with conjugates prepared for this study, the effectiveness of labeling GAM with the Alexa Fluor 647 or Cy5 dyes was determined by assaying the fluorescence of cells labeled with these conjugates. The Alexa Fluor 647 GAM resulted in greater labeling intensity than did the Cy5 GAM, regardless of the method of preparation (Figure 4). Even when compared to panels of commercially available conjugates with DOL values higher or lower than the Alexa Fluor samples (Figure 5), the fluorescence of cells labeled with the Alexa Fluor 555 or Alexa Fluor 647 dye conjugates was greater than that with the Cy3 or Cy5 dye conjugates, respectively.
Comparison of f uorescence emission spectra of Alexa Fluor 647 R-PE SA and Cy5 R-PE SA tandem conjugates. (
These results are consistent with other studies using Cy dye conjugates. DNA probes labeled with multiple Cy3 dyes were found to be less stable in probe: DNA duplexes than unlabeled probes, due in part to dye–dye interactions (Randolph and Waggoner 1997). Gruber et al. (2000) found that the fluorescence of Cy3, Cy5, and other Cy dyes conjugated to antibodies and other proteins was significantly quenched relative to the unconjugated dye, particularly at high DOL, an observation confirmed in this study (Figure 2). Some heavily labeled Cy5 conjugates were reported to be essentially nonfluorescent (Gruber et al. 2000; Hahn et al. 2001; Anderson and Nerurkar 2002), an observation also confirmed in this study (Figures 2B, 2E, 2F, and 5).
In addition to flow cytometry, fluorescence microscopy was used to compare SA conjugates of a variety of long-wavelength dyes. Staining of HEp-2 nuclei showed significant differences in fluorescence intensity and S/N ratios between the Alexa Fluor dye SA conjugates and the SA conjugates of other dyes (Table 2). In each of the groups, Cy3-like, Cy5-like, or Cy5.5-like, the nuclei stained with the Alexa Fluor dye SA conjugate had the highest fluorescence intensity in the group. Regardless of DOL, nuclei stained with Alexa Fluor dye SA conjugates consistently had fluorescence intensities that were higher than those of most conjugates in the group. Nuclei stained with the Alexa Fluor 555 SA conjugates or the Alexa Fluor 647 SA conjugates had high S/N ratios, and Alexa Fluor 647 SA had the highest S/N value of all conjugates tested. These quantitative comparisons were reinforced by immunodetection with fluorescently labeled GAM secondary reagents (Figures 6–8). Target nuclear, mitochondrial, or cytoskeletal proteins detected with the appropriate primary antibody and labeled with an Alexa Fluor 555 or Alexa Fluor 647 dye conjugate as a secondary reagent gave a stronger fluorescent signal than proteins labeled with the corresponding Cy3 or Cy5 dye conjugate. Quantitatively, cell and tissue targets labeled with the Cy3 or Cy5 dye conjugate counterparts required as much as 1.3- to 2.5-fold longer exposure times to produce the same pixel saturation as targets labeled with the Alexa Fluor 555 or Alexa Fluor 647 dye conjugates.
In tandem conjugates, a phycobiliprotein, such as R-PE, can be covalently coupled to a longer-wave-length acceptor dye, such as the Alexa Fluor 647 dye. Excitation of the R-PE donor at a single wavelength, such as with the argon ion laser at 488 nm, results in energy transfer (FRET) to the Alexa Fluor 647 acceptor dye and in an effective Stokes shift of over 100 nm. Such constructs enable simultaneous detection of multiple targets (Glazer and Stryer 1983). When the dye partner in a tandem conjugate is a long-wavelength dye, the trend of greater fluorescence in Alexa Fluor dyes is particularly important. Not only is there little change in the absorbance and fluorescence spectra of Alexa Fluor dyes when conjugated to proteins but there is also greater TF than there is with the Cy dyes at the same DOL. In contrast, the self-quenching characteristic of the Cy5 and Cy7 dyes results in decreased FRET efficiencies in tandem constructs containing these dyes. The functional difference between tandem constructs made with Alexa Fluor dyes and those made with Cy dyes is readily apparent in the comparison of cells labeled with the Alexa Fluor 647 R-PE SA tandem conjugate to cells labeled with the Cy5 R-PE SA tandem conjugate [eightfold more fluorescence in a flow cytometry application (Figure 10) and threefold more fluorescence in FRET analysis (Figure 9)]. The Alexa Fluor 680 APC SA tandem conjugate (∼fivefold brighter labeling than with Cy7 APC SA tandem conjugate) (Figure 11A), the Alexa Fluor 700 APC SA tandem conjugate (∼fivefold brighter) (Figure 11B), and the Alexa Fluor 750 APC SA tandem conjugate (∼1.4-fold brighter) (Figure 11C) also overcome the limitation, caused by the quenching, of the Cy7 fluorophore. Thus, either as conventional dye-protein conjugates or as dye-phycobiliprotein-protein tandem conjugates, the long-wavelength Alexa Fluor dyes were brighter than the corresponding Cy dyes and other long-wavelength dyes in each of the applications we evaluated.
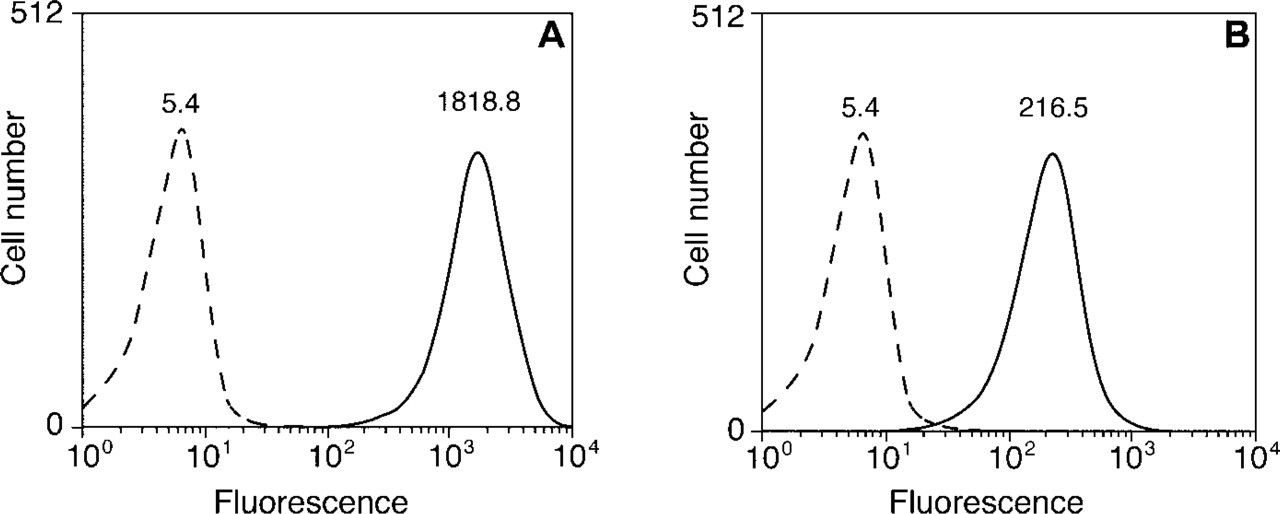
Flow cytometric comparison of EL4 lymphoma cells incubated first with a biotinylated anti-CD44 mouse MAb, then labeled with a dye R-PE SA tandem conjugate. (
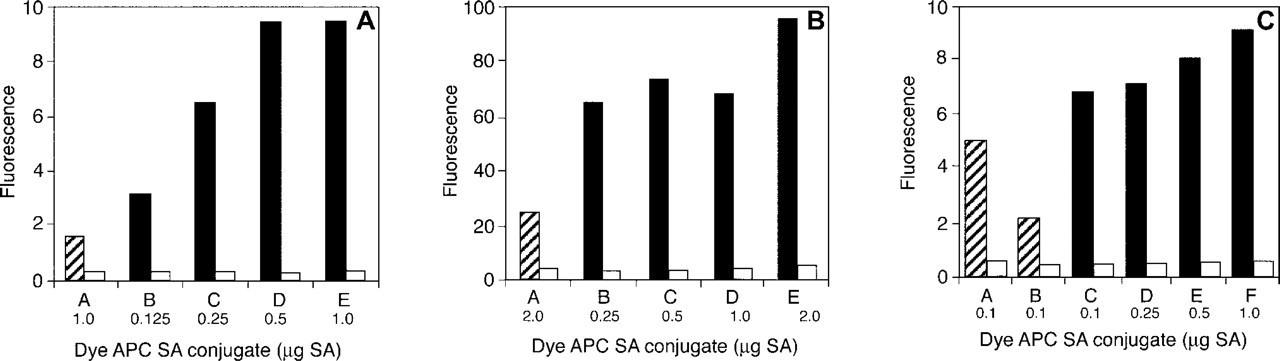
Fluorescence comparison of T-cells incubated with biotinylated mouse anti–human CD3 antibody, then labeled with a dye APC SA tandem conjugate. Various dilutions of secondary labels were assayed. (
Footnotes
Acknowledgements
We wish to thank Laura Meek and David Hagen for their editorial contributions to this manuscript and Marci Cardon for the preparation of figures. We also thank Woody Hopf, Maria Grazia Cascini, and Antonello Bonci of the Ernst Gallo Clinic and Research Center, University of California San Francisco, for providing tissue samples used in the immunohistochemistry studies.
Alexa Fluor is a registered trademark of Molecular Probes, Inc. Cy is a trademark of Amersham Biosciences.