
Abstract
This article describes an automated rotation rate tracking algorithm for pigmented cells that undergo rotation in a dielectrophoretic (DEP) force field. In a completely automated process, we preprocess each frame of a video sequence, then analyze the sequence frame by frame using a rotating-circle template with a block-matching algorithm, and finally estimate the rotation rate of the pigmented cells using a pixel-patch correlation. The algorithm has been demonstrated to accurately calculate the DEP-induced rotation rate of the cell up to 250 rpm. Cell rotation rates in various DEP force fields (i.e., by varying the applied voltages, frequencies, and waveforms to induce different force fields) were analyzed using this automated algorithm and reported in this article. Most importantly, the algorithm is accurate even when the cells have simultaneous translational and rotational motions across the video image sequence. Also, the algorithm is capable of tracking changes in rotation speed over a long period of time (90 s) by stably analyzing a massive data set of video image frames.
Cell manipulation is a fundamental process in many areas of biology and biotechnology, 1 such as cell-based screenings for basic science, surface immunophenotyping for diagnosis, studies of how cell morphology affects differentiation, and detecting pathogenic bacteria in food supplies.
Cell-sorting techniques are used to separate cells according to their properties. There are many cell-sorting techniques, including panning, fluorescence-activated cell sorting, magnetic cell sorting, and recent developments based on dielectrophoresis (DEP) to move cells in microfluidic devices.2,3 In this article, we present an automated method to track and quantify the rotation of pigmented cells with a diameter on the order of 10 µm. Accurate analysis of cell rotation can be potentially used as a sorting criterion for cell identification and separation, based on our group’s recent discovery of the self-induced rotational motion of pigmented biological cells in a dielectrophoretic force field. 4
The generation of a DEP force from a nonuniform electric field is a well-known phenomenon and is briefly described below. When a polarized object is exposed to a nonuniform electric field, a dipole moment is induced, and the object will move toward the maxima or the minima of the electric field depending on its relative polarizability with respect to the medium. 5 According to the theory of electromagnetism, the DEP force acting on a cell suspended in a fluid is given by equation 1:

where R is the radius of the cell, Erms is the root mean square (rms) value of the electric field, and K(ω) is the real part of the Clausius-Mosotti (CM) factor. The CM factor is related to the particle dielectric constant and indicates the relative magnitude and direction of the force experienced by the particle and is given by equation 2:

where ϵ p * and ϵ m * are the complex permittivities of the cell and the medium. ϵ* is defined as in equation 3:

where ϵ and σ refer to the permittivity and the conductivity, respectively.
In practice, during biological experiments, cells may not be treated as isolated, single particles. Usually, there are large numbers of cells in a given sequence of microscopic video frames that are captured and stored for cell-motion analyses. Any manual method used to ascertain the cell rotation speed for cell sorting would be slow, difficult, and inaccurate. Therefore, we have developed an automated procedure to analyze microscopic image sequences using algorithms to estimate cell rotation speed. We envision that this procedure will eventually enable the development of a fully automated system for identification, manipulation, and sorting of cells based on the self-induced rotation phenomenon of specific cells. The fabrication process for the microfluidic chips and the DEP experimental setup are detailed in an earlier article. 4 This article will present the DEP-based cell rotation experiments along with details of the rotation speed estimation algorithm with translation motion compensation.
Cell Rotation Experiments
Cell Behavior in a DEP Field
Cells, similar to other micro- and nano-scale entities such as carbon nanotubes, carbon nanoparticles, Au nanoparticles, and microbeads, mainly experience two types of forces in an appropriately applied AC electric field: a positive DEP force (p-DEP), that is, an attractive force, and a negative DEP force (n-DEP), that is, a repelling force. Based on the distinctive electrical phenotypes of different cells, it is possible that by applying the same DEP field, one type of cell would experience a n-DEP whereas the other type of cells experiences a p-DEP force. The factors that would affect the cell response in the DEP field include (1) the physical properties of the cells such as shape, size, and mass distribution of the cells; (2) the dielectric property of the cells; and (3) the dielectric property of the medium.
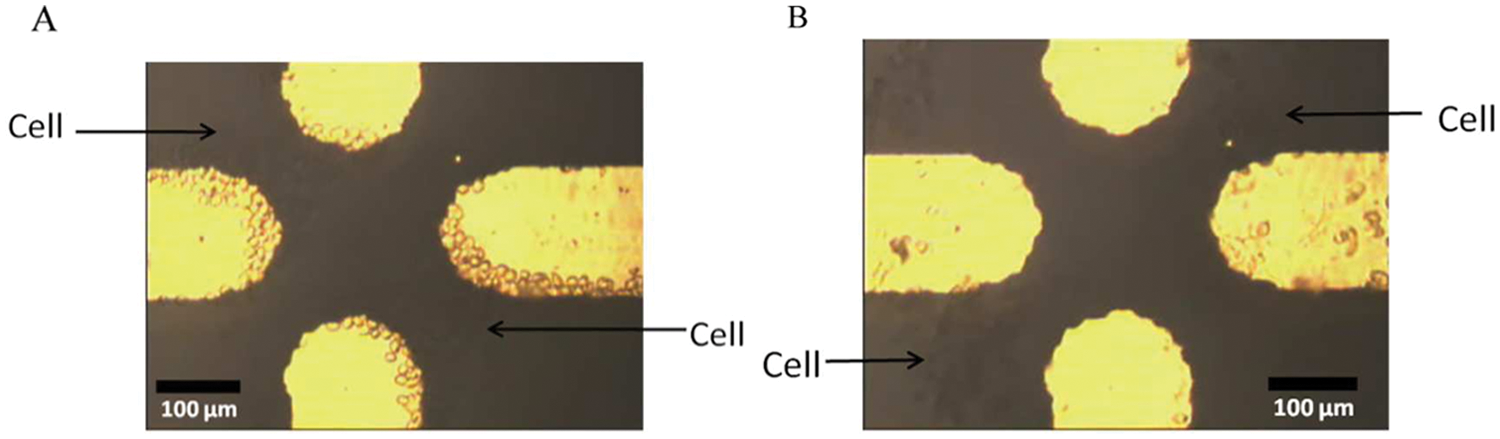
Figure 1 shows the response of typical cells (B16 cells) under a DEP force in a microchannel. In Figure 1a , the cells are experiencing a p-DEP force and are attracted to the microelectrodes. Pearl chains are formed between the tips of electrodes. In Figure 1b , the cells are experiencing an n-DEP force and are repelled from the electrodes. The DEP parameters applied during the experiment are 16 V voltage and 22 MHz frequency. Under these conditions, the cells typically experienced a p-DEP force and are attracted to the electrodes. Then, when the voltage is fixed and the frequency is gradually decreased, the cells become disconnected with the Au electrodes.
Cell reaction in the presence of dielectrophoresis forces: (
DEP parameters
Self-rotation is observed only when the cells are experiencing a p-DEP force, as is applied between the Au microelectrodes. A voltage larger than 5 V and a frequency higher than 10 M provide a sufficient DEP force for cell rotation.
Geometry and dimensions of the micro-electrodes
Several patterns of electrodes have been used in attempts to induce rotation of cells, including a four-probe orthogonal electrode pattern (as shown in Fig. 1 ), circular, rectangular, and interdigitated. Results showed that even with the same DEP parameters, these patterns do not deliver the same results, as no self-rotation of the pigmented cells is observed in all tested patterns except for the four-probe orthogonal pattern. In addition, we also tried the same four-probe orthogonal electrode pattern with electrode widths of 150 µm, 40 µm, and 20 µm. Theoretically, the shrinkage in electrode size should provide a larger DEP force, which could potentially accelerate the self-rotation process. However, the experimental results failed to follow this expectation, as the self-rotation of the pigment cells does not exhibit any dramatic improvement in terms of either rotation speed or the total number of cells that undergo self-rotation motion. On the contrary, a probe electrode with a 150 µm width shows better results for the observation of this phenomenon. The probable reason is that when a sufficient DEP force is applied, the larger surface area of a larger electrode would attract a larger number of cells. This induces the possibility of self-rotation of more cells without compromising the rotation speed. In other words, because the diameter of the pigment cells was ~10 to 15 µm, therefore, for smaller electrodes, the electrode surface area may not have a sufficient force field to induce cell rotation. Also, for 40 µm and 20 µm electrodes, we observed only alignment of cells between the electrodes but rarely any rotation.
On the other hand, for nonpigmented cells, which are not as susceptible to the DEP force–induced self-rotation, the electrodes with smaller dimensions exhibit an improved response to the DEP force in terms of cell alignment and attraction. For instance, HaCaT cells (nonpigment cells) could not be attracted to the 150 µm microelectrodes during DEP manipulation (i.e., no apparent attraction of cells to the electrodes even when a maximum DEP force is applied). However, a cell chain of HaCaT cells could be formed using 40 µm microelectrodes. Therefore, for the cell rotation experiments reported in this article, the dimension of the microelectrodes is 150 µm in width, unless otherwise specified.
Medium in the microchannel
Both the viscosity and the dielectric property of the solution are critical for cell manipulation. Ideally, the permittivity of the solution should be as small as possible in order to create a distinct difference between the cell itself and the surrounding solution. Also, the viscosity of the solution should be carefully controlled as the cell movement and rotation could slow down or even completely stop if the solution is too viscous. The solution used for our experiments was 0.2 M sucrose (i.e., 6.84% sucrose solution). Based on prior literature, 6 this solution’s estimated conductivity is ~1 mS/m, and the kinematic viscosity at 20 °C is ~1.2 × 10⁻⁶ m2/s.
Pigmented Cells versus Nonpigmented Cells
From our experiments, pigmented cells are more susceptible to the DEP force in terms of alignment and attraction to the electrodes; that is, pigmented cells are able to form a pearl chain of cells between the microelectrodes faster than the nonpigmented cells. Also, as aforementioned, stable and repeatable self-rotation is observed only in pigmented cells. For the other three types of nonpigmented cells, including two types of skin cells (keratinocyte and HaCaT) and one type of lung cancer cells (A549), the self-rotation phenomenon only occurs occasionally. For instance, self-rotation in a small number of A549 cells is observed. However, it lasts for only a few seconds and quickly stops after the cells reach a stable position. Also, the rotation speed is much slower when compared with the pigmented cells. From our observations, the self-rotation of nonpigmented cells may occur, but the duration is short and the rotation is unstable, unrepeatable, and highly susceptible to the flow rate compared with the rotation of pigmented cells.
Although we are still working on a solid theoretical explanation for this self-rotation phenomenon, we highly suspect that it is related to the semiconductive electrical properties of the melanin located inside the pigmented cells. Typically, cells in the fluids are modeled as a single or multishell sphere with an evenly distributed dielectric property on the cell surface. It is possible that the existence of the melanin would break this balance and create an unevenly distributed model, with the part containing melanin exhibiting a different electrical property than the rest of the cells. Therefore, this imbalance could lead to the self-rotation of the cells in an AC electrical field, as observed.
Investigation of the Self-rotation Speed of Pigmented Cells
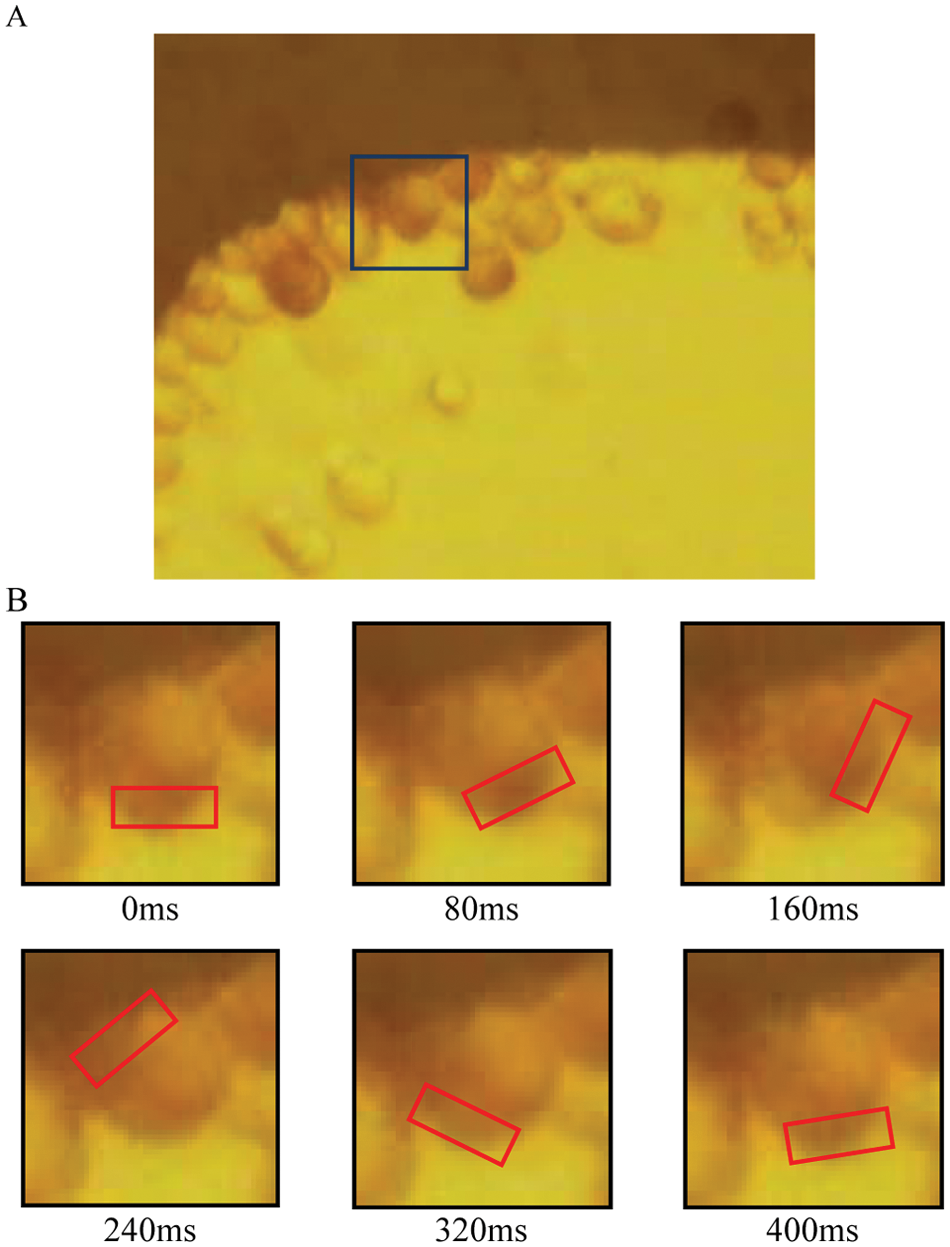
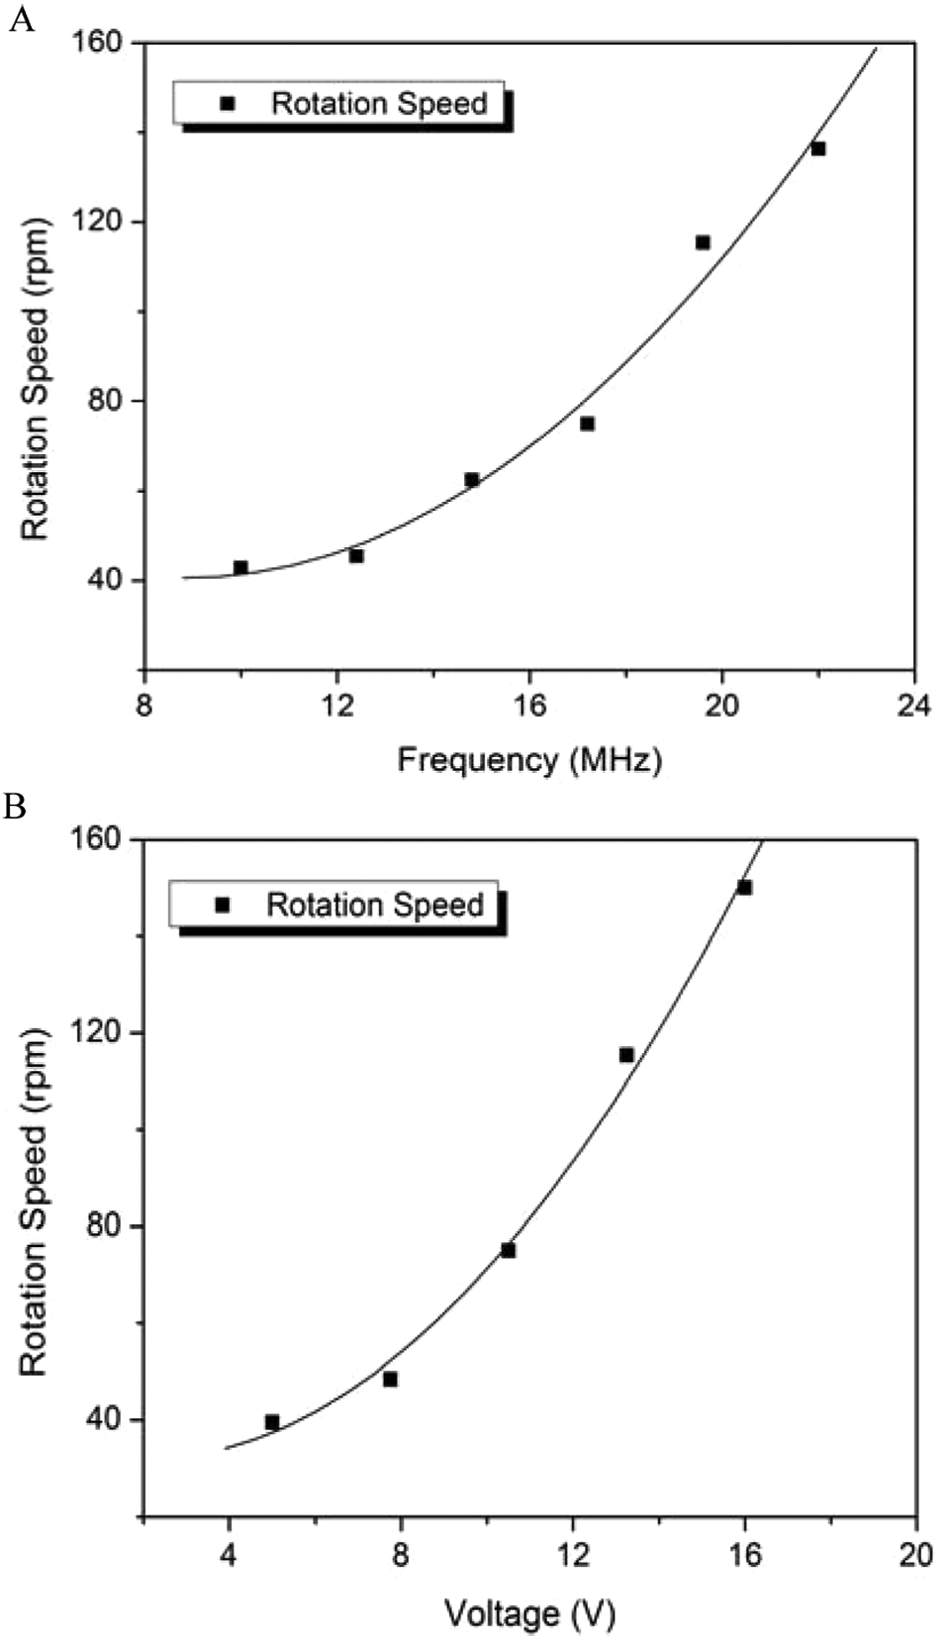
As reported in the previous section, pigmented cells exhibit the cell rotation phenomenon under a sufficient p-DEP force. Figure 2 shows a sequence of photos of a single Melan-A cell self-rotating for one revolution, which takes 320 ms. Furthermore, we found that the rotation speed of the cells could be changed by adjusting the DEP parameters; that is, different applied frequencies and voltages result in variations in the rotation speed. Video records of cell rotation are examined frame by frame, and the rotation speeds under different conditions are calculated. The resulting changes in self-rotation speed under different frequencies while the voltage is kept constant at 16 V as well as the rotation speed of the same cell under different voltages while the frequency is kept constant at 22 MHz are shown in Figure 3A and B , respectively. The curves in the figure prove that a higher frequency or a higher voltage leads to a higher rotation speed of up to 150 rpm.
(
Self-rotation speed of Melan-A cells using different dielectrophoretic parameters. (
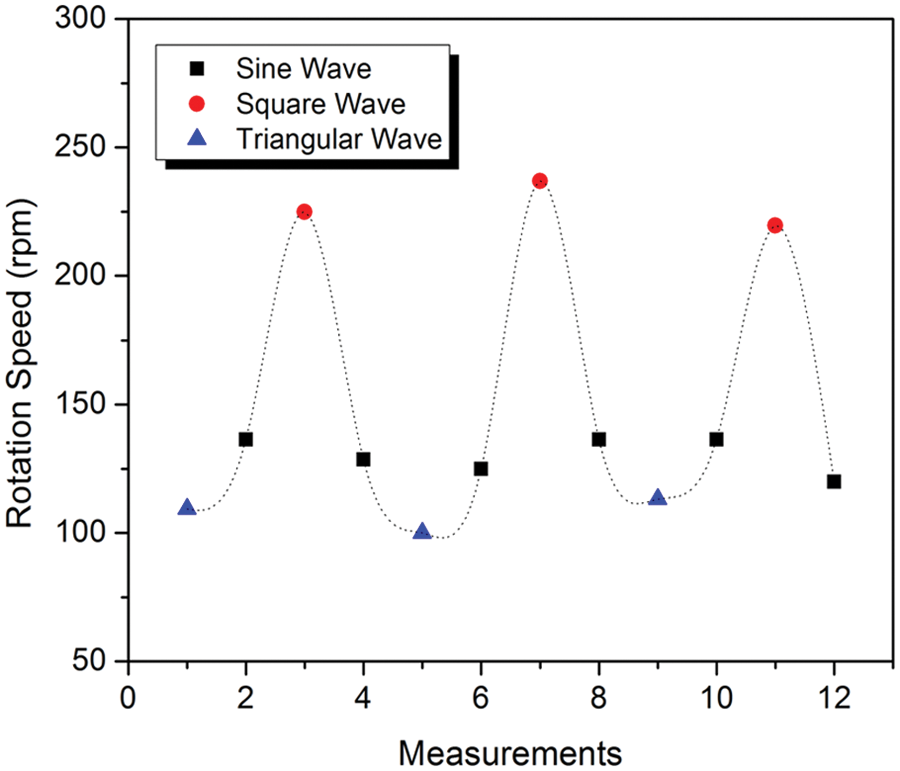
In addition, we also apply different waveforms (i.e., sine wave, square wave, and triangular wave) of the AC electrical field to the microfluidic chip and analyze the self-rotation speed of the pigmented cells. The results show that cells rotated much faster under a square waveform (~240 rpm) compared with a sine waveform (~130 rpm) or a triangle waveform (~110 rpm). This phenomenon could be explained by the fact that a square wave is composed of an infinite number of harmonics; that is, a fast Fourier transformation of a square wave can be expressed as an infinite series of sinusoidal waves. Comparing a sine wave and a square wave at the same frequency, the latter waveform contains higher-frequency components than the designated frequency of the wave. 7 The quantified rotation speed is summarized in Figure 4 . This plot also shows that this variation in rotation speed variation is both controllable and repeatable. Also, from our observation, the rotation direction of the cells was random; that is, we have no control of the clockwise or counterclockwise direction of the cell rotation relative to the surface plane (x-y plane).
Self-rotation speed of a Melan-A cell under different waveforms.
Automatic Cell-Sorting Algorithm
In order to automatically estimate the cell self-rotation speed for rapid cell sorting, we have developed an algorithm based on the analysis of image sequences. The acquired image sequences are captured by a charge coupled device (CCD)–based microscope system. The cell rotation speed estimation method is divided into three stages, as described below. First, image preprocessing, including noise reduction and contrast adjustment, enhances the performance of the analysis. The noise filtering improves image quality, and a contrast adjustment is performed with histogram equalization enhancing the contrast between the cells and the background. A cell rotation estimation algorithm is used to analyze two basic motion patterns, namely, cell self-rotation about its yaw axes and the rotation with translational motion along the chip surface. In order to estimate the cell rotation speed about the yaw axis accurately, translation compensation is adopted in the algorithms. After this compensation, the cells’ rotation cycles can be counted through a pixel-patch correlation calculation. Summarizing, the cell rotation speed estimation method is split into three stages: image preprocessing, translational motion tracking, and a pixel-patch correlation-based calculation that yields the cell self-rotation speed. Figure 5 shows a process flow diagram of the aforementioned algorithm.
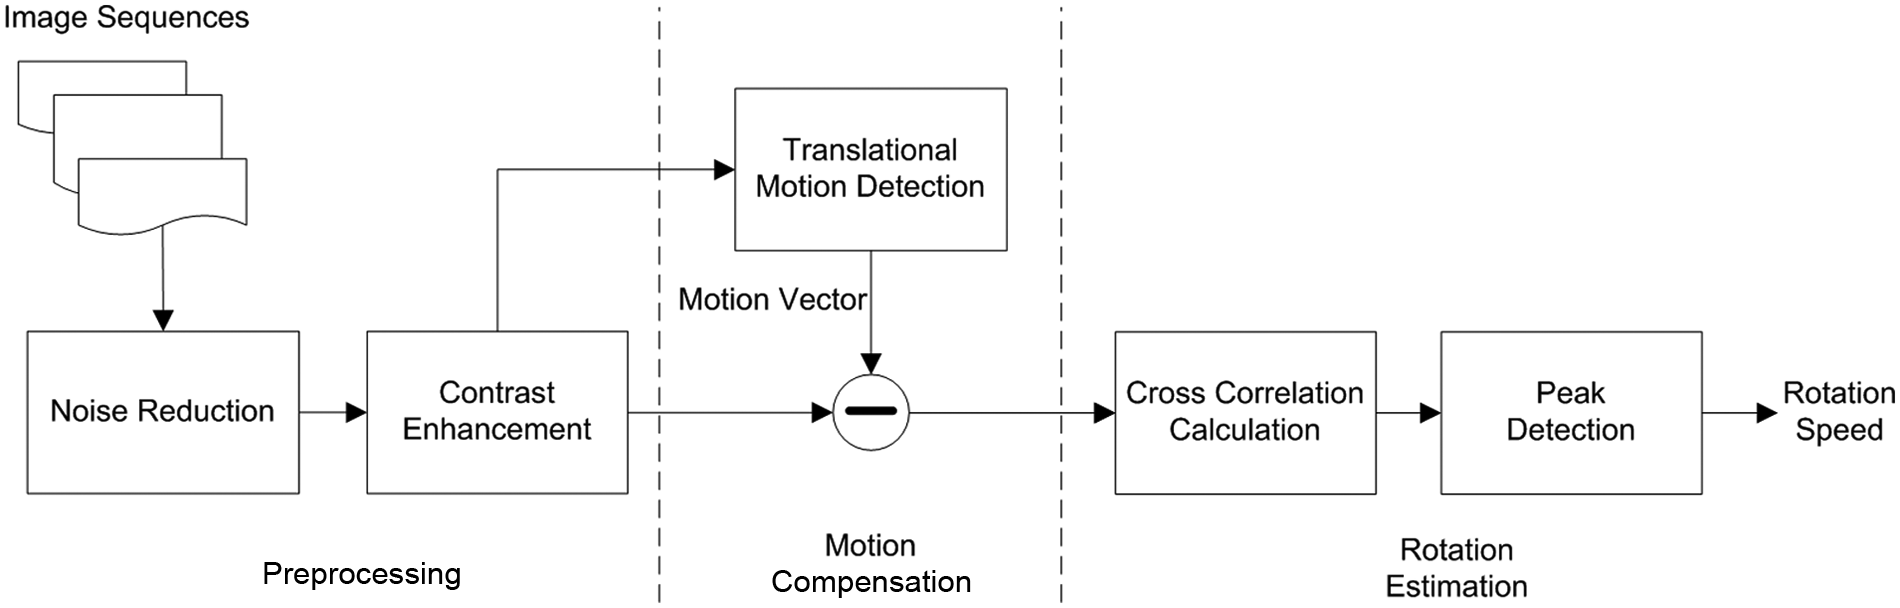
Block diagram illustrating the cell rotation estimation algorithm.
Image Preprocessing
The cell rotation image sequences are captured by a CCD microscope system. There are several sources of noise in microscope imaging: photon noise, thermal noise, readout noise, and quantization noise. 8 Image preprocessing methods with noise reduction and contrast enhancement are the basic methods to improve the performance of later image sequence analysis. Noise reduction improves the fidelity of the original acquired image. After preliminary noise reduction, we then apply contrast enhancement to the image sequences. Image contrast enhancement is applied to images to improve the visibility of melanin in the cells.
Noise reduction
Noise reduction processing is a fundamental operation in biomedical image-processing applications. Any subsequent operation will benefit from noise reduction processing. The noise level can affect the performance of the image analysis algorithm, especially in separating objects from the background. In a microscope video sequence of a cell, light objects are on a dark background. We could, for example, look for the lowest intensity value in the object and separate the object from the background by searching for all pixels that have an intensity value higher than this threshold value. However, noise has changed the intensities in the background and in the object, so that there are some very high intensities within the background and some very low intensities in the object. Image preprocessing can reduce this noise distribution effect.
One type of noise arises from the camera sensors. In the camera, incoming photons are transformed into an electrical charge by a CCD. However, some electrons are created within the CCD randomly. This randomly distributed noise is added to the signal. Because the background noise should be homogeneous with a random distribution of intensities, a Gaussian low-pass filter can be used to remove readout noise. The Gaussian filter kernel function is described as follows:
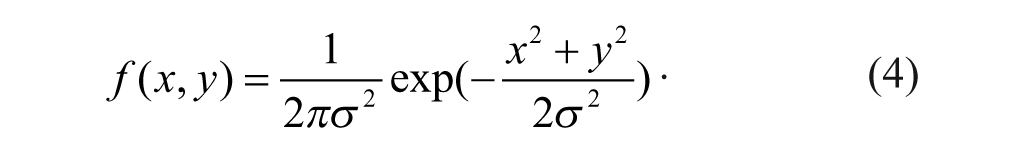
The Gaussian filter can be applied using standard convolution methods with a suitable kernel function. The convolution method is performed to reduce the filtering computation time, because the 2D isotropic Gaussian equation can be separated into two orthogonal components. Therefore, the 2D convolution can be performed by two convoluting operations in two orthogonal directions.
Contrast enhancement
The noise-reduced grayscale image in Figure 6A lacks details because the range of luminance is limited to a narrow band of gray levels, as shown by the image’s histogram in Figure 6C . The image histogram simply plots the frequency at which each gray level occurs from black to white. It shows that most of the gray levels in the image are grouped between about 90 and 240. Image contrast enhancement is required to produce a clear image through a redistribution of these brightness intensity values.
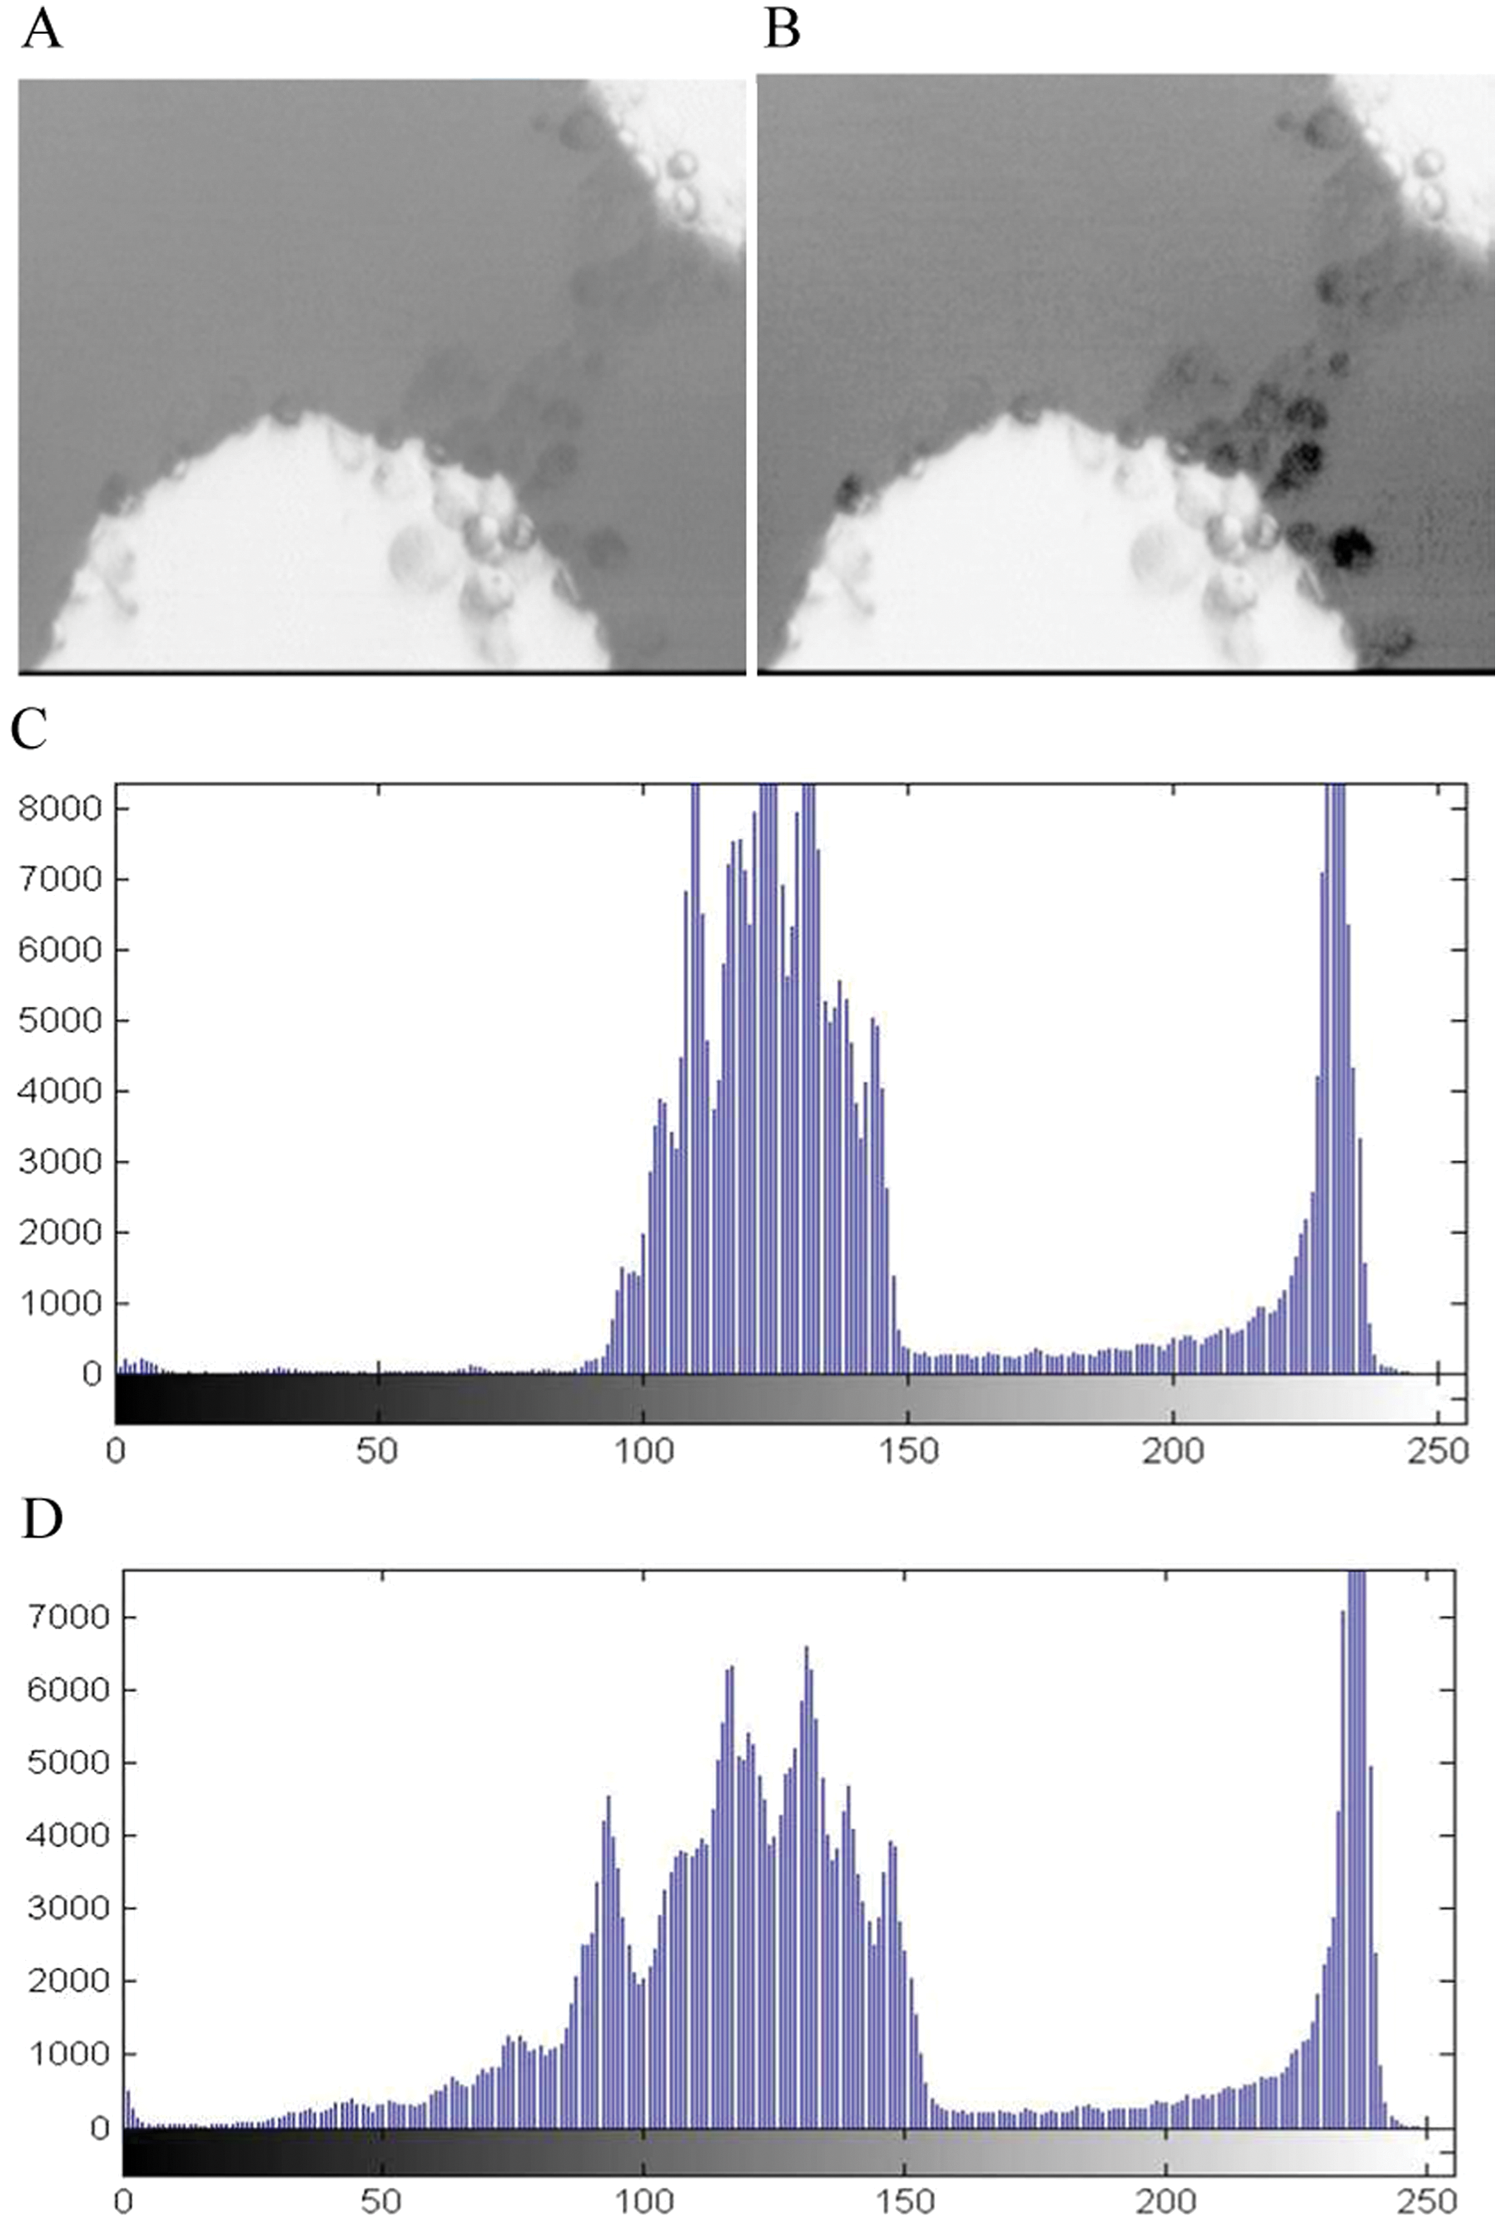
Image preprocessing results. (
In order to enhance the contrast between the cells and the background, a histogram equalization is applied to the image sequences, which enhances the contrast of the grayscale image. 9 Histogram equalization is one the most well-known methods for contrast enhancement. This approach is generally useful for images with a poor intensity distribution. Histogram equalization expands the luminance within the image to fill the entire grayscale spectrum. To do this, the cumulative frequencies are calculated within the image. The cumulative frequency of a gray level is defined as the sum of the histogram data. So the equalized histogram keeps the profile of the original histogram, although it is now extended to the entire spectrum. The cumulative frequency graph makes the gray-level frequencies distribute evenly within the image.
Histogram equalization is applied in the following manner. A given grayscale image {x} is composed of L discrete gray levels, denoted as {Xi}, and the probability density function is defined as

for i = 0, 1, . . ., L-1, where ni is the number of times that the level Xi appears in the image {x}, and n is the total number of samples in the image. Based on the probability density function, a cumulative density function cdf(x) is defined as

where cdf(XL-1) = 1 by definition. Thus, the corrected pixel value of the grayscale image transform function is based on the cdf(x) and is expressed as

An image that is intensity corrected using a homogeneous histogram equalization has enhanced contrast between the cells and the background. The corrected image is much clearer, and details within the cells are much sharper. The equalized image with the histogram and cumulative frequency graphs is shown in Figure 6D . After noise reduction and contrast enhancement, image qualities are greatly improved and ready for subsequent algorithms, as seen in Figure 6B .
Rotation Estimation Algorithms
There are two basic observed motion patterns for a cell: one is self-rotation about its yaw axes, and the other is a translational motion along the chip surface. To estimate cell rotation, translation compensation needs be adopted in the algorithms. After this compensation, the number of cell rotation cycles is counted through a pixel-patch correlation calculation.
Translational motion tracking
The most popular translational motion compensation method is the block-matching algorithm, which is a block-based motion estimation method. The best matching block is found for a reference block within a search area, and then a motion vector is calculated as the displacement of the best matching block to the position of the current macro-block. This translational motion vector describes the location of the matching block from the previous frame with reference to the position of the target block in the current frame.
Although there is no zooming motion in the sequence of microscope images of the cells in our DEP experiment and the brightness and contrast of the sequences are nearly stable, self-rotation of cells could affect the matching accuracy due to nonoverlapping blocks needed for the general block-matching algorithm.
In order to improve accuracy, we propose using a rotating-circle matching template to replace the nonoverlapping matching block template. Figure 7 depicts the rotating-circle matching template generation process. The process involves three stages: (1) converting the original image to a grayscale, (2) producing a binary image using an adaptive thresholding method, 10 and (3) estimating the center and radius of the fitted-circle mask. For a rotation over an angle θ, a point X(x, y) in the original image is mapped onto the point X′(x′, y′) in the resultant image. The relation between the points is
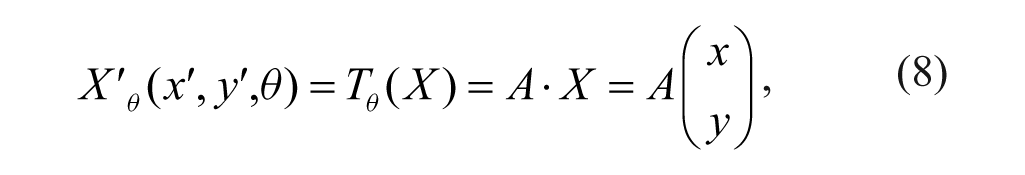
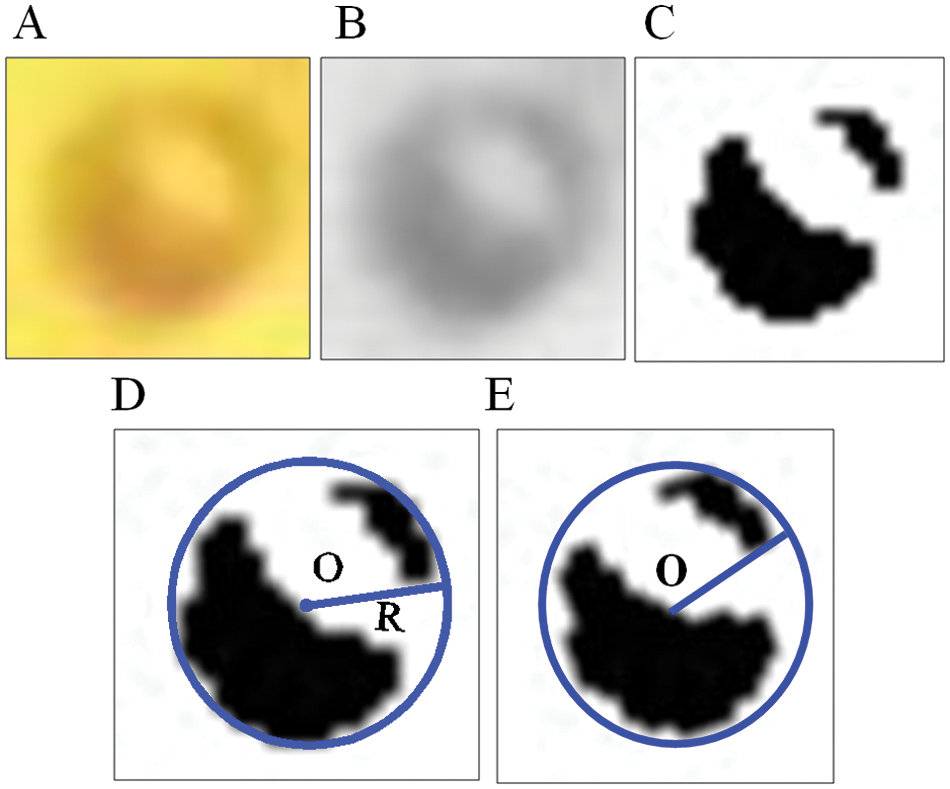
Image processing to generate a rotating-circle matching template. (
where Tθ(⋅) is a rotation operator and
To find the motion vector for a specific cell in the current frame, a best-matching image patch is searched within a predefined search window in the previous, reconstructed, reference frame, as shown in Figure 8 .
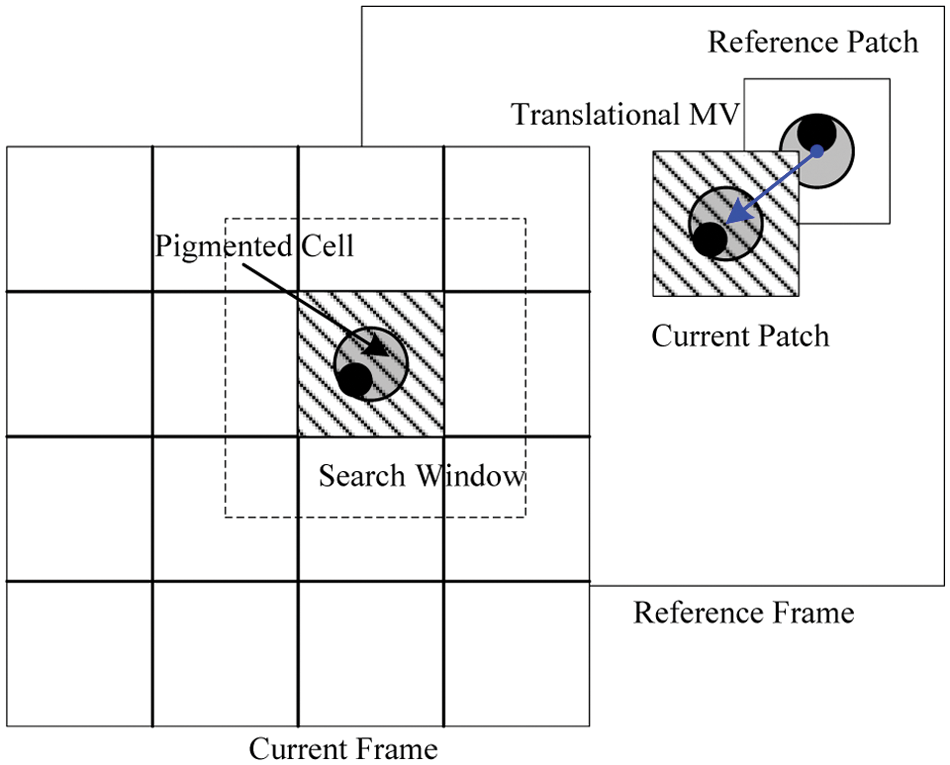
Translational motion tracking with a rotating-circle matching template.
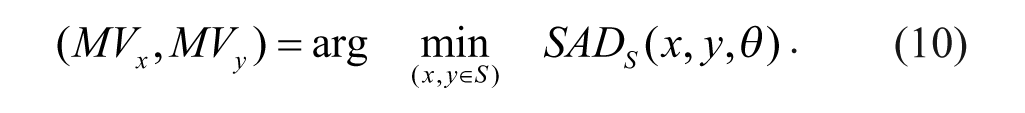
There are many types of matching criteria for the block-matching algorithms, such as the sum of the absolute difference (SAD), the mean squared difference, 11 the mean absolute difference, 12 and so on. In this article, we estimate the motion vector based on the SAD with consideration for optimizing computational efficiency. The motion vector (MVx, MVy) is defined in equations 10 and 11. The best matched patch in the search window of the current frame is found from the minimum value of the SAD with the rotating-circle matching patch in the reference frame and the target patch in the current frame.
The matching criterion is expressed as follows:
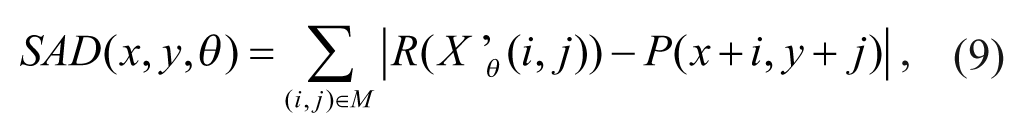
where (x, y)∈S and (i, j)∈M, S is the search window and M is the defined image mask. The corresponding motion vector for the target window with the minimum SAD is then determined by
In a pseudo-code format, the SAD calculation is performed based on the rotating-circle matching template as
1. for (x,y) in search window S
2. { for( θ = 0 to 2π)
3. { calculate SAD(x, y, θ)
4. increment θ by a step Δ
5. }
6. increment x,y by 1
7. }
Image patch cross-correlation
After compensation for the translational motion in the images based on the motion vector, we then calculate the image patch cross-correlation to estimate the cell rotation speed. The correlation coefficient shows the similarity between the selected template patch from the subsequent image patches at the same location. For a grayscale image patch, the correlation coefficient γ is defined as
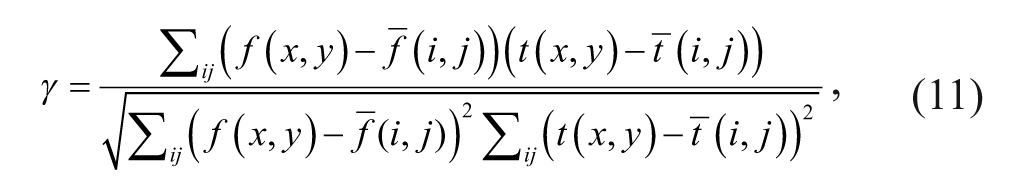
where t(⋅) is the selected template patch and f(⋅) is the subsequent image patch;
The correlation coefficient reflects the degree of linearity between two data sets. A larger value indicates a perfect positive linear relation between the two data sets, whereas a smaller value indicates a perfect negative linear relation. Therefore, we detect the local maxima values of the correlation coefficients to track the peak points, and the rotation cycle can be estimated through the index of the peak points.
Algorithm Performance
For verification of the proposed rotation estimation algorithm, image sequences at different cell rotation speeds are recorded. The cell self-rotation speed range is varied from 50 rpm to 250 rpm by adjusting the DEP parameters (i.e., frequency, voltage, and waveforms).
For quantitative verification of the performance of the translational motion compensation algorithm, the cell compensation estimation results are compared with the estimation without compensation, as shown in Figure 9 . We selected an image sequence duration greater than 1.12 s (28 frames at 25 fps) for the test. The standard deviation of the motion compensation results is much less than the estimate without the motion compensation. That means that the proposed algorithm has performance stability in estimating the rotation rate of the cell.
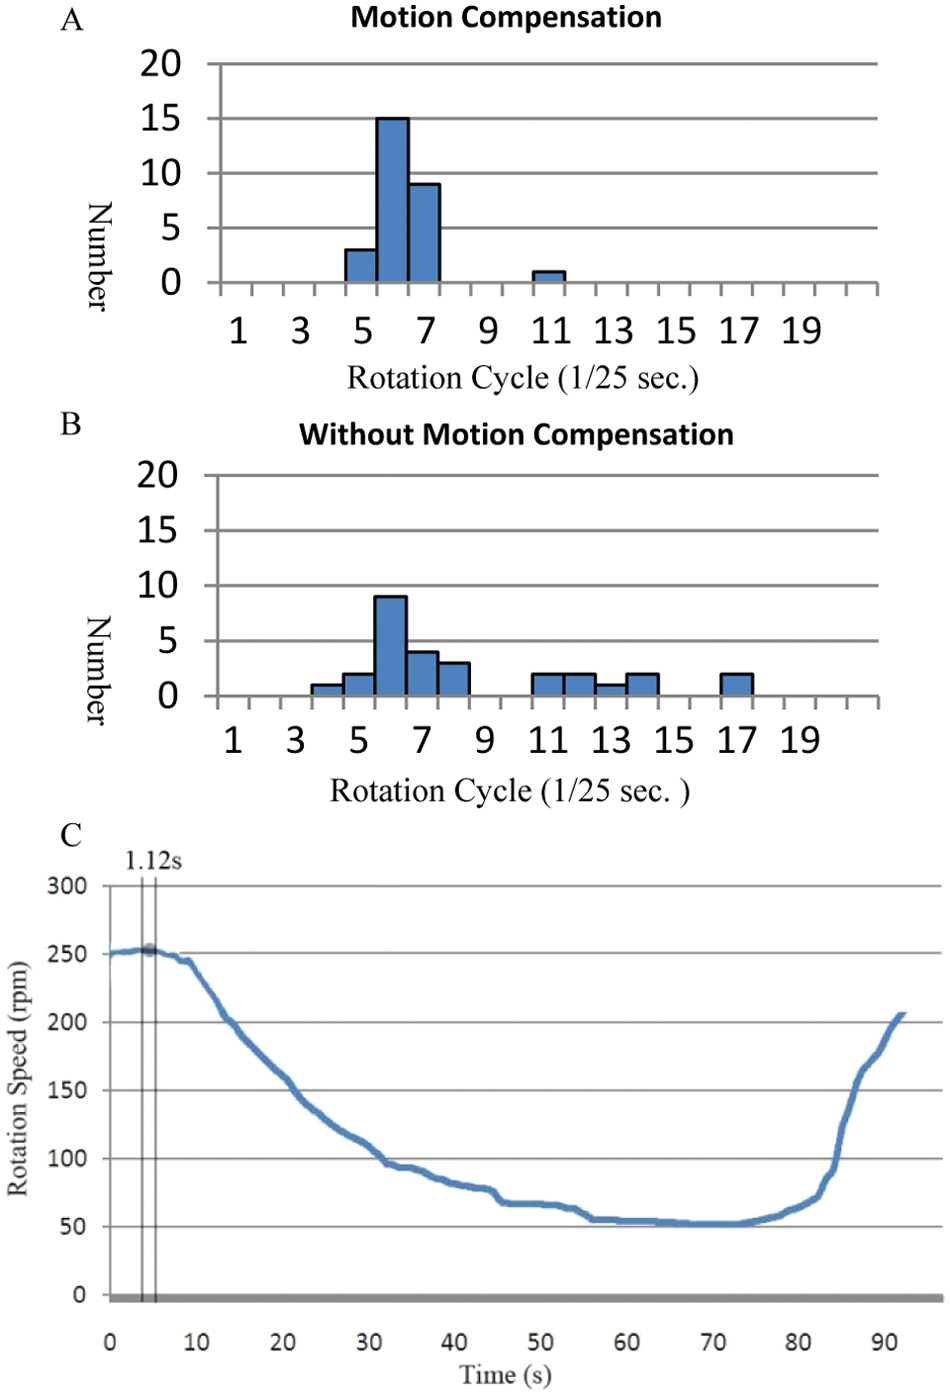
A comparison of the standard deviation of results with motion compensation (
The position change for a Melan-A cell for ~90 s is recorded and is plotted in Figure 10 , during which the voltage is first decreased from 16 V to 1.5 V gradually and then is increased back to 16 V. Figure 11 shows a comparison between using this algorithm and a manual method (i.e., by visual identification using human eyes) to analyze the same video frame by frame, which demonstrates that the different methods provide matching results. Also, the algorithm is capable of tracking changes in the rotation speed for a certain period, which is almost impossible to estimate manually.
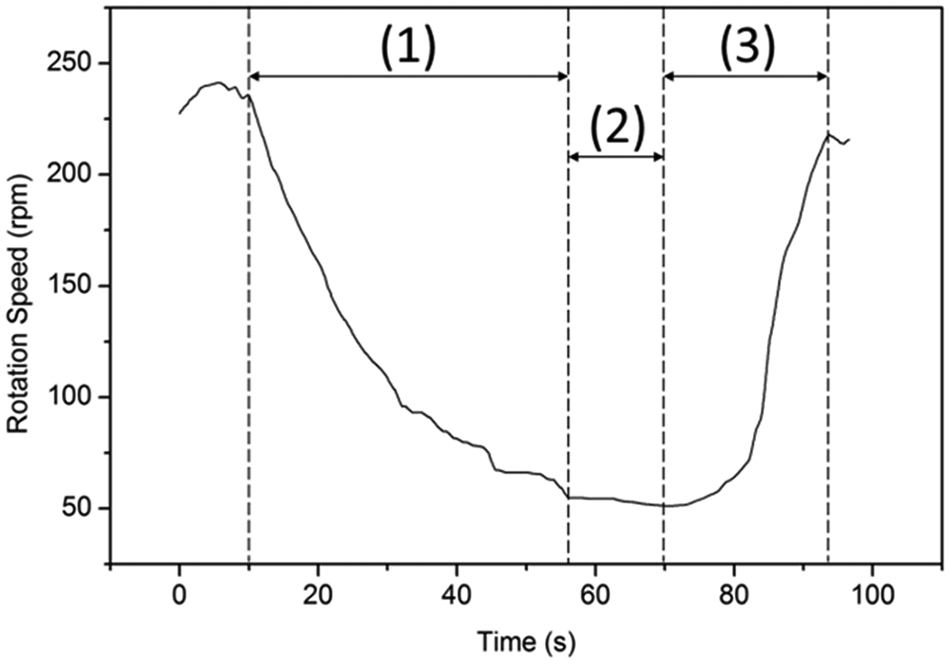
Analysis of a cell’s rotation speed using the developed algorithm for (1) decreasing dielectrophoretic voltage, (2) resting voltage, and (3) increasing voltage.
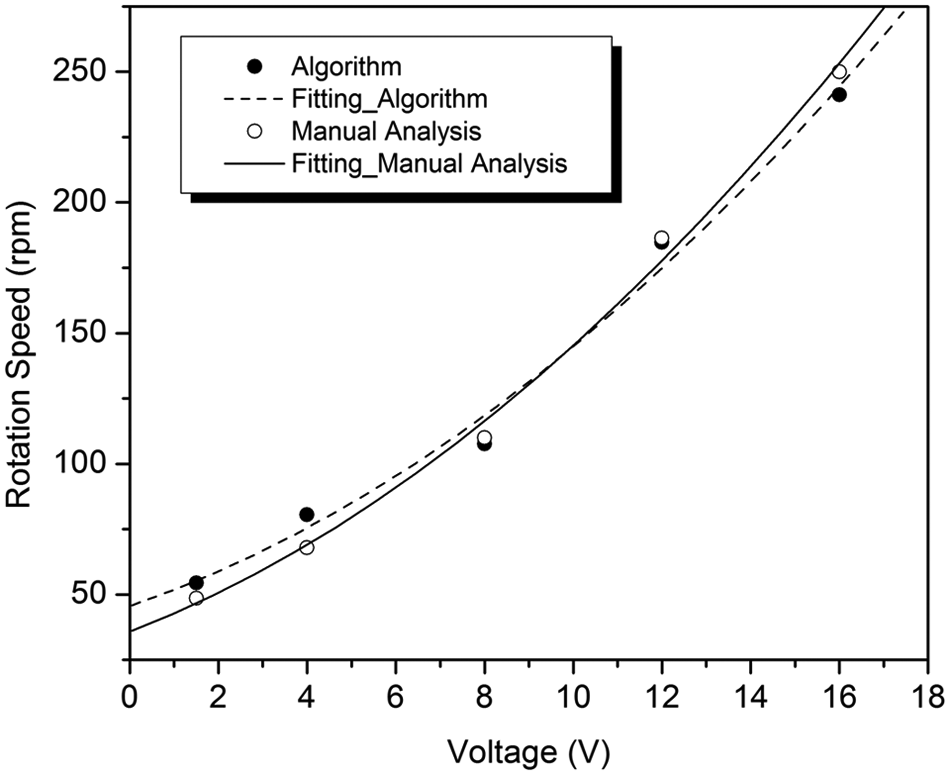
Comparison of a self-rotation speed analysis for a Melan-A cell using a manual method and the algorithm developed for this work.
Conclusions
Cell manipulation using a DEP technique is conducted in a transparent microfluidic chip with embedded Au microelectrodes fabricated using microelectromechanical systems technology. Self-rotation of pigment cells is observed when a specific electrical potential is applied between the microelectrodes to generate a DEP force field. We have developed a novel computer vision algorithm to estimate the cell rotation speed automatically. This algorithm analyzes each frame of a video sequence taken from a CCD-based microscope using a rotating-circle template with a block-matching method and a pixel-patch correlation. Compared with the manual estimation process, the algorithm can more accurately calculate the DEP-induced rotation rate of the cells at various applied voltages, frequencies, and waveforms and also reduce data-processing time by at least 100 times. Most importantly, the algorithm is accurate even when the cell has a simultaneous translational motion across the video image sequence. Also, the algorithm is capable of tracking changes in rotation speed over a long period of time by stably analyzing a massive data set of video image frames. Therefore, we envision that our automatic cell rotation analysis method can be used with DEP technology as an efficient procedure for automated cell sorting in the future.
Footnotes
Acknowledgements
The authors would like to thank Ms. Florence W. K. Cheung and Ms. Jia Guo of the School of Biomedical Sciences, The Chinese University of Hong Kong, for their help in culturing and preparing the cells for our experiments.
Declaration of Conflicting Interests
The authors declared no potential conflicts of interest with respect to the research, authorship, and/or publication of this article.
Funding
The authors disclosed receipt of the following financial support for the research, authorship, and/or publication of this article: The work described in this article was supported by a grant from City University of Hong Kong (project No. 7200298) and a grant from the Croucher Foundation (project No. 9500011).
References
Supplementary Material
Please find the following supplemental material available below.
For Open Access articles published under a Creative Commons License, all supplemental material carries the same license as the article it is associated with.
For non-Open Access articles published, all supplemental material carries a non-exclusive license, and permission requests for re-use of supplemental material or any part of supplemental material shall be sent directly to the copyright owner as specified in the copyright notice associated with the article.