
Abstract
Photocatalytic activity can be studied by several methods, each with its own strengths and weaknesses. To study photocatalytic activity in an easy, user-friendly, and realistic way, a completely new setup has been built. The setup is modularly constructed around Fourier transform infrared spectroscopy (FTIR) spectroscopy at the heart of it, resulting in great versatility. Complementary software has been written for automatic control of the setup and for processing the generated data. Two pollutants, oil and n-octane, are tested to validate the performance of the setup. These validation experiments confirm the usefulness and added value of the setup in general and of the FTIR detection methodology as well. It becomes clear that a system of online measurements with good repeatability, accuracy, and user-friendliness has been created.
Introduction
In the late 1970s and early 1980s, the first successful experiments were conducted in the field of photocatalysis. 1 By irradiating the photocatalyst with UV light, an activated material is created that can react with molecules to reduce or oxidize them.2–5 These experiments were promising, and further developments of materials and conditions were made over the years, resulting in more and better insights in photocatalysis. One of these promising applications of photocatalysis is the possibility of abating different types of pollution in the liquid or the gas phase. 6 At the same time, new application fields for photocatalysis are being discovered. This shows the necessity for an automated photocatalytic test setup.
The development of these catalysts is done in several laboratories by using widely different methodologies. These catalytic materials are subjected to tests to study their material properties, sorption behavior, or photocatalytic efficiency. The latter one is tested in different ways depending on the used pollutant, either in the liquid or gas phase. For testing in the liquid phase, batch experiments are often selected. In general, it comes down to placing the catalyst into a closed vessel immersed with the chosen pollutant of which the concentration can be monitored by using the appropriate detection system. Typical examples of this method are experiments with dyes where the color of the solution is monitored by UV-Vis spectroscopy.7–9 Depending on the test used, the monitoring of the concentration and thus degradation are mostly off-line. The same type of batch experiments can be used in the gaseous phase. The concentration is monitored in this case by gas chromatography. 10 There are two important limitations to measuring in batch. The first is attributed to the batch process itself. A process with a continuous flow is more realistic and will be used more frequently when studying pollutant abatement. A second limitation is the rather small amount of catalyst (in the milligrams region) that is used in the experiments. The extrapolation of the results, based on such batch experiments, to realistic conditions is thus not straightforward.
The monitoring of the gaseous phase can also be done in a continuous manner to obtain more realistic results. In the literature, several types of setup are described where mass flow controllers are used to control the gas flow, which is then led through the reactor.11,12 These methods have their limitations mostly because of the lack of automation of the whole process, which makes it more difficult to control the timing, resulting in lower repeatability. Automation is thus crucial to achieve this. To construct a setup that has all the advantages of online measurements with good repeatability, accuracy, and ease of use, a complete new setup including software is crucial. It is also important to provide the possibility of keeping it up to date to emerging technologies as well as to new measuring methodologies. For instance, it is possible to integrate new reactors, detectors, and sensors without major limitations.
In this article, such a setup is described, including the software and the validation of the setup.
The Essential Parts
To build an automated setup, hardware and software development should be integrated. In Figure 1 , a schematic overview of such a setup is shown. It includes four specific areas: the gas makeup (A), the reactor area (B), the detection (C), and the software controlling the setup (D). Each of these areas will be discussed separately in the following paragraphs.
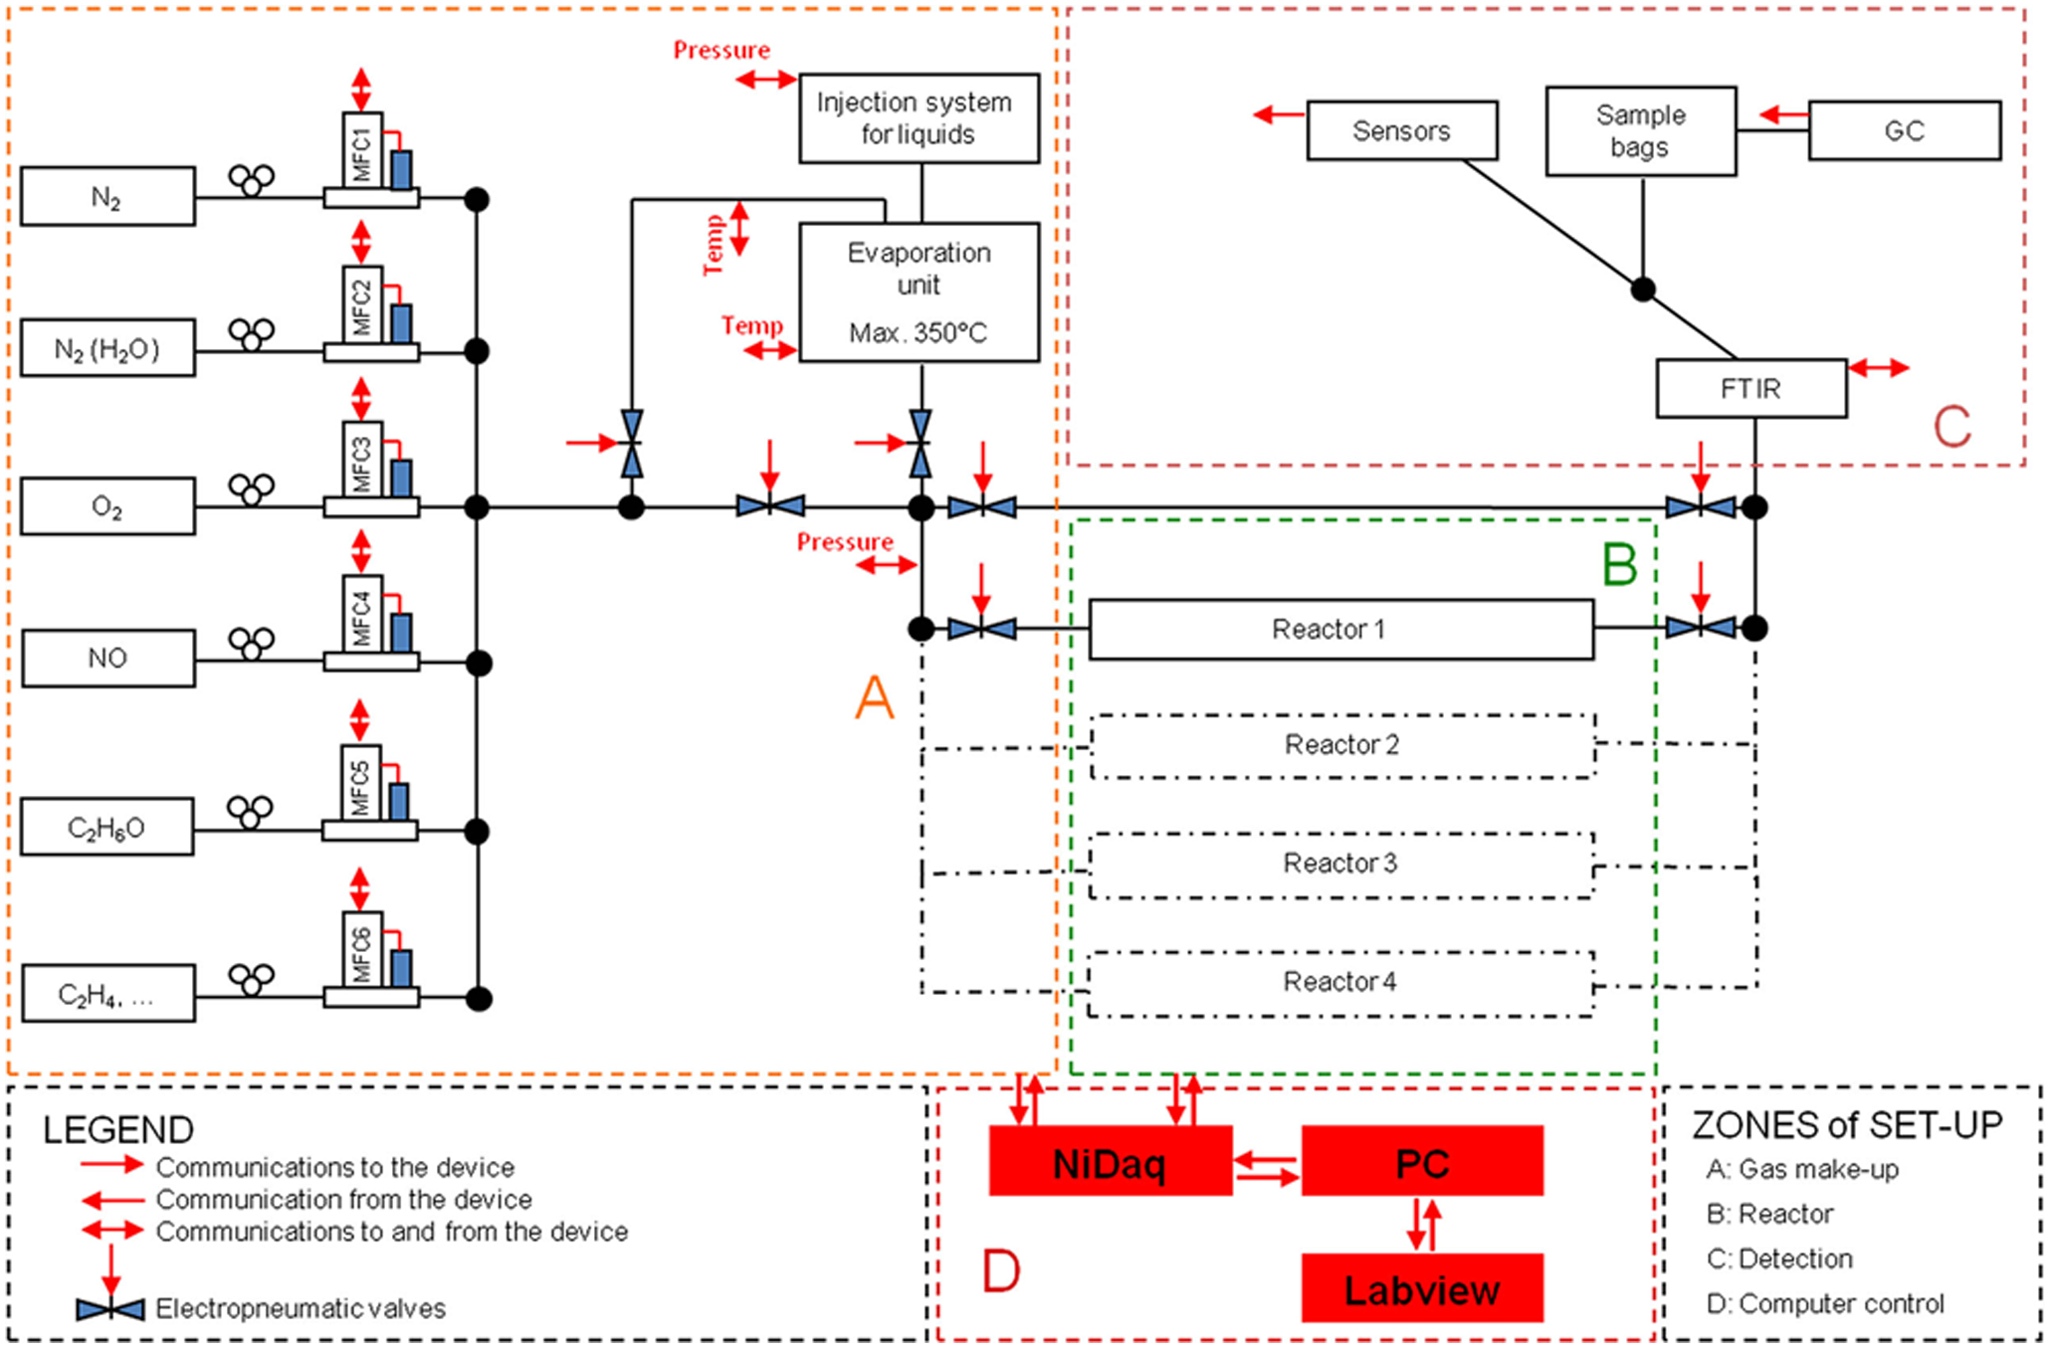
Schematic overview of the setup with the communication between the different components and the software. Gas makeup (A), the reactor area (B), the detection (C), and the software controlling the setup (D).
Gas Makeup
To perform catalytic experiments with gases, the control of the different flows needs to be accurate. Mass flow controllers (MFCs; MKS, Andover, MA and Brooks, Hatfield, PA) offer the best alternative to achieve this. An MFC is gas dependent and has variable flow ranges. To control the MFC and thus the gas flow, the input and output of the controllers are connected to the hardware control unit using a RS-232 15-pin cable. This cable allows communication over different channels with the corresponding hardware modules. These signals are then used in the software described later.
A maximum number of possibilities to control the pollutants and their flows must be achieved. There are therefore three MFCs reserved for the basic air components: O2 and a double N2 flow. The implementation of a double N2 flow makes it possible to obtain a specified relative humidity when the second N2 flows through a temperature-controlled gas wash bottle. In addition to the three basic controllers, the pollutants should be added by using other MFCs placed parallel to the existing three. This can be either in the gaseous phase, which only requires a correctly installed MFC, or in the liquid phase, by evaporating small droplets. This is achieved by injecting the pollutant in a temperature-controlled evaporation unit that contains a high-pressure syringe pump (Isco, Lincoln, NE).
This way, a wide range of pollutants (e.g., NOx or volatile organic compounds [methane, ethylene, acetaldehyde]) can be tested. Even molecules that are liquid at room temperature (e.g., hexane) or mixtures of pollutants can be applied.
Reactor Area
The reactor area is modular and versatile in use. Different types of reactors can be used, ranging from small concentric reactors over plane reactors with illumination on top to innovative experimental reactors. This modular approach allows testing almost every reactor and catalyst and thus covers a completely new field of research in a simple and fast way.
Besides the possibility of switching to different types of reactors, it is also possible to bypass the reactor area to obtain a gas phase reference level of initial pollutant concentrations in the gas phase. Automated valves, driven by relays, control the gas flow.
Detection
The setup is built to run continuously and in real time. The detection may not be the limiting factor, and thus this needs to be a system that delivers results as accurately, realistically, and fast as possible. Online and real-time monitoring has proven to be the biggest challenge. Gas chromatography (GC) is common practice for the detection of organic carbon molecules, but the measurement speed is rather low. Even fast GC still takes several minutes for one measurement, whereas classic GCs take even longer, up to 1 h depending on the conditions. In situ measurements with GC are not an option for our requirements. Other possibilities such as chemiluminescence detection or electrochemical sensors have proven to be valuable. A sensor makes it possible to measure one pollutant or even a group of pollutants accurately and in situ. The drawback of sensors is their limited sensitivity and selectivity and the cross-sensitivity for common by-products or end products in more complex gas mixtures.
Because of the lack of real-time measurements with GC and the limitations of gas sensors, the need for another detection method is indispensable. Fourier transform infrared spectroscopy (FTIR; Thermo Fisher Scientific, Waltham, MA) is selected as a valuable alternative. The infrared (IR) activity is related to dipole moment variations and shows specific absorption bands for functional groups present in all types of compounds, CO2, CO, and NOx and its by-products. Due to the distinct spectrum of each functional group, it is possible to differentiate between different gas phase compounds. By inserting a 2-m IR gas cell in the FTIR spectrometer, we obtain an IR absorption spectrum showing all IR active vibrations. During the experiments, an FTIR resolution of 1 cm−1 is used, which results in a spectrum being taken every 15 s. This gives an in situ image of the changing gas phase concentrations. For basic qualitative measurements, this technique provides nearly real-time information on gas phase conversions of all the pollutants. The main disadvantage of FTIR spectroscopy is the lack of differentiation on the level of the individual compound. FTIR spectroscopy detects IR active vibrations of functional groups, but the differentiation between different organic compounds is challenging. A qualitative indication can be used because of the C-H stretch typically present, but a more detailed analysis of the different compounds is often a problem. This disadvantage can be reduced by using chemometrics, a methodology that enables a quantitative analysis of more complex spectra based on the proper identification of a set of calibrated mixtures and the multivariate analysis of it.
Based on the advantages of FTIR spectroscopy compared to several other techniques, gas phase FTIR spectroscopy has been selected as the basic detection method for the setup. In case a more specific gas detection is needed, the use of sampling bags and a more detailed GC analysis are present as well. In addition, sensors are used to monitor reagents, end products, and by-products. This combination of detection methods provides a real-time and high-quality image of pollutant, by-products, and end products in the gaseous phase.
Computer Control
The last area of the setup is the computer control. Every signal coming from the hardware is imported into the computer using the National Instruments (Austin, TX) data acquisition hardware CompactDaQ. These modules make it possible to measure voltage and current signals as well as to send these signals to the parts of the setup. The control of the CompactDaQ is supported by dedicated LabVIEW (National Instruments) software. The LabVIEW program is used to write the software control for operating the setup and, more important, for measuring automation to acquire a whole set of repeated and reliable gas phase measurements.
Basic Control
As described earlier, the use of MFCs provides the best way to get accurate control of gas phase flow and apply different concentrations. An MFC has a limited flexibility because of its strict calibration parameters. The operation principle of an MFC is based on flow characteristics that are related to the specific heat capacity of the gas.
In our setup, one MFC is used for different pollutants, and thus the calibration parameters should be adjusted on a case-by-case basis. In Figure 2A , an overview of the control of two MFCs is shown in the front panel. By selecting the pollutant in the software, the calibration parameters of the MFC will automatically be adjusted in the calculation. The code behind this specific protocol is shown in Figure 2B . The output is a voltage signal that is guided to the CompactDaQ modules.
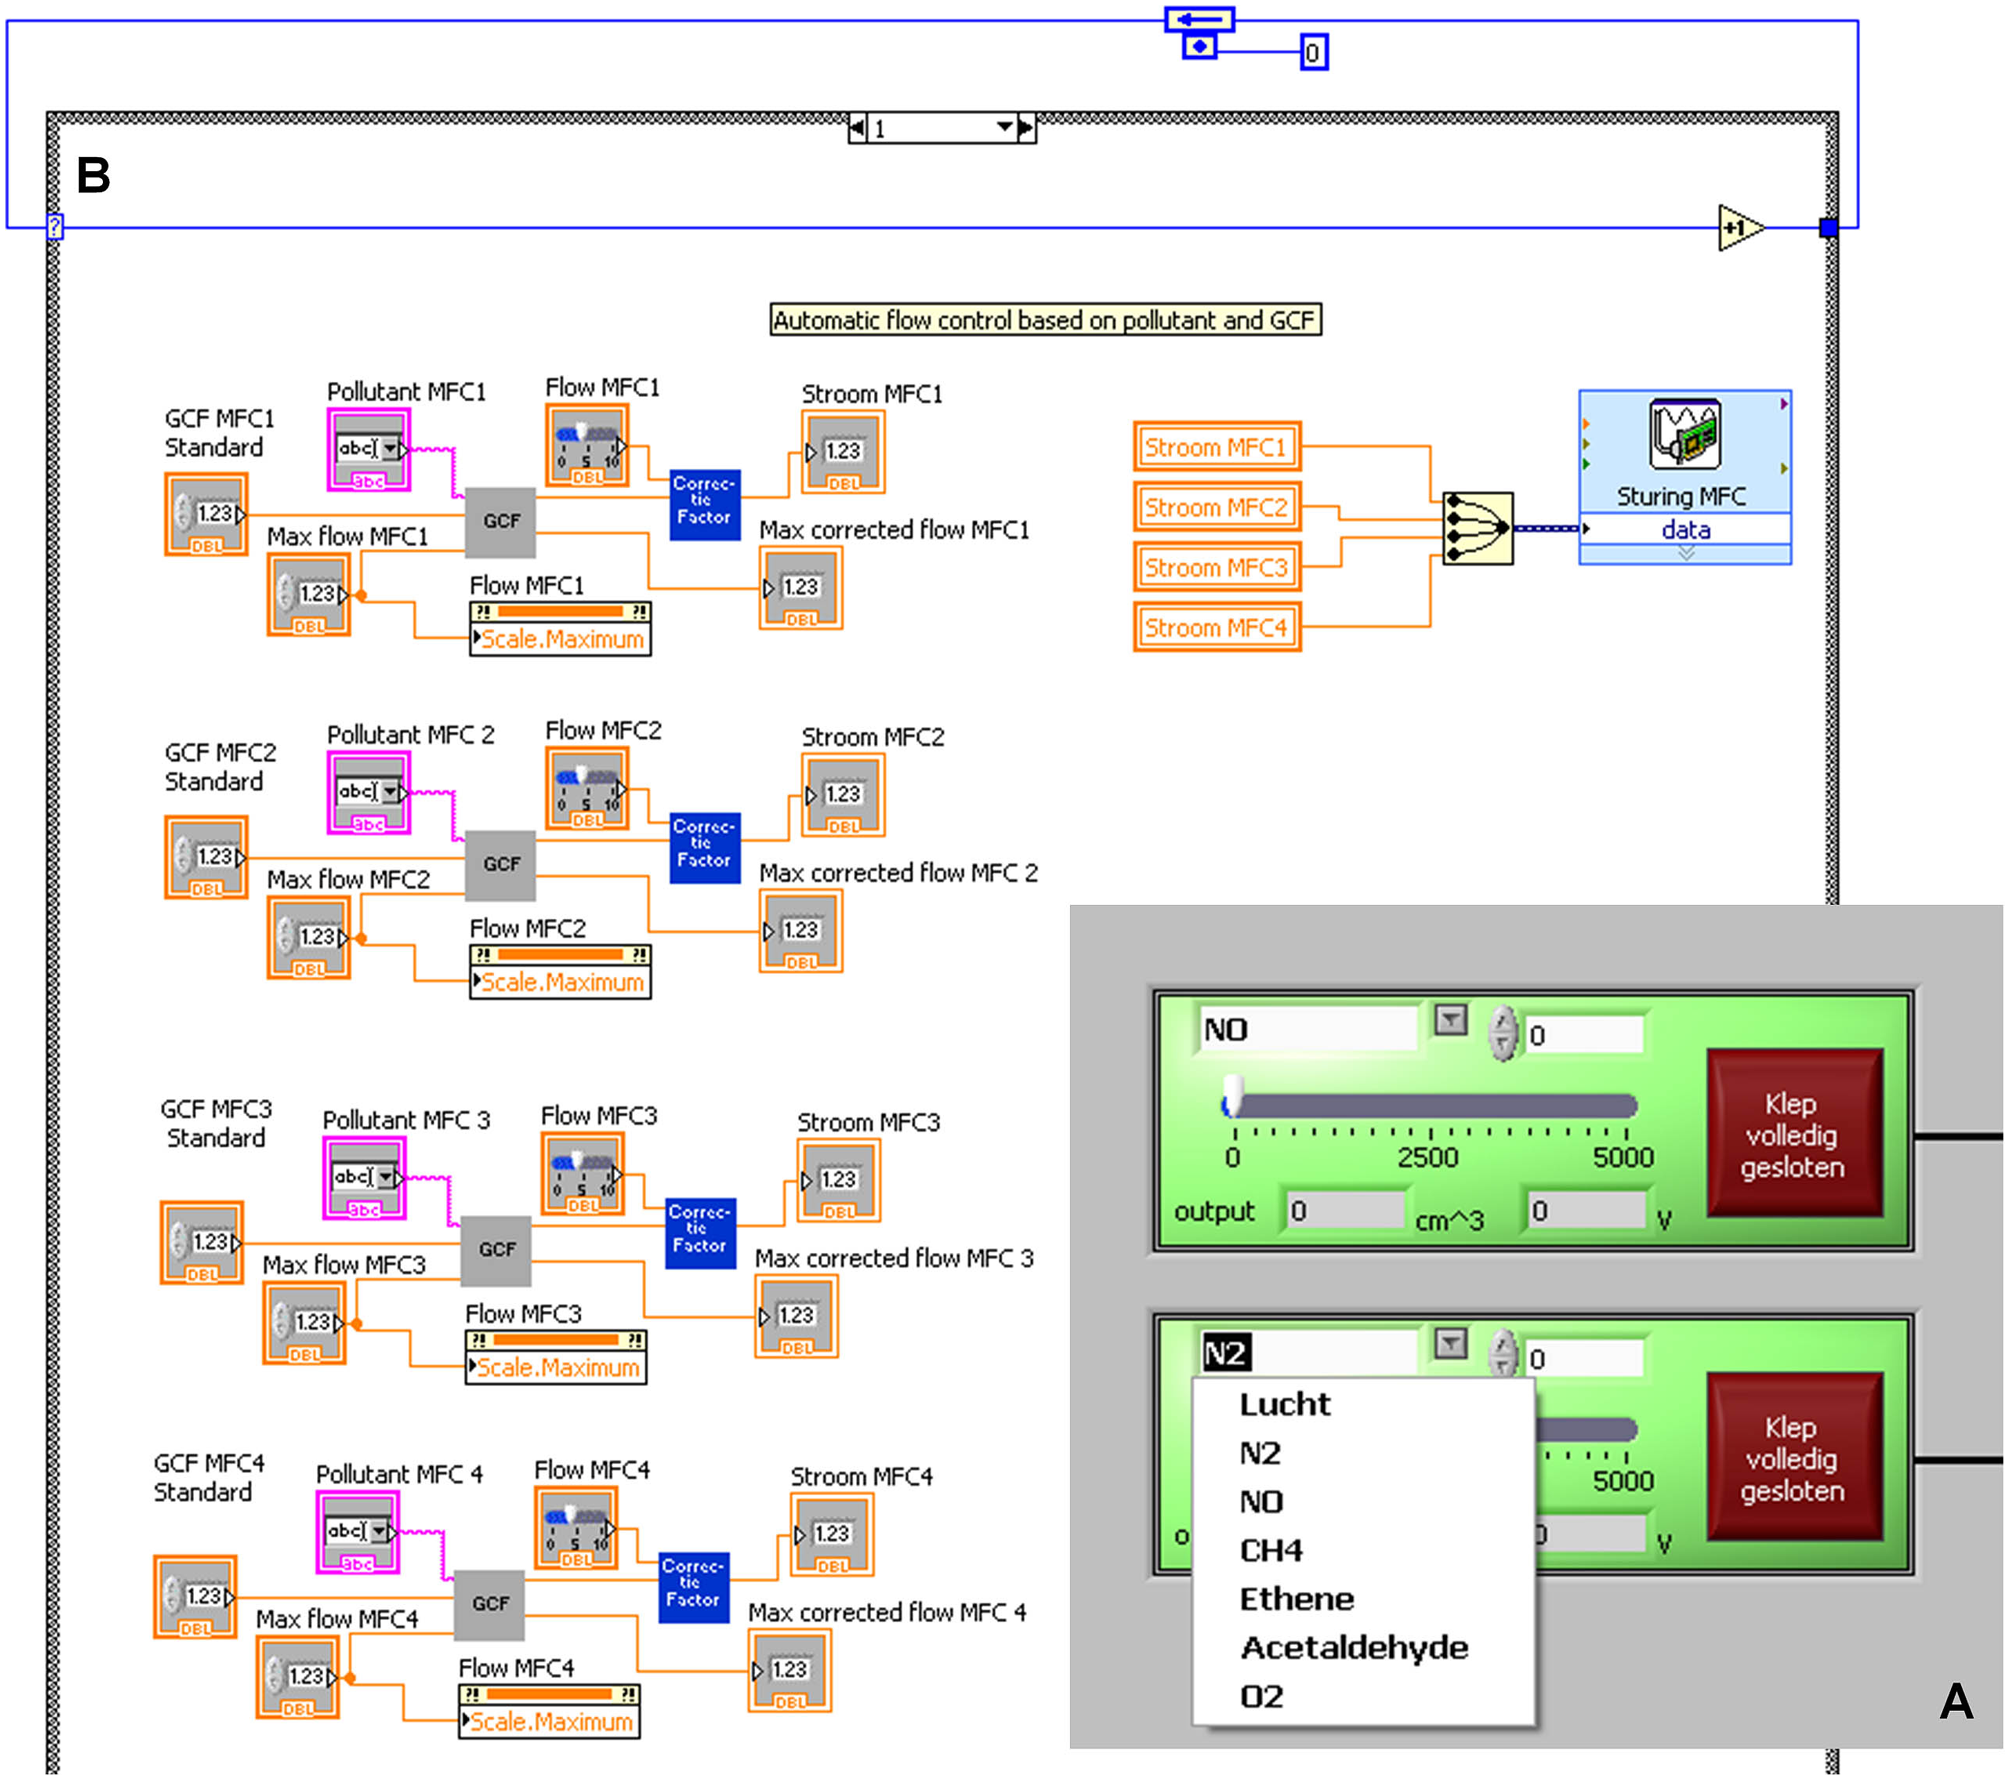
The automated system to control the mass flow controller (MFC) and its different parameters. In (A), a part of the front panel view of the MFC is shown, and in (B), the block diagram with programming code of this section is shown.
All the other parts are controlled using a Boolean signal. Manual control allows quick screening of a new set of conditions for the setup. But to preform experiments in an easy and repeatable way, further automatization is needed. Part of the program was rewritten to allow loading of a protocol made in a subprogram. An example of the protocol is given in Table 1 . The length of these protocols is unlimited and is chosen in relation to the goal of the experiment conducted.
An Example of a Standard Protocol as It Is Programmed
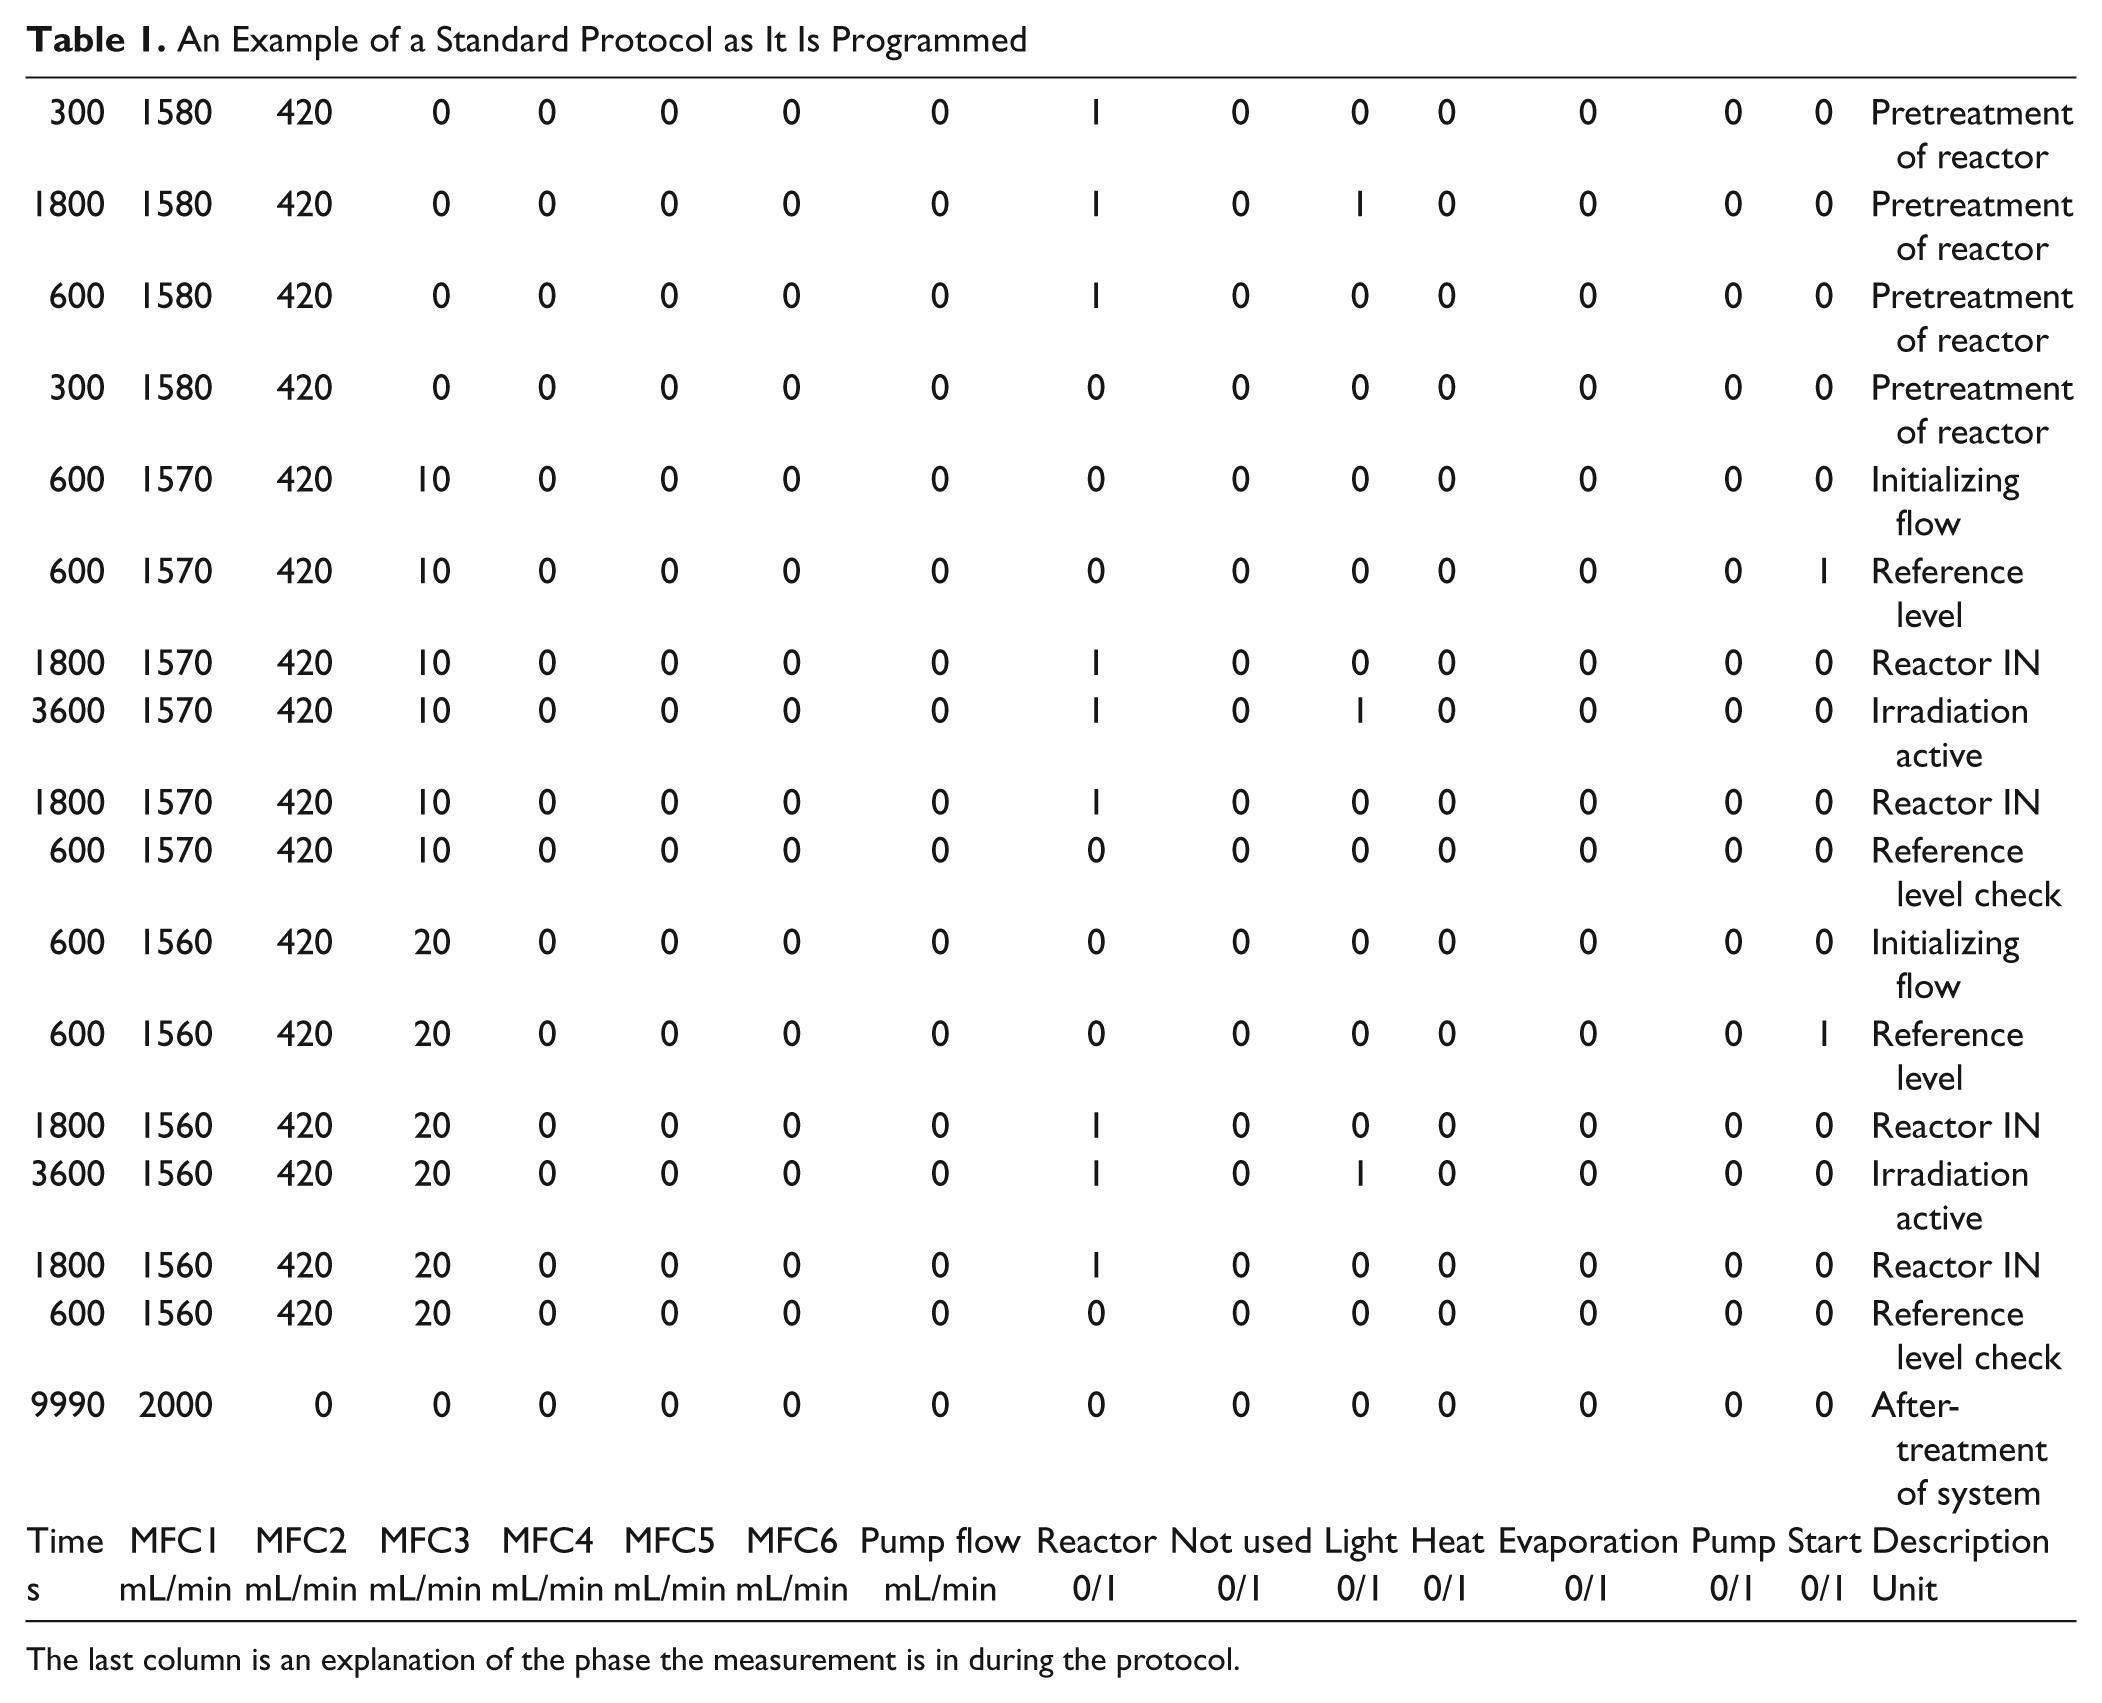
The last column is an explanation of the phase the measurement is in during the protocol.
After writing the protocol and importing it into the program, where a validation scheme is present, an adaptation is required to take over control of the manual program. When importing the file, it will be processed as an array. Every line contains one step of the protocol. In the program, the first line of the array is selected. The first column gives the length of the step in the program. When this time has expired, the next line of the array is read. The following columns contain all the information needed to control the gas flow. Thereafter, the columns consist of different Boolean values to drive the different relays. These relays are used to control the valves, the illumination, and the pump. Other applications using a relay can be easily integrated in this system. The last column is a Boolean output corresponding to the start time, which is used for processing the data.
This coding, shown in Figure 3 , is implemented using a subvirtual instrument (better known as a sub vi). These sub vis are used to eliminate identical programming codes, resulting in a program hierarchy that functions faster and improves the efficiency of the software.
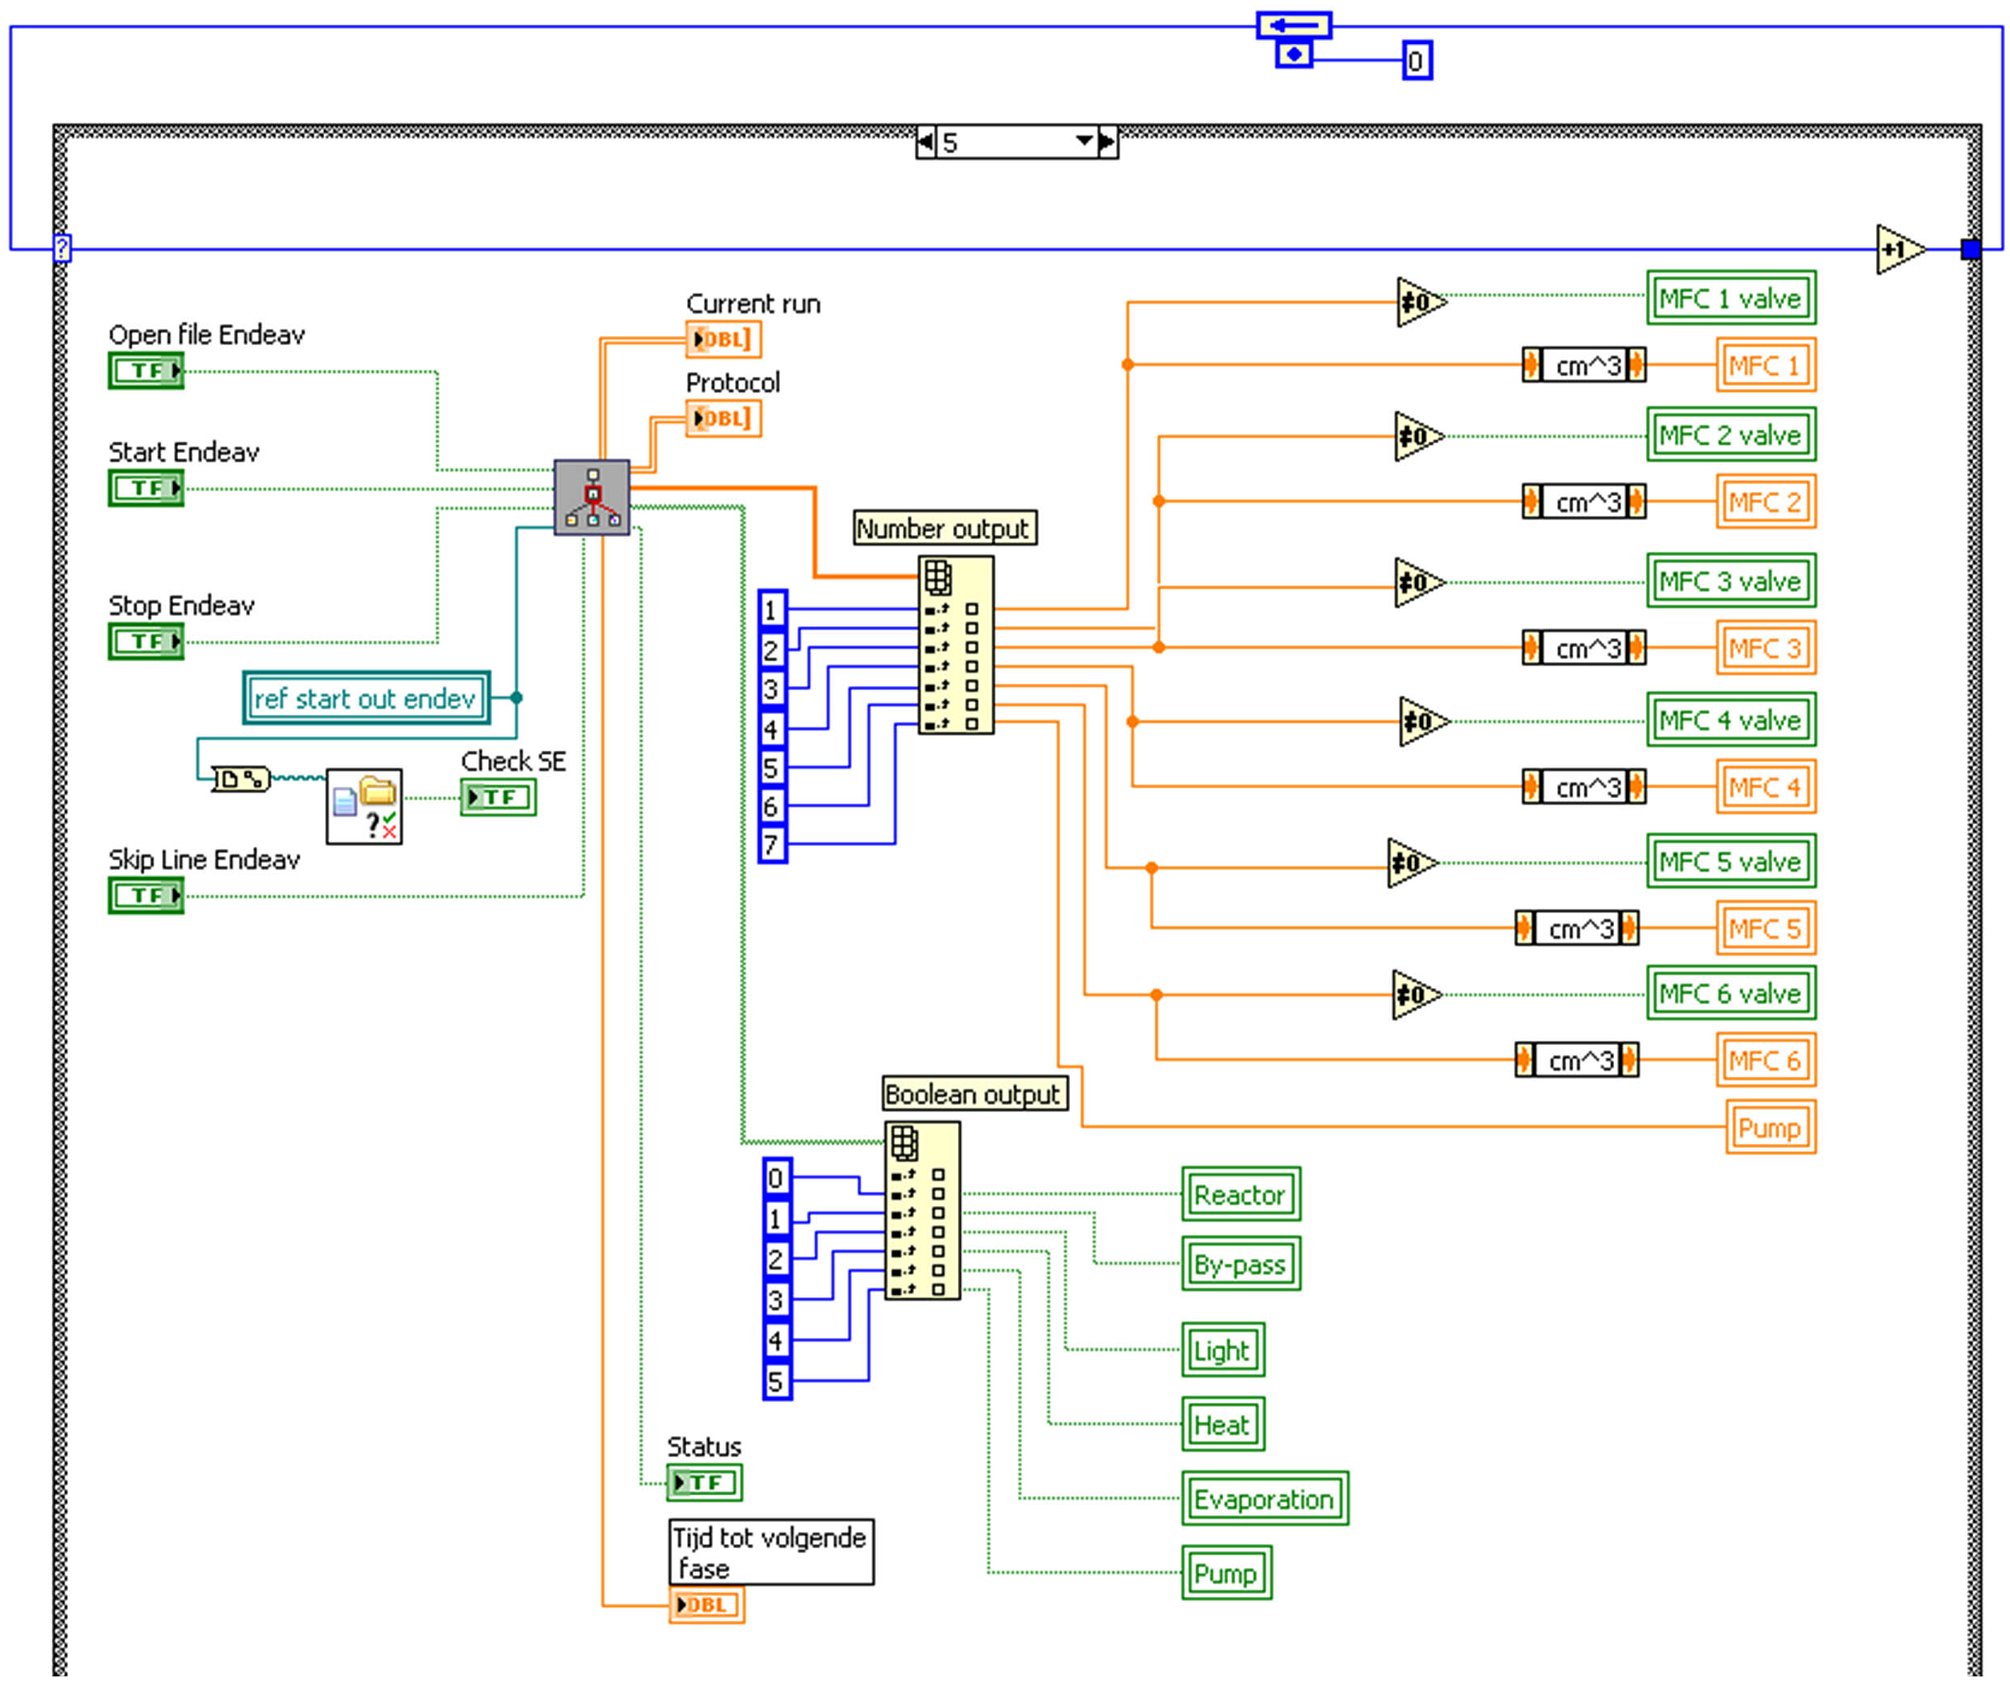
The LabVIEW code controlling the automated functioning of the setup. The sub vi is present in the upper left and indicated by the hierarchy logo.
All setup parameters are logged in a file, as well as the data of the sensors. This file can be converted to a spreadsheet, to check the sensor data and to verify the proper working of the setup.
Processing the Data
For acquiring the different spectra with the FTIR spectrometer, it is necessary to use a macro using the Macros/Basic software (Thermo Fisher). This allows us to obtain the IR bands’ height every 15 s. In Table 2 , an overview of the monitored bands and their corresponding gas phase species is given. After each measurement, a manual check is performed to ensure that no new bands occur, and if so, their specific wave number is added to the macro and included in the data processing. For the moment, a rather complete set of parameters is monitored. All data are saved in a text file, which can be analyzed in any program such as Microsoft Excel. Because of the rather large data sets gathered this way (more than 10 000 lines, consisting of several dozen data points each, is not exceptional), this method is time-consuming. To counter this problem, a second standalone program was developed to read the data and to analyze them in more detail.
An Overview of the Different Pollutants, the Band Type, the Baseline, and the Exact Location Where They Are Monitored in a Fourier Transform Infrared Spectroscopy Spectrum
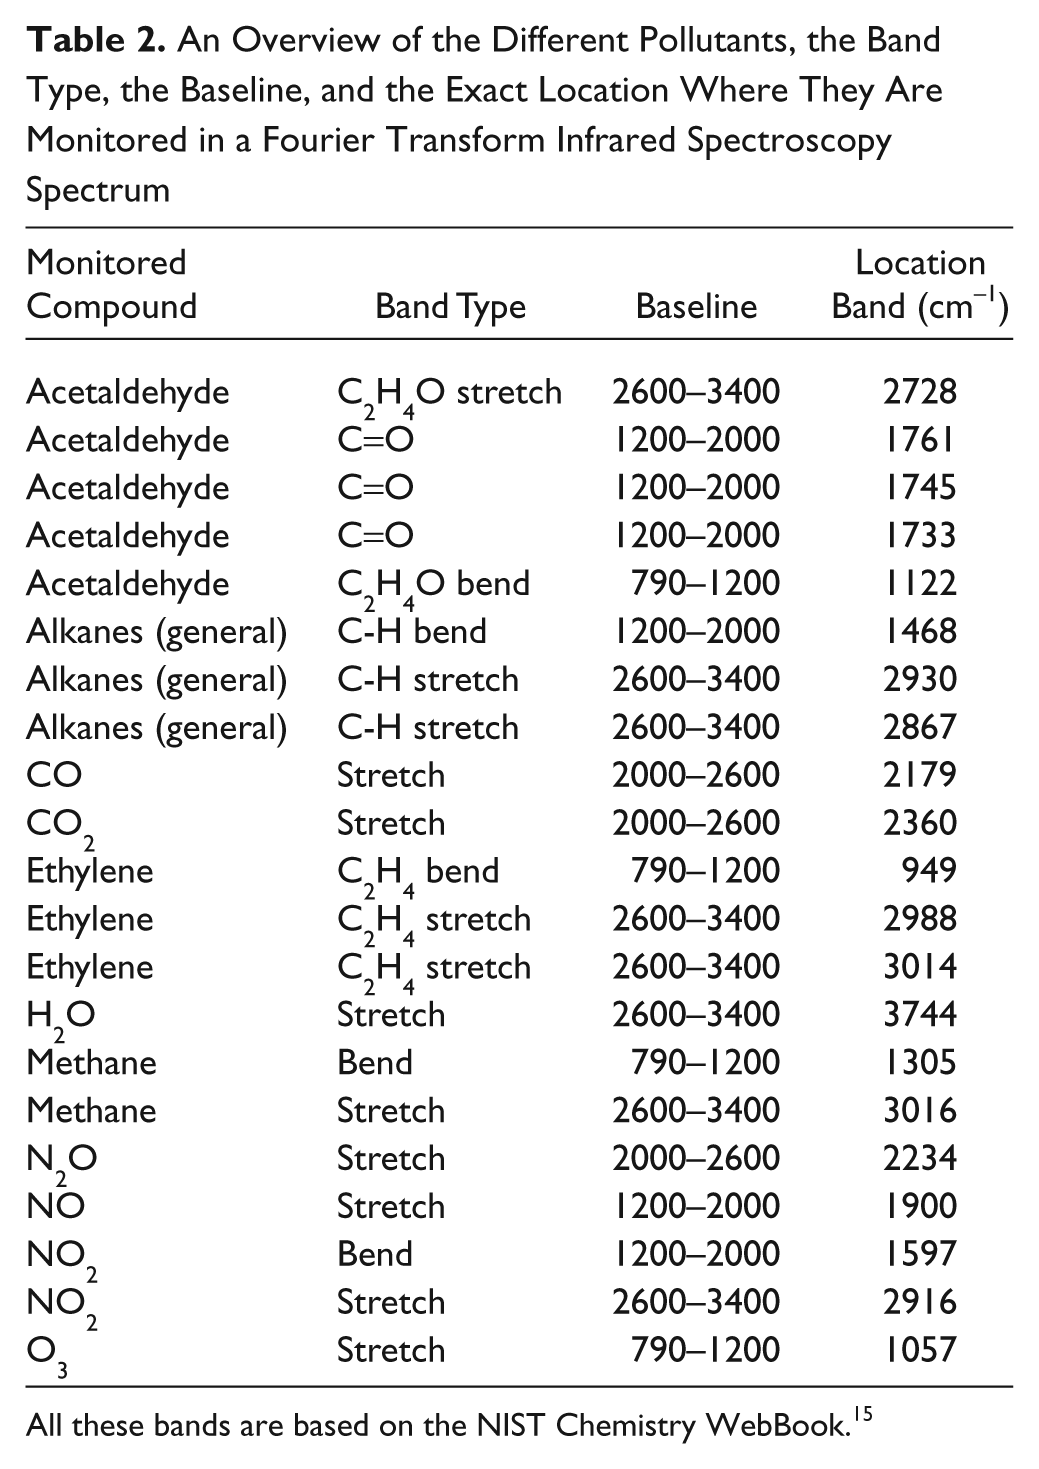
All these bands are based on the NIST Chemistry WebBook. 15
After the analysis, an overlay figure can be obtained, as shown in Figure 4 . From a drop-down box of all the logged bands, the most interesting ones can be selected and shown on the graph. The data of the selected graphs can then be exported to a text file or to a Microsoft Excel file for further data processing. In these files, only the required data are present, making it possible to calculate other information such as degradation efficiency or to observe adsorption and desorption profiles.
The front panel of the software to import, analyze, and export the required data from a data set containing more than 100 000 numbers. The resulting data of an experiment for acetaldehyde degradation are shown in this particular case.
Validating This New Approach
Experimental Setup
For the validation of the setup, two liquid pollutants, n-octane (Merck, Darmstadt, Germany) and oil (commercially available), were selected. Using the described features of the setup, different concentrations and humidity levels were tested. Afterwards, the data were processed as described before.
The used reactor was constructed with an UV lamp (Sadechaf, Turnhout, Belgium), 15 mm in diameter, with peak intensity at 254 nm and 20 W power, which was placed longitudinally inside the reactor tube. The tube, 22 mm in diameter and 400 mm long, consists of borosilicate glass. Both ends were sealed with butyl rubbers and a dedicated closing mechanism. The reactor temperature was adjusted by heating tape wrapped around the reactor and monitored by a K-type thermocouple placed inside the reactor. The temperature was kept 10 °C above the evaporation temperature of the liquid pollutant.
All the measurements were conducted with a 2-L flow, consisting of 79% N2 and 21% O2. A fraction of the 2 L was sent through a gas wash bottle to introduce a certain amount of H2O in the gas flow.
As catalyst, Aerolyst 7710 (Evonik, Hanau-Wolfgang, Germany), a commercially available material based on Evonik Aeroxide (formerly Degussa P25), was chosen. This material was manufactured by an extrusion process and shaped into small cylindrical pellets with a narrow pore distribution (no micropores) and a high pore volume. No pretreatment of the catalyst was performed before placing it in the reactor.
Next to the catalyst, glass beads (Merck, Darmstadt, Germany) with a diameter of 2 mm were used as reference material to study photolysis.
Results and Discussion
A photocatalytic degradation experiment containing five different phases is shown in Figure 5 . The reference level is determined in bypass (I and V), and the effect of adsorption is measured by connecting the reactor (II). Degradation of the pollutant occurs when the irradiation is on (III), and the effect of the irradiation on the adsorption capacity of the catalyst is determined in phase IV. The effects occurring during these different phases can be observed due to the real-time monitoring of the gas flow with FTIR spectroscopy. With the insights obtained in the different experimental phases, it is possible to interact with the process, which is essential in further application development.
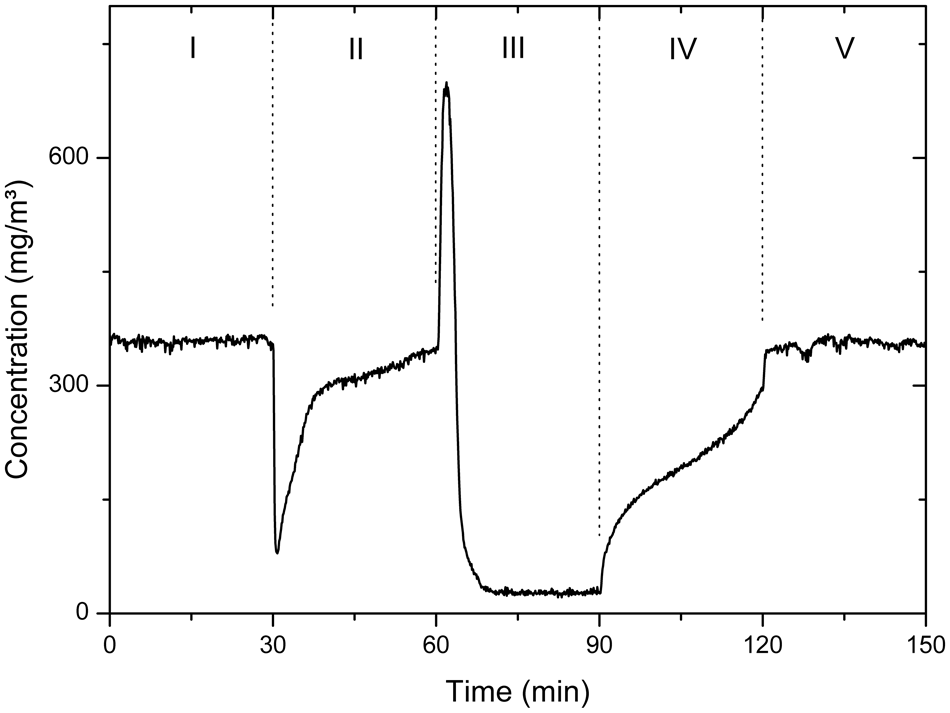
Protocol of the measurements with five different phases: bypass (I and V), reactor for adsorption (II and IV), and irradiation (III).
The peak present at the beginning of phase III can be related to the temperature rise of the UV source at the beginning of the irradiation period, which influences the adsorption of the pollutant on the surface. Such effects cannot be detected with common gas phase photocatalytic experiments using only sensors or GC. This confirms the strength of our setup, guaranteeing an increased data handling speed without loss of crucial information.
Oil is a possible environmental and human detrimental compound when present in air. With our setup, it was possible to investigate its photocatalytic degradation by injecting it into the gas flow. As is shown in Figure 6 , the formation of CO2 follows a specific pattern, with an increase up to a concentration of 2500 ppmV under irradiating circumstances, and then reaches a steady-state concentration after more than 20 min at a lower value. Using this setup, the CO2 peak can clearly be monitored, resulting in the visualization of its formation pattern. With more time-consuming analysis techniques, it could be partially or completely overlooked.
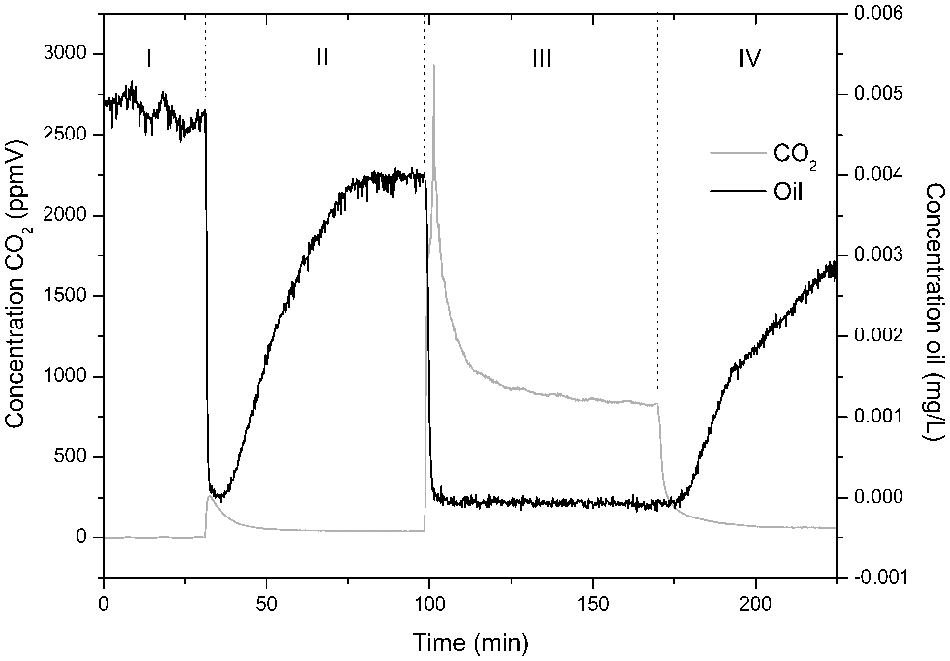
Oil measurement of 0.005 mg/L oil with 21% O2 and 25% H2O.
An explanation of this concentration peak can be the adsorption of the oil on the surface, as can be seen in phase II, resulting in a much higher oil concentration on the surface, which is degraded when irradiated. Afterwards, when most adsorbed oil molecules are degraded, a steady state is achieved between the degraded oil and the formed CO2. At the same time, it is shown that 5 µg/L oil, present at the beginning, is completely degraded. Also, the slope of the adsorption before and after irradiation is different. This indicates a different composition of the surface of the catalyst. By using specialized instruments, further insights can be obtained for this different behavior. 13
The automated setup makes it possible to repeat the experiment several times, resulting in several time-identical measurements in varying reaction conditions. A complete set of experiments is obtained that can be analyzed toward the degradation potential for all the concentrations and conditions. In Figure 7 , the data are shown for the liquid pollutant n-octane for five concentrations and two relative humidity contents. Under UV light, irradiation photolysis, the spontaneous degradation of the molecule without a catalyst, can occur. To compare the results, it is crucial to know how much of the pollutant will degrade without the presence of catalyst, and for this, a reactor is completely filled with glass beads. These three types of experiments resulted in 15 different tests that could be repeated with limited additional resources.
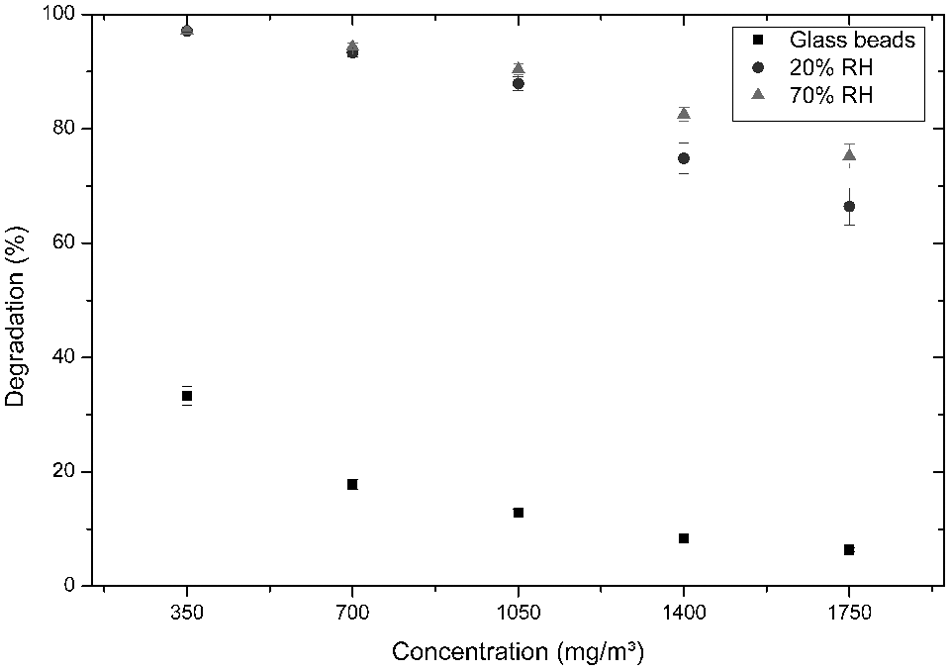
The degradation rate of n-octane under different conditions. The black squares (■) show the photolysis effect when the reactor is loaded with inert glass beads. In case the reactor is loaded with TiO2, two different humidity concentrations are tested: The dark gray bullets (•) show the results at 20% relative humidity (RH) content, and the light gray triangles (▲) are the results for 70% RH content.
This type of experiment illustrates that the degradation potential of the catalyst is dependent on the humidity as well as on the pollutant concentration.
The influence of humidity can be explained by the photocatalytic reaction mechanism that is based on the formation of *OH radicals to degrade the n-octane molecules. The addition of more H2O will likely result in more molecules that can react with the active sites of the catalyst and thus result in a higher surface coverage of *OH radicals. 14
Next to the humidity effect, the results confirm that the concentration has an influence on the degradation potential of the material. There is a nonlinear decrease in degradation with increasing pollutant concentration. This basic idea behind the setup makes it possible to repeat and verify the use of catalysts in a wide range of conditions, giving new input to the field and with the ease of not repeating every measurement manually but letting the computer control dozens of experiments, thus limiting the effect of changing boundary conditions.
Conclusion
The hardware of the catalytic test setup has proven to be of great value, as shown during the validation of the setup with experimental data. These data illustrate that several effects would not be observed without the use of FTIR detection. The repeatability opens a route to high-throughput testing of catalysts. Continuous improvement will be made to the software based on knowledge and experience gathered. The next step will be the implementation of key performance indicators for the catalyst derived from the analyzed data.
The future of the setup will make it possible to test the new synthesized materials and create the knowledge necessary to implement photocatalysis in a wide range of future applications.
This way, a fast, reliable, reproducible, accurate, and realistic methodology for high-throughput testing of (photo)catalysts is proposed.
Footnotes
Acknowledgements
Evonik contributed by delivering the materials used in the experiments.
The authors declared no potential conflicts of interest with respect to the research, authorship, and/or publication of this article.
The authors disclosed receipt of the following financial support for the research and/or authorship of this article: This work was supported by a Ph.D. grant (T. Tytgat) funded by the Institute of Innovation by Science and Technology in Flanders (IWT) and by a Ph.D. grant (S. Verbruggen) from the Research Foundation of Flanders (FWO). Other funding was made possible by the University of Antwerp.