
Abstract
Sample preparation for DNA and RNA assays is a prime candidate for laboratory automation. A novel, parallel processing device that performs the three separate liquid-handling functions necessary for such sample preparation—dispensing, pipetting, and pressurizing—is presented. The device comprises an array of fine nozzles connected by fluidic channels to automatically and precisely distribute flow between one source and an array of points. The design principles, as well as the experimental and computational methods used to develop the device, are described. Test results, including accuracy, uniformity, volume range, and timing, are presented. The functionality of the device is demonstrated by performing a solid-phase extraction of DNA with two types of microcolumns.
Keywords
Introduction
This article presents a novel device (TriPette) that integrates three common liquid-handling tasks associated with biomolecular sample preparation. Although the device automates the preparation of many different types of biological samples, it was developed and demonstrated for the purpose of isolating nucleic acids (DNA or RNA) from cell cultures using an array of microscale columns. The manual preparation of nucleic acid samples is an ideal candidate for laboratory automation because it is a routine yet time-consuming task that often creates a bottleneck and slows down the drug discovery and diagnostics research process. Because both the upstream and downstream processes are all faster and more highly automated, the overall throughput is restricted by the sample preparation task. The motivation for increasing throughput, along with the fact that sample preparation protocols are fairly standardized and widely used in most research involving DNA or RNA, supports the need for such automation.
To characterize and validate the performance of the TriPette, DNA and RNA were extracted using both columns of Q-Sepharose resin and columns of porous polymer monolith (PPM).1–5 Both of these, and in fact most microscale column types, require the same basic liquid-handling functions: pipetting, dispensing, and pressurizing. That is, samples must be transferred from certain wells to other wells, reagents and buffers must be distributed from a common source into a number of wells, and solution must be pressurized through columns.
Typically, automated pipetting is done with multichannel pipettor heads. For smaller volumes, syringe-based pipettors use a liquid-filled syringe in place of a pipettor’s air-filled plunger, which improves accuracy. Both styles work but are mechanically complex. Furthermore, they are reaching the practical density limit. Alternative approaches apply a vacuum across a calibrated flow resistance, drawing liquid into a tip6,7 such as the SciClone from Caliper Life Sciences (Hopkinton, MA) and the Quadra Nano from TomTec (Hamden, CT). Acoustic Droplet Injection 8 is another technique in which an acoustic pulse launches a droplet from one plate to another without any mechanical contact.
Dispensing is typically done with a multihead dispenser, which requires stepping with an x/y motion system to populate a microtiter plate from one common source. Automated dispensers may use syringe pumps to meter out controlled volumes of liquid, 9 or they may use a timed flow of pressurized liquid. There have been many recent innovations in pipetting and dispensing to improve accuracy and throughput.8,10,11 However, much of the progress is focused on handling very small (<1 µL) volumes. This tends to have limited application.
Applying air pressure to force liquid through a column is a common technique to improve throughput. This is usually performed with either a pressure dome or a vacuum manifold.12,13 Alternatively, gravity can be used to draw a liquid through a column, but it generally is a slow process and only works for low-flow resistance columns.
The TriPette presented in this article ( Fig. 1a ) integrates pipetting, dispensing, and pressurizing tasks into one compact novel device. In brief, the pressurizing and pipetting functions are implemented by controlling the flow of air through an array of small nozzles, whereas the dispensing function supplies pressurized buffer to the nozzle inputs, producing a controlled flow. This article describes the design of the device and presents the results of validation tests.
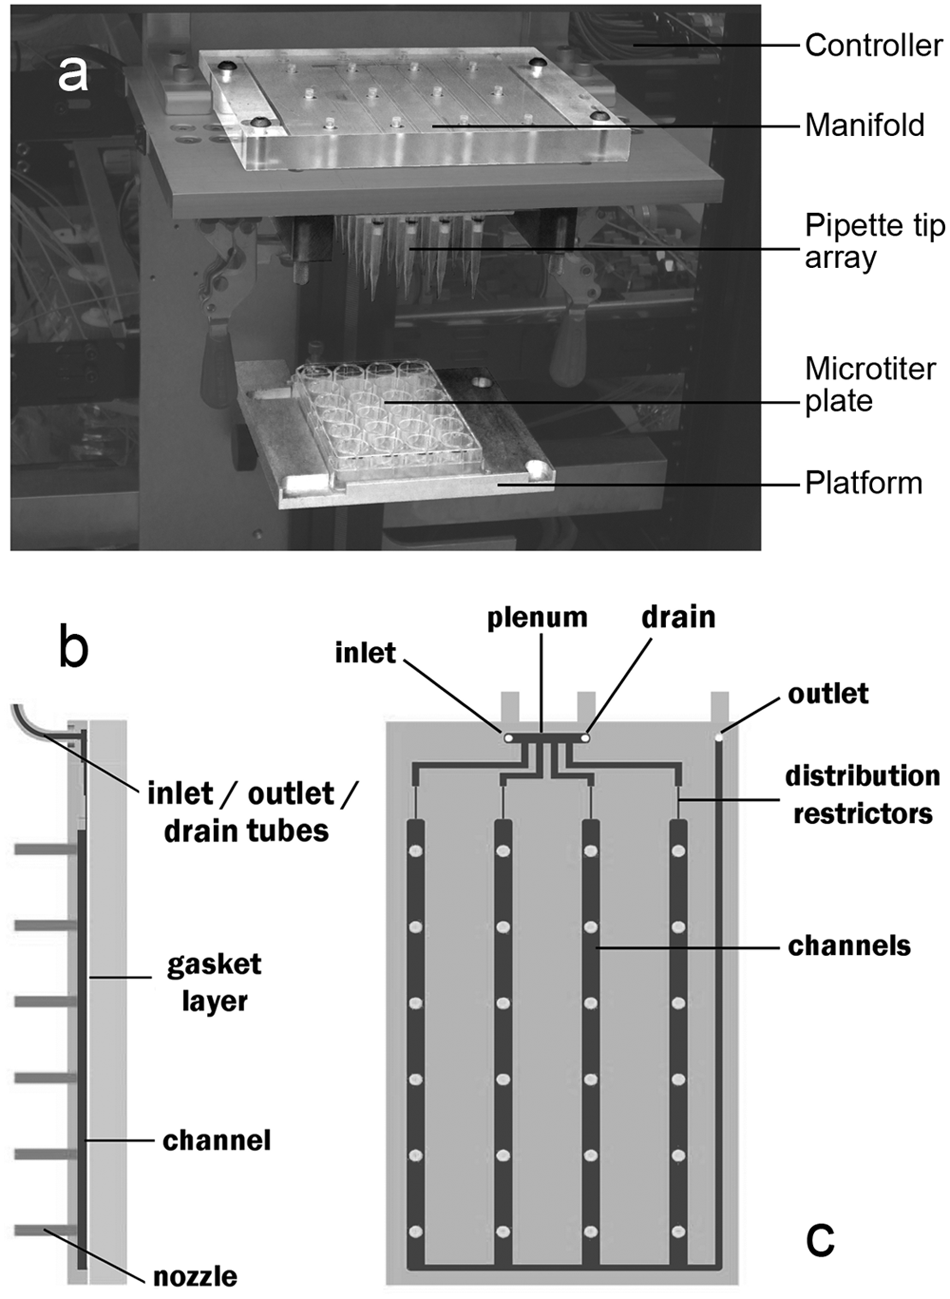
(a) TriPette system, integrated with other components to form a semi-automated instrument for nucleic acid isolation. (b) Cutaway side view of manifold. (c) Top view of manifold.
Principle of Operation
Overview
Figure 1a shows the TriPette integrated into an instrument for nucleic acid isolation. The instrument centers on a microtiter plate that sits on a platform. The manifold stands above the platform. Tubes connect the manifold to the controller, a fluidic circuit of valves, sensors, supply bottles, regulators, and other components. A host computer provides a user interface through software written in Think-N-Do (Phoenix Contact, Middletown, PA). Removable frames holding arrays of pipette tips or microscale columns can be clamped to the lower side of the manifold.
Manifold
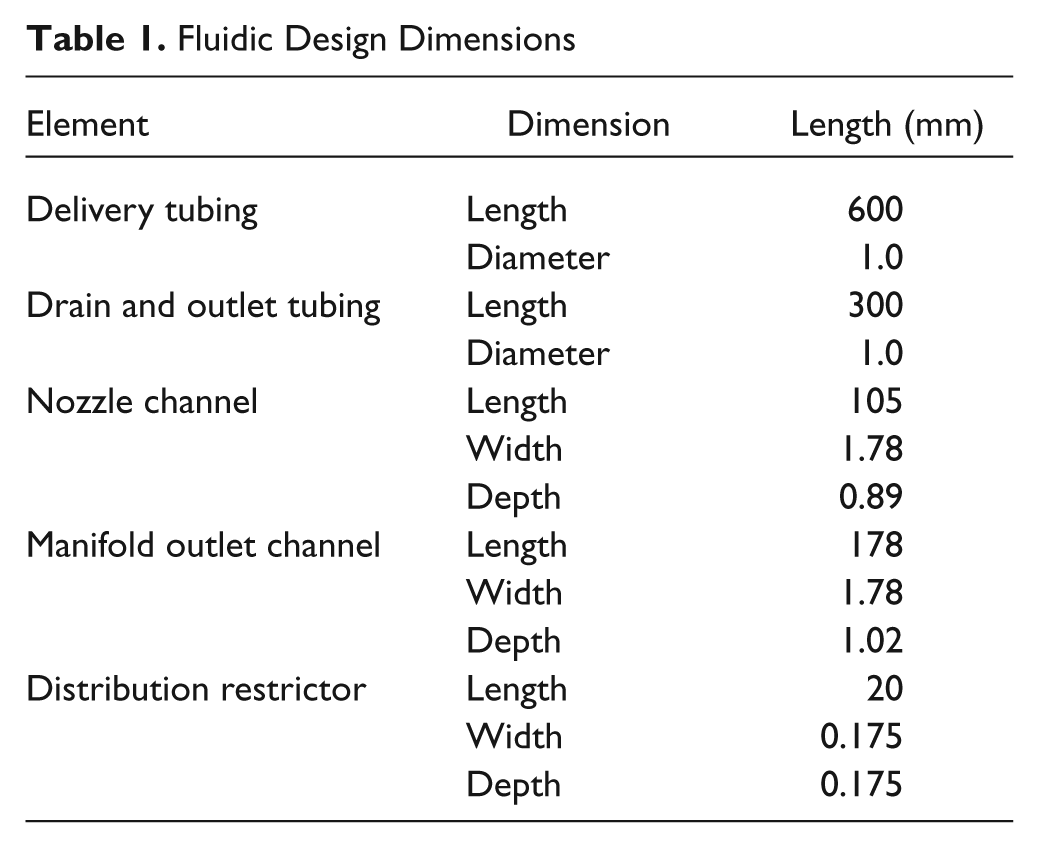
The manifold is a polycarbonate block with a grid pattern of small nozzles matching the wells of a microtiter plate ( Fig. 1b , c ). Each nozzle comprises a short piece of polyetheretherketone (PEEK) tubing with a 110-µm inner diameter. The inner ends of the nozzles connect to channels milled into the block, which are covered with a second, plain block to form enclosed fluidic channels. A silicone sheet acts as a gasket layer for a watertight seal. The channels connect to inlet, drain, and outlet ports, which connect to tubes leading to valves inside the controller. The manifold has 4 channels and 24 nozzles; however, the design can be scaled up to at least 16 channels and 384 nozzles (as described below). At the heads of the channels are distribution restrictors, sections of narrow channel (175 µm wide, 175 µm deep, and 20 mm long) that act to distribute the flow evenly across all four channels. The manifold can operate in three different modes, discussed below.
Controller
The controller ( Fig. 2 ) supplies fluids to the manifold. The buffer tank is a cylindrical polytetrafluoroethylene (PTFE) tank (19 mm ID × 61 mm deep) with a cone-shaped bottom (60-degree point angle) narrowing to an outlet. Unlike a bottle, the buffer tank can be loaded with buffers and then pressurized, producing a source of precisely pressurized liquid, air, or vacuum. Tubes (500 µm ID) protrude through the tank ceiling and provide connections to source bottles, air, vacuum, and exhaust. Each tube can be opened or closed with a valve (LVM15R3Y-5A-10; SMC of America, Noblesville, IN). The outlet of the buffer tank branches into two valved paths—one to the manifold, the other to waste.
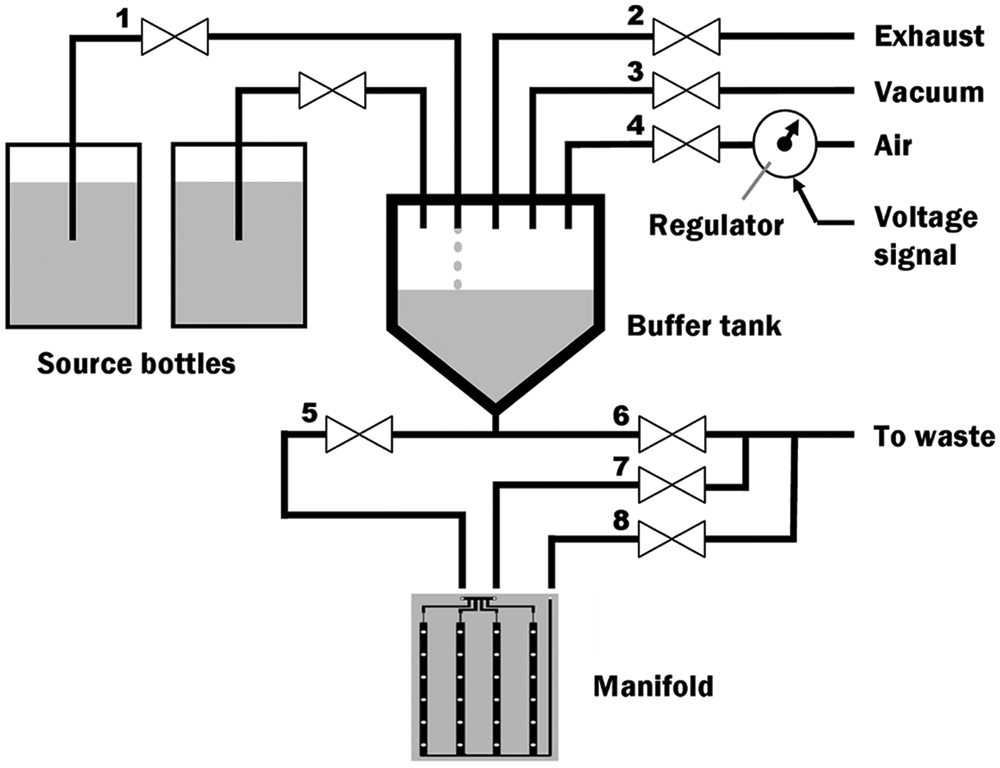
Schematic of controller. Valves (1–8) control flow of air and liquids in and out of the manifold.
Operation
Dispensing Mode
A dispensing step ( Fig. 3a ) begins by priming the manifold with buffer. First, valves 3 and 1 are opened for a timed duration, and the vacuum draws buffer from the source jar into the buffer tank at a calibrated flow rate. Next, the regulator is set to 40 kPa as valves 4, 5, and 7 are opened, and air pressure forces buffer into the plenum and the drain. Then, valve 7 is closed and valve 8 is opened, pushing buffer into the manifold channels and outlet tubing (during this step, a small amount of buffer [<1 µL] may leak through the nozzles).
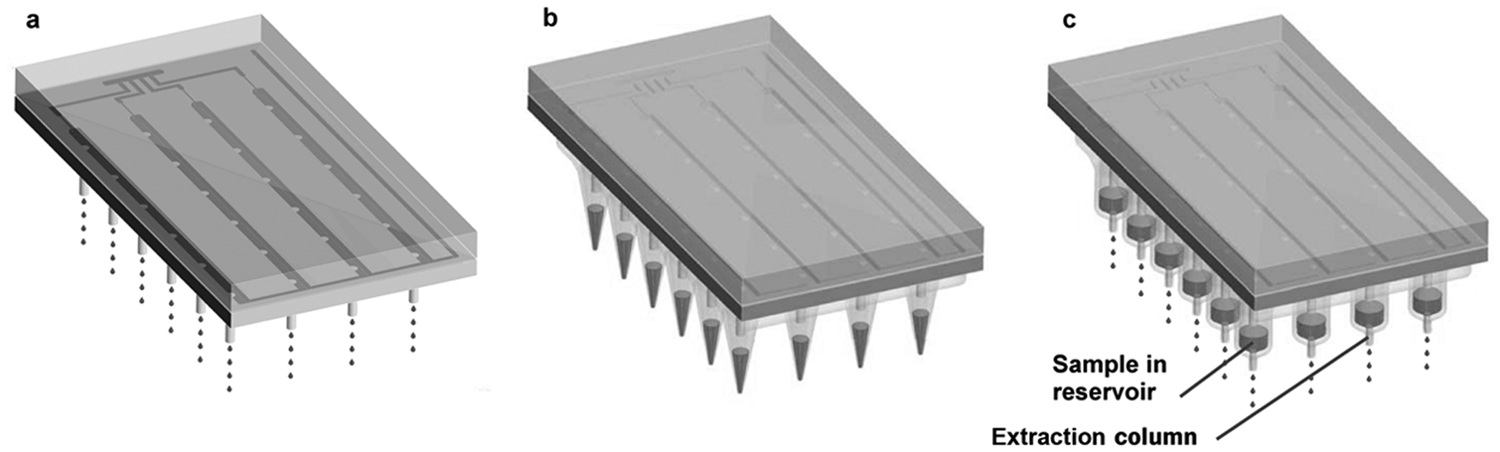
Manifold operating in three different modes. (a) In dispensing mode, manifold dispenses buffer through nozzles. (b) In pipetting mode, manifold aspirates liquid from a microtiter plate (not shown) into an array of pipette tips by means of vacuum and releases the liquid with pressurized air. (c) In pressurizing mode, manifold delivers pressurized air to an array of samples to drive the samples (or wash and elution buffers) through an array of extraction columns.
To dispense, the regulator is set to 550 kPa, and valves 4 and 5 are opened. The pressure causes buffer to jet out through the nozzles at a precisely calibrated rate. The timing of the valves determines the dispensed volume.
After dispensing, the manifold is drained of buffer. The regulator is set to 200 kPa, and valves 4 and 6 are opened, draining the buffer tank and pushing all leftover buffer to waste. Because the buffer tank is smooth, cone-shaped, and made of PTFE, it drains very efficiently, leaving little or no residue. The regulator is then set to 20 kPa as valve 6 is closed and valves 5 and 7 are opened, draining the buffer from the plenum and drain tubing. Finally, valve 7 is closed and valve 8 is opened, draining the buffer from the channels and sending it to waste. All valve openings/closures are performed automatically by the controller.
Pipetting Mode
In pipetting mode ( Fig. 3b ), the manifold mates with an array of pipette tips (Finntip 250; Thermo Fisher Scientific, Waltham, MA). In a future version of the design, the array of pipette tips could be molded as a single consumable part with an integral gasket for sealing. However, in the present version, off-the-shelf pipette tips are fixed to a grid of seats in a polycarbonate plate; on the opposite face of the plate is a grid of o-rings that mate to the face of the manifold and seal each tip around a nozzle.
The buffer tank is kept empty during pipetting. To aspirate (pipette in), the tips are dipped into a microtiter plate and valves 3 and 5 are opened. The vacuum draws air through the nozzles, drawing liquid from the microtiter plate into the pipette tip at a calibrated flow rate. To release the liquid, the regulator is set to 40 kPa and valves 4 and 5 are opened. Air flows out through the nozzles and into the pipette tips, forcing the liquid out.
Pressurizing Mode
In pressurizing mode ( Fig. 3c ), the manifold mates with an array of microscale columns topped by reservoirs. In a future version, the column housings could be molded as a single consumable part with integral reservoirs and an integral gasket for sealing. However, in the present version, the column housings are made of extruded tubing (Argos Corp, East Wareham, MA) and are held in place by a grid of one-touch pneumatic fittings (KQ2H01-33S; SMC Corp., Noblesville, IN) modified by drilling so that the columns can pass through the entire fitting. The one-touch fittings are mounted in a polycarbonate frame. A short piece of PTFE tubing fits snugly over the upper tip of the column, forming a reservoir. O-rings lie in glands around the reservoirs and seal to the face of the manifold. Similar to pipetting mode, the buffer tank is kept empty during pressurizing. Valves 4 and 5 are opened for a programmed period of time. The pressure is delivered to the reservoirs at the top of each microscale column, which forces any liquid in the reservoirs through the columns.
Detail Engineering
Jetting
To dispense small volumes accurately, the nozzles must operate in the jetting flow regime and not in the dripping flow regime14,15 (see
Jetting pressure was measured with short sections of PEEK tubing (Upchurch Scientific, Oak Harbor, WA) connected to a pressurized syringe. The length of each nozzle was measured with a pair of calipers (Mitutoyo, Kawasaki, Japan). The inner diameter of each nozzle was measured with a reticled Optiphot microscope (Nikon USA, Melville, NY). A set of six tubing sizes was tested in a matrix against three different buffers used for RNA extraction in previous studies 2 : PPM elution buffer (10 mM Tris buffer with RNAsecure RNase inhibitor reagent [Ambion, Inc., Austin, TX]), PPM wash buffer (70% ethanol, 30% water), and PPM loading buffer (0.1% Triton X-100, 10 mM Tris-HCl, 1 mM EDTA [pH 8.0], and RNAsecure). For convenience, the jetting pressure was measured (i.e., the pressure at which the transition occurred) rather than the flow rate itself (the two are nearly proportional). Figure 4 presents the results along with the nominal air supply pressure, which is limited to 690 kPa. Error bars show the range of ±1 standard deviation. For all buffers, the normalized jetting pressure decreases with increasing nozzle ID. At all pressures, the loading buffer requires the greatest pressure to jet, followed by the wash buffer, followed by the elution buffer. The nozzle ID of 110 µm was chosen based on these results, in combination with the results of the circuit model calculation (see below).
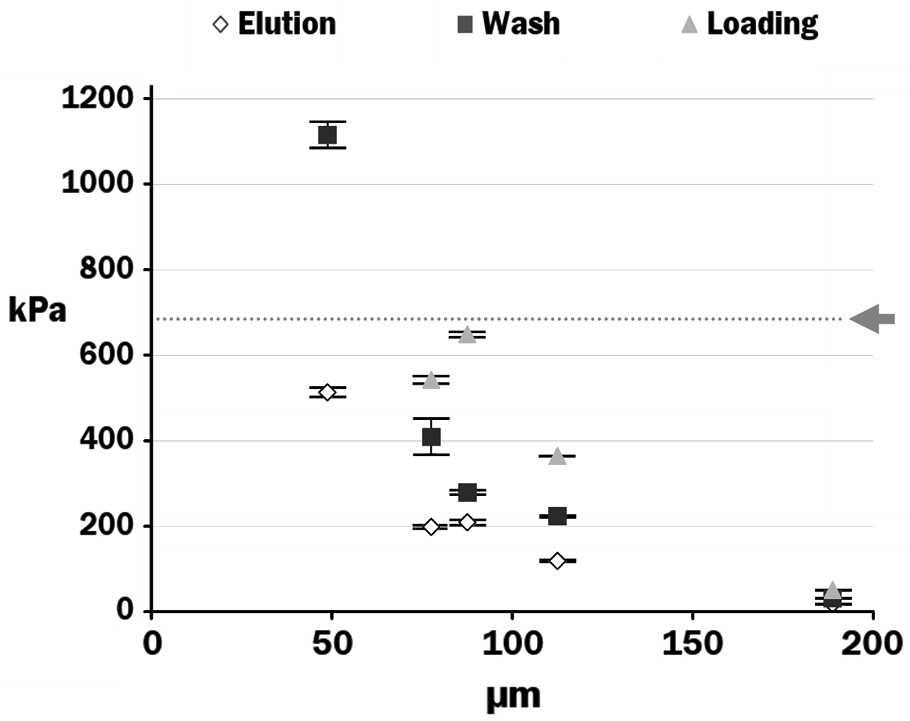
Normalized jetting pressure as a function of nozzle inner diameter for three different buffer types. Arrow and dotted line indicate laboratory air supply pressure.
Fluidic Parameter Optimization
The design of this device requires the optimization of pressures and flow rates through a branched network of tubes, channels, and valves. To analyze this fluid flow, an “electrical circuit”–type model was developed, in which the Navier-Stokes equations are reduced to much simpler lumped-parameter equations, where the fluidic components are treated analogously to components of an electrical circuit.17,18 Pressure is analogous to voltage, flow rate is analogous to current, and flow resistance is analogous to electrical resistance. For a channel of rectangular cross section, the flow rate Q, the width b, the depth d, the length L, the pressure drop Δp, and the viscosity η are approximately related by the expression 19

Rearranging this, we find the flow resistance R for a rectangular channel:

From Poiseuille’s equation, the flow resistance for a circular tube of diameter D is

These equations were used to model the fluidic components as part of an iterative optimization process, seeking a combination of flow resistances that avoided all anticipated potential problems, as described below. For viscosity, typical values of 0.89 cP for buffer and 0.017 cP for air were used. The model’s conclusions are robustly valid even if the visocosity values were to change because most of the calculations concern the ratios between different resistances; thus, a change in viscosity would apply to both resistances, and the effects would cancel out. The optimization resulted in the dimensions shown in Table 1 , which were determined to optimally satisfy all of the design requirements.
Fluidic Design Dimensions
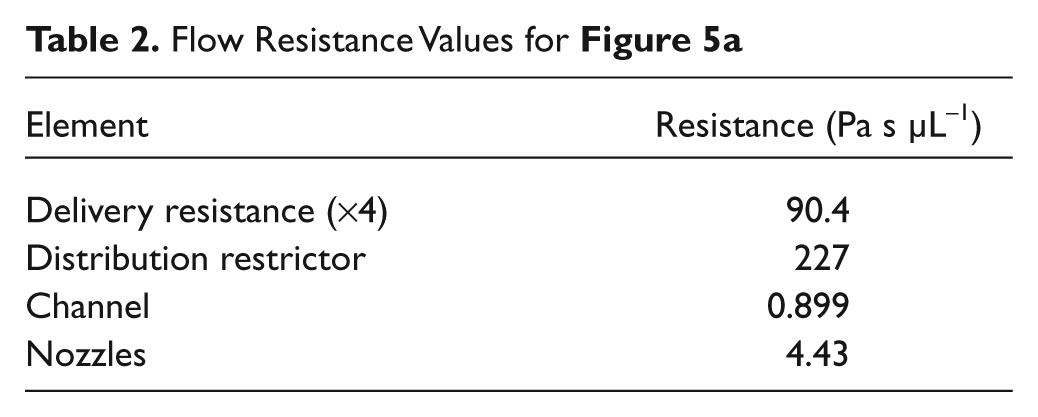
The first potential problem to be analyzed was the situation in which the delivery and distribution restrictors create such a large pressure drop that the laboratory’s compressed air supply cannot supply the minimum jetting pressure to the nozzles. This was analyzed as a circuit model ( Fig. 5a ), which included only a single channel. The optimal resistance values were found to be those shown in Table 2 . The design calculations show that for an input pressure of 690 kPa (the nominal air supply pressure), the pressure at point F is 472 kPa, which exceeds the jetting pressure for loading buffer by a safe margin of 30%.
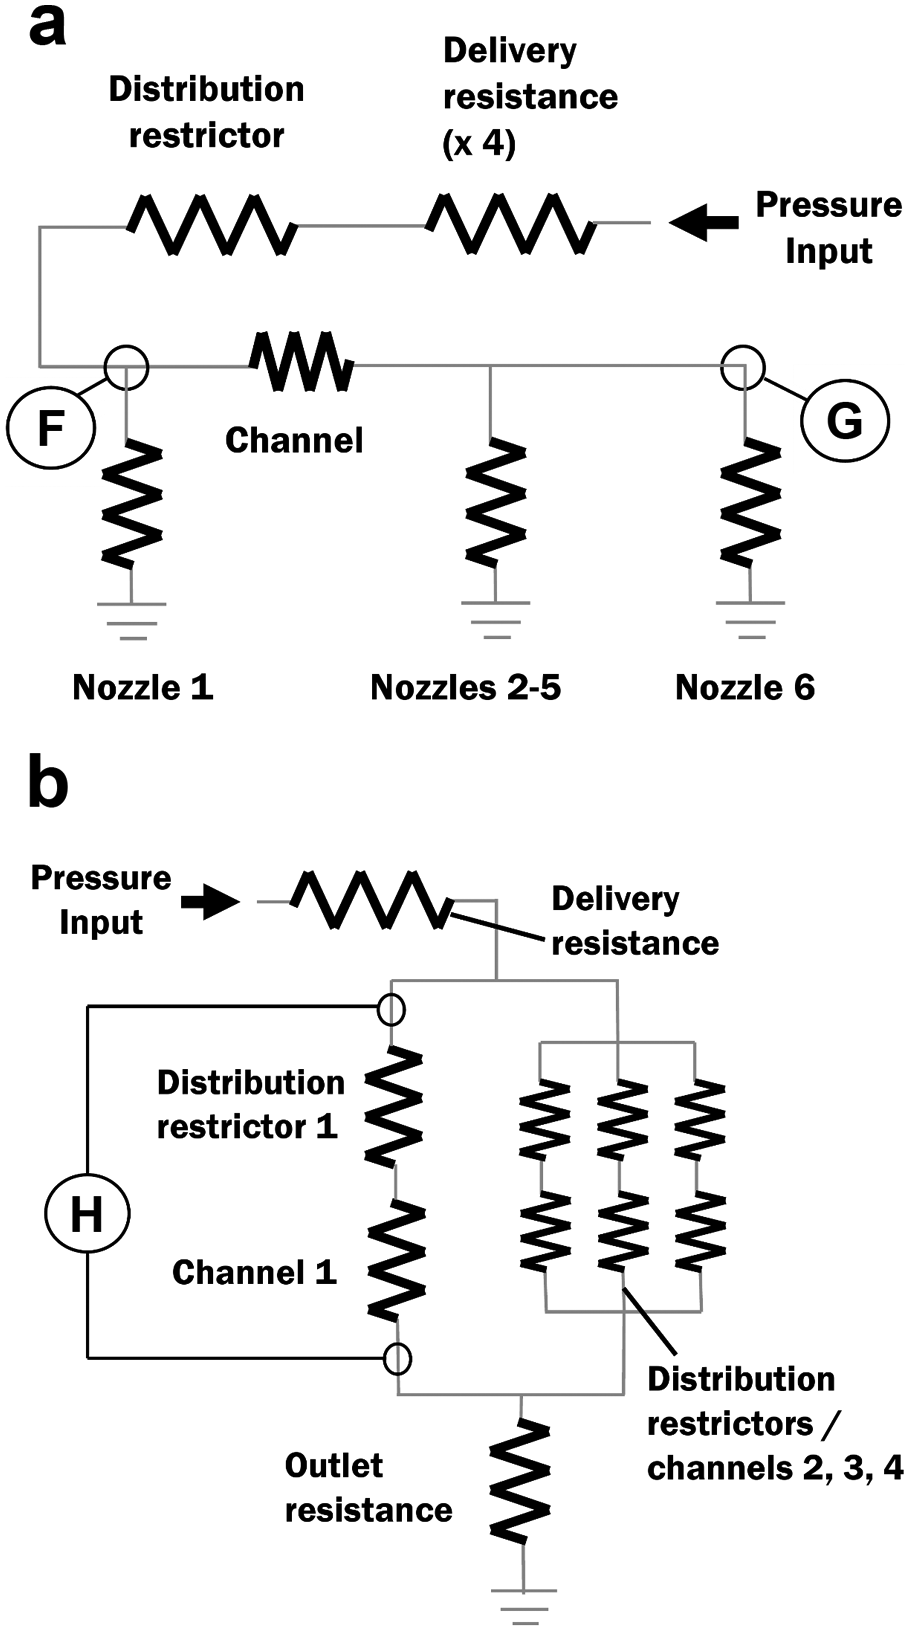
(a) Fluidic circuit modeling the pressure drops during dispensing. (b) Fluidic circuit modeling the draining of parallel channels.
Flow Resistance Values for Figure 5a
The second potential problem analyzed was that the pressure may decrease slightly over the length of the channels, causing the downstream nozzles to dispense less than the upstream nozzles. For the resistances in Table 2 , calculations predict a pressure at upstream point F (see Fig. 5a ) of 472.23 kPa and a pressure at downstream point G of 471.72 kPa, a difference of only 0.11%. Even for a hypothetical 384-nozzle manifold, meant to work with a high-density microtiter plate, the calculated variation is only 0.5%.
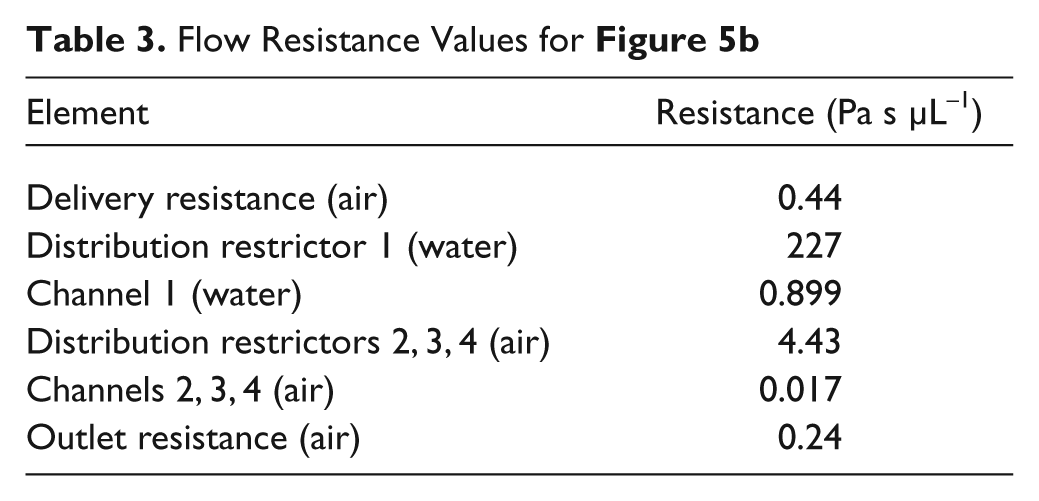
The third potential problem analyzed was that the parallel channels may be difficult to drain at low pressures. This problem, observed previously in other devices, is that some channels invariably have a slightly lower flow resistance and drain faster. The draining lowers the resistance even further, creating a shunt and causing the pressure drop across all the channels to become so low that the remaining buffer is stuck in the channels by surface tension. This problem can be avoided by using distribution restrictors, which preserve a large pressure drop across the drained channels. The model shown in Figure 5b simulates a worst-case scenario in which three channels are completely drained while one is still completely loaded. For the resistance values shown in Table 3 , the pressure drop H in this scenario is 14.4 kPa, which is large enough to overcome surface tension.
Flow Resistance Values for Figure 5b
Results
Important figures of merit for fluidic performance include dispensing accuracy, uniformity, and minimum dispense volume. To measure these figures and quantify the performance of the device, aliquots of water were dispensed into individual microcentrifuge tubes. Each tube was then weighed on a balance (Explorer E11140; Ohaus, Pine Brook, NJ). Each data point was replicated five times. The tare (dry) masses of the microcentrifuge tubes were individually measured and subtracted. The same weighing procedure was used to measure the pipetting accuracy and uniformity. Five replicates of 200-µL aliquots (maximum pipetting volume) of water were aspirated from a microtiter plate, released into microcentrifuge tubes, and weighed.
Uniformity and Accuracy
Figure 6a shows the results of the uniformity and accuracy tests for dispensing and pipetting, respectively. In discussing uniformity, it is necessary to distinguish between shot-to-shot variation and nozzle-to-nozzle variation. Data sheets for commercial instruments typically do not make this distinction and instead quote a single coefficient of variation (CV); typical values range from 1.5% to 2.0% for dispensers and 2.0% to 3.0% for pipettors.
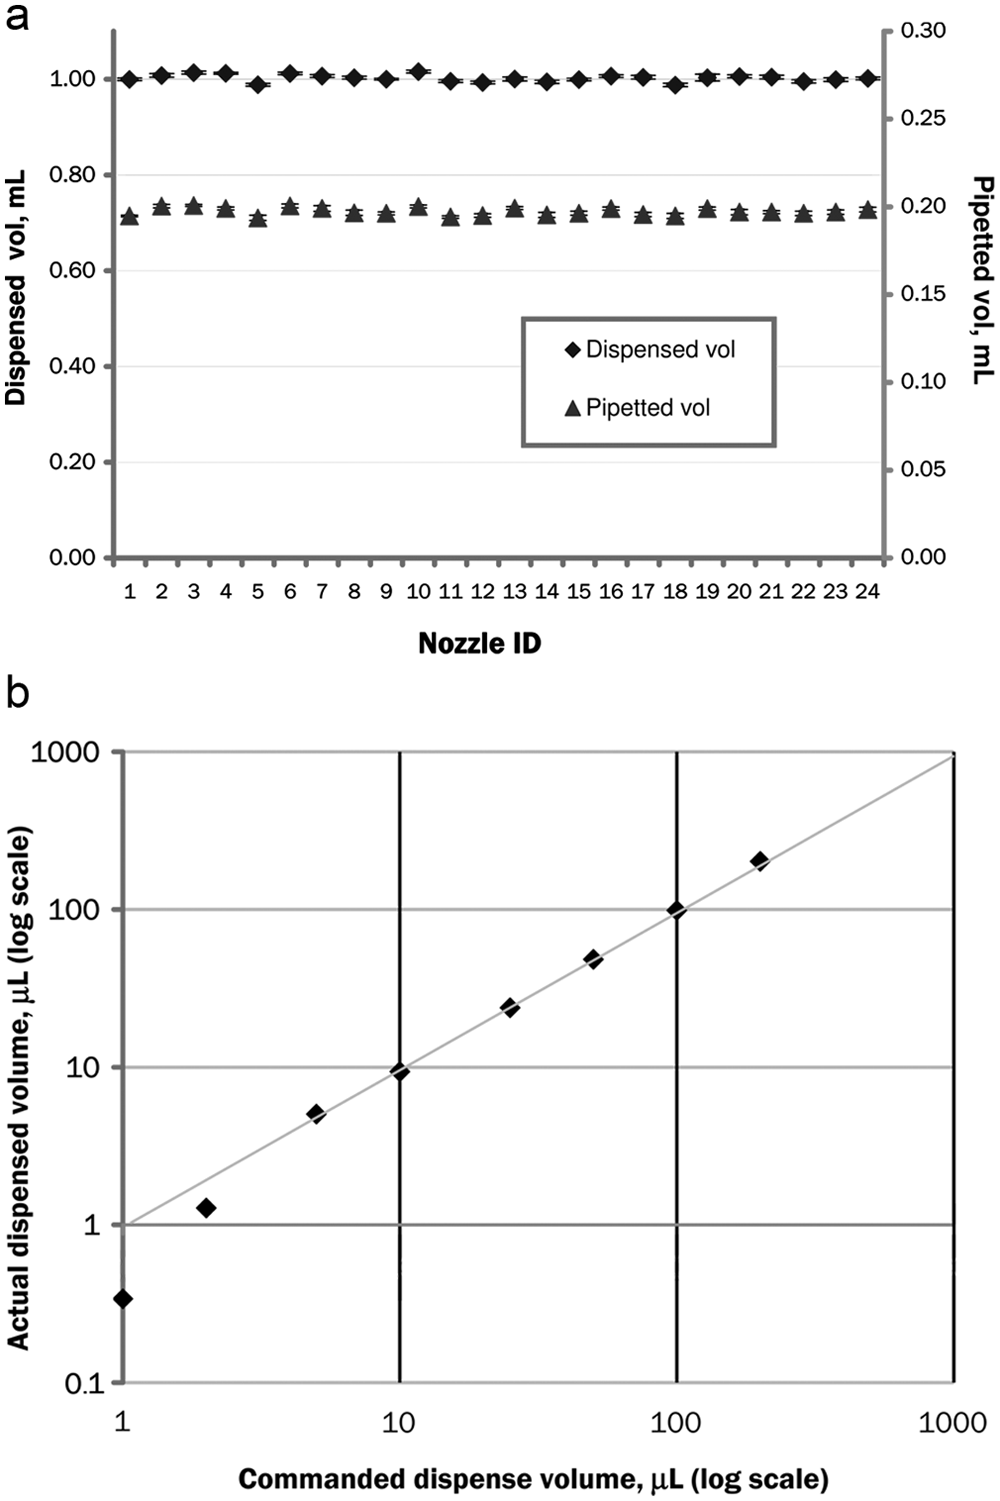
(a) Dispensing/pipetting accuracy. Points show the aliquot volumes dispensed by each of 24 nozzles. Error bars show ±1 standard deviation. Commanded volume is 1.0 mL for dispensing, 200 µL for pipetting. (b) Linearity of actual dispensed volume versus commanded dispense volume.
The shot-to-shot variation of one nozzle is the CV of all the different aliquots from that particular nozzle. For dispensing, the shot-to-shot variation ranged from 0.17% to 0.71%, with a mean of 0.32%; for pipetting, it ranged from 0.22% to 0.82%, with a mean of 0.55%. The causes of this variation may include valve timing errors, leaks, and pressure sensor errors. For dispensing, causes may also include air bubbles in the tubing or manifold. For pipetting, causes may also include geometry and surface irregularities in the pipette tips, especially at the orifice.
The nozzle-to-nozzle variation is the CV among all the different nozzles for a set of aliquots made at the same time. For dispensing, the nozzle-to-nozzle variation ranged from 0.72% to 0.78%, with a mean of 0.76%; for pipetting, it ranged from 1.0% to 1.5%, with a mean of 1.2%. The systemic causes of this variation include manufacturing tolerances in the ID of the nozzles and position along the length of the channel (see “Fluidic Parameter Optimization” section). Nonsystemic, random causes of this variation include nozzle blockages by particles or buffer residues, temperature gradients in the manifold, and, for dispensing, bubbles in the channels.
Accuracy is closely related to uniformity, and the error (accuracy) is dominated by the effects of variation (uniformity). However, there is also a systemic error even for the mean value of all aliquots. In principle, this can be removed by proper calibration; however, drifts in aliquot volume calibration still produce a measurable systemic error. For dispensing, overall root mean square (RMS) error was 0.8%, and the maximum error was 1.9%. This is comparable with the quoted accuracies for typical commercial instruments of 1.0% to 3.0%. For pipetting, overall RMS error was 0.36%, and the maximum error was 4.0%. This is also comparable with the quoted accuracies for typical commercial instruments of 2.5% to 5.0%. The greatest cause of systemic error is most likely changes in temperature. This would affect the viscosity of the air or buffer, which in turn changes the flow rate. In principle, more frequent calibration can compensate for this problem; however, a fluctuating temperature or temperature gradients in the instrument could make calibration challenging. Other effects that may affect accuracy include clogging by small particles, pressure errors due to leaks, and drifts in the regulator or pressure sensor.
Minimum Dispense Volume
Minimum dispense volume is another important figure of merit for a dispenser. Figure 6b shows actual dispensed volume versus commanded volume for a range of volumes from 1 to 200 µL. In a perfect dispenser, all points would lie along the gray line (1:1 ratio) for all volumes. In this data set, actual dispensed volumes below 5 µL are less than nominal. This is comparable with commercial instruments, which typically have minimum volumes in the range of 5 to 10 µL.
This problem occurs because the pressure inside the manifold does not rise instantaneously when the buffer tank output valve (valve 5) is opened. Instead, it takes a finite time, approximately 100 ms, for enough buffer to flow into the manifold to raise the pressure to its steady-state value. This time is governed by two things: the flow resistance between the buffer tank and the nozzles (delivery resistance plus distribution restrictor resistance) and the compliance (volume change per unit pressure) of the manifold and its tubing, which is due principally to small entrapped air bubbles and to the flexible output tubing.
Timing
Figure 7 shows the times required to perform pipetting (aspirating) and dispensing operations, broken down by major steps for this iteration of the device. Pipetting 200 µL takes approximately 25 s; dispensing 200 µL (water) takes approximately 192 s.
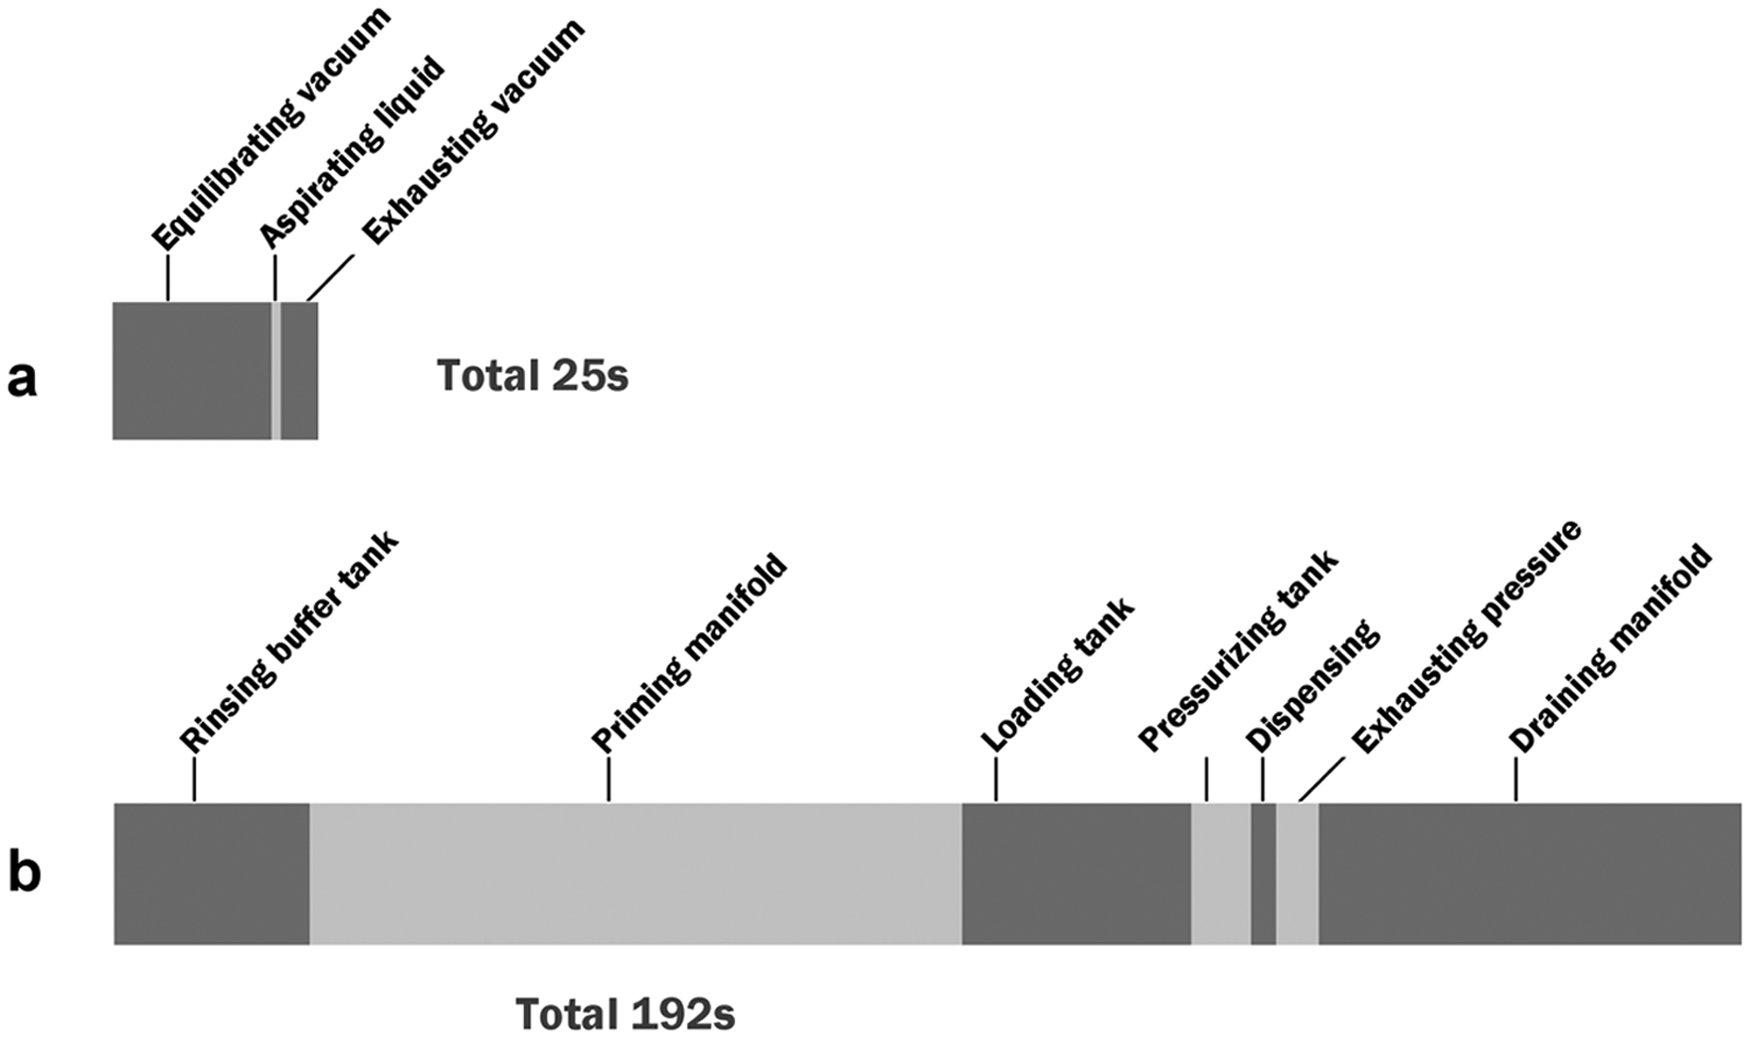
Timing diagram. (a) Pipetting time for a 200-µL aliquot. (b) Dispensing time for a 200-µL aliquot to 24 samples.
These times, particularly the dispensing, are several times longer than other automated dispensers, despite the fact that the other automated dispensers have fewer channels and must step-and-repeat. However, these times are not fundamental or even practical limits. Opportunities for improvement include shortening the tubes, reducing flow resistances, and using higher resistance nozzles to allow faster priming and emptying of the manifold. With these measures, pipetting and dispensing times could be cut very significantly, perhaps by an order of magnitude, making this method both more inexpensive and faster.
Application in Biological Assay
The fluidic performance was demonstrated by using the device in a bacterial DNA isolation protocol using an anion exchange matrix (Q-Sepharose) and a PPM solid-phase extraction matrix. The materials used included Q-Sepharose (GE Healthcare, Piscataway, NJ); lithium chloride and sodium acetate (Sigma-Aldrich, St. Louis, MO); Taqman mastermix, Taqman assay mix, nuclease-free water, Tris-borate-EDTA (TBE) buffer, 4% to 20% TBE–acrylamide gels, and SYBR green gel stain (Life Technologies, Carlsbad, CA); and QIAquick desalting kit (Qiagen, Valencia, CA).
The manual process of DNA isolation using the PPM and manufacture of PPM microcolumns has been described in detail in previous work.2,5 We implemented a similar protocol on the TriPette. Briefly, Bacillus subtilis genomic DNA samples were mixed with three times the volume of a chaotropic loading buffer (1 M guanidium thiocyanate with 66% isopropanol) using the pipetting function. The mixed samples were loaded by pipetting into columns containing the PPM matrix. DNA was bound to the matrix material by pressurizing the columns to 35 kPa. Wash buffer (500 µL, 70% ethanol in nuclease-free water) was dispensed into the columns, and the PPM was washed by pressurizing at 70 kPa for 3 min. The washing step was repeated once more for optimal DNA quality. In the next step, elution buffer (100 µL, nuclease-free water) was dispensed into the columns and pressurized (70 kPa for 1 min) to elute the DNA.
For DNA purification with the Q-Sepharose matrix, B. subtilis genomic DNA samples in aqueous solutions were loaded onto Q-Sepharose matrix by pipetting into columns containing the anion exchanger. DNA was bound to the matrix material by pressurizing the columns to 35 kPa. Wash buffer (500 µL, 0.3 M LiCl and 10 mM sodium acetate, pH 5.2) was dispensed into the columns, and the Q-Sepharose matrix was washed by pressurizing at 70 kPa for 3 min. The washing step was repeated once more for optimal DNA quality. In the next step, elution buffer (100 µL, 2 M LiCl and 10 mM sodium acetate, pH 5.2) was dispensed into the columns and pressurized (70 kPa for 2 min) to elute the DNA from the Q-Sepharose matrix. The eluted DNA was desalted off-line by QIAquick desalting columns and used for quantitative PCR (qPCR) assays.
B. subtilis gene ftsA was used as the target gene in the PCR assays. The primers (GATCACCGGTTCAAAAACAAT CTTACA, AGCGGCTGAAGGCAAATATCA) were targeted against the middle of the ftsA sequence, which results in a 90–base-pair–long PCR product, and were designed using the custom primer design tool for Taqman assays (Applied Biosystems, Foster City, CA). The primers and the master mix were purchased from Applied Biosystems and the qPCR reactions were run on an ABI7300 (Applied Biosystems) instrument. The thermal profile was 50 °C for 3 min and 95 °C for 5 min, followed by 40 cycles of 95 °C for 15 s and 55 °C for 30 s. Amplified samples were later run on a 6% to 20% TBE–acrylamide gel with a low molecular weight standard to confirm the presence of the amplicon.
Nucleic acids were purified with the TriPette to assess its liquid-handling abilities in a real-life application of sample preparation. The industry standard for nucleic acid isolation uses manual processes with solid-phase extraction columns from manufacturers such as Qiagen, Invitrogen (Carlsbad, CA), Roche (Roche Applied Science, Indianapolis, IN), Promega (Madison, WI), etc. Although the manual processes are simple and provide high extraction efficiency, limitations include variability in extraction efficiency and quality of the extracted nucleic acid samples. The largest contributor to the variability in extraction results is human error in liquid handling, leading to different volumes and timing of reagent delivery. The goal in this study was to follow the same extraction protocol for both automated and manual processes and compare the automated devices extraction results against those from a manual version (HT-SNAP) 2 of the same protocol. The hypothesis for this experiment was that the automated process would increase the efficiency and reproducibility of a manual extraction process. For the comparative test, 1000 ng of previously purified B. subtilis genomic DNA was used as the starting sample for the both manual and automated processes. The qPCR results from the manual and automated methods were compared ( Fig. 8 ) in terms of CT values, which indicate the quantity of DNA in the starting samples; a CT value that is lower by 1 unit corresponds to a twofold increase in the quantity of DNA. The automated method was found to be more efficient for both the PPM (CT value of 25 vs. 26) and Q-Sepharose matrix (CT value of 28 vs. 29). The CT values of the qPCR results for DNA isolated using the automated method also showed reduced variability as compared to the manual process. Because both the manual and the automated processes used the same protocol, materials, reagents, samples, and purification matrix, the increased efficiency and the reduced variability can be attributed to more accurate liquid handling by the automated device. Thus, comparison of the manual and the automated biological assays indicates that not only is the automation superior in reducing random variations, but it also can improve the overall efficiency of the process.
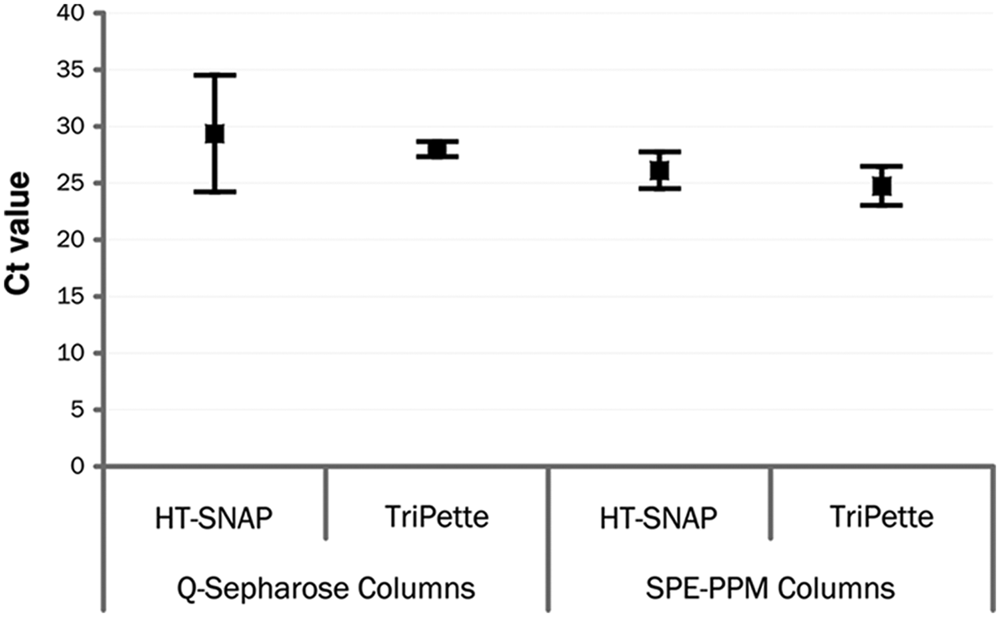
Results of quantitative PCR for extraction of genomic DNA from Bacillus subtilis. A lower CT value corresponds to better extraction efficiency. SPE, solid-phase extraction; PPM, porous polymer monolith.
Conclusion
A novel, elegant design principle for a liquid-handling system for biomolecular sample preparation was implemented and tested. By most metrics, its performance equals or surpasses that of typical commercial instruments. The operation times, however, are longer. The key advantage is that it reduces cost by replacing three common liquid-handling devices. Furthermore, it is less mechanically complex than other devices, and the denser the array becomes, the greater this advantage becomes.
For nucleic acid isolation using PPM and Q-Sepharose matrices, the overall profile of pros and cons is favorable. The accuracy and volume range are both comparable with typical commercial instruments. Although the operation time is currently long, overall efficiency and variability can be improved by the automated process. Improvements in the duration can easily be incorporated with some simple design enhancements. In addition, the nucleic acid isolation application is one where simplicity and low cost are important, making the TriPette an attractive option. It is likely that many other applications will be found as well.
Footnotes
Acknowledgements
We thank Sebastian Boll, Dr. Catherine Klapperich, Steffen Schreiner, Marcus Krah, Dr. Alexander Gruentzig, and Dr. Sudong Shu for their technical support. We also thank Fraunhofer Gesellschaft and Boston University for funding this work through the BU-Fraunhofer Alliance for Medical Devices, Instrumentation, and Diagnostics Program.
The authors declared no potential conflicts of interest with respect to the research, authorship, and/or publication of this article.
The authors disclosed receipt of the following financial support for the research and/or authorship of this article: This work was funded through the BU-Fraunhofer Alliance for Medical Devices, Instrumentation, and Diagnostics Program.