
Abstract
Introduction
Low back pain (LBP) is a common ailment with an age-standardized point prevalence in the general population of 7.50% in 2017 1 and chronic LBP with a prevalence of 4.2%. 2 The ailment has a sizeable economic cost, as illustrated by the annual national cost of LBP at €740 million in Sweden, 3 and a cost of care for non-surgical patients with LBP in the USA of $1.8 billion in 2019. 4
There is a significant individual consequence of LBP as well: chronic LBP is often associated with functional limitations, 5 reduced postural control, 6 and changes in movement characteristics in gait, sit-to-stand, and stair ascension.7,8 Studies examining the movement characteristics of individuals with LBP during gait and standing have found delayed muscle onsets of the obliques, prolonged muscle activation, especially of the lumbar erectors, and abnormal thoracic muscle function.9,10
Most studies examining movement characteristics of individuals with LBP have examined gait on a level surface, but only a few studies have examined other functional tasks such as step negotiation.11,12 The objective of this study was to analyze movement characteristics by examining differences in muscle onset and activation levels and kinetics between healthy controls and individuals with chronic or recurrent LBP classified with lumbar instability while performing a step descent task. The results of this study have the potential to reveal movement characteristics in this subgroup of individuals with LBP and may therefore add specificity in designing rehabilitation strategies for said group.
Materials and methods
Research design
This study is a mixed-factorial design with one between-subjects factor (two groups) and two within-subjects factors (three gait phases and step-side).
Participants
A priori power analysis indicated a total of 22 participants was needed for the study (G*Power v. 3.1). A control group (n = 11) and LBP group (n = 11) volunteered in this study and all participants signed a consent form. The general characteristics of the participants are shown in Table 1. Inclusion criteria were: (a) age >18 years; (b) chronic LBP (3 months or more) or recurrent LBP (more than one episode lasting more than three months) in the past year; (c) one or more participative predictors of lumbar spine instability, i.e. give-away, cracking, popping of lumbar spine 13 ; and (d) one of two clinical tests positive: Prone instability test (PIT) 14 or passive lumbar extension test (PLET). 15 Control participant criteria were (a) age >18 years and (b) had no report of LBP in the past year. None of the subjects reported radicular symptoms or weakness in lower extremities. The study was approved by St Michael Medical Center's Institutional Review Board (Newark, NJ, USA #18/14).
Demographic characteristics of participants (n = 22).
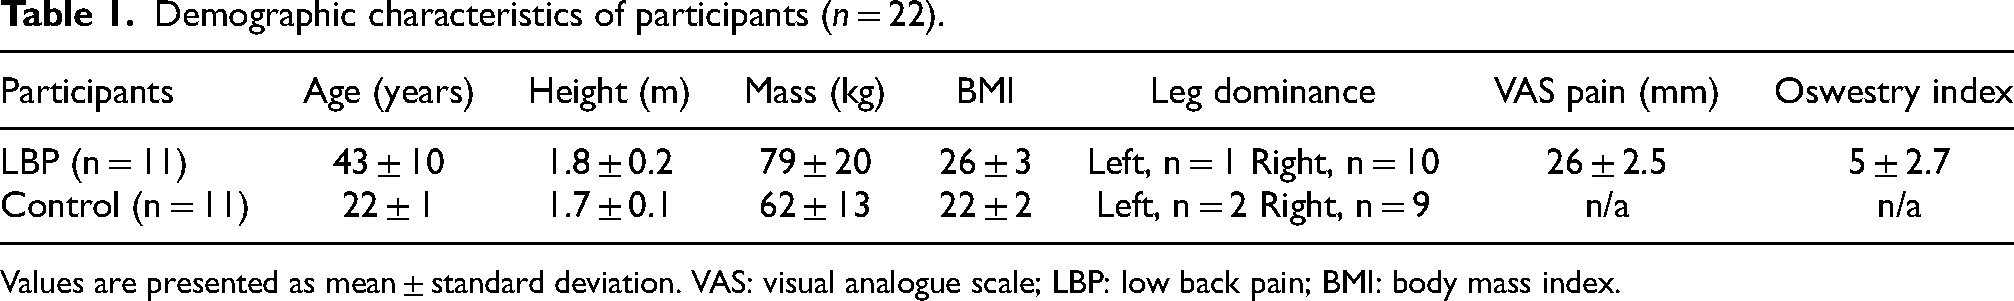
Values are presented as mean ± standard deviation. VAS: visual analogue scale; LBP: low back pain; BMI: body mass index.
Apparatus and procedure
Before testing, the LBP participants completed the Modified Oswestry Pain and Disability Questionnaire 16 which provides a rating of perceived disability as a measure of physical impairment due to LBP. The rating ranges from 0 to 100, where ‘0’ indicates no disability and “100” indicates severe disability.
Upon arrival at the testing session, participants marked their current pain level (if applicable) on a visual analogue scale (VAS). 17 After that, the PIT was conducted. When the test was positive, the participant was included in the study. If the PIT was negative, the PLET was conducted. The patient was included in the study if the PLET test was positive.
Participants stood on a platform with a 23.1 cm-high step. The step platform had two force plates (Bertec, Columbus, OH, USA): One on top, which served as the starting point for the step trials, and one at the bottom to step down upon. First, leg dominance was determined by having the subject step down three subsequent times without instruction regarding their choice of side. The leg leading in most trials was considered the dominant leg. Each participant stepped down five times on each side at a self-selected speed for the data collection itself. Trials were randomized regarding sides. Participants were given a 1-min rest between trials.
The full-step cycle was divided into three phases. Phase 1 was defined as the moment the leading foot left the surface (single support for the trailing leg). Phase 1 ended upon the initial touch on the lower surface, starting phase 2 (double stance). Phase 2 ended with the trailing leg leaving the upper surface, starting phase 3 (single support for the leading leg). Phase 3 ended with the trailing leg touching the lower surface.
Video coordinate data were collected with six high-speed ProReflex MCU 1000 cameras (Qualisys, Göteborg, Sweden) with a sampling frequency of 100 Hz and filtered with a low-pass Butterworth filter at 6 Hz. 18 Video data was synchronized with the wireless EMG data which served to identify phases of the step cycle. Forty-three retro-reflective markers were placed on the specific body segments to model the thoracic and pelvic segments, and bilateral lower extremities following the Visual3D recommendations (C-Motion Inc., Germantown, MD, USA). Kinematic data was not reported in this paper. A maximal voluntary contraction (MVC) for each muscle data was collected from was performed based on the guidelines by Yang and Winter 19 and Konrad 20 before the step trials.
Data analysis
Dependent variables were (a) amplitude of EMG activity of the rectus abdominis (RA), lumbar erector spinae (LES), and gluteus medius (GM), measured bilaterally; (b) onset times of EMG at weight acceptance (WA) with the EMG onset identified as the increased EMG amplitude by 3 SD; and (c) vertical ground reaction force (GRF) rise-time to the first peak at WA (Figure 1).
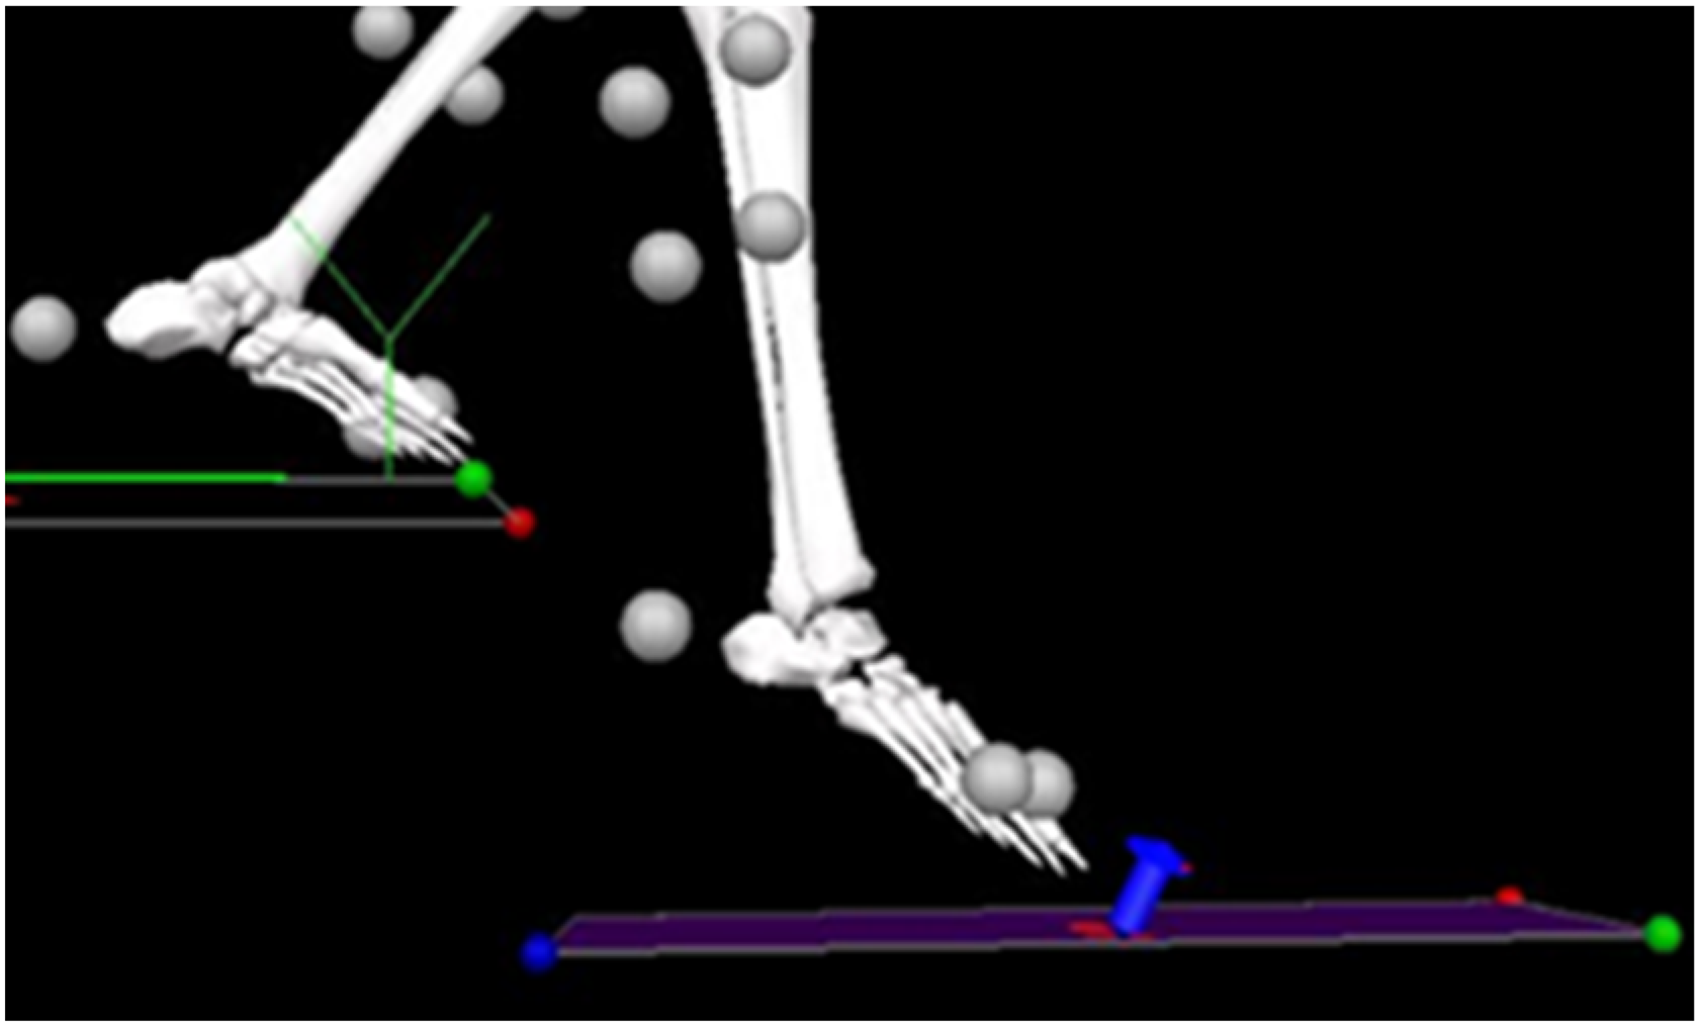
Sample trial picture of a 3D-digitized model with the first frame captured at WA on the lower force plate. The blue arrow indicates initial force detection. The LBP group has a slower vertical GRF rise to the first peak of force detection (P < 0.05). 3D: three dimensional; LBP: low back pain; WA: weight acceptance; GRF: ground reaction force.
EMG procedure
Before affixing the EMG sensors on the skin, the sensor sites were cleaned according to the SENIAM recommendations for standardized skin preparation. The six bipolar self-adhesive Ag/AgCl electrodes with a 10-mm interelectrode distance (Trigno EMG sensors, Delsys, Natick, MA, USA) were placed on the skin according to Konrad 20 on bilateral LES, bilateral RA and bilateral GM. Specifically, the electrode was placed 3 cm lateral and 3 cm superior to the umbilicus on both sides for the RA.
EMG processing
The EMG data were collected in Qualisys Track Manager Version 2.9, 2013/14, with a sampling frequency of 2000 Hz. Then the EMG signal was processed with a custom-written script in Visual3D (C-Motion Inc.), where the signal was filtered with a low-pass Butterworth filter with a cut-off frequency at 3.14 Hz, a bandwidth of 20–450 Hz, and processed with a liner envelope using a 250-ms sliding window. Thereafter, the EMG amplitude was calculated and the EMG signal normalized (in %) to the MVC collected from the respective muscle.
Statistical analysis
Dependent variables were the following: Mean amplitudes EMG (% of MVC), onset time of EMG at WA (in seconds; SD above baseline EMG), and GRF rise-to-first-peak at WA (N/kg and temporal in seconds). Independent variables were LBP (present/not present) and side (right or left). Descriptive statistics, including means and standard deviations, were obtained for the whole sample and each group. A two-way mixed analysis of variance (ANOVA) with alpha = 0.05 was utilized to analyze the results of the movement trials. Assumptions were met for the EMG data. Interactions for muscle onsets and activation levels were calculated. Post-hoc comparisons were performed with a t-test for between- and within-groups. The effect size was interpreted as small at 0.10, medium at 0.30, and large at 0.50. 21 IBM SPSS Statistics ver. 22 (IBM Co., Armonk, NY, USA) was used for data analyses, and a P-value was set at 0.05 significance level.
Results
Participant characteristics
Participants reported low levels of pain (mean VAS = 26 ± 25 mm), and low levels of disability (mean Oswestry Disability index of 5 ± 2.7) and they were not seeking medical treatment at the time of the study (Table 1).
EMG reliability
The EMG demonstrated excellent reliability with an ICC = 0.96 for the step descent. 22
EMG signal onset in phase 1 at WA
Delayed EMG onset
The LBP group had delayed onsets of the right LES and the left GM on the right steps compared to the control group (between, P < 0.05) (Table 2, Figure 2) and, likewise, showed later onsets for the same muscles on the right steps compared to the left steps within the LBP group (within, P < 0.05).
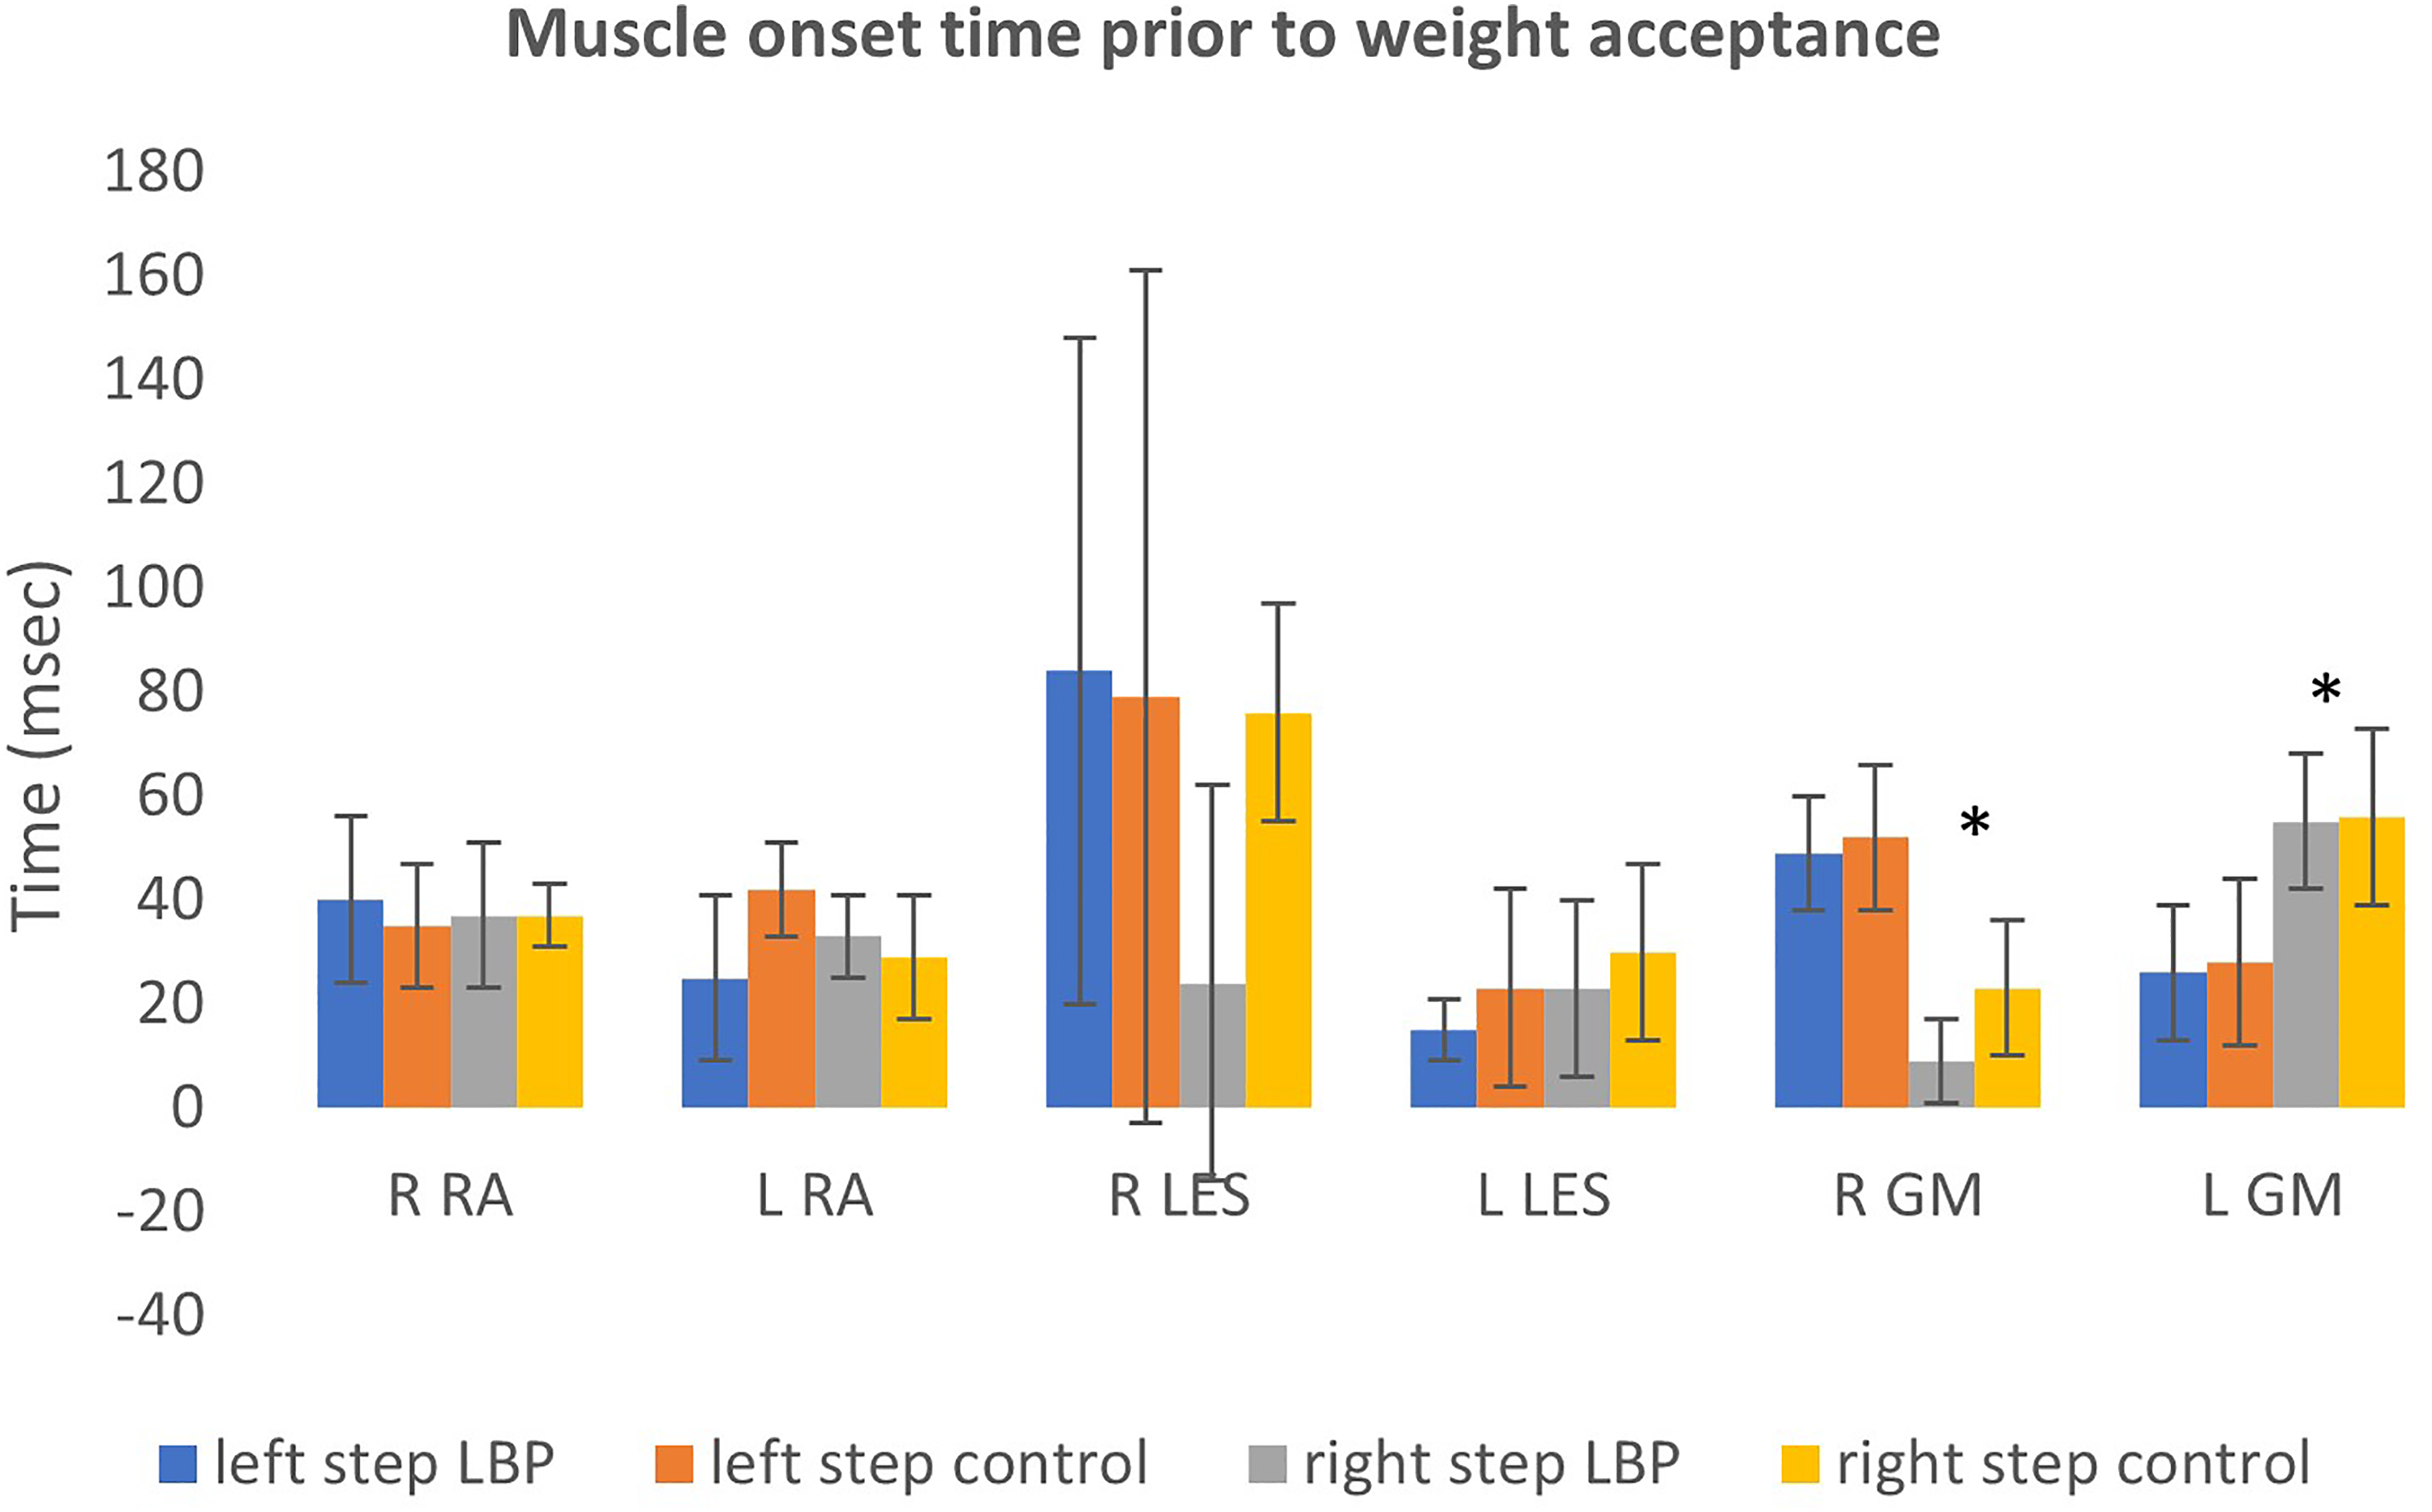
Muscle onset time prior to weight acceptance. *Between-group significance. The graph shows muscle onset times just prior to weight acceptance between the two groups (LBP and controls) for the different muscle groups. RA: rectus abdominus, LES: lumbar erectors, GM: gluteus medius; LBP: low back pain.
Muscle onset time in seconds just prior to WA.
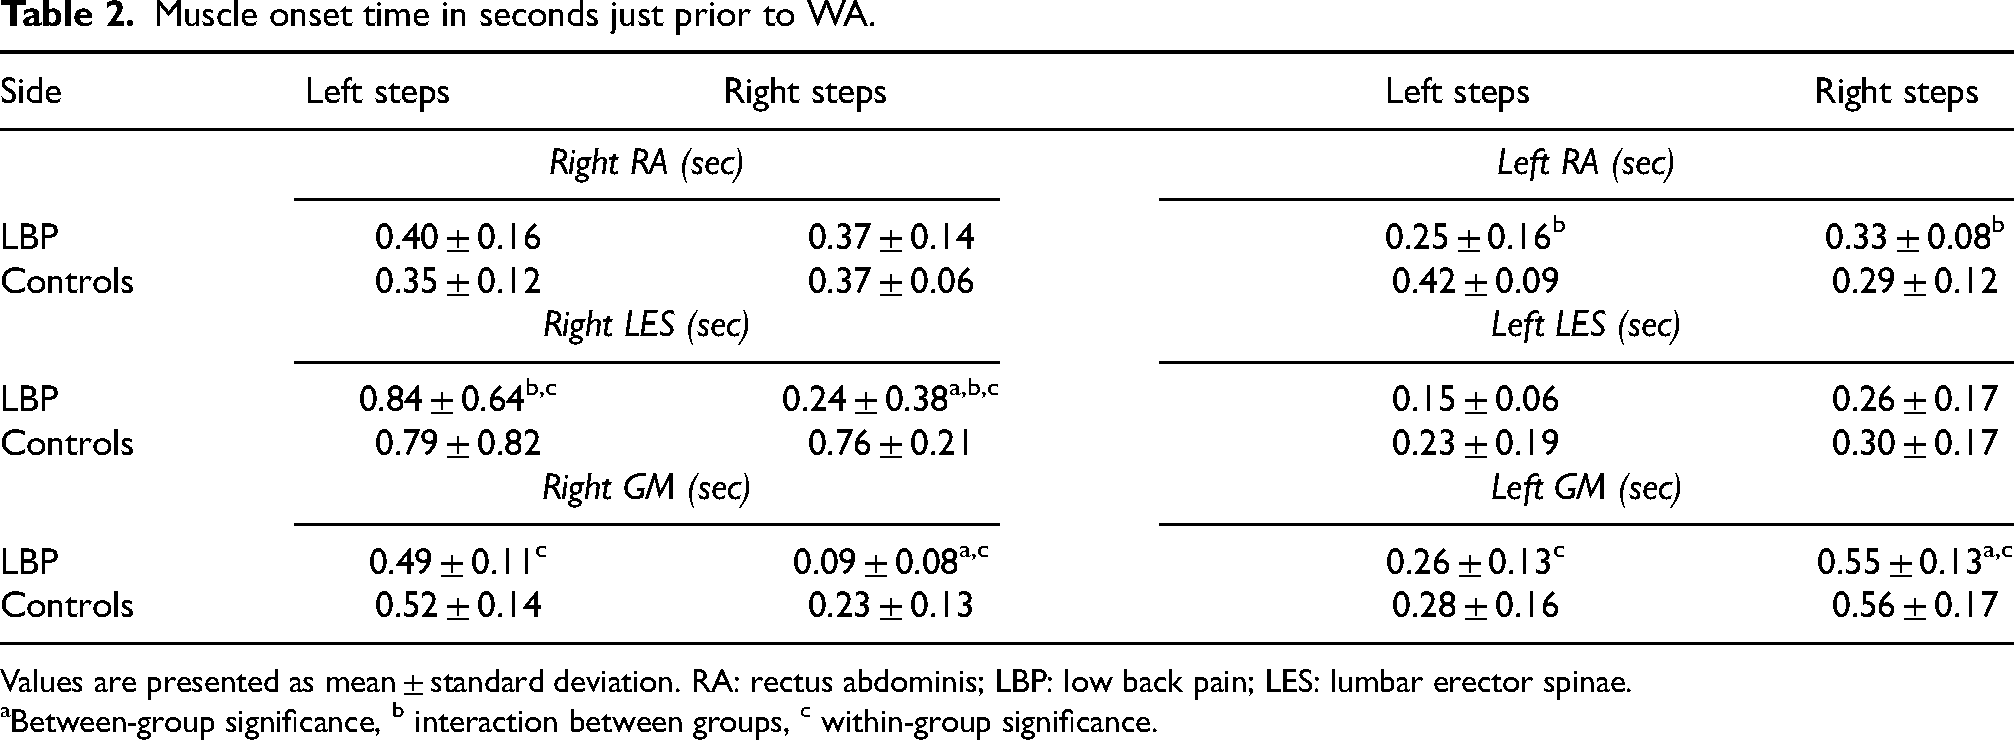
Values are presented as mean ± standard deviation. RA: rectus abdominis; LBP: low back pain; LES: lumbar erector spinae.
Between-group significance, b interaction between groups, c within-group significance.
Early EMG onset
The LBP group had earlier EMG onsets of both the right and left GM on right steps compared to the left steps within the LBP group (within, P < 0.05) (Table 2).
Interaction
The left RA EMG was affected by an interaction between the group and step side of the participants (P < 0.05), with the LBP group showing later onsets on the right steps and earlier on left the steps. In contrast, the control group had the opposite onset pattern (Table 2). Likewise, the EMG of the right LES was affected by an interaction between the group and the step side (Table 2): The LBP group had later onsets with the right steps compared to the control group but earlier onsets with left steps (interaction, P < 0.05).
EMG activation levels phase 1, single-leg support
Abdominal and lumbar muscles
Individuals with LBP had higher activation levels of RA bilaterally (Table 3) and the LES muscles (Table 4) bilaterally in both right and left steps compared to the control group (P < 0.05). Statistical interaction showed that both left and right RA in the LBP group had similar activation levels regardless of step side. In contrast, the control group had different activation levels depending on which leg stepped first (P < 0.05).
Rectus abdominis activation level in phase 1.
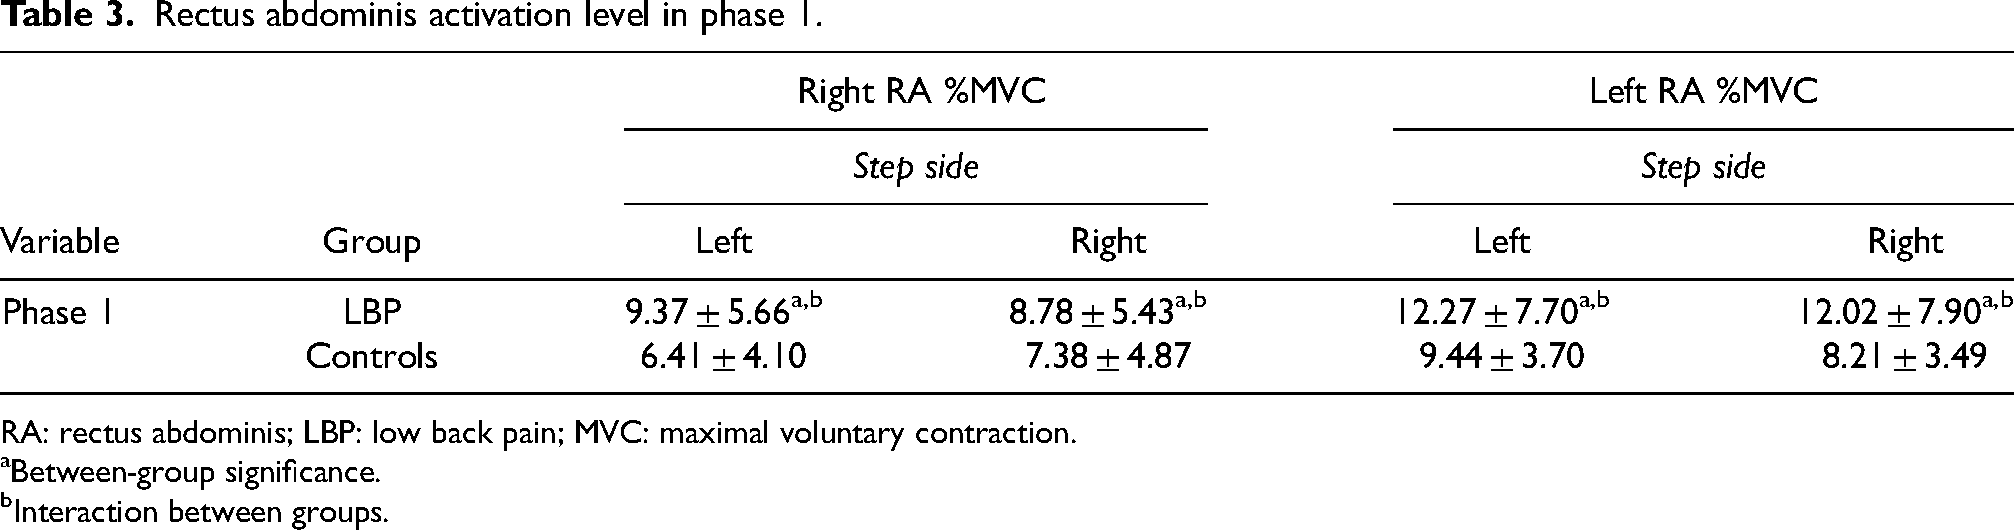
RA: rectus abdominis; LBP: low back pain; MVC: maximal voluntary contraction.
Between-group significance.
Interaction between groups.
Lumbar erector spinae and gluteus medius activation level in phases 1, 2, and 3.
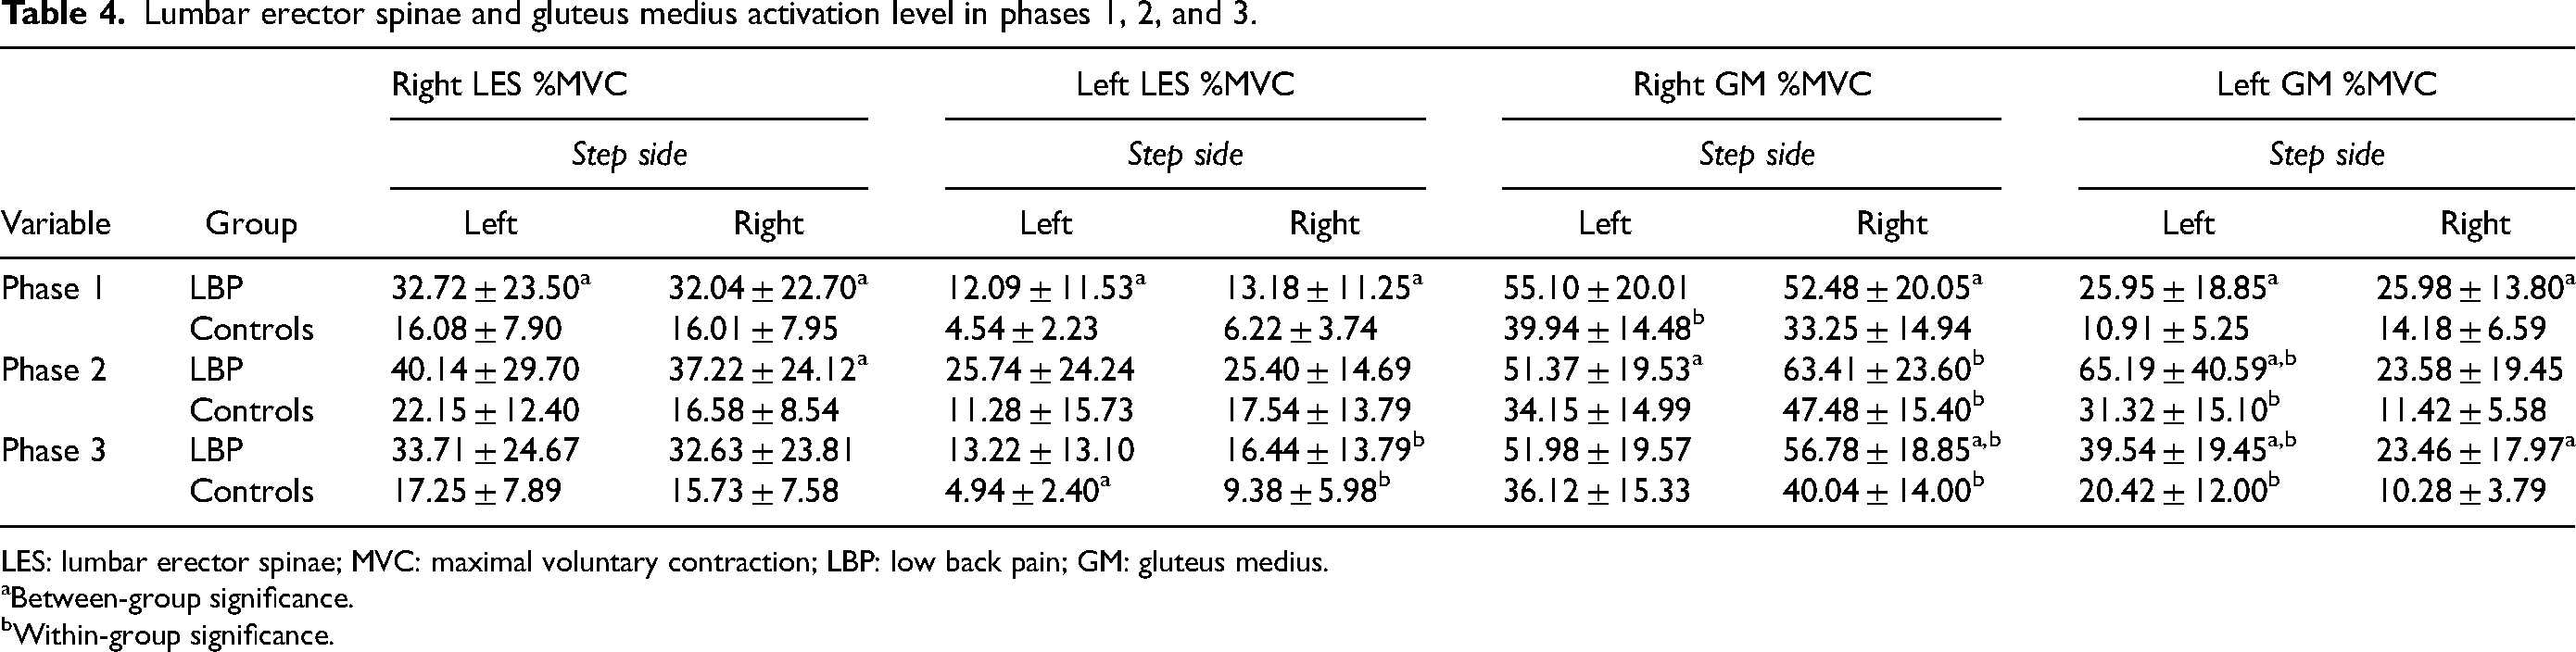
LES: lumbar erector spinae; MVC: maximal voluntary contraction; LBP: low back pain; GM: gluteus medius.
Between-group significance.
Within-group significance.
Hip muscles
The LBP group had higher activation levels of the right GM on the right steps than the control group (P < 0.05), whereas the control group had more activation on the left steps compared within-group (P < 0.05) (Table 4). The LBP group had higher activation levels of the left GM than the control group on both the left and the right steps (P < 0.05).
EMG activation levels phase 2, double leg support
Lumbar muscles
The only statistical significance found was a higher activation level of the right LES on the right steps in the LBP group compared to the control group (P < 0.05) (Table 4).
Hip muscles
On the left steps, the right GM had higher activation levels in the LBP group than in the control group (P < 0.05), and both groups had higher activation levels of the right GM on the left steps than on the right steps compared to within-group (P < 0.05) (Table 4).
The left GM demonstrated higher activation in left steps for the LBP group than in the control group (P < 0.05), and both groups activated their left GM more in left steps than in right steps compared to within-group (P < 0.05) (Table 4).
EMG activation levels phase 3, second single-leg support
Lumbar muscles
On the right steps, both groups had higher activation levels of their left LES compared to within-group (P < 0.05) (Table 4).
Hip muscles
The right GM had higher activation levels in the LBP group on the right steps compared to the control group (P < 0.05) (Table 4). On the right steps, both groups had higher activation of the right GM than on the left steps compared to within-group (P < 0.05) (Table 4).
The left hip GM had higher activation levels in the LBP group in both left and right steps (P < 0.05) (Table 4). On the left steps, both groups had higher activation of left GM than on the right steps compared to within-group (P < 0.05) (Table 4).
Kinetics
The vertical GRF rise-time from the initial force detection to the first peak during initial WA on the lower force plate (Figure 1) was longer in the LBP group when leading with the left leg (LBP group, 12.74 ± 1.95 ms; controls, 10.15 ± 1.90 ms) (P < 0.05). This indicates the LBP group had a slower WA.
Discussion
Overall, the results demonstrate that the LBP group had delayed muscle onsets, higher muscle activity of trunk and hip muscles and a longer GRF rise-time to the first peak than the control group. Furthermore, phase 1 – the first single-leg stance phase – appeared to be the most dynamically challenging for the LBP group with altered activation patterns in all three muscle groups, whereas phase 2 and 3 only showed differences between groups in LES and GM muscles.
In phase 1, the GM demonstrated higher activation levels, in conjunction with higher activation of abdominal and lumbar muscles in left steps; this corresponds to other studies, 23 indicating co-contraction of abdominal, lumbar, and gluteal muscles in participants developing LBP. The longer GRF rise-time at WA. coupled with the higher activation levels of the left GM may indicate an attempt to lessen impact upon WA. The right GM had delayed onset on the right steps, and when it finally contracted, it had a higher activation level than the control group suggesting impaired timing and calibration. The delayed-onset right GM and right LES, coupled with a higher, albeit late, co-activation of the same, suggest that a different movement strategy was employed on the left steps. Reduced anticipatory control with delayed onsets of lumbar muscles was seen in individuals with chronic LBP 24 and may also play a role in this step-descent task. A different motor strategy seemed to be employed depending on the side of the step as the LBP group had delayed right LES onset on right steps, but similar muscle onset on left steps compared to the controls. The late onset of left RA, coupled with the higher activation of right RA on left steps, again suggested a higher level of compromised motor control on left steps; It's plausible it may have threatened the subject's dynamic stability as the first second of unilateral weight-bearing is the most dynamically challenging. 25
Although there are limited reports on gait characteristics, especially during step or stair negotiation in an early middle-aged adult population with LBP, there is some evidence that age plays a role in older adults at faster gait speeds. 26 However, as the subjects in this study descended the step at a self-selected speed, and the most difference between asymptomatic individuals and individuals with LBP is seen at faster gait speeds, 27 the likelihood that the dissimilar age between the two groups can explain some of the group difference is small but cannot be entirely ruled out.
Employing a screening for kinesiophobia may have illuminated factors that the current study design cannot address. Although the LBP group presents low pain levels with less than 27 mm on the VAS, and scores less than six on the Oswestry disability questionnaire, it cannot be ruled out that cognitive factors play a role. It remains unclear if the changes in movement strategies seen in the LBP group in this study were employed in order not to destabilize their spine, but this seems unlikely as these subjects had relatively low Oswestry scores as well as low pain levels. Regardless of the causation of the elevated trunk muscle activity, it has the potential to cause suboptimal loading of the spine. 28 Given the potential long-term effects from the potential damage of suboptimal loading of the lumbar spine, it appears the movement control impairment found in this population with LBP needs to be addressed.
Current guidelines for individuals with chronic LBP and movement control impairments recommend specific trunk muscle activation and movement control exercises. 29 Given that the current group, in addition to chronic or recurrent LBP, also presents lumbar spine instability, the inclusion of exercises targeting motor control for such a subgroup is supported. Additionally, the current study adds awareness to side-dependency in motor control during functional tasks such as negotiating steps.
In conclusion, it seems essential to evaluate and treat aberrant movement patterns in individuals with chronic LBP and lumbar spine instability after carefully considering cognitive and biopsychosocial factors. Specifically, based on the result of this study, consideration should be given to include unilateral movements and weight-bearing activities.
Footnotes
Author's contribution
The lead author(s) designed the study, conducted the data collection, analyzed the data and wrote the manuscript. Dr. Cabell provided feedback on the design, methodology, data analysis and reviewed the manuscript. Furthermore, Dr. Cabell wrote the custom script used for the EMG analysis.
Declaration of conflicting interests
The authors declared no potential conflicts of interest with respect to the research, authorship, and/or publication of this article.
Funding
The author(s) received no financial support for the research, authorship, and/or publication of this article.