
Abstract
Study Design
Prospective study.
Objective
To assess the performance of diffusion tensor imaging (DTI) parameter ratios for early diagnosis by investigating their associations with clinical measures in patients with single-level degenerative cervical myelopathy (DCM).
Methods
A total of 309 participants were enrolled in this study, including 176 patients in the DCM group and 133 healthy controls. Baseline variables were used for propensity score matching (PSM), yielding 103 matched pairs. Fractional anisotropy (FA), apparent diffusion coefficient (ADC), and relative anisotropy (RA) values in white matter (WM) and gray matter (GM) were measured respectively. Clinical measures including Japanese Orthopedic Association (JOA) score, Visual Analog Scale (VAS), Nurick grade, and symptom duration were used. Cut-off values were determined using receiver operating characteristic (ROC) curve analysis. Stratified bootstrap resampling was used for internal validation. Area under the curve (AUC) was calculated. And the Youden index was used to identify optimal thresholds.
Results
In healthy controls, FA, ADC, and RA ratios in all 3 WM regions and in GM showed no significant correlations with age. The RA ratio showed the strongest correlations with JOA (r = 0.896) and symptom duration (r = −0.760) (all P < 0.001). The RA ratio achieved the highest AUC (0.981; cut-off 0.844; sensitivity 98.07%; specificity 96.12%) and outperformed the FA ratio (AUC = 0.927) and ADC ratio (AUC = 0.939) by DeLong’s test (P < 0.05).
Conclusion
The RA ratio may serve as a complementary quantitative imaging marker to support clinical assessment in the diagnosis and prediction of DCM.
Keywords
Introduction
Degenerative cervical myelopathy (DCM) is an umbrella term encompassing a variety of cervical degenerative disorders with a wide range of symptoms and signs. 1 Most patients present with a broad spectrum of symptoms, highlighting the complexity of their diagnosis. A study of the global burden of disease for neck and low back pain estimated that in 2015, more than one-third of the world's population suffered from mechanical neck pain lasting at least 3 months, emphasizing the impact of DCM on global health. 2 The complexity of symptom presentation makes the diagnosis of DCM challenging and contributes to uncertainty regarding prognosis. 3
Radiographic assessment is integral to the diagnosis of DCM. Conventional diagnostic methods include clinical evaluation and magnetic resonance imaging (MRI), which are commonly used to assess the extent of spinal cord injury.4,5 However, conventional MRI, particularly T2-weighted imaging, has been shown to have limitations in sensitivity to early spinal cord lesions, especially in the absence of significant spinal cord edema or morphologic changes. 6 With the advancement of imaging methods, diffusion tensor imaging (DTI) has been increasingly used for early detection of spinal cord lesions and prediction of surgical outcomes.7-9 DTI can reveal changes in the microstructure of the spinal cord and can be derived from standard MRI acquisitions without additional hardware. 10 It has been found that DTI parameters such as fractional anisotropy (FA) and apparent diffusion coefficient (ADC) are closely associated with white and gray matter pathological changes in the spinal cord. 11 Quantitative analysis of these metrics can provide detailed information about spinal cord compression, changes in nerve fiber bundles, and functional impairment,12,13 offering new perspectives for assessing DCM.
However, the application of DTI still faces some challenges, such as the standardization of imaging data, the selection of region of interest (ROI), 14 and the validity of parameter ratios.15-17 Most existing studies use absolute values of DTI parameters as reference indices and mainly focus on the Western populations. 18 In addition, few studies have systematically compared the feasibility of different DTI parameters in evaluating the status of DCM patients using clinical scales that are commonly used in routine practice. Although DTI metrics appear clinically useful, it remains unclear which parameter provides the best performance.
Therefore, this study aimed to optimize the application of DTI in the early diagnosis of DCM by systematically comparing different DTI parameter ratios in a relatively large cohort. We compared the trends of different DTI parameter ratios in single-level DCM patients and analyzed correlations between these parameter ratios and clinical scores. The diagnostic thresholds of each parameter ratio were further determined by receiver operating characteristic (ROC) curve analysis. This approach allowed us to identify the most informative DTI ratio for early diagnosis of DCM.
Materials and Methods
Subjects
The study was approved by the institutional review board. All participants provided written informed consent. Two versions of the consent form were used for the 2 groups, allowing their clinical data to be used for research. The healthy group included 133 individuals recruited from the medical examination center of our hospital (Figure 1). Controls were excluded if they had a history of cervical or lumbar trauma, spinal surgery, or other neurologic diseases. Absence of cervical spinal cord compression was confirmed on computed tomography (CT) or MRI. All patients were recruited between January 2024 and July 2025 at the Department of Orthopedics (Figure 1). Eligible patients were required to meet all of the following inclusion criteria: age 20 to 80 years; confirmed single-level spinal cord compression on CT or MRI; at least 1 clinical symptom or sign consistent with DCM (eg, hyperreflexia, clonus, clumsy hands, Hoffmann or Babinski signs, bladder or gait dysfunction). Clinical status was evaluated using the Japanese Orthopedic Association (JOA) score,
19
Visual Analog Scale (VAS),
20
and Nurick grade
21
for each patient. Symptom duration was defined as the patient-reported interval from the first onset of symptoms potentially attributable to DCM (eg, limb pain or numbness, limb weakness, or gait dysfunction) to study enrollment. Exclusion criteria included prior cervical spine surgery, nondegenerative etiologies, comorbid diseases (eg, multiple sclerosis or rheumatoid arthritis), traumatic central cord syndrome, multilevel (≥2 levels) spinal cord compression, and MRI contraindications (eg, pregnancy or metallic implants). Flowchart of participants’ recruitment. DCM, degenerative cervical myelopathy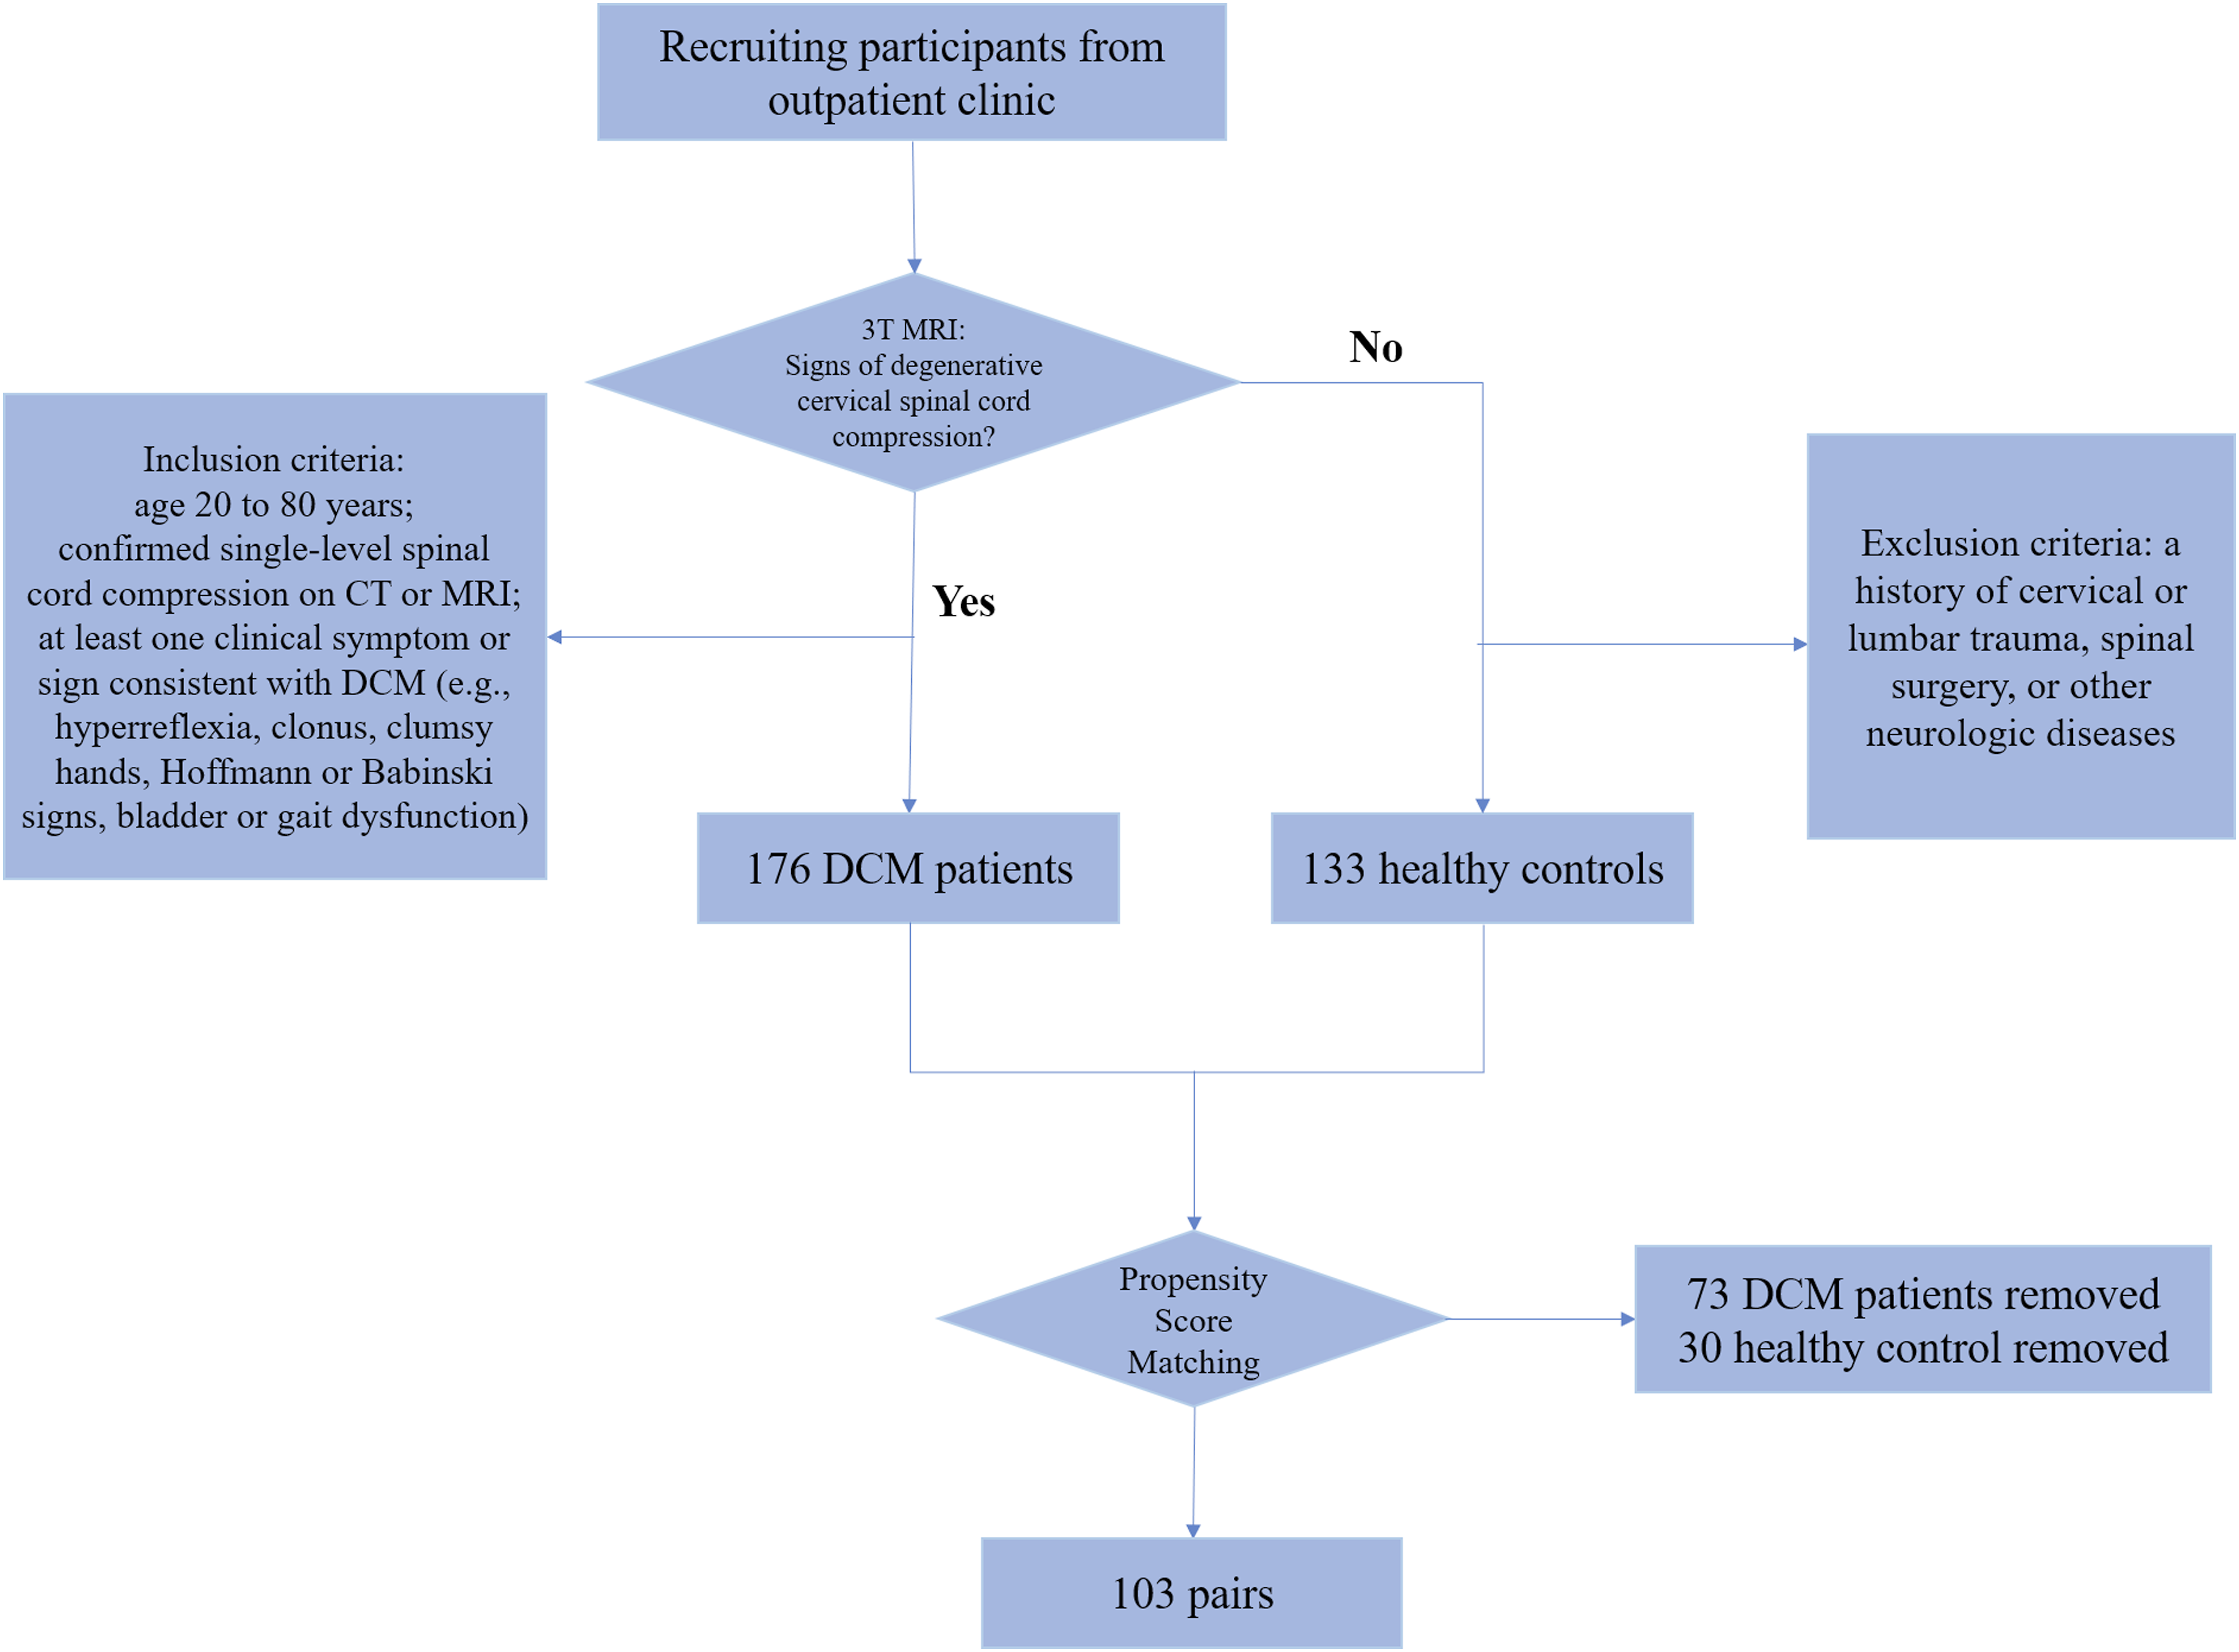
Propensity Score Matching
The Basic Information of DCM Patients and Control Group
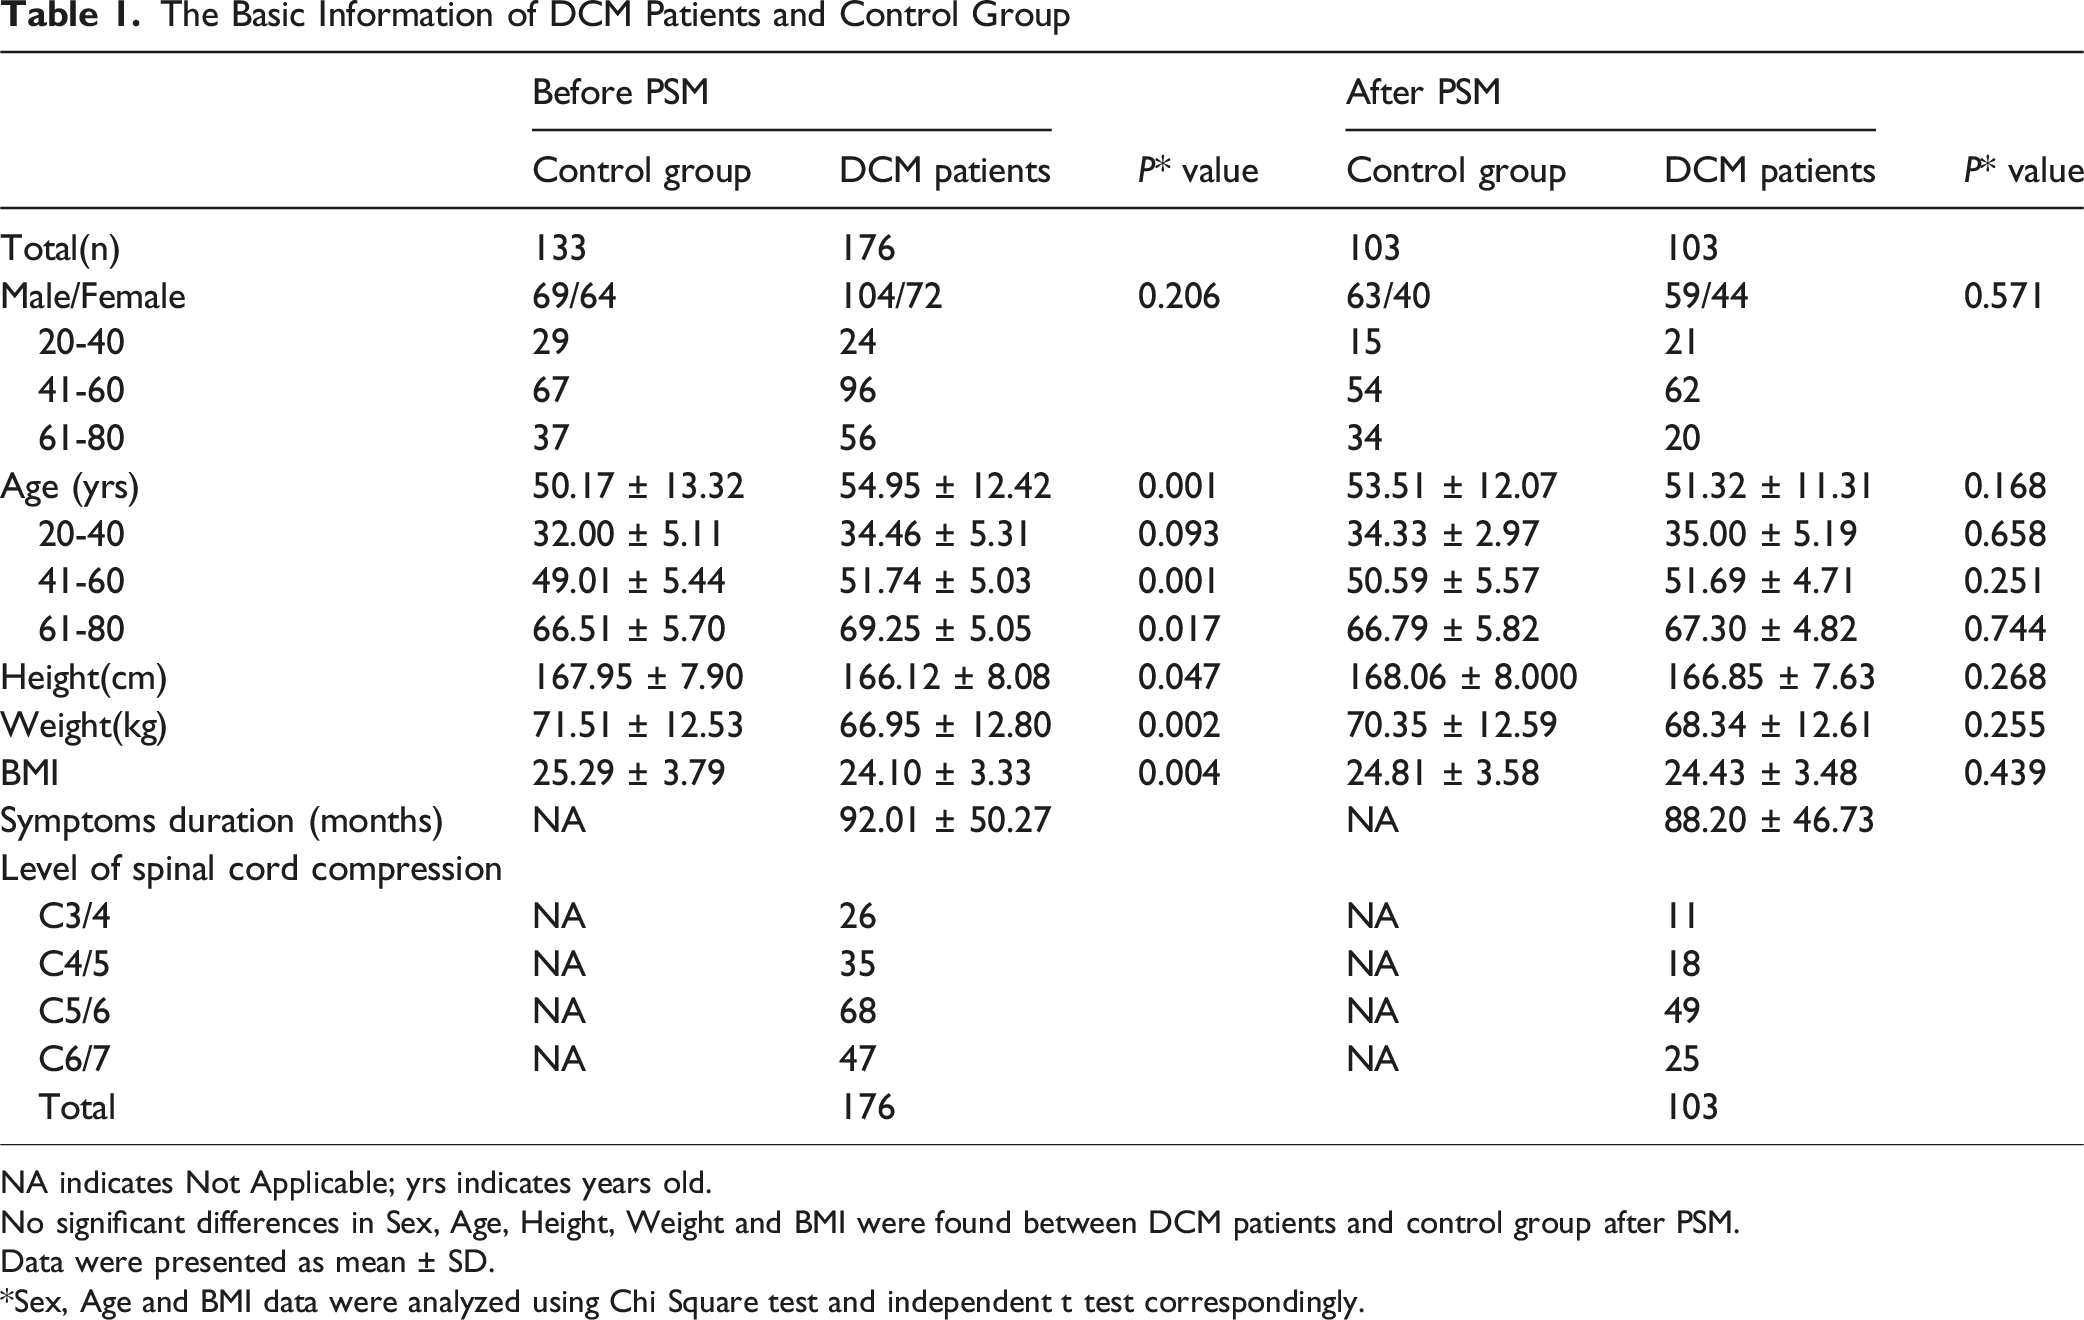
NA indicates Not Applicable; yrs indicates years old.
No significant differences in Sex, Age, Height, Weight and BMI were found between DCM patients and control group after PSM.
Data were presented as mean ± SD.
*Sex, Age and BMI data were analyzed using Chi Square test and independent t test correspondingly.
Image Acquisition
All examinations were performed on the same 3.0-T MRI system (uMR 770; United Imaging Healthcare, Shanghai, China) using a phased-array cervicothoracic spine coil with participants in the supine position. The routine protocol included sagittal T1-weighted and T2-weighted turbo spin-echo (TSE) sequences and an axial T2-weighted TSE sequence to assess canal stenosis and spinal cord compression.
DTI was acquired with a single-shot spin-echo echo-planar imaging (SE-EPI) axial sequence covering the C1–C7 spinal cord. Key parameters were as follows: repetition time (TR), 6836 ms; echo time (TE), 82.7 ms; flip angle, 90°; field of view (FOV), 250 × 230 mm2; acquisition matrix, 128 × 128; slice thickness, 4.0 mm (no interslice gap); voxel size, approximately 1.95 × 1.95 × 4.00 mm3; phase-encoding direction anterior-to-posterior; bandwidth, 1630 Hz/pixel; parallel imaging acceleration factor, 2; number of excitations (NEX), 4, with fat suppression. Bipolar diffusion gradients were applied with b values of 0 and 900 s/mm2 in 24 noncollinear directions; the b = 0 image was acquired twice to improve the signal-to-noise ratio. Automated shimming and coil optimization were performed before each scan. Total acquisition time was 13 min 26 s.
ROI Selection and Measurements
DTI parameters were measured by 2 radiologists. Five levels (C1/2, C3/4, C4/5, C5/6, and C6/7) were measured in the healthy group (Figure 2A). The C1/2 level (reference value) and the compressed levels (C3/4-C6/7) were measured in the DCM group (Figure 2B). By further subdividing the anatomical structure of the spinal cord, the spinal cord cross-section was divided into 4 regions: gray matter (GM), dorsal funiculi (DF), ventral funiculi (VF), and lateral funiculi (LF). Symmetrical ROI selection was performed for these regions to improve the accuracy of the assessment at the corresponding level (Figure 2D).22,23 FA (Figure 3B, F), ADC (Figure 3D, H), and RA (Figure 3C, G) were measured in 2 symmetrical ROIs. Each ROI was measured independently by 2 radiologists, and the mean value was used for analysis. Interobserver agreement for FA, ADC, and RA measurements was evaluated using intraclass correlation coefficients (ICCs). ROIs were placed as close as possible to the inner spinal cord to minimize partial volume effects because of the cerebrospinal fluid (CSF). If the absolute differences between the 2 readers exceeded 1 × 10⁻³ mm2/s for ADC, 0.5 for FA, or 0.5 for RA, the measurements were repeated and the final values were recorded. These thresholds were used as internal quality-control criteria rather than externally validated cutoff values. For the control group, the FA ratios, ADC ratios, and RA ratios at the C3/4-C6/7 levels were calculated using the original values at the C3/4-C6/7 levels, then divided by the corresponding values at the C1/2 levels. For the DCM group, the FA ratios, ADC ratios, and RA ratios at the compressed level were calculated using the original values at the compressed level divided by the corresponding values at the C1/2 levels. Sagittal MRI T2WI and ROI selection method. (A) Control group images. DTI ratios of the WM (VF, LF, and DF) and central GM at the C3/4, C4/5, C5/6, and C6/7 levels were calculated using the original values at the C3/4-C6/7 levels and dividing by the corresponding values at their C1/2 levels. (B) Images of the DCM patients. DTI ratios of the WM (VF, LF, and DF) and central GM were measured and calculated at the most compressed levels (C5/6) and at the corresponding C1/2 levels. (C) Schematic of spinal cord cross-section and ROI partitioning: central gray matter (GM, gray), dorsal funiculi (DF, red), ventral funiculi (VF, green), and lateral funiculi (LF, blue). (D) ROIs are placed bilaterally and with equal area within each region

Statistical Analysis
Data are presented as mean ± standard deviation (SD) and were analyzed using IBM SPSS Statistics (version 27.0; IBM Corp., Armonk, NY, USA). ROC analyses were performed in R (version 4.4.1) using the pROC package. Interobserver agreement was assessed using intraclass correlation coefficients (ICCs) based on a two-way random-effects model with absolute agreement. Both single-measure ICC [ICC (2,1)] and average-measure ICC [ICC (2,2)] with 95% confidence intervals were calculated. Because the mean of the 2 readers was used for subsequent analyses, ICC (2,2) was considered the primary reliability index. Baseline data were analyzed by chi-square test and independent-samples t-test. One-way analysis of variance (ANOVA) and the Student-Newman-Keuls (SNK) post hoc test were used to analyze the data among age subgroups. Before Pearson correlation analysis, linearity, approximate normality, and the presence of influential outliers were assessed by visual inspection of scatterplots and distributions. Pearson correlation coefficients were calculated to determine the associations between clinical measures (JOA, VAS, Nurick grade, and symptom duration) and DTI metrics. The diagnostic performance of FA, ADC, and RA ratios was assessed using ROC curve analysis. DeLong’s test was used to compare AUCs among ratios. A two-tailed P < 0.05 was considered statistically significant. Internal validation was performed using stratified bootstrap resampling with out-of-bag (OOB) evaluation (1000 resamples).
Results
Characteristics of Participants
The information of 2 groups was shown in Table 1. The healthy group consisted of 69 males and 64 females. The mean age was 51.3 years (range 20-77 years). A total of 176 patients with single-level DCM were included (104 males and 72 females). After PSM, 103 matched pairs were obtained, 59 males and 44 females in DCM group corresponding to 63 males and 40 females in the healthy group. Mean ages were 54.95 years (range 26-78 years) and 51.32 years (range 26–78 years), before and after PSM. The symptom duration was 92.01 months (range 3-180 months) and 88.20 months (range 8–180 months), respectively. The compressed level was C3/C4 in 26 patients (11, after PSM), C4/C5 in 35 (18, after PSM), C5/C6 in 68 (49, after PSM), and C6/C7 in 47 (25, after PSM). The selection bias of age and BMI was effectively reduced after PSM. The JOA scores ranged from 6 to 15 (11.56 ± 1.72).
Comparison of DTI Ratios in Age Subgroups
Comparison of the FA Ratios, ADC Ratios and RA Ratios Among Different Age Subgroups in Controls
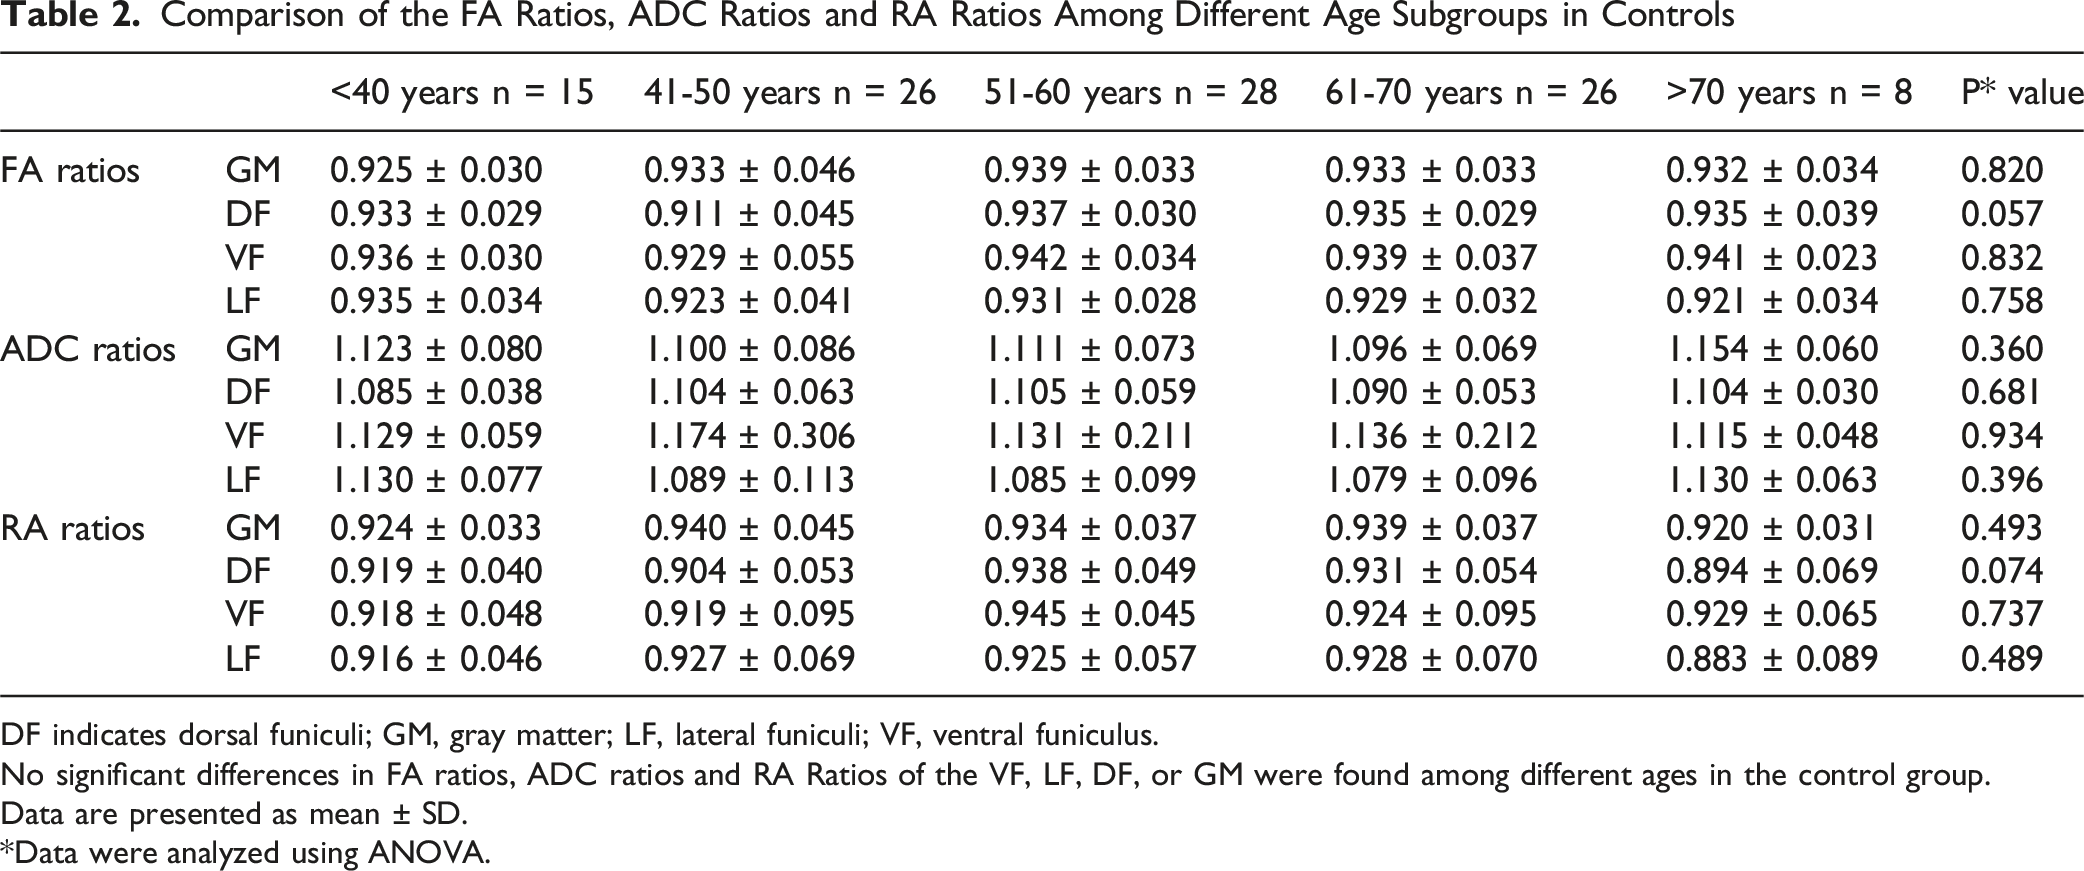
DF indicates dorsal funiculi; GM, gray matter; LF, lateral funiculi; VF, ventral funiculus.
No significant differences in FA ratios, ADC ratios and RA Ratios of the VF, LF, DF, or GM were found among different ages in the control group.
Data are presented as mean ± SD.
*Data were analyzed using ANOVA.
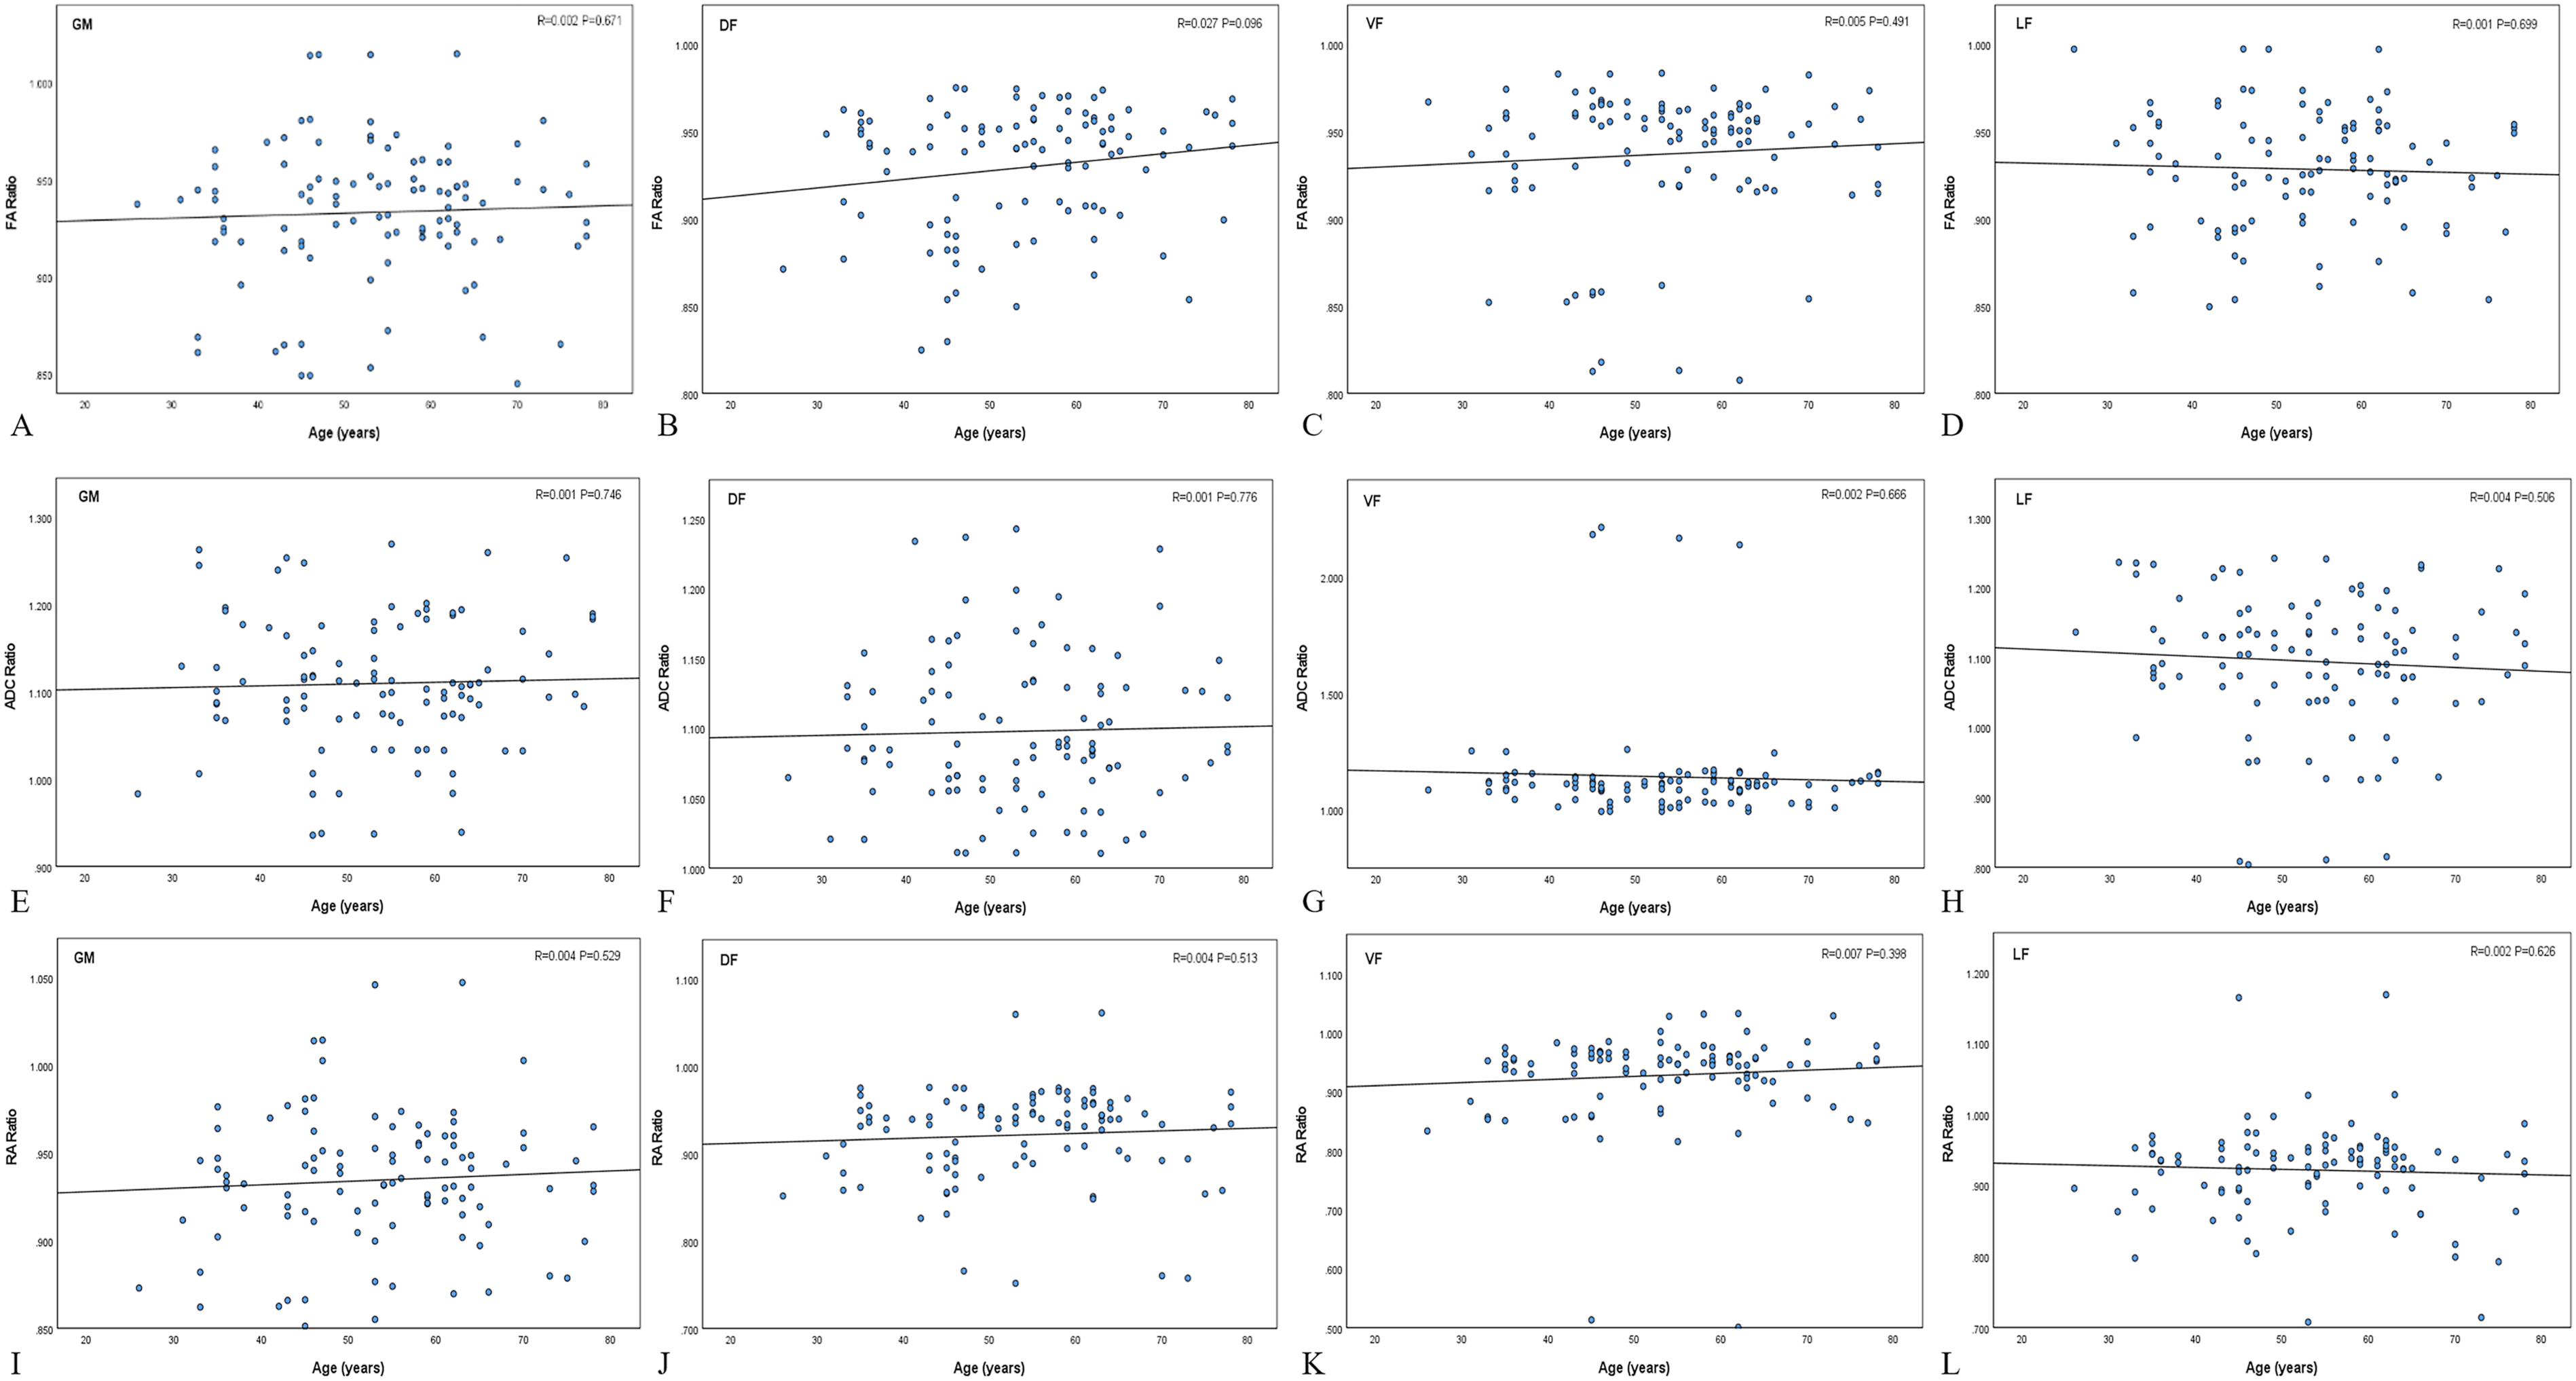
Correlation between FA ratio (A-D), ADC ratio (E-H) and RA ratio (I-L) with age in WM funiculi and GM. Scatter plots show the linear regression results for each region (GM, DF, VF, LF) with corresponding R and p values. Overall, no significant correlations were observed between the DTI ratios and age. All P > 0.05
Comparison of DTI Ratios and Absolute Values in DCM Group
Correlation Coefficients Between DTI Parameters, Parameter Ratios and the JOA Scores and Symptom Duration
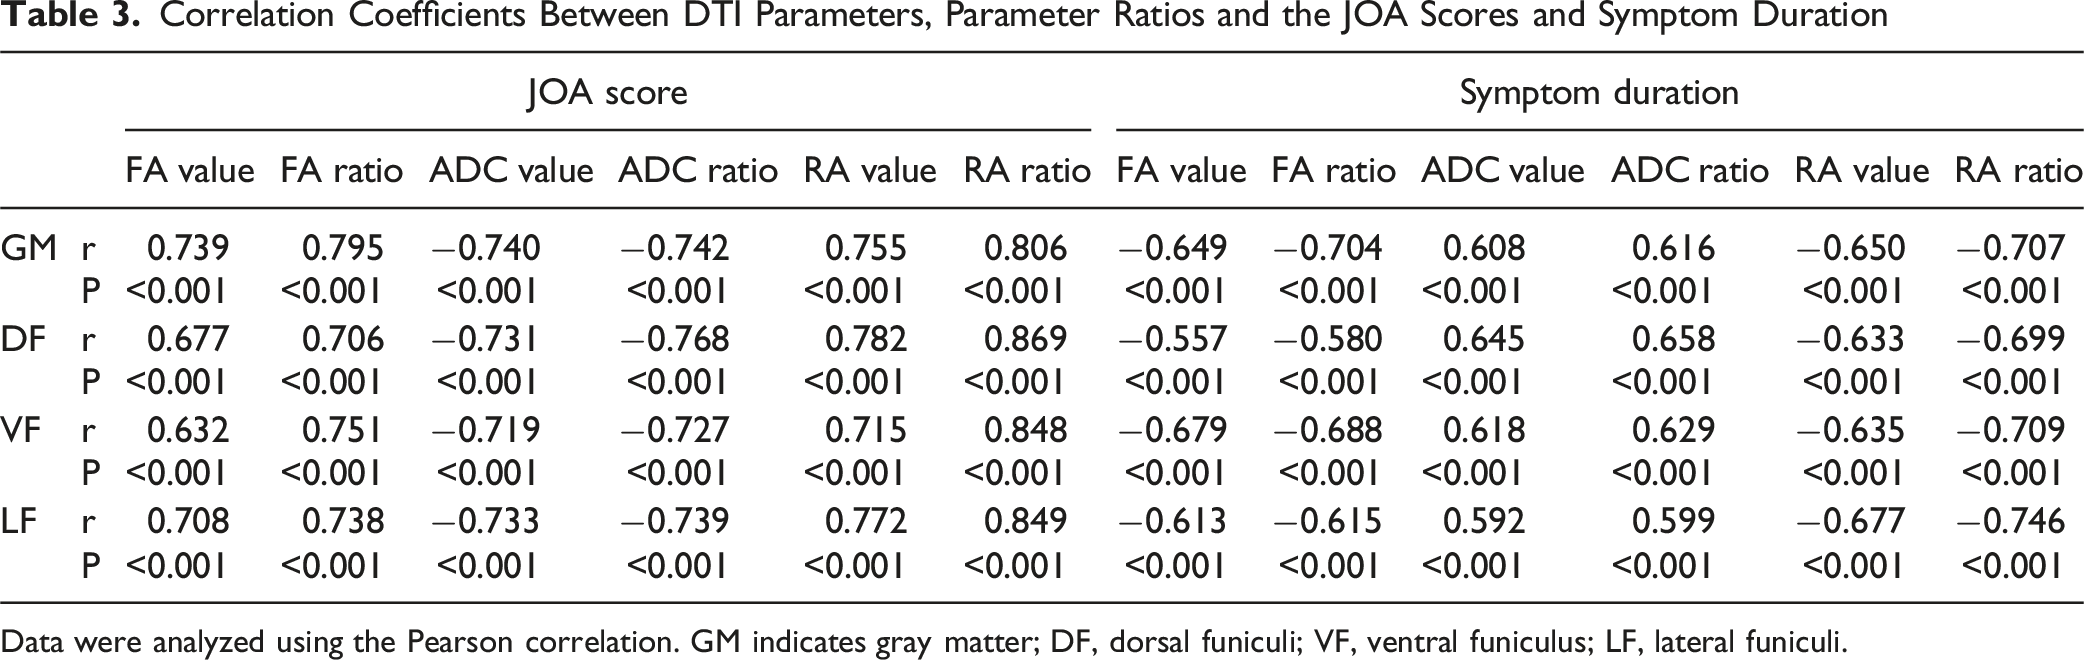
Data were analyzed using the Pearson correlation. GM indicates gray matter; DF, dorsal funiculi; VF, ventral funiculus; LF, lateral funiculi.
Correlation Coefficients Between DTI Parameters, Parameter Ratios and VAS and Nurick Grade
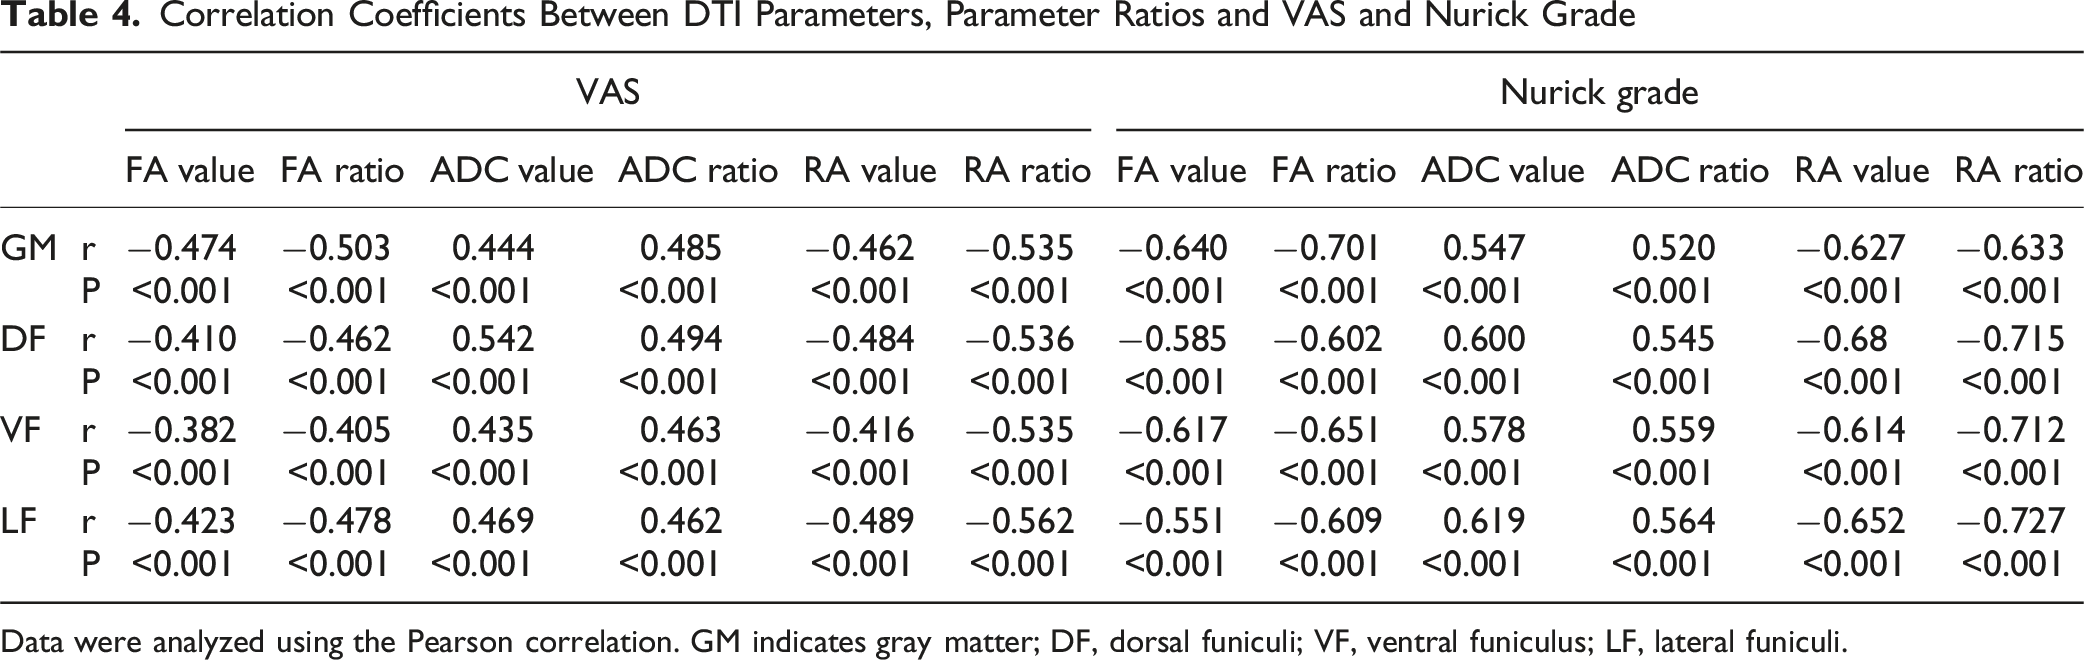
Data were analyzed using the Pearson correlation. GM indicates gray matter; DF, dorsal funiculi; VF, ventral funiculus; LF, lateral funiculi.
Correlations Between DTI Ratios and Clinical Measures
To summarize overall trends, we averaged each DTI parameter ratio across the 4 regions (GM, DF, VF, LF) and computed a Pearson correlation matrix between DTI ratios and 4 clinical measures (JOA, symptom duration, VAS, and Nurick grade) (Figure 5). As before, JOA showed strong positive correlations with the FA ratio (r = 0.794) and RA ratio (r = 0.896), and a strong negative correlation with the ADC ratio (r = −0.800). Symptom duration showed the opposite correlation signs: longer duration was associated with lower FA and RA ratios and higher ADC ratios, which is directionally consistent with more advanced microstructural injury. (FA ratio r = −0.689; RA ratio r = −0.760; ADC ratio r = 0.673). The other 2 clinical measures, VAS and Nurick grade, mirrored these directions: higher VAS and higher Nurick grade were associated with lower FA (VAS r = −0.488; Nurick r = −0.681) and lower RA (VAS r = −0.576; Nurick r = −0.742), but with higher ADC (VAS r = 0.512; Nurick r = 0.589). Among the imaging metrics, the RA ratio yielded the largest magnitudes across all 4 clinical dimensions—function (JOA), chronicity (duration), pain (VAS), and gait/disability (Nurick). All P < 0.001. Correlation matrix of DTI parameter ratios (FA, ADC, RA) with clinical measures (JOA score, symptom duration, VAS, and Nurick grade). Pearson correlation coefficients are displayed for each pair, with positive and negative correlations indicated by warmer and cooler colors, respectively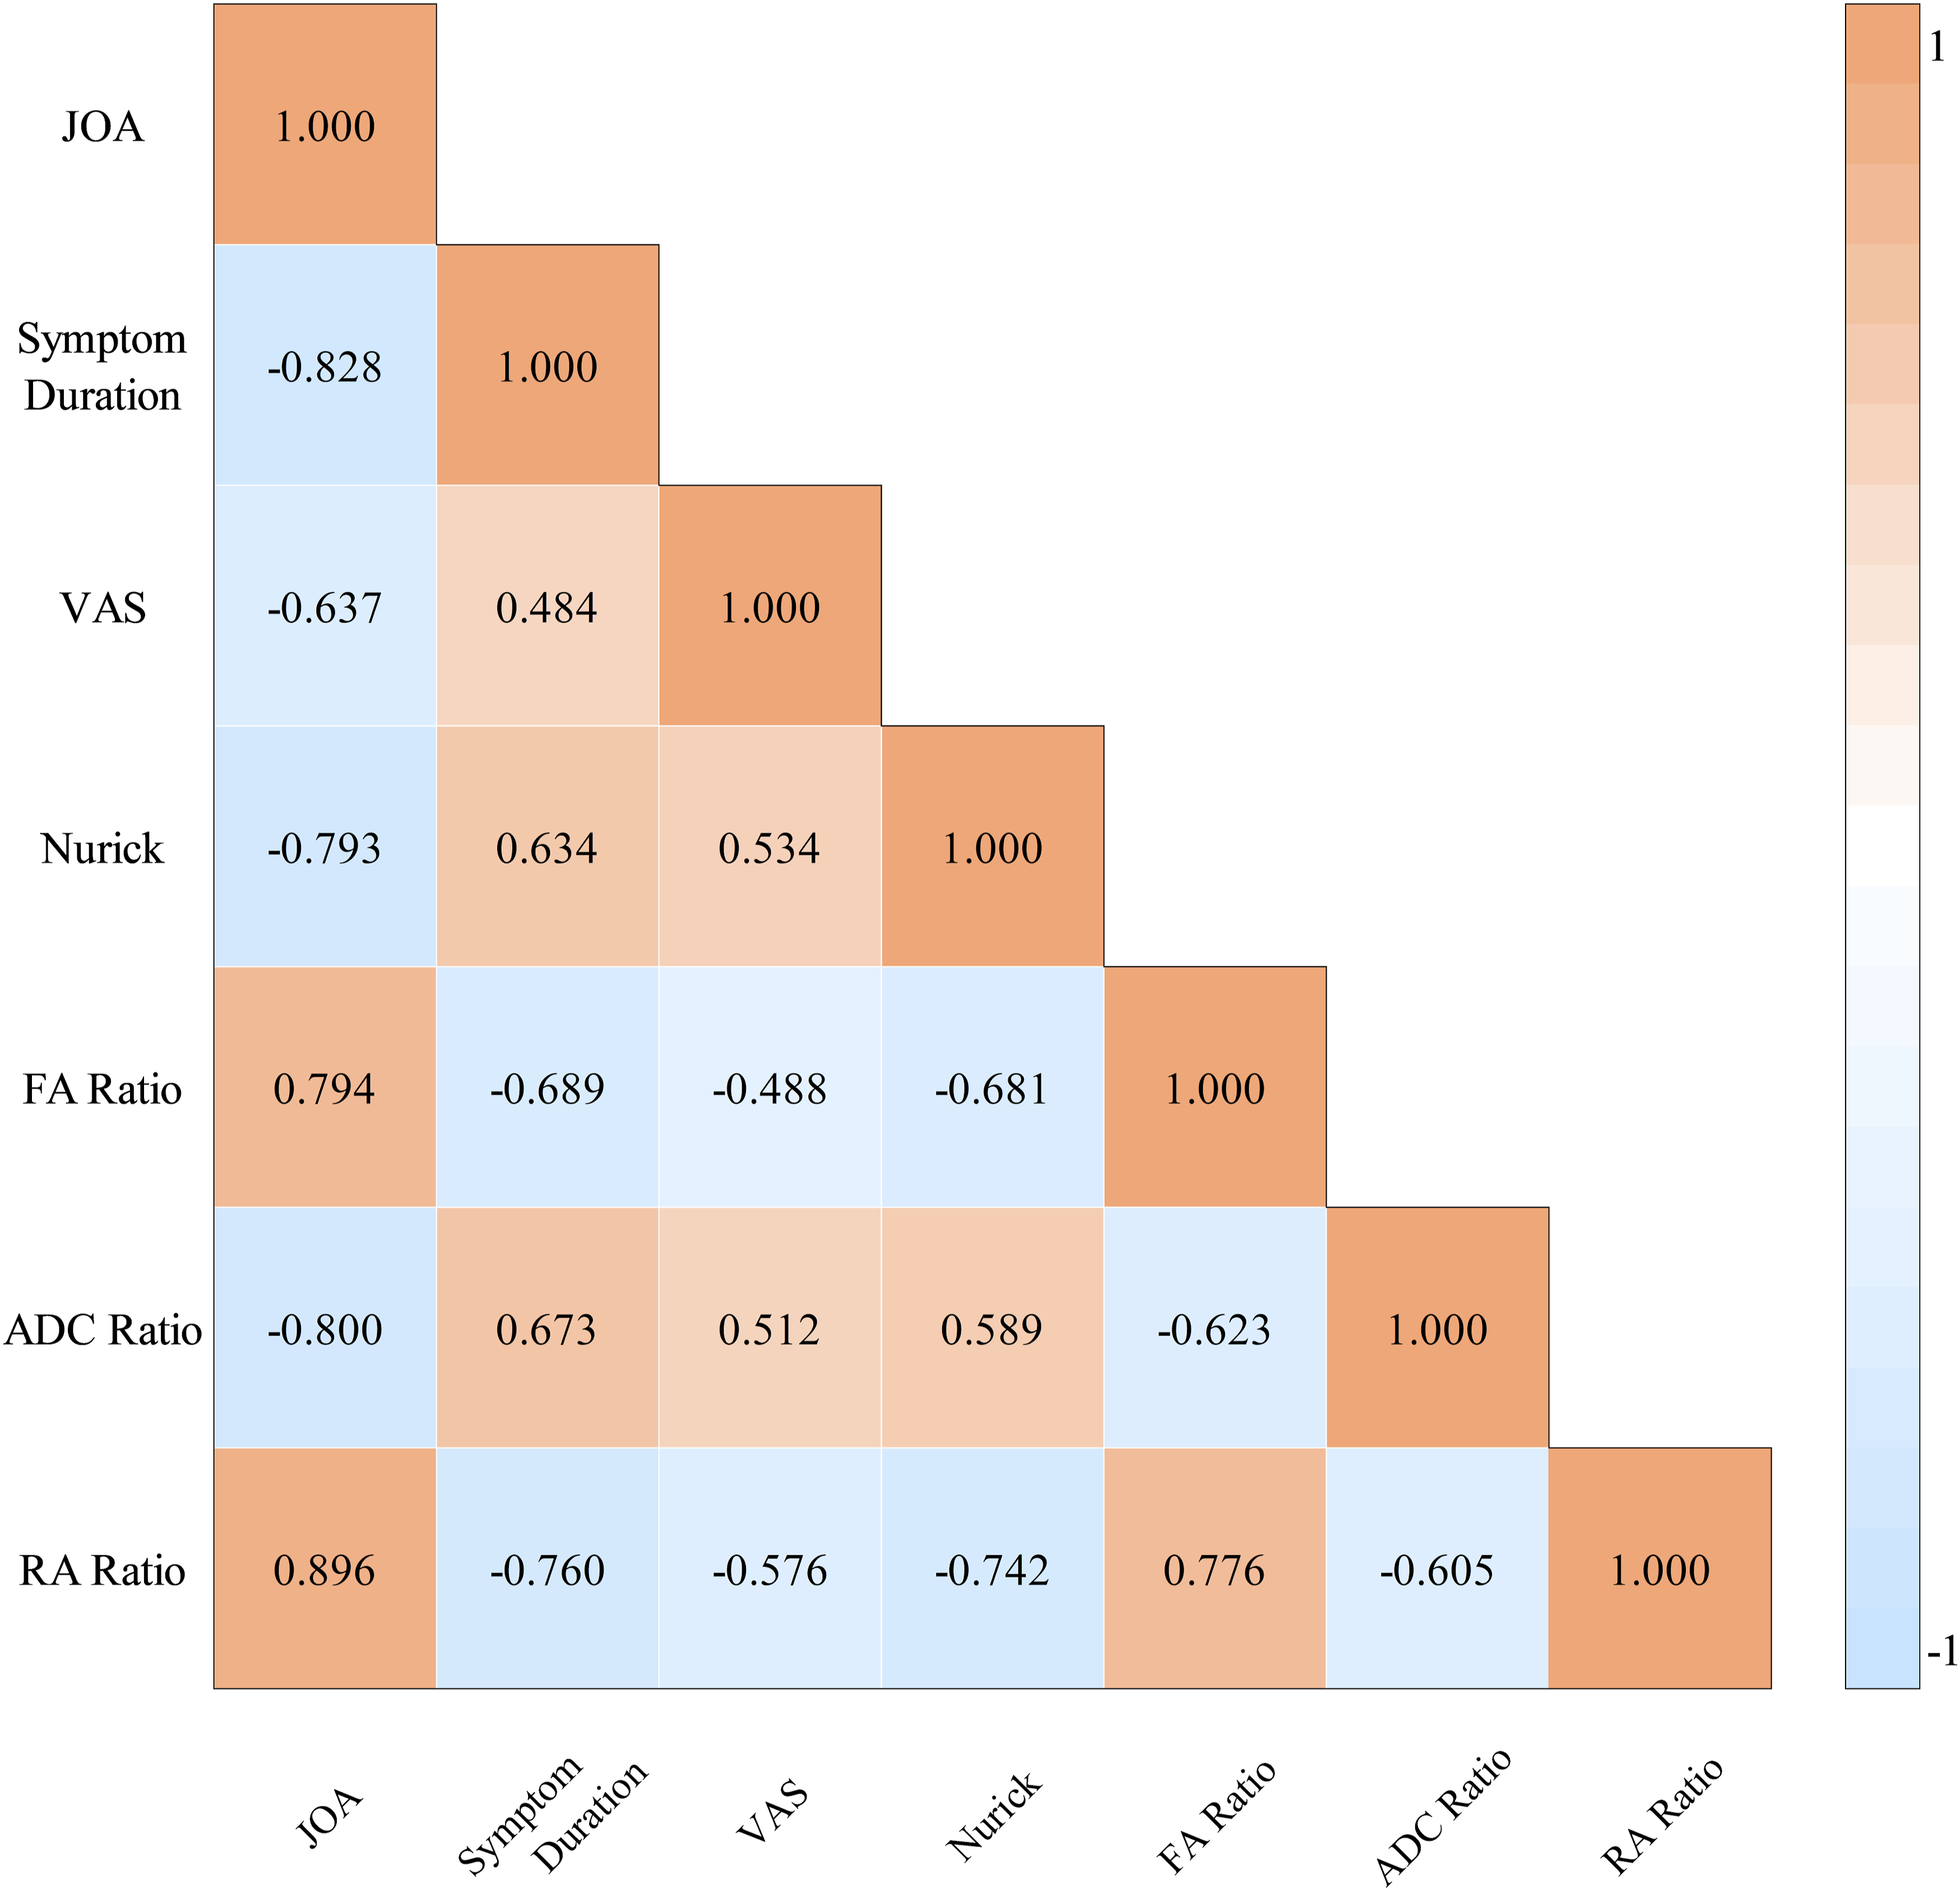
ROC Analysis of DTI Ratios
To reduce optimism associated with deriving cut-offs and estimating performance in the same dataset, we additionally performed stratified bootstrap internal validation with out-of-bag (OOB) evaluation (1000 resamples) (Table S2). In Figure 6, ROC analysis showed an AUC of 0.927 for the FA ratio (cut-off, 0.863; sensitivity, 98.06%; specificity, 83.50%; P < 0.001), with a bootstrap-derived 95% CI of 0.880-0.966. The ADC ratio yielded an AUC of 0.939 (cut-off, 1.188; sensitivity, 90.29%; specificity, 95.15%; P < 0.001), with a 95% CI of 0.897-0.976. The RA ratio achieved the highest AUC (0.981; cut-off, 0.844; sensitivity, 98.07%; specificity, 96.12%), with a 95% CI of 0.956-0.998. DeLong’s test showed significant differences between RA and FA (P = 0.007) and between RA and ADC (P = 0.021), whereas FA and ADC did not differ significantly (P = 0.081). ROC curves and bootstrap internal validation of the FA ratio, ADC ratio, and RA ratio. (A) FA ratio; (B) ADC ratio; (C) RA ratio. The colored solid line indicates the apparent ROC curve based on the full dataset, and the light blue curves indicate bootstrap ROC curves from 1,000 resamples. The dashed diagonal line represents the reference line. These plots illustrate the apparent discriminative performance and its internal stability for each ratio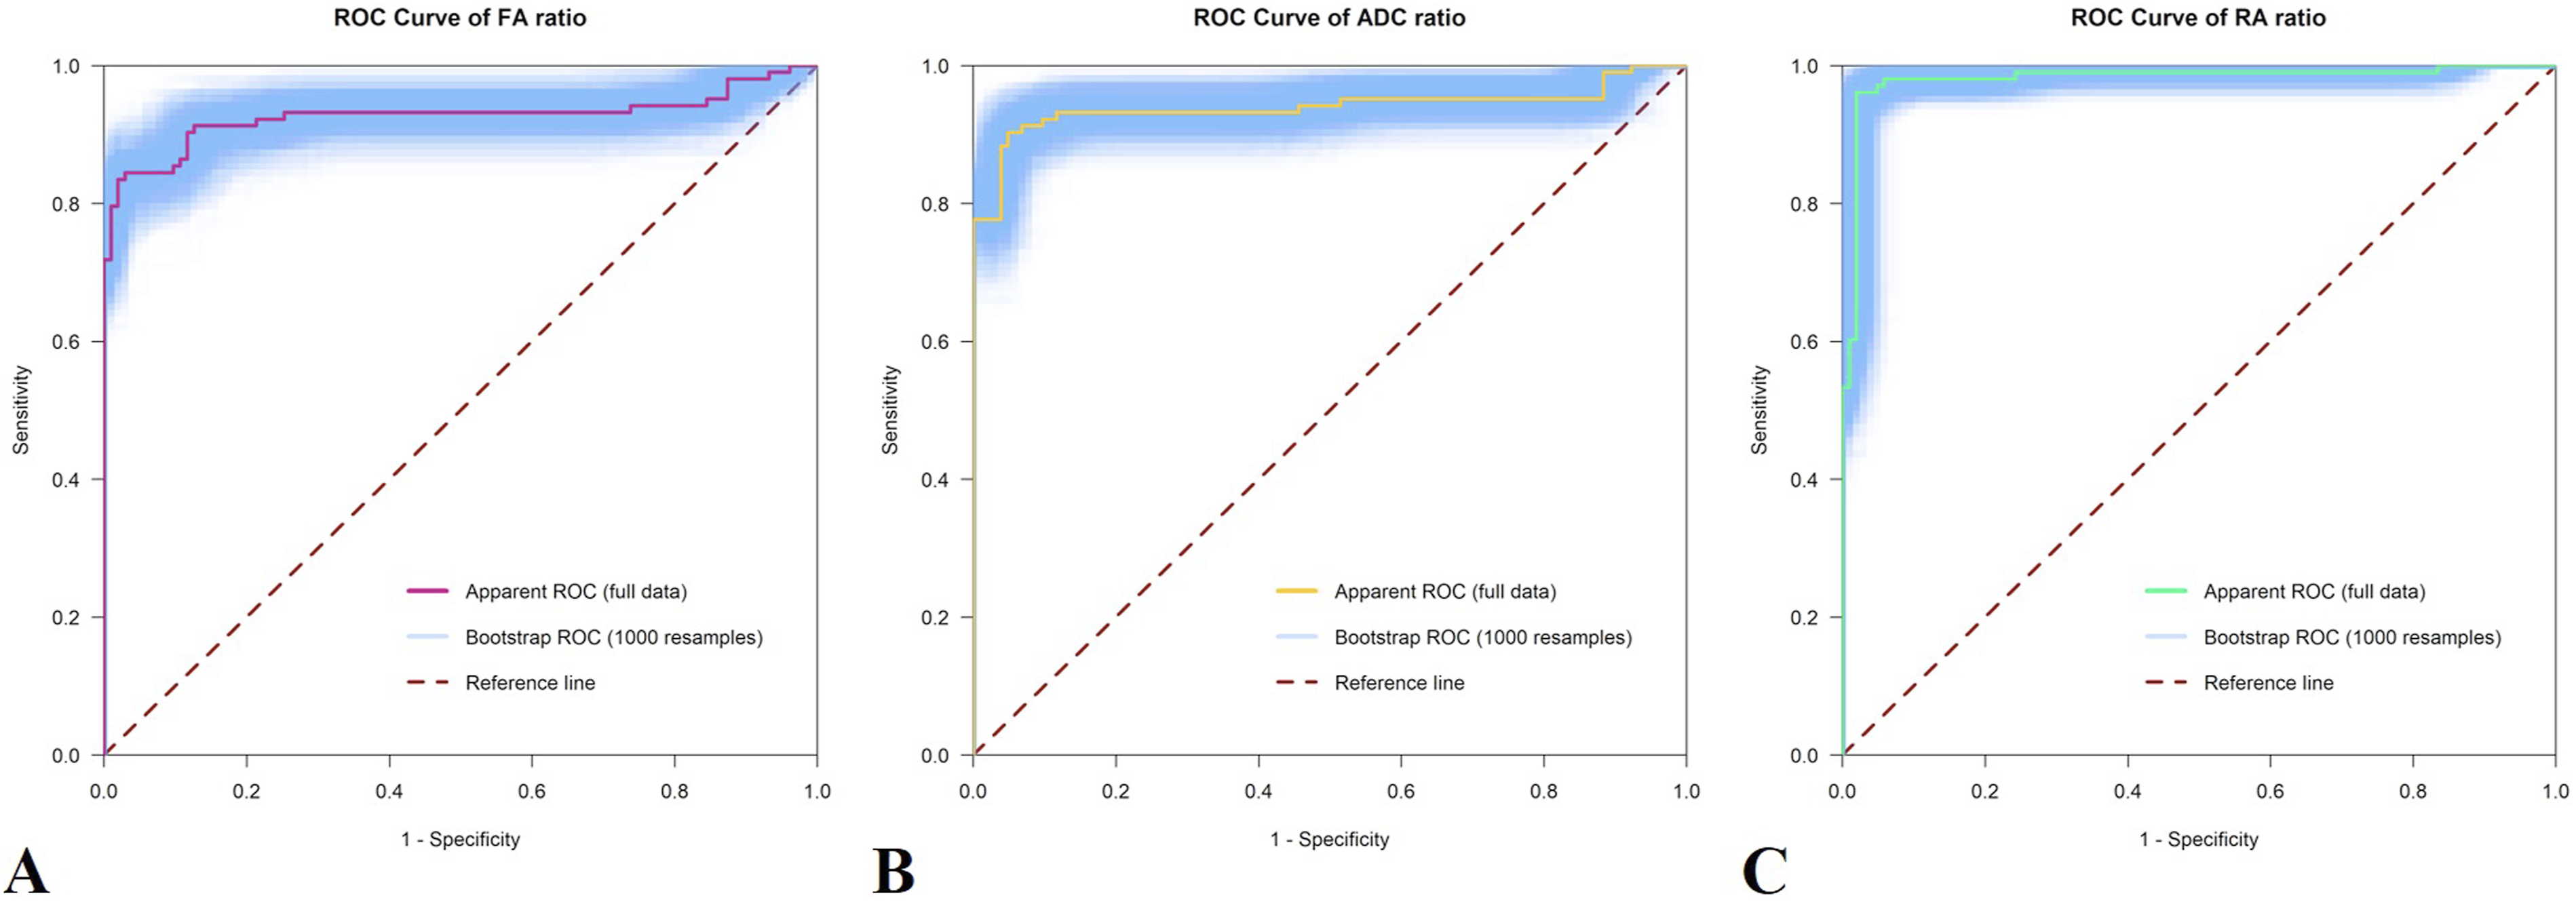
Discussion
In the present study, we observed that DTI parameter ratios exhibited stronger associations with JOA score, symptom duration, VAS, and Nurick grade than the corresponding absolute values. All 3 ratios were significantly associated with JOA score, symptom duration, VAS, and Nurick grade, with the RA ratio showing the strongest correlations. Consistently, ROC analysis demonstrated a larger AUC for the RA ratio, supporting its superior diagnostic performance compared with the FA and ADC ratios.
Although many studies have demonstrated significant associations between DTI metrics and clinical rating scales such as the JOA score, 17 several potential sources of bias must be considered, with age being one of the most important.15,24-26 Absolute DTI values are susceptible to age-related variation, interindividual baseline differences, and segment-dependent differences. So we normalized each parameter by calculating the ratio of the maximally compressed level to C1/2 to reduce systematic variability. 16 This likely explains, at least in part, why the ratio-based metrics outperformed the corresponding absolute values in our analyses. In addition, PSM was used to balance baseline characteristics between patients and healthy controls, thereby minimizing confounding in the relationships between DTI ratios and JOA score or symptom duration. Furthermore, because previous work has shown that DTI metrics vary across cervical levels, 24 we established a relatively large cohort but restricted inclusion to single-level DCM and placed ROIs at the maximally compressed segment for analysis.
Previous studies have consistently demonstrated decreased FA and increased ADC at the compressed level in DCM,8-12 with these changes correlating inversely with JOA scores. However, the behavior of RA has rarely been reported. In this context, our data further show that, within the same analytic framework, the RA ratio provides greater discriminative ability and stronger correlations with clinical measures than the FA and ADC ratios. Prior studies have also reported diffuse increases in ADC across multiple ROIs in the absence of parallel FA changes, suggesting that ADC is more strongly influenced by edema and free water and is less specific for tract injury.27-30 Methodologically, the use of C1/2 as an internal reference and the adoption of compression-to-reference ratios in place of absolute values have been endorsed by several groups. 16 Moreover, we did not detect significant differences from controls in the upper cervical segments (eg, C1/2 and C2/3), indicating that the observed abnormalities are predominantly focal, although potential remote or Wallerian degeneration cannot be entirely excluded. Taken together, these findings extend the evidence linking microstructural abnormalities at the compressed segment with clinical phenotype, and suggest that the RA ratio may be the most informative adjunctive imaging marker among the evaluated DTI ratios according to ROC-derived performance.
JOA score is one of the most widely used instruments for grading the severity of DCM. 19 VAS and the Nurick grade are also widely used.20,21 However, these scales inevitably incorporate subjective components, and changes in the score do not necessarily map linearly onto the extent of spinal cord microstructural damage. In view of this subjectivity and nonlinear scaling, the RA ratio may serve as an objective quantitative marker that complements the JOA score and other clinical assessments for patient stratification and follow-up. A growing body of evidence suggests that DTI-derived metrics may function as potential imaging biomarkers of cervical spinal cord pathology.31-33 Nevertheless, few studies have systematically addressed which specific DTI parameter offers superior performance in capturing microstructural injury and discriminating DCM, which constitutes the primary focus of the present work.
From the tensor eigenvalue decomposition, ADC primarily reflects the overall magnitude of isotropic diffusion within a voxel and increases in the presence of edema or excess free water. 34 In contrast, FA and RA characterize the dispersion of the 3 eigenvalues (ie, the degree of diffusion anisotropy), and are therefore closely related to axonal coherence and myelin integrity. 35 RA can be defined as the ratio between the anisotropic and isotropic components of the diffusion tensor, whereas FA is an equivalent rotationally invariant index of anisotropy bounded between 0 and 1. 36 The 2 measures are monotonically related but differ in numerical scaling, with RA providing a wider dynamic range in regions of intermediate anisotropy. 37 Based on these considerations, we infer that RA may be more sensitive to microstructural changes of the spinal cord. In degenerative cervical spinal cord compression, chronic ischemia, demyelination, and axonal degeneration lead to loss of fiber organization, typically manifesting as a combination of decreased FA, RA and increased ADC, 38 a pattern that has been repeatedly associated with greater clinical severity. This could also explain why scales that quantify neurological dysfunction from myelopathy are expected to align more closely with anisotropy-based DTI ratios than with VAS. 39 These conceptual differences provide a parsimonious explanation for our finding that the RA ratio demonstrates stronger correlations with JOA and Nurick than with VAS, supporting the role of RA ratio as an objective biomarker that complements clinical scales rather than replacing clinical assessment. Within the present normalization framework, because ADC is additionally modulated by edema and other nonspecific water-content changes, the RA ratio highlights alterations in the anisotropic component relative to the isotropic component, thereby enhancing the contrast for fiber disorganization and myelin injury. This mechanism provides a plausible explanation for the superior correlations and discriminative performance of the RA ratio compared with the FA and ADC ratios in our cohort. It should be noted, however, that the advantages of RA-based metrics are contingent on sufficient signal-to-noise ratio and rigorous distortion and motion correction to avoid bias in anisotropy estimates.37,40
Several limitations should be acknowledged. First, this was a single-center study that included only patients with single-level DCM. Restricting analysis to the maximally compressed level may enhance contrast between groups but could also overestimate diagnostic performance relative to real-world heterogeneity. 10 Second, the inter-scanner and intra-observer reproducibility of the proposed metrics remains to be confirmed under more rigorously standardized acquisition and post-processing protocols. 41 Although C1/2 served as a pragmatic internal reference for normalization in this study, it may not represent a universally optimal solution. Future work should systematically compare alternative normalization strategies to establish more standardized approaches. In addition, although the DTI parameter ratios provide complementary quantitative information, they should be regarded as exploratory and are not intended to replace clinical assessment. Further validation in larger, independent cohorts is needed.42,43 Finally, whether the DTI parameter ratios provide a fully specific and biologically interpretable surrogate for the underlying microstructural alterations in the spinal cord requires additional validation in longitudinal and, where feasible, correlative pathological studies.
Conclusion
Compared with absolute DTI values, DTI parameter ratios effectively attenuated age-related bias. Among these ratios, the RA ratio showed stronger associations with 3 clinical scales and symptom duration. In the ROC analysis, the RA ratio yielded a larger area under the curve than the FA and ADC ratios, indicating the highest diagnostic performance.
Supplemental Material
Supplemental Material - Comparison of DTI Parameter Ratios for Early Diagnosis of Degenerative Cervical Myelopathy
Supplemental Material for Comparison of DTI Parameter Ratios for Early Diagnosis of Degenerative Cervical Myelopathy by Chenfei Gao, Jiale Cui, Jiayi Zhang, Tenghui Zhang, Zixi Wang, Wenyu Zhang, Jianxi Wang, Lei Liang, Bo Hu, Song Jiang, Huajiang Chen in Global Spine Journal
Footnotes
Ethical Consideration
This study was approved by the Ethics Committee of Shanghai ChangZheng Hospital (approval file No. 2024SL027).
Consent to Participate
All subjects signed informed consents.
Consent for Publication
We provided 2 different version of informed consents for the 2 groups of subjects to sign allowing their clinical data to be used for research and publication.
Author Contributions
Funding
The authors disclosed receipt of the following financial support for the research, authorship, and/or publication of this article: This research was supported by grants from Shanghai Changzheng Hospital Clinical Innovation Project (2023YJBF-PY03).
Declaration of Conflicting Interests
The authors declared no potential conflicts of interest with respect to the research, authorship, and/or publication of this article.
AO Membership Information
Huajiang Chen (last author), AO id: pp100017868; Bo Hu (additional author), AO id: pp100318000.
Supplemental Material
Supplemental material for this article is available online.
References
Supplementary Material
Please find the following supplemental material available below.
For Open Access articles published under a Creative Commons License, all supplemental material carries the same license as the article it is associated with.
For non-Open Access articles published, all supplemental material carries a non-exclusive license, and permission requests for re-use of supplemental material or any part of supplemental material shall be sent directly to the copyright owner as specified in the copyright notice associated with the article.