
Abstract
Study Design
Retrospective cohort study.
Objective
To establish a novel lumbar subcutaneous adipose classification (LSAC) based on sagittal MRI and determine its predictive value for surgical site infection (SSI) and postoperative adverse events (PAE) following posterior lumbar fusion.
Methods
A retrospective analysis of 1122 patients undergoing posterior lumbar interbody fusion was performed. Lumbar subcutaneous adipose distribution at the L3 endplate level was categorized into five types (Low, Cranial, Caudal, Cranial–Caudal, and Diffuse). Surgical segment subcutaneous fat thickness (SFT), facet joint to lumbar dorsal fascia distance (FJ–LDF), paraspinal muscle cross-sectional area, paraspinal muscle fat infiltration, and Modic changes were assessed. Associations between LSAC and SSI/PAE were examined using multivariate logistic regression.
Results
LSAC demonstrated excellent inter- and intra-observer reliability. Significant differences in patient characteristics were observed among the five types, with type 5 and type 2 showing higher BMI, diabetes and spondylolisthesis rate. SSI and PAE incidence were highest in type 5, followed by type 2. Multivariate analyses identified LSAC (OR 1.534, P = 0.007), BMI (OR 1.156, P = 0.010), transfusion (OR 1.002, P < 0.001), and smoking (OR 2.646, P = 0.035) as independent predictors of SSI; and LSAC (OR 1.477, P = 0.002), age (OR 1.037, P = 0.016), smoking (OR 2.607, P = 0.007), and higher drainage volume (OR 1.001, P < 0.001) as predictors of PAE. ROC curve demonstrated that LSAC was more sensitive than BMI and SFT to predict the SSI and PAE.
Conclusion
The LSAC system provides a simple, reproducible method for quantifying lumbar subcutaneous fat distribution and outperforms traditional single adiposity indices such as BMI or SFT in predicting postoperative complications. Type 5 and type 2 represent high-risk phenotypes requiring enhanced perioperative optimization and surveillance.
Keywords
Introduction
The global utilization of posterior lumbar fusion continues to rise, accompanied by a growing burden of postoperative complications.1,2 Among these complications, surgical site infection (SSI) represents one of the most clinically and economically impactful outcomes, resulting in prolonged hospitalization, increased readmissions and reoperations, and substantial healthcare expenditures.3-5 Numerous risk factors have been described, including elevated body mass index (BMI), diabetes mellitus, and urinary tract infections; however, the predictive value of BMI remains inconsistent across studies.3,6-8 Even Zhou et al 5 reported a contradictory SSI incidence of 3.2% in patients with BMI <25 kg/m2 compared to 2.9% in those with BMI ≥25 kg/m2. This inconsistency highlights a key limitation: BMI reflects generalized adiposity rather than regional fat relevant to posterior exposure and wound healing.
Accordingly, recent research has shifted toward measuring subcutaneous fat thickness (SFT) as a more direct, anatomical and localized surrogate index.9-12 Increased lumbar SFT has demonstrated stronger correlations with postoperative SSI risk, and novel indices—such as the spine adipose index (SAI)—have shown high reliability and predictive capability. 8 Despite these advances, SFT-based parameters vary widely in measurement location, require numeric quantification, and remain difficult to standardize or translate uniformly across institutions and patient cohorts.
In clinical practice, we observed that lumbar subcutaneous adipose distribution demonstrates distinct morphological patterns on mid-sagittal MRI—yet this spatial distribution characteristic has not been systematically characterized, classified, or assessed for clinical value. We hypothesized that pattern-based topography classification may provide a simpler, more intuitive, and clinically translatable tool for preoperative risk assessment compared with absolute thickness values alone.
Therefore, this study aimed: (1) to propose a novel MRI-based Lumbar Subcutaneous Adipose Classification (LSAC) system; (2) to examine the association between LSAC phenotypes and SSI/postoperative adverse events (PAE) following posterior lumbar fusion; and (3) to identify LSAC subtypes with elevated risk to support more accurate preoperative risk stratification and perioperative optimization.
Materials and Methods
Study Design and Patient Selection
This retrospective study included patients who underwent posterior lumbar fusion at the First Affiliated Hospital of Dali University between January 2014 and December 2019. Eligible patients were diagnosed with lumbar spinal stenosis (LSS), lumbar disc herniation (LDH), or lumbar spondylolisthesis (LS). Exclusion criteria included diagnosis not matching imaging findings, endoscopic procedures, kyphotic and/or scoliotic deformities, infectious spondylopathy, and incomplete MRI or CT data (Figure 1). This study adhered to STROBE guidelines and was approved by the institutional ethics committee (DFY20251111002), with informed consent waived due to anonymized data usage. Inclusion criteria for patients with LSS, DH, LS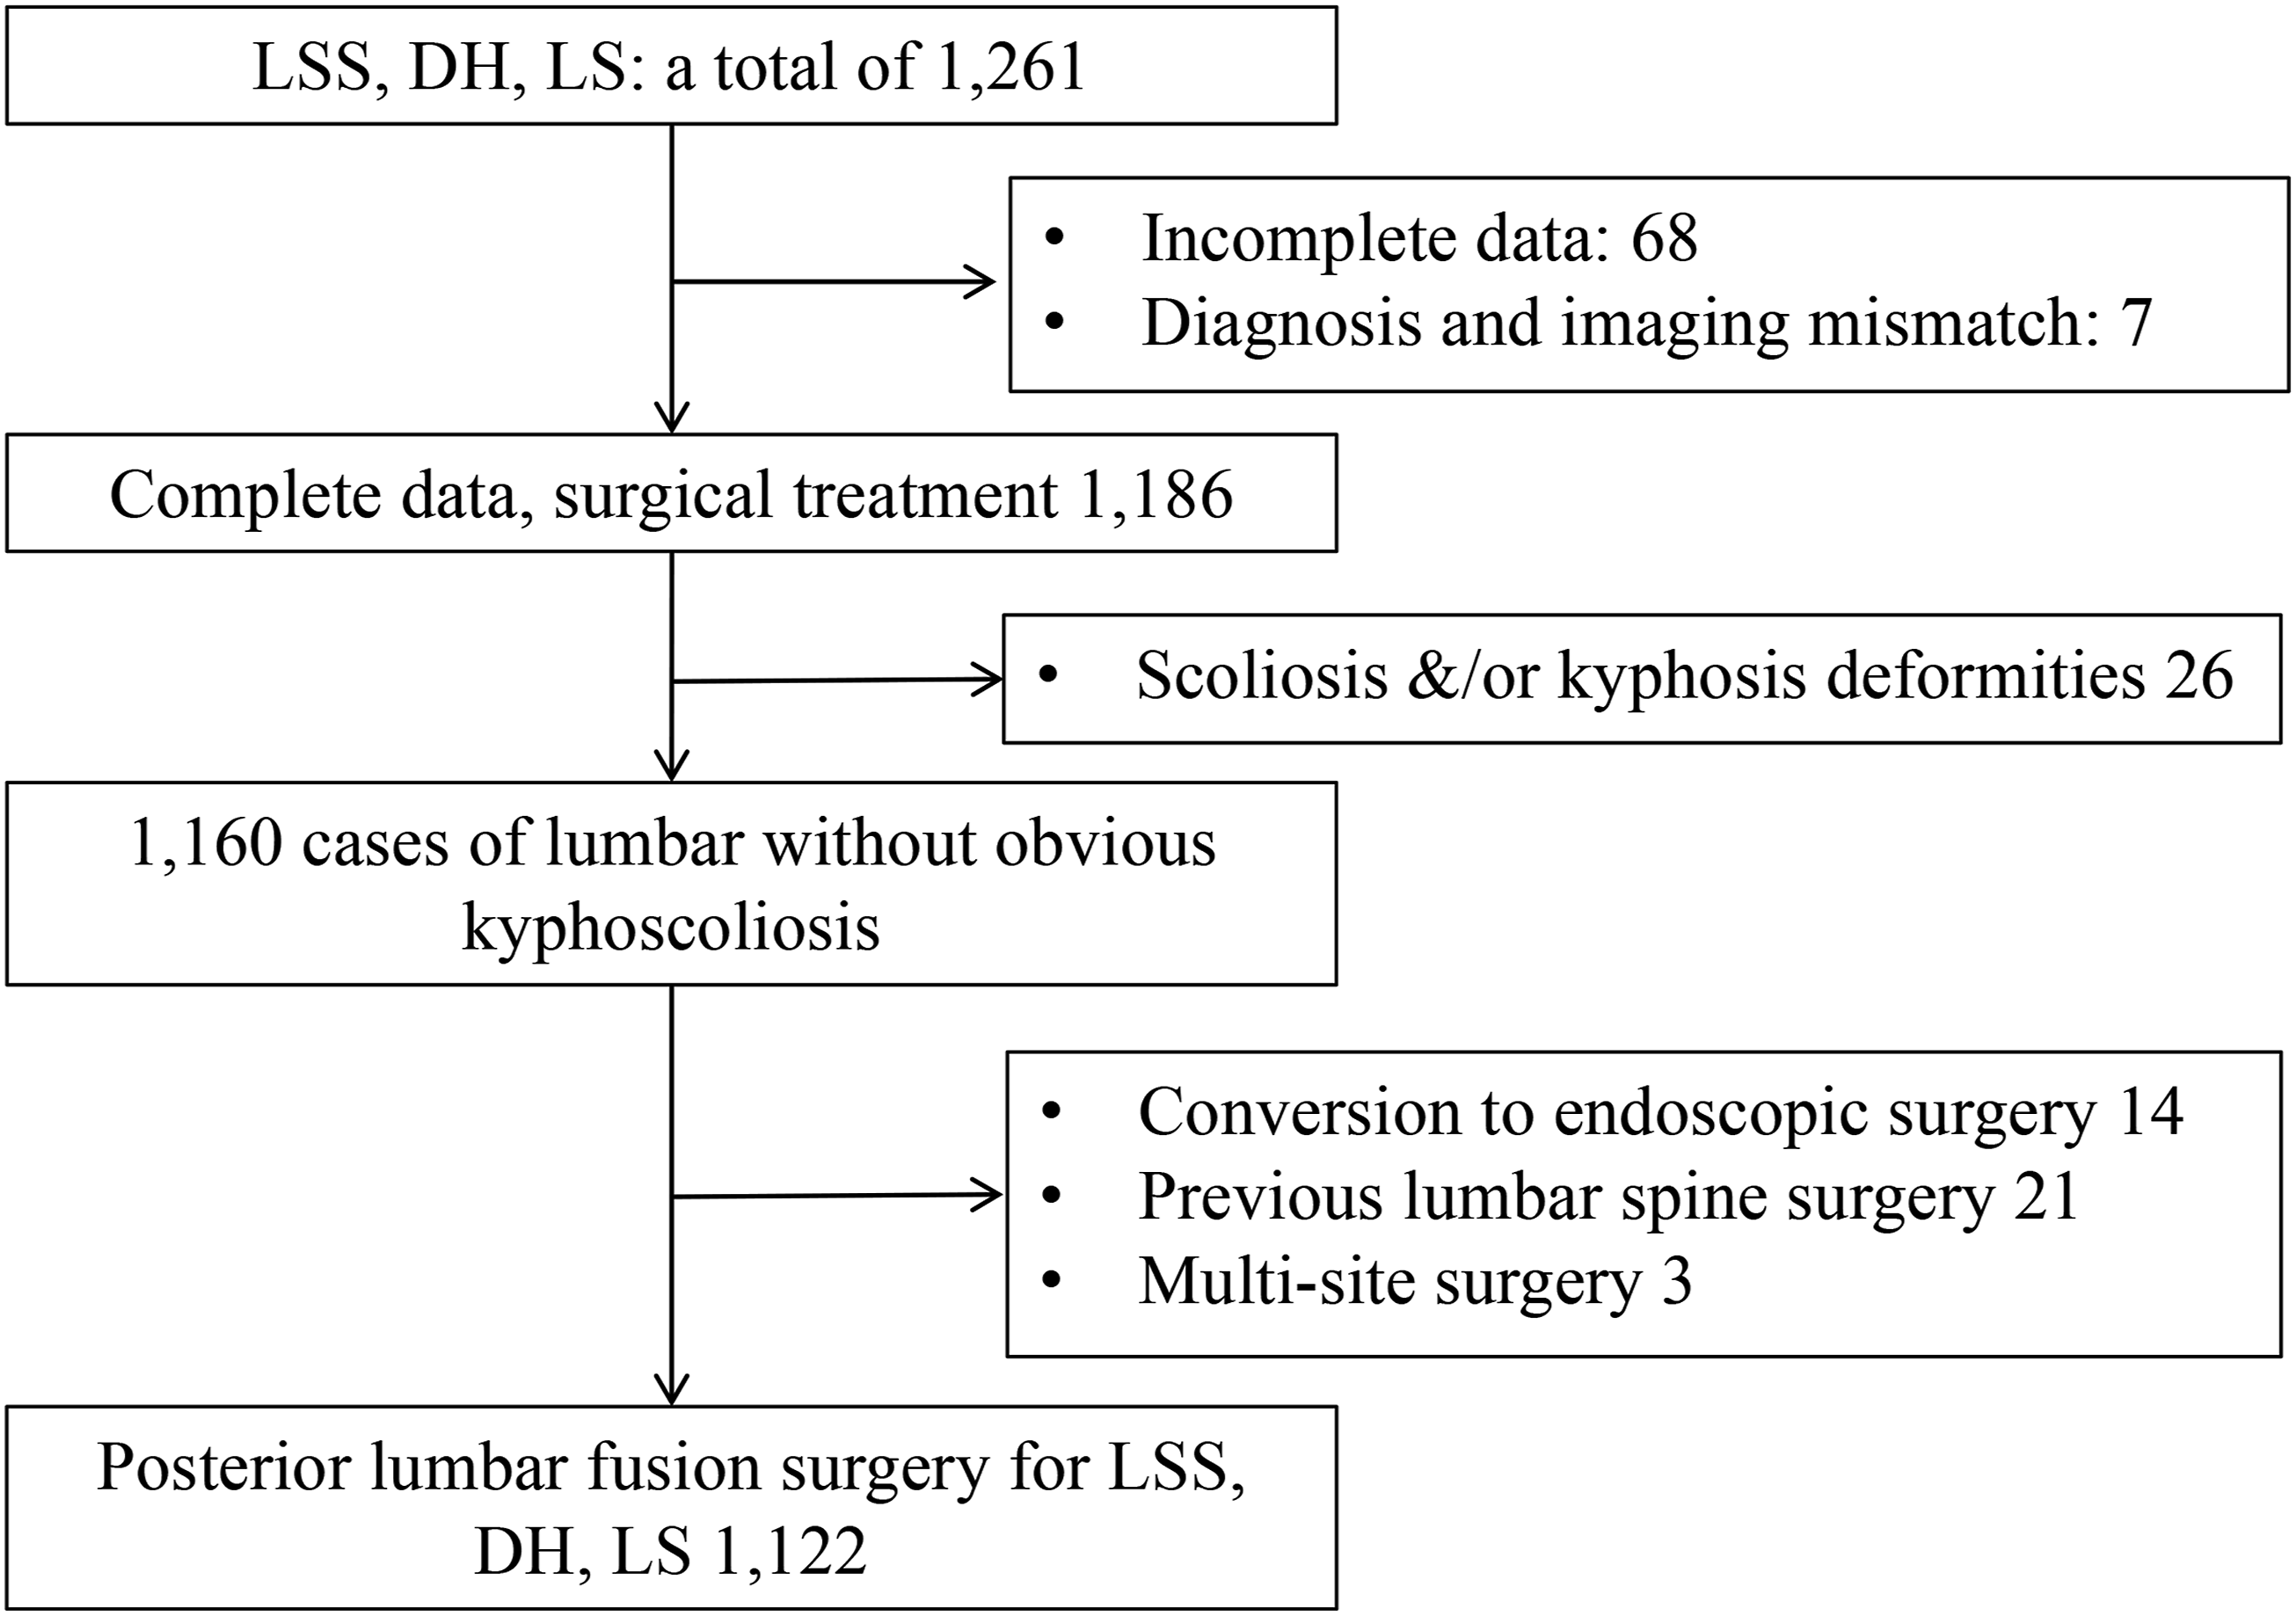
Clinical Data Collection
Clinical data of 1122 patients were collected, including demographic variables (age, sex, BMI, smoking, alcohol use, diabetes), operative variables (blood loss, postoperative drainage volume, blood transfusion volume, operative time, number of fused levels), and hospitalization duration (preoperative, postoperative, total stay). Postoperative complications recorded included surgical site infection (SSI), hematoma, neurological deficit, dural tear, and implant failure.
MRI-Based Lumbar Subcutaneous Adipose Classification (LSAC)
Lumbar MRI was performed using a 1.5-T scanner (Ingenia, Philips, Amsterdam, Netherlands) with a slice thickness of 3 mm. The L3 superior endplate was used as the boundary separating cranial and caudal segments. Based on mid-sagittal subcutaneous fat distribution, five LSAC subtypes were defined (Figure 2): Lumbar subcutaneous adipose classification (LSAC),A-E represent schematic diagrams of sagittal subcutaneous fat distribution patterns, while Aʹ-Eʹ show the corresponding T1-weighted sagittal MRI images illustrating: Type 1 (Low-adipose type, A/Aʹ); Type 2 (Cranially accumulated type, B/Bʹ); Type 3 (Caudally accumulated type, C/Cʹ); Type 4 (Cranial-Caudal accumulated type, D/Dʹ); Type 5 (Diffuse type, E/Eʹ)
Imaging Measurements
Subcutaneous Fat Thickness (SFT, mm) was measured posterior to the spinous process at the surgical level (Figure 3A). On axial MRI at the superior endplate of the surgical segment, the vertical distance from the facet joint apices to the lumbar dorsal fascia (FJ-LDF, mm) and the cross-sectional area (CSA) of the residual paraspinal muscles were measured and averaged (Figure 3B). Paraspinal muscle fatty infiltration was graded using the Kjaer visual scale (0: <10%, 1: 10-50%, 2: >50%)
13
(Figure 4). Modic changes were classified as Type 1, 2, or 3 according to standard criteria.
14
① Measurement of SFT directly posterior to the spinous process at the surgical segment (A, yellow line). ② Measurement of the vertical distance from the facet joint to the lumbar dorsal fascia (B, white double-headed arrow). ③ Measurement of the cross-sectional area of the paraspinal muscles (B, red dashed outline) Visual grading of paraspinal muscle fat infiltration in the lumbar region13: A, Mild fat infiltration (<10%); B, Moderate fat infiltration (≥10%, <50%); C, Severe fat infiltration (≥50%)

Outcome Measures
Three independent physicians collected clinical data. Three trained spine surgeons performed imaging measurements while being blinded to the classification method. After the data were collated, two senior spine surgeons (>6 years of experience) assessed paraspinal muscle fatty infiltration (visual grading) and Modic changes, and finally classified the LSAC.
Statistical Analysis
Statistical analyses were performed using IBM SPSS Statistics for Windows, version 25.0 (IBM Corp., Armonk, NY, USA). Measurement data were expressed as mean ± standard deviation (SD). Group comparisons were conducted using independent-samples t-tests or one-way analysis of variance (ANOVA), as appropriate. Correlation analysis and multivariate logistic regression were performed to identify independent predictors of SSI and PAE. Odds ratios (OR) and 95% confidence intervals (CI) were reported. Model assumptions were assessed prior to interpretation, all variance inflation factors (VIF) were less than 3, demonstrating low multicollinearity. 15 Receiver operating characteristic (ROC) curve analysis was performed to predict the sensitivity of SSI and PAE among LSAC, SFT and BMI. A P value <0.05 indicated statistical significance.
The reliability of the LSAC classification (Types 1-5) was assessed using Cohen’s к coefficients, evaluating both intra-observer reliability (two independent readings by a single observer, S.Y.W., with a 30-day interval) and inter-observer reliability (three independent observers: S.Y.W., X.D.G., W.G.). Agreement strength was graded based on the classification proposed by Landis and Koch16,17: к 0-0.20, slight agreement; 0.21-0.40, fair agreement; 0.41-0.60, moderate agreement; 0.61-0.80, substantial agreement; 0.81-0.99, excellent agreement; and 1.00, perfect agreement.
Results
Baseline Characteristics and Distribution of LSAC Types
A total of 1122 patients were included, consisting of 638 females, with a mean age of 54.84 ± 9.78 years (20-80 years). According to the LSAC classification, patients were stratified into five groups: Type 1 (350, 31.19%), Type 2 (223, 19.88%), Type 3 (19, 1.69%), Type 4 (195, 17.38%), and Type 5 (335, 29.86%). The LSAC classification demonstrated excellent intra-observer reliability (κ = 0.87, P < 0.001) and excellent inter-observer agreement (κ WSY-vs-GW = 0.84; κ WSY-vs-GXD = 0.81; κ GW-vs-GXD = 0.80; all P < 0.001).
General Demographic Data
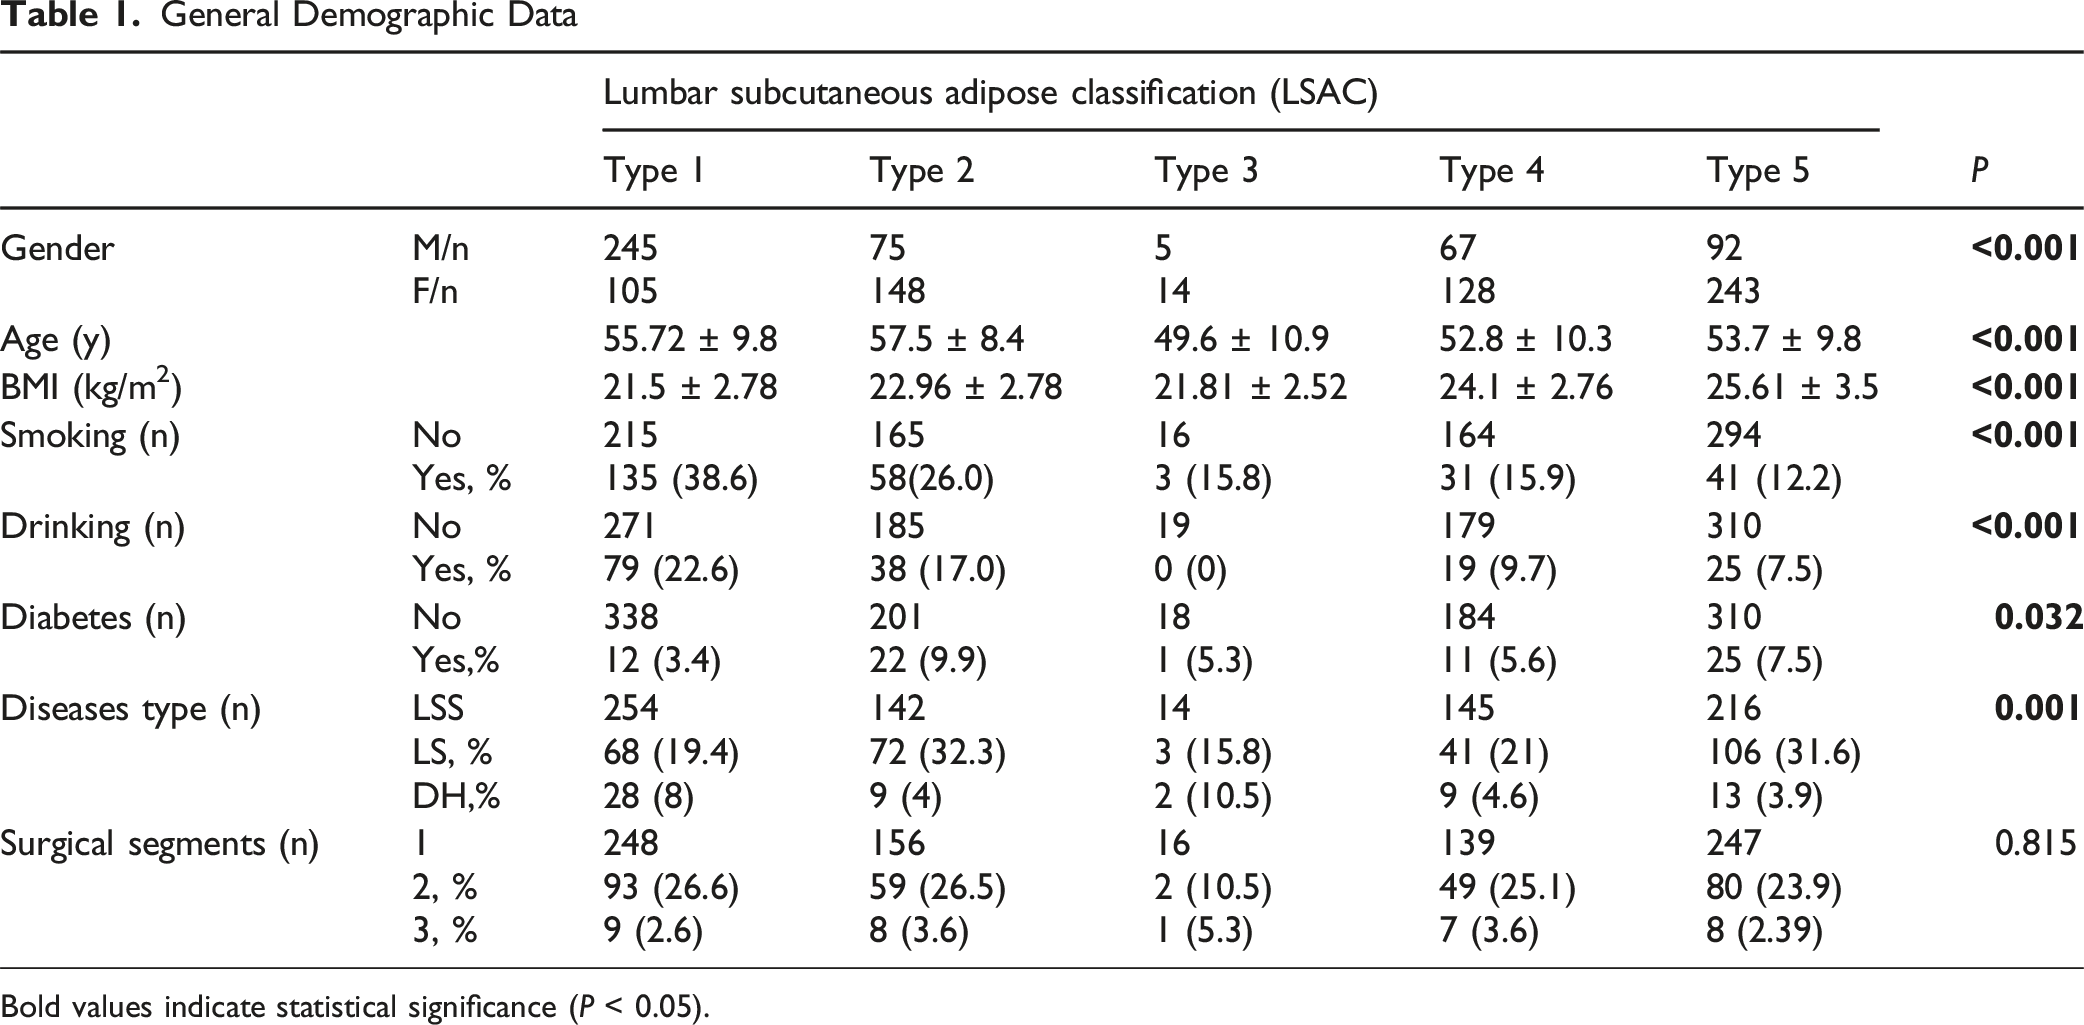
Bold values indicate statistical significance (P < 0.05).
Radiographic Characteristics Differ Significantly Across LSAC Types
Intergroup Differences in Radiographic Parameters
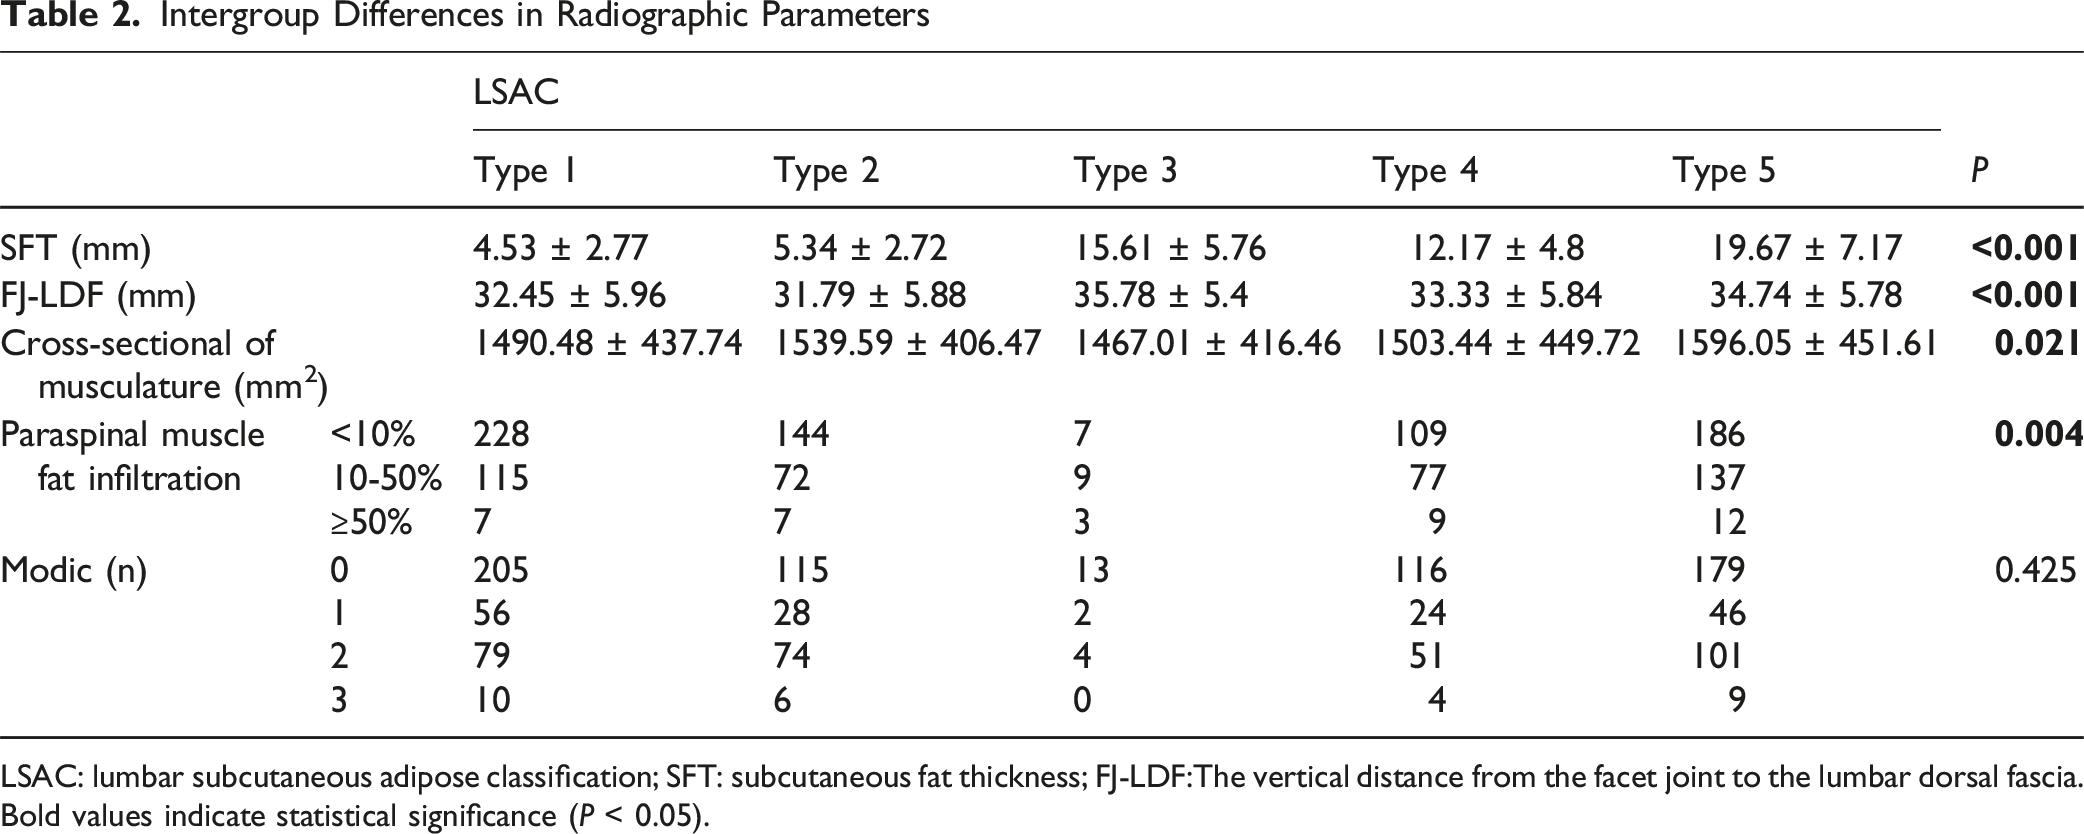
LSAC: lumbar subcutaneous adipose classification; SFT: subcutaneous fat thickness; FJ-LDF:The vertical distance from the facet joint to the lumbar dorsal fascia. Bold values indicate statistical significance (P < 0.05).
LSAC is Associated with Differential Risk of SSI and PAE
Relationship Between LSAC and PAE
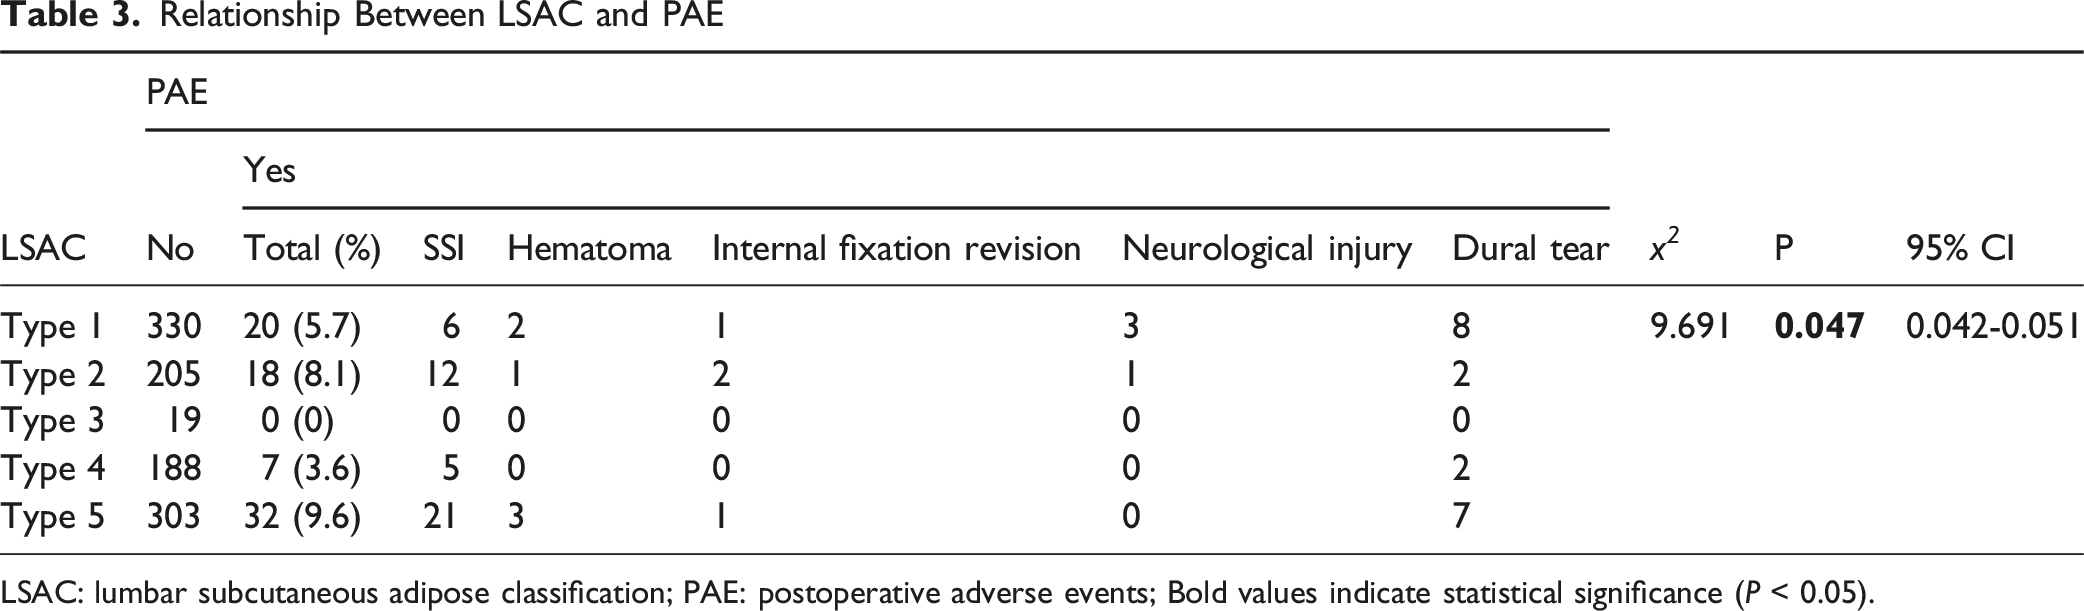
LSAC: lumbar subcutaneous adipose classification; PAE: postoperative adverse events; Bold values indicate statistical significance (P < 0.05).
Relationship Between LSAC and SSI
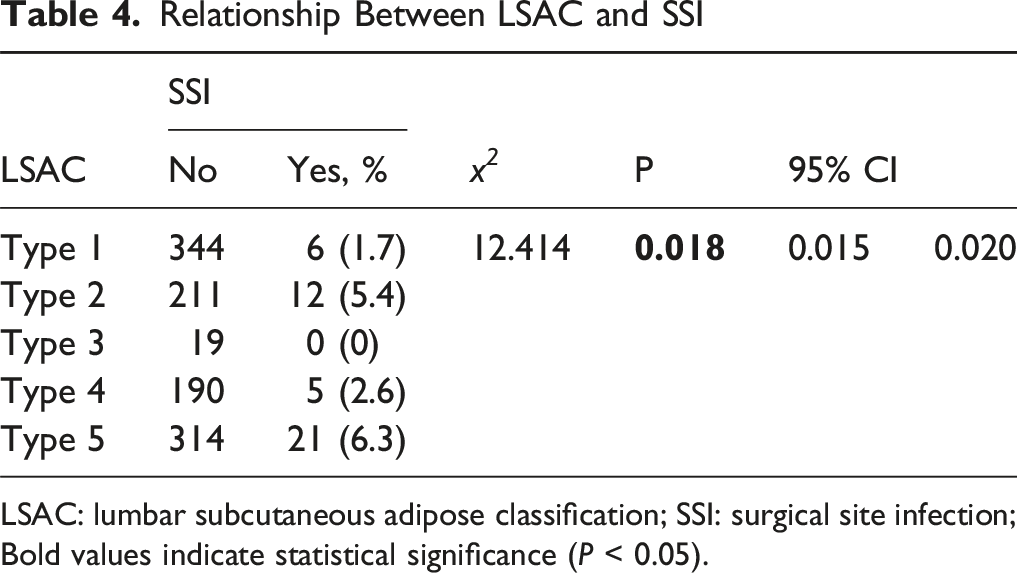
LSAC: lumbar subcutaneous adipose classification; SSI: surgical site infection; Bold values indicate statistical significance (P < 0.05).
Differences in Hospitalization Burden and Surgical Metrics Across LCSA
Relationship Between LSAC and Operative Time, Postoperative Hospital Stay and Total Hospitalization Duration
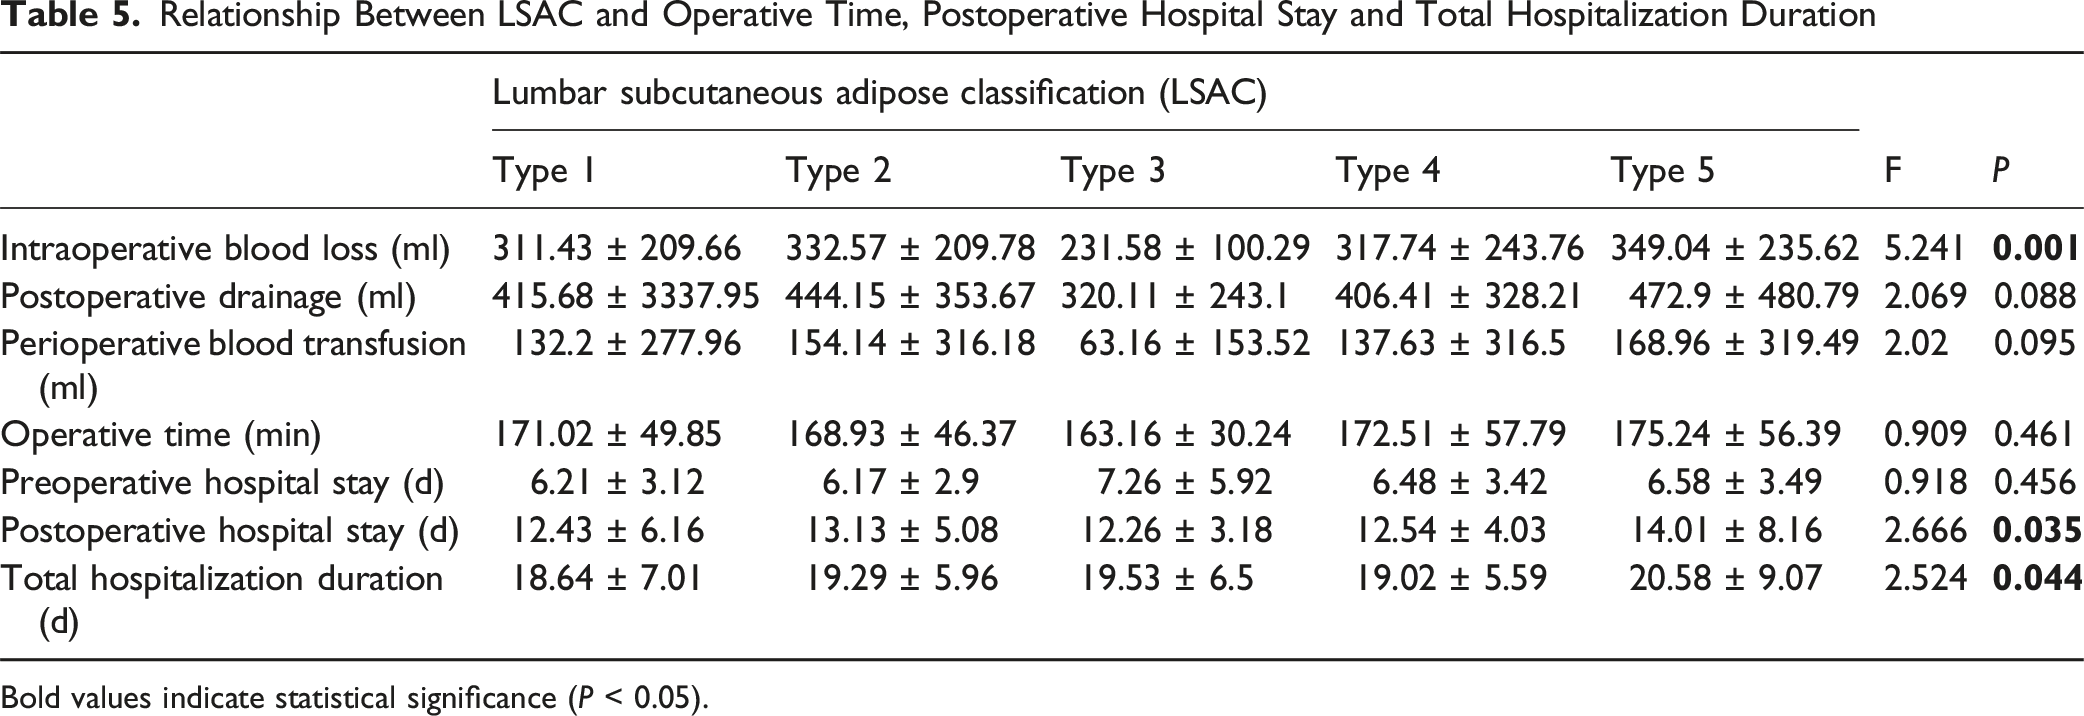
Bold values indicate statistical significance (P < 0.05).
LSAC Identified as an Independent Predictor of SSI and PAE
Univariate Correlation Analysis of SSI, PAE, LSAC and SFT (Spearman)
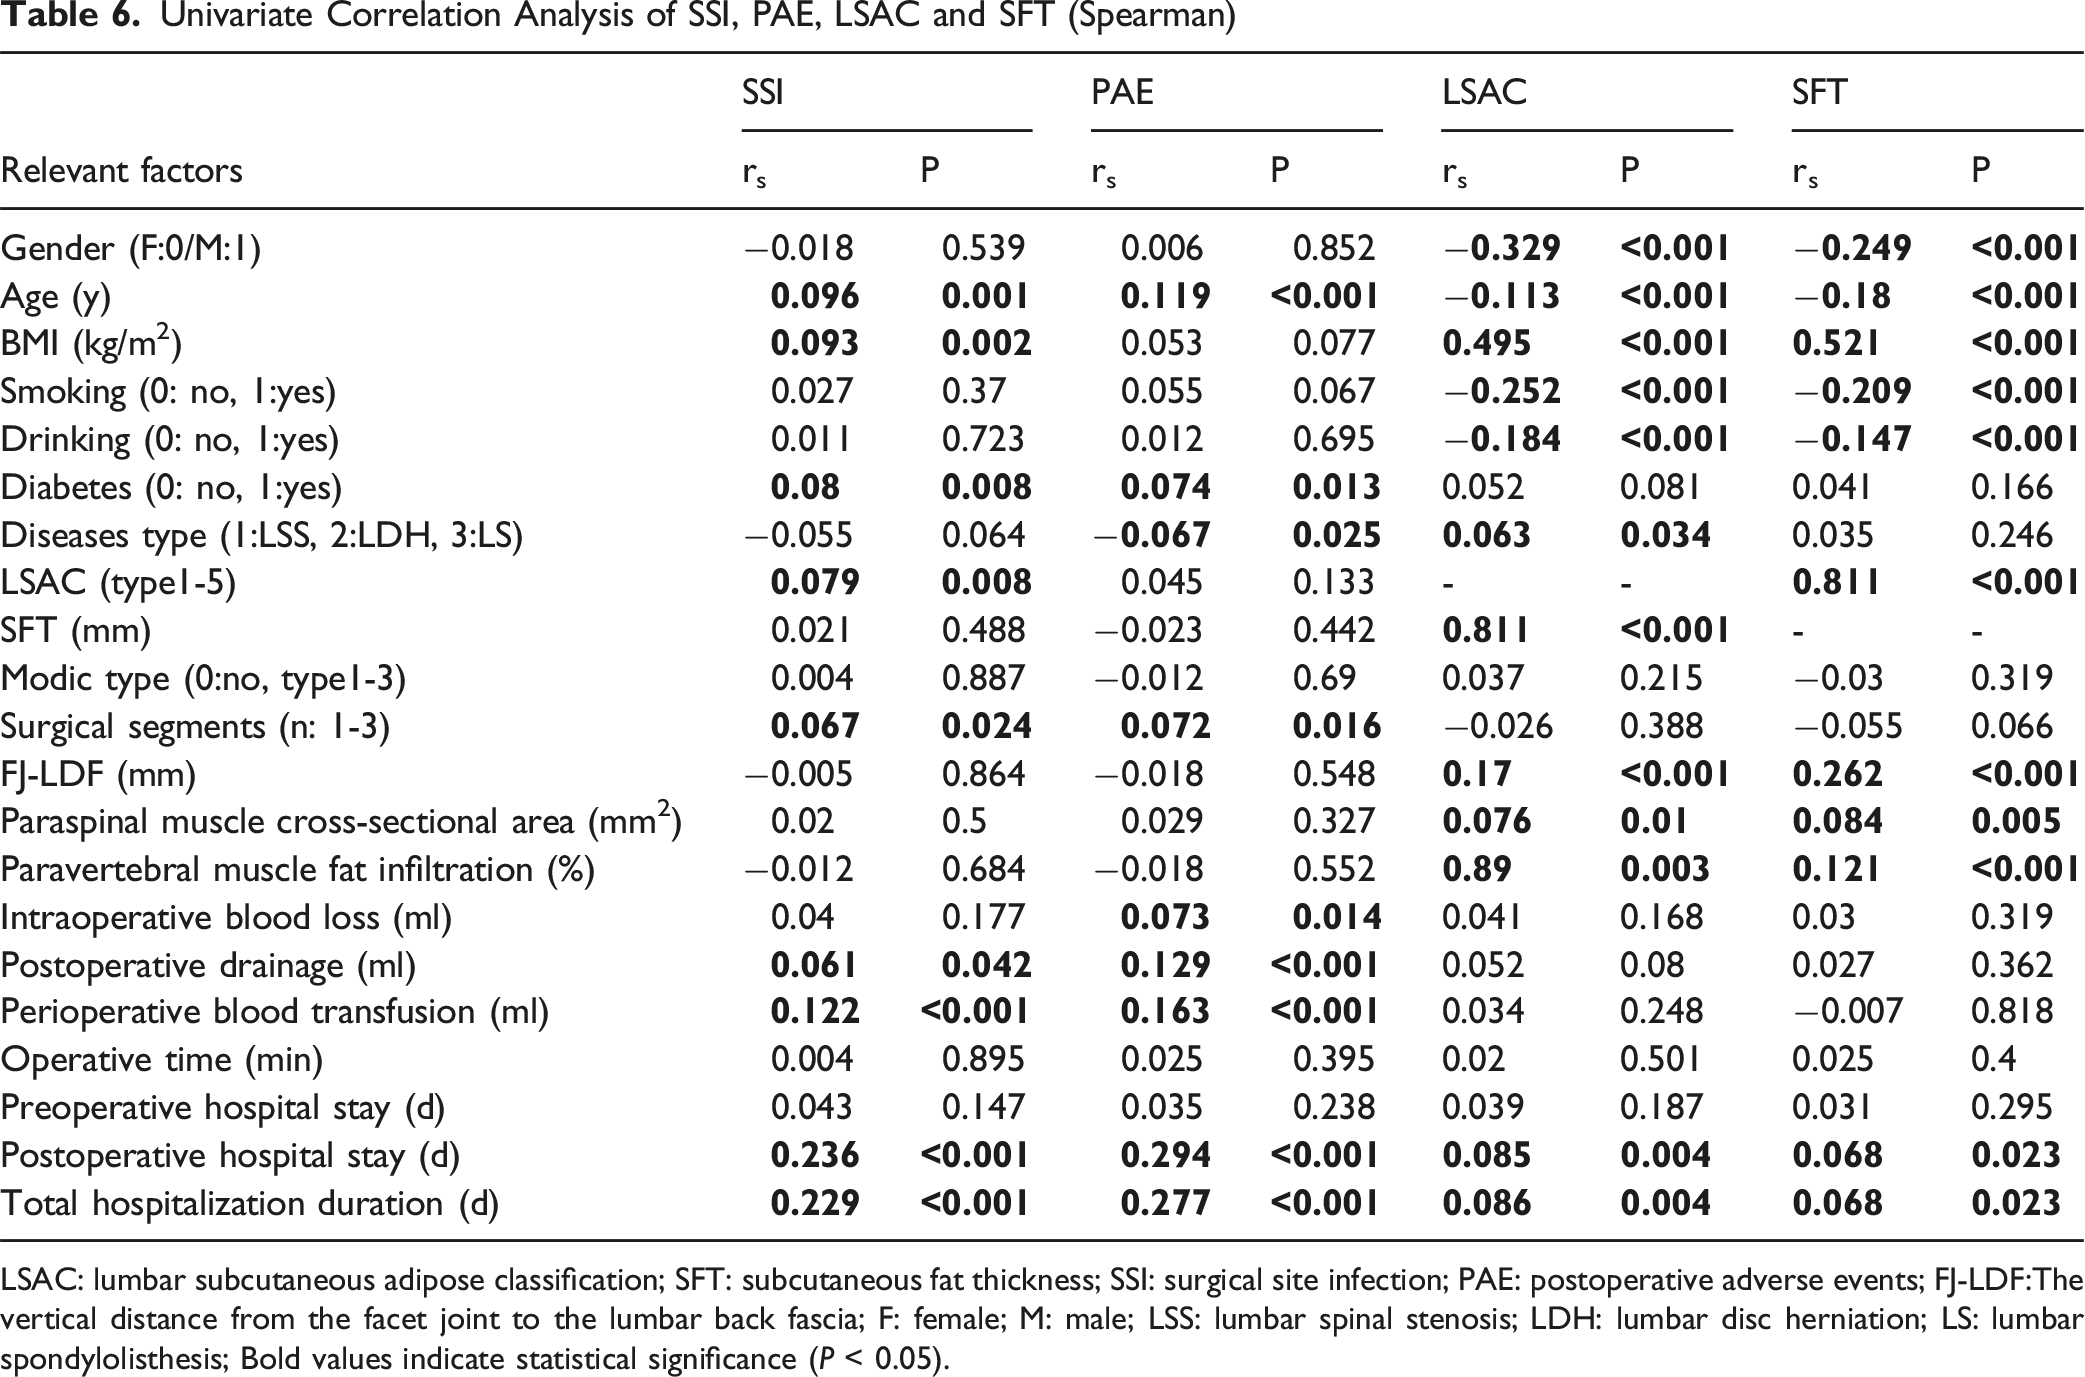
LSAC: lumbar subcutaneous adipose classification; SFT: subcutaneous fat thickness; SSI: surgical site infection; PAE: postoperative adverse events; FJ-LDF:The vertical distance from the facet joint to the lumbar back fascia; F: female; M: male; LSS: lumbar spinal stenosis; LDH: lumbar disc herniation; LS: lumbar spondylolisthesis; Bold values indicate statistical significance (P < 0.05).
Multivariate Logistic Regression Analysis of Risk Factors for SSI and PAE (Backward: LR)
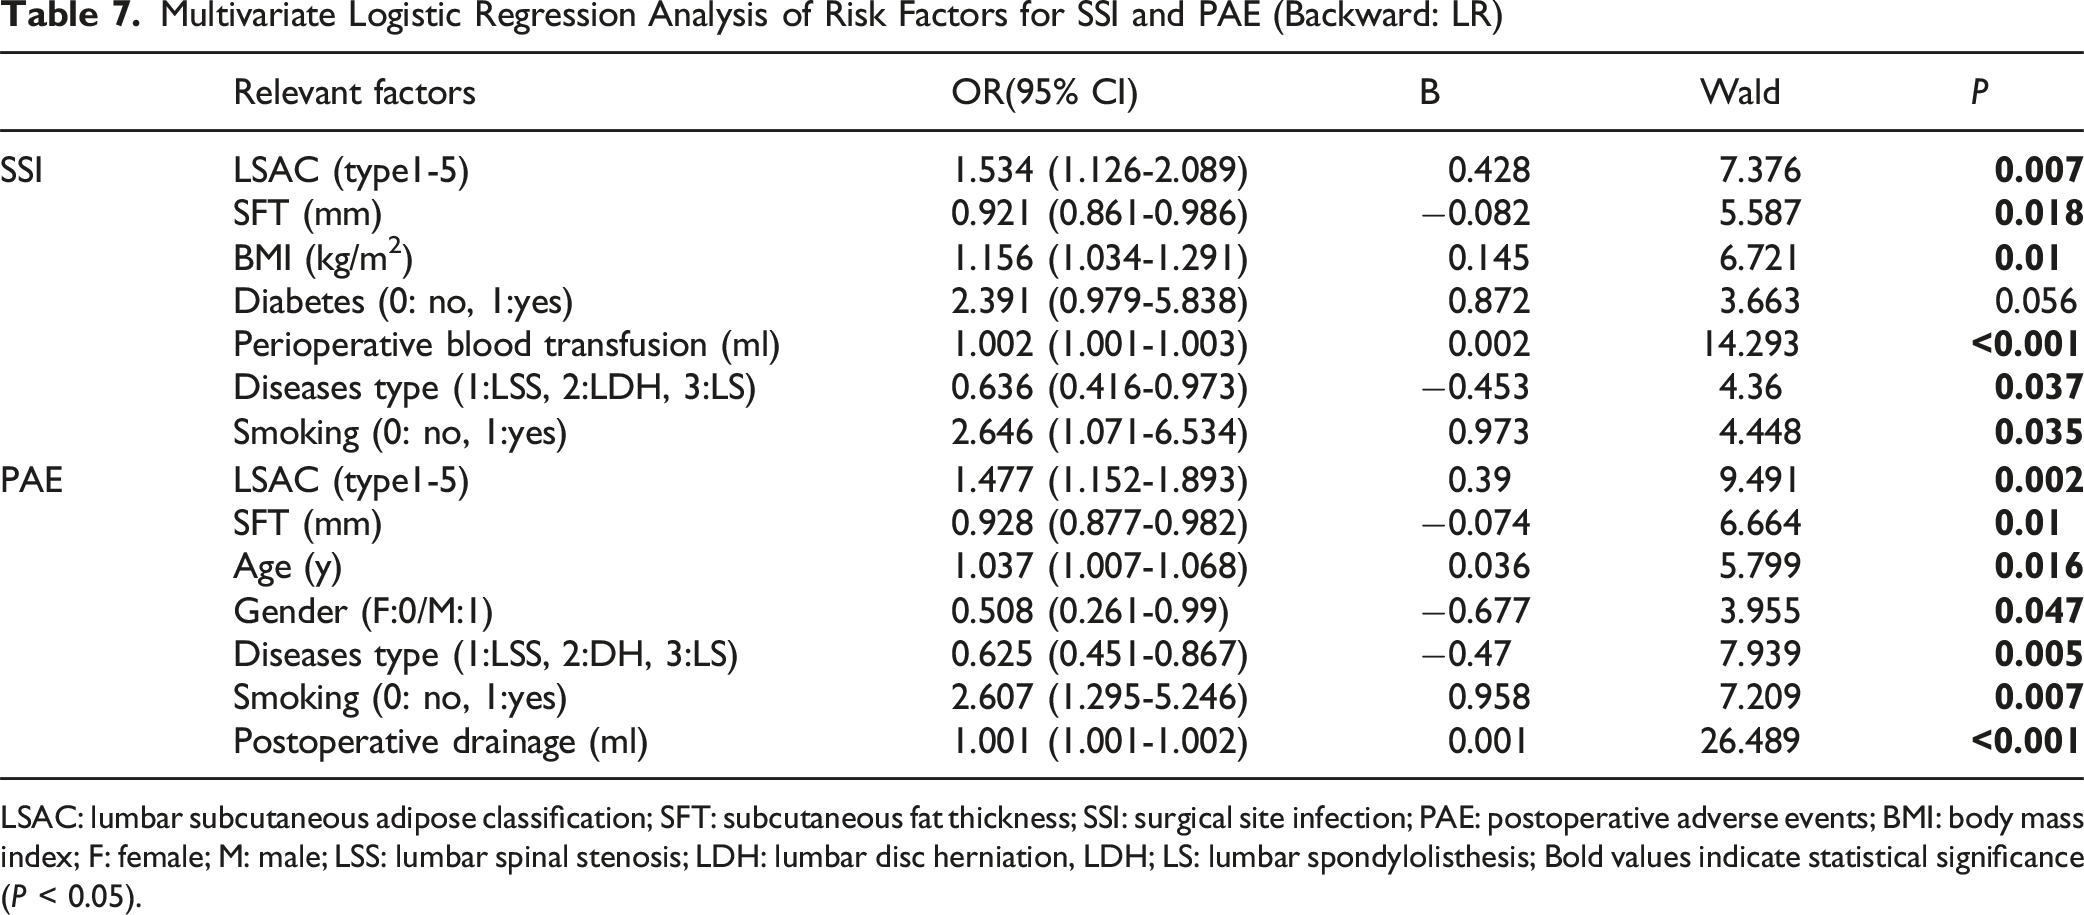
LSAC: lumbar subcutaneous adipose classification; SFT: subcutaneous fat thickness; SSI: surgical site infection; PAE: postoperative adverse events; BMI: body mass index; F: female; M: male; LSS: lumbar spinal stenosis; LDH: lumbar disc herniation, LDH; LS: lumbar spondylolisthesis; Bold values indicate statistical significance (P < 0.05).
ROC Curve Analysis of LSAC, SFT and BMI in Predicting SSI and PAE
Receiver operating characteristic (ROC) curve analysis was performed to evaluate the predictive value of LSAC, BMI, and SFT for deep surgical site infection (SSI) after lumbar fusion. LSAC and BMI demonstrated modest discriminatory ability for SSI, whereas SFT did not (Figure 5A). The area under the curve (AUC) was 0.647 for LSAC (95% CI: 0.571-0.723, P = 0.001) and 0.638 for BMI (95% CI: 0.560-0.716, P = 0.002). In contrast, the AUC for SFT was 0.531 (P = 0.487). Regarding PAE, ROC analysis demonstrated that the predicted probability derived from the LSAC-based logistic model showed a statistically significant but weak discriminatory ability for PAE (AUC = 0.601, 95% CI 0.539-0.663, P = 0.003). In contrast, BMI (AUC = 0.560, P = 0.077) and SFT (AUC = 0.474, P = 0.442) did not exhibit significant predictive performance (Figure 5B). ROC curves for LSAC, BMI, and SFT predicting SSI (A) and PAE (B) after posterior lumbar fusion surgery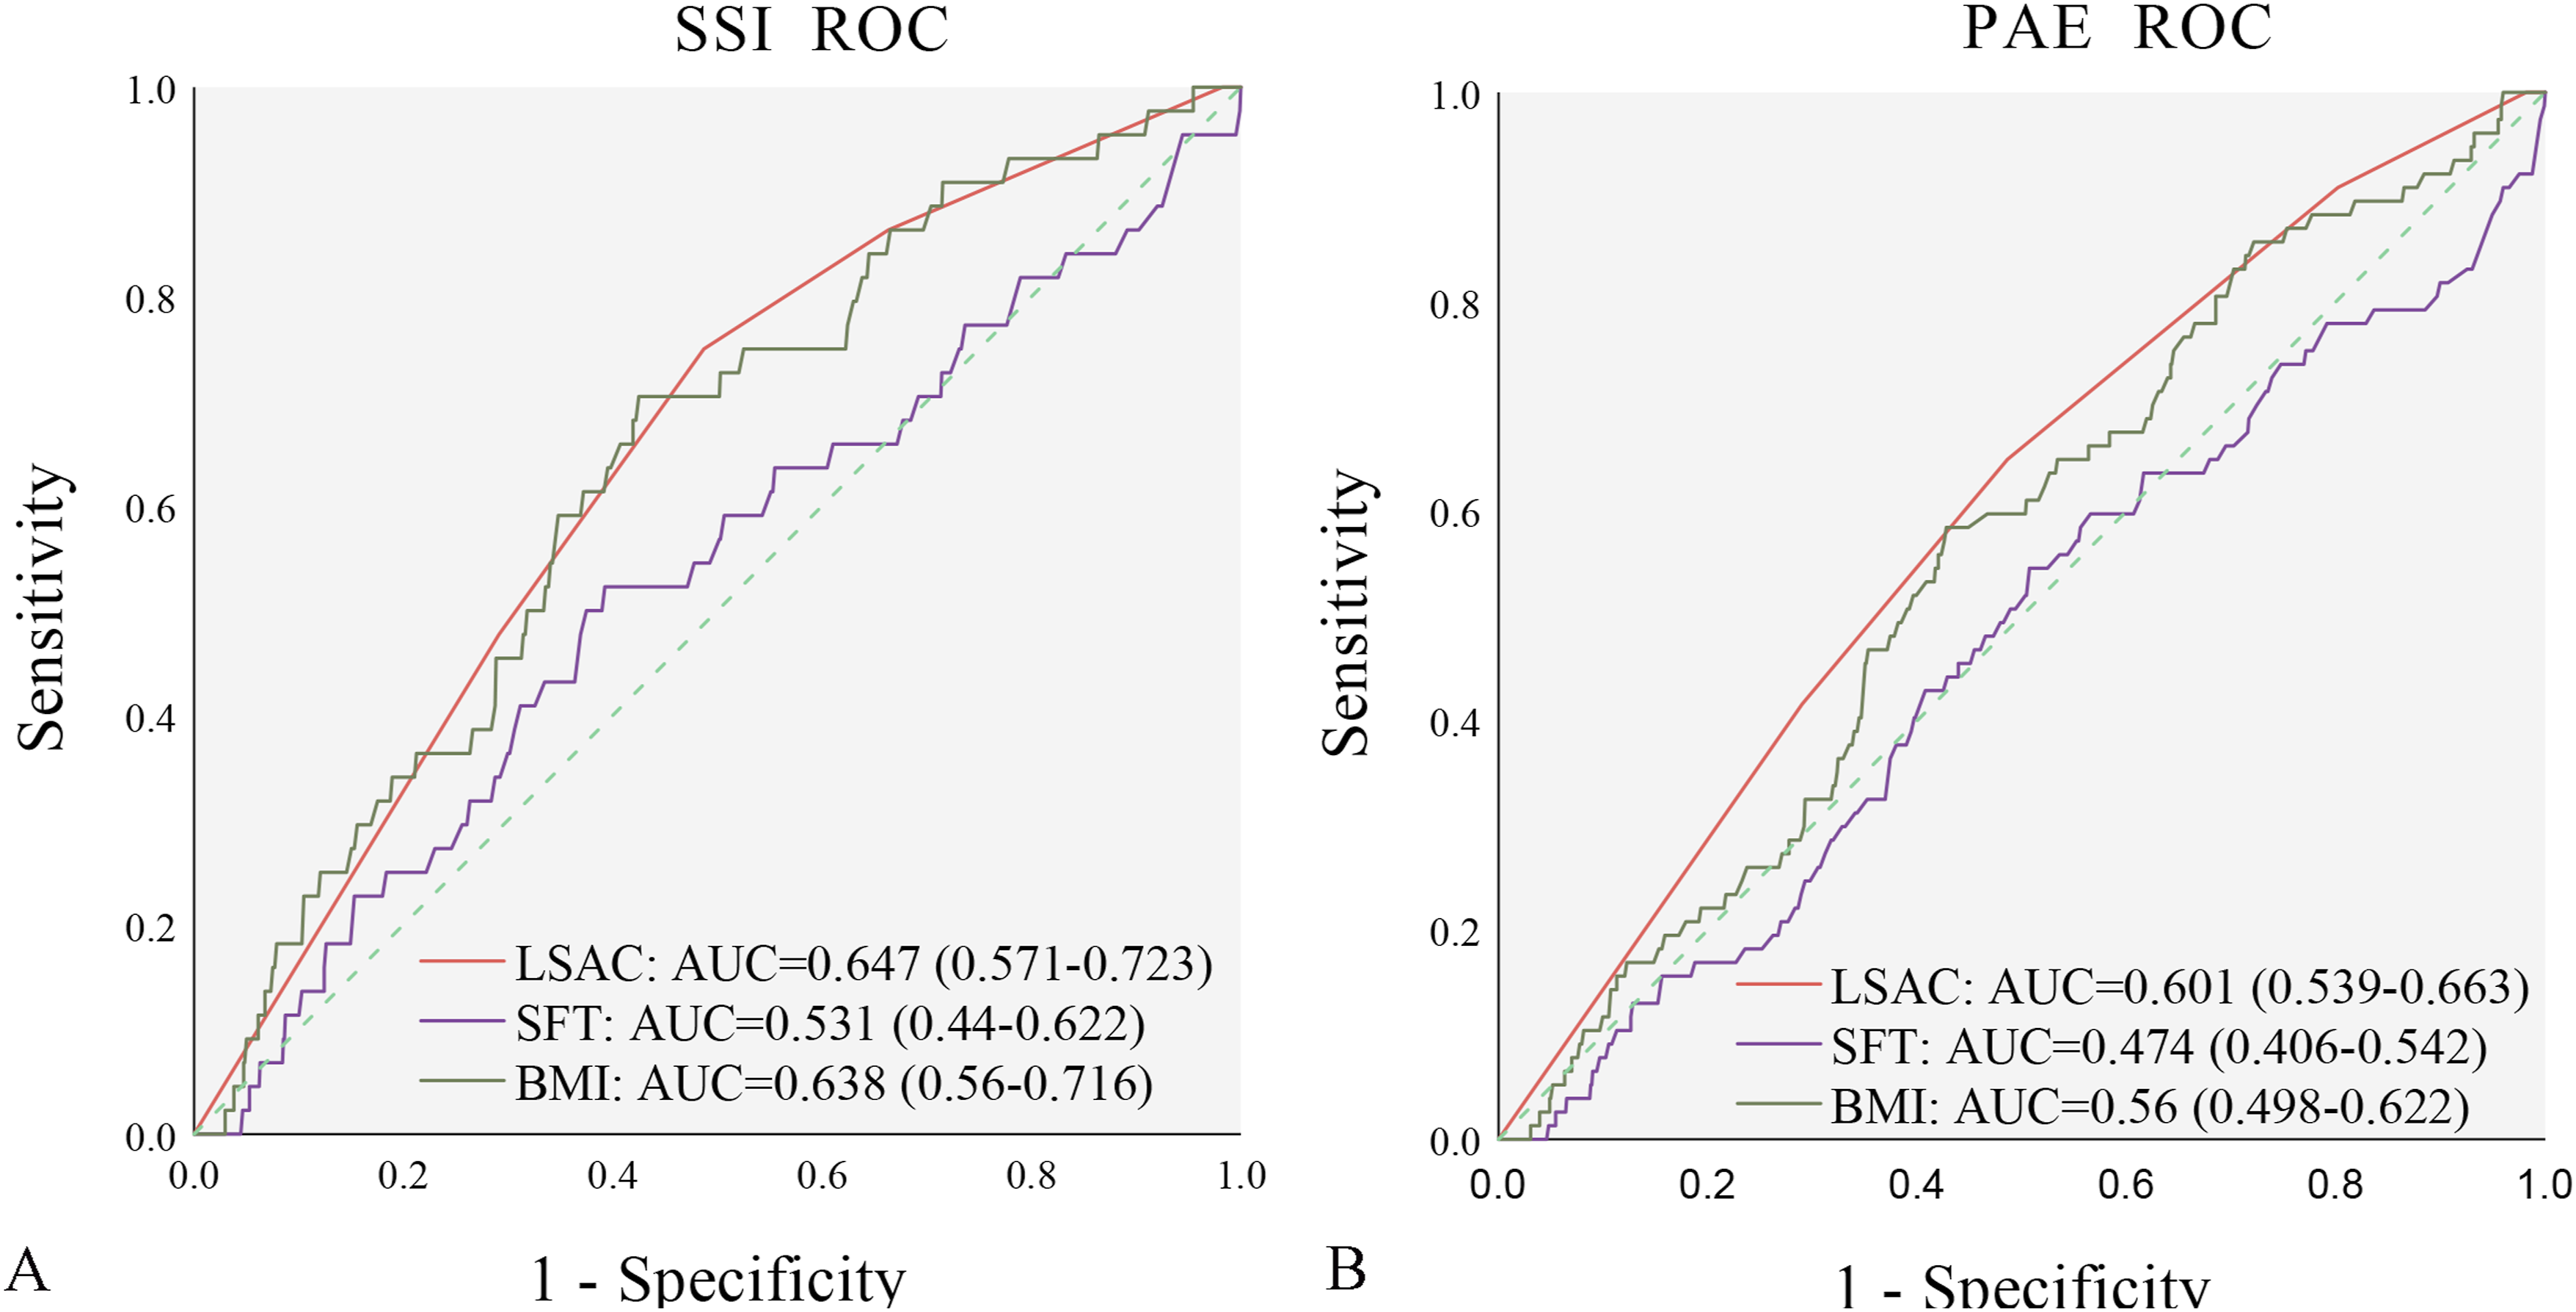
Discussion
This study is the first to introduce a lumbar sagittal MRI–based Lumbar Subcutaneous Adipose Classification (LSAC). The classification demonstrated excellent intra- and interobserver reproducibility (intra κ = 0.87; inter κ ≥ 0.80), supporting its reliability for routine clinical use. ROC curve analysis indicated that LSAC demonstrated slightly superior predictive performance compared with BMI and markedly better discriminatory ability than SFT for SSI. Moreover, LSAC showed significantly greater predictive value than both BMI and SFT in predicting PAE. Despite the strong correlation between LSAC and SFT (rs = 0.811), the lack of predictive value observed for SFT suggests that adipose tissue morphology, rather than thickness alone, may contribute differently to postoperative risk stratification. These indicate that LSAC provides additional structural characterization of subcutaneous fat distribution beyond linear measurements. These findings are further supported by multivariate models, where LSAC remained an independent predictor for both SSI and PAE. Type 5 and Type 2 phenotypes were associated with the highest clinical risk, exhibiting the highest incidences of both SSI and PAE. Interestingly, while Type 4 showed a slightly higher incidence of SSI than Type 1, Type 1 was linked to a higher rate of PAE, suggesting that different adipose morphologies may influence specific types of adverse outcomes differently. Collectively, LSAC provides a concise, reproducible imaging phenotype that yields clinically actionable information, allowing for superior perioperative risk stratification compared to traditional metrics.
SFT showed no significant association with SSI or PAE on univariate testing (PSSI = 0.488; PPAE = 0.442). In multivariate analysis, SFT unexpectedly behaved as a protective factor for SSI and PAE — a finding that contrasts with several prior reports.8,11,18 Several factors may explain this discrepancy. First, our SSI definition was restricted to deep infections requiring debridement, which may preferentially capture more severe events and alter associations compared with studies using broader SSI definitions. Second, SFT correlated negatively with age and smoking but positively with FJ–LDF and paraspinal muscle CSA in our cohort (Table 6), suggesting that greater local thickness in some patients coexists with younger age and larger muscle mass — features that may mitigate complication risk. Previous studies have also suggested no correlation between SFT and SSI, 19 but these studies included patients with lumbar disc herniation undergoing non-fusion surgeries, which could explain the different results. Currently, more research supports a relationship between SFT and SSI.9-12 This also highlights the limitations of using SFT to predict SSI rates. As observed in this study, Type 2 (mean SFT 5.34 ± 2.72 mm) had higher SSI/PAE rates than Type 3 (15.61 ± 5.76 mm) and 4 (12.17 ± 4.8 mm). Therefore, using SFT in the lumbar spine region to estimate perioperative risks may lead to an underestimation of risks for type 2 patients and an overestimation for type 4 and type 3 patients.
BMI demonstrated a positive association with SSI on univariate analysis and remained an independent risk factor in multivariate models (OR≈1.2), consistent with several prior reports.3,7,20,21 LSAC correlated with BMI (rs = 0.495) and with SFT (rs = 0.521), indicating that LSAC reflects overall adiposity while adding a local dimension absent from BMI. Type 5 had the highest BMI (25.61 ± 3.5 kg/m2) and the highest SSI rate, while Type 1 had the lowest BMI (21.5 ± 2.78 kg/m2) and the lowest SSI rate. However, discordant patterns in Type 2 (22.96 ± 2.78 kg/m2) and Type 4 (24.1 ± 2.76 kg/m2) indicate that BMI lacks sensitivity to distributional phenotypes that confer operative risk. This may be one of the reasons for discrepancies in previous studies.3,5-8 Therefore, combining LSAC with BMI may improve risk estimation compared with either metric alone.
In this study, male patients in the Type 1 (Low-adipose) category were more than twice female patients, whereas in other types females were approximately twice males. This suggests that female patients have more subcutaneous fat distribution, which may indicate higher perioperative risks. Elsamadicy et al 3 found that female is a risk factor for SSI (SSI: 50.3% female vs no SSI: 46.9% female, P < 0.001). Although univariate analysis in this study did not reveal a significant correlation between gender and SSI or PAE, multivariate analysis showed that female is an independent risk factor for PAE. Notably, smoking and alcohol use were negatively correlated with LSAC and SFT in our cohort — possibly reflecting demographic confounding (higher smoking in low-adipose, male-dominant groups). Multivariate models confirmed smoking as an independent risk factor for both SSI and PAE (OR≈2.6), consistent with prior literature,3,21 and highlighting the interaction between adipose phenotype and modifiable behavioral risks.
Schermann et al 22 found that patients with thicker soft tissue had a higher comorbidity burden, including higher prevalence rates of cardiovascular diseases, diabetes, and hypertension. However, the authors did not find worse surgical and medical outcomes, functional results, or other assessments in patients with thicker subcutaneous fat. 22 Mechanistically, thicker posterior soft tissue theoretically requires wider dissection and may increase tissue trauma, dead space, and local ischemia — all factors that promote infection. Consistent with this, Type 5 patients in our cohort had greater intraoperative blood loss, higher transfusion and drainage volumes, and longer hospital stays. Nevertheless, SFT, FJ–LDF, and paraspinal muscle CSA were not independent predictors of SSI or PAE in multivariate analysis, and SFT behaved paradoxically as a protective factor. This pattern further supports the concept that distributional topology (LSAC) — which captures where fat is located relative to the posterior approach corridor — provides complementary risk information beyond raw thickness measures. For example, Type 2 (cranial) appears to create a surgical environment conducive to SSI/PAE despite relatively low measured SFT at the surgical segment.
Previous studies have suggested that age is not a significant risk factor for SSI in lumbar spine surgery.3,7,12 Zhou et al 5 conducted a systematic review and found that the incidence of SSI was higher in patients <60 years (3.6%) compared to those aged >60 years (2.5%). In our cohort, univariate analysis showed a positive correlation between age and SSI/PAE, while multivariate models identified age as an independent predictor for PAE but not for SSI. This may partly explain why Type 2 (mean age 57.5 ± 8.4 years) had higher SSI and PAE than some other subgroups. And both LSAC and SFT were negatively correlated with age, suggesting age-related shifts in fat distribution that may modulate operative risk.
This study found a positive correlation between LSAC, SFT, and paraspinal muscle fat infiltration. Previous studies have shown that fat infiltration in the multifidus muscle is associated with higher SSI risk when the percentage of infiltration exceeds a threshold. 11 Although our visual grading approach did not demonstrate a significant independent association between paraspinal muscle fatty infiltration and SSI, this may reflect the coarseness of visual assessment and the broader muscle groups analyzed. Future studies employing quantitative fat fraction mapping or muscle-specific segmentation (multifidus vs erector spinae) may clarify the relative contributions of muscle degeneration and subcutaneous topology to infection risk.
Diabetes is an independent risk factor for SSI in lumbar spine surgery.7,21 In this study, diabetes was found to be associated with both SSI and PAE, but it did not show statistical significance in multivariate analysis (OR≈2.4, P > 0.05), possibly due to the influence of other factors. Diabetes prevalence was higher in Type 2 (9.9%), which may partially contribute to its elevated complication rate, but LSAC appears to reflect additional non-glycemic risk pathways. Perioperative transfusion and postoperative drainage volume were associated with SSI and PAE, emphasizing the importance of minimizing blood loss and dead space — interventions that may be prioritized for higher-risk LSAC phenotypes.
Limitation
This study has several limitations. Firstly, it should be emphasized that the development of SSI and PAE is multifactorial in nature and unlikely to be accurately predicted by any single variable. Although LSAC demonstrated only modest predictive performance for SSI and PAE, this does not preclude its potential role as a contributory risk indicator. Secondly, the number of Type 3 cases was relatively small, which may have introduced statistical bias. However, this also underscores the value of the LSAC system, as it allows finer stratification of lumbar subcutaneous fat patterns; future multicenter studies with larger sample sizes are needed to further validate these findings.
Finally, to our knowledge, this is the first study to propose the LSAC classification system, which was designed to stratify variations in posterior midline subcutaneous fat distribution in the lumbar region and to facilitate improved identification of high-risk patients. The underlying mechanisms responsible for these morphological differences in midline subcutaneous fat distribution remain unclear and warrant further investigation. Furthermore, external validation through large-scale, multicenter, and prospective studies involving diverse populations is necessary to further evaluate and refine this classification system.
Conclusion
The LSAC system offers a simple, reproducible, and clinically meaningful method for stratifying lumbar subcutaneous fat distribution in posterior lumbar fusion surgery. Compared with traditional single metrics such as BMI or SFT, LSAC demonstrated superior predictive value for postoperative complications. Type 5 and Type 2 phenotypes were associated with the highest perioperative risk, indicating that LSAC may support improved risk stratification and targeted perioperative optimization strategies in lumbar spine surgery.
Footnotes
ORCID iDs
Ethical Considerations
This retrospective study adheres to the guidelines of the Strengthening the Reporting of Observational Studies in Epidemiology (STROBE) statement. It was approved by the First Affiliated Hospital of Dali University Ethics Institutional Review Board (Approval No: DFY20251111002), which waived the requirement for individual patient consent as the research involved no risk to participants and utilized fully anonymized data, protecting patient privacy and interests.
Author Contributions
Conceptualization and article idea: Shiyong Wang, Kaishun Yang, Zhaohui Ge; Data curation and formal analysis: Shiyong Wang, Waimei Zhu, Xiangdong Gong, Rubin Yao; Methodology: Shiyong Wang, Rudong Chen, Haitao Hu, Honglai Zhang, Zeming Wang; Writing—original draft preparation: Shiyong Wang, Xiaojin Wu, Wanzhong Yang, Rong Ma, Wei Guo; Writing—review and editing and/or critically revised the work: Shiyong Wang, Kaishun Yang, Zhaohui Ge; All authors have read and agreed to the final version of the manuscript. The manuscript and the related research have not been published and are not being considered for publication elsewhere, in whole or in part, in any languag
Funding
The authors disclosed receipt of the following financial support for the research, authorship, and/or publication of this article: This work was supported by the Ningxia Hui Autonomous Region Key Research and Development Planned Projects (2023BEG02017), and Yunnan Provincial Department of Education (2023J0907).
Declaration of Conflicting Interests
The authors declared no potential conflicts of interest with respect to the research, authorship, and/or publication of this article.
Data Availability Statement
Deidentified data used in this work can be obtained from the corresponding author upon reasonable request.