
Abstract
Study Design
Retrospective study.
Objective
To develop and validate a predictive model for cage subsidence (CS) after midline lumbar interbody fusion (MIDLIF) with cortical bone trajectory (CBT) screws.
Methods
This retrospective two-center study included patients diagnosed with lumbar degenerative disorders undergoing MIDLIF between January 2018 and October 2023 at two independent hospitals under identical eligibility criteria and variable definitions. Patients were stratified into CS and non-CS groups according to postoperative outcomes. Variables with P < 0.1 in the univariate analysis were subsequently included in multivariate logistic regression to determine independent predictors. Bone mineral density (BMD) was indirectly evaluated using endplate bone quality (EBQ) scores from MRI and Hounsfield units (HU) measurements from CT scans. Inter-rater reliability of EBQ was reported using the intraclass correlation coefficient (ICC) with 95% CIs. The model’s performance was assessed using ROC analysis, calibration curves, and decision curve analysis (DCA).
Results
Across both centers, 316 patients were included, of whom 71 (22.5%) developed CS (development center: 48/216, 22.2%; external center: 23/100, 23.0%). Elevated BMI, higher EBQ scores, lower HU values, and reduced preoperative disc height were found to be independent predictors. The prediction model exhibited favorable discriminative ability, with AUCs of 0.924 in the training set and 0.884 in the internal validation set, and it maintained performance in a geographically external cohort (AUC = 0.842). Calibration curves demonstrated good agreement between predicted and observed outcomes, and DCA indicated strong clinical applicability. Although lower than in the training and internal validation sets, external net benefit stayed positive across a broad clinical threshold range and, for most thresholds, exceeded treat-none and treat-all. EBQ inter-rater reliability (ICC, 95% CIs) was 0.960 (0.945-0.971), 0.940 (0.902-0.964), and 0.920 (0.881-0.946) in the training, internal validation, and external cohorts, respectively. In addition, the nomogram was developed into an online calculator that visually displays the predicted probability of CS following MIDLIF.
Conclusions
The developed nomogram serves as a practical and reliable means to predict the risk of cage subsidence in patients undergoing MIDLIF. An online risk calculator based on this model further enhances its clinical utility, providing clinicians with a valuable reference for tailoring surgical strategies and improving perioperative decision-making.
Keywords
Introduction
Lumbar fusion surgery is commonly utilized to manage lumbar degenerative conditions. In 2009, Santoni et al 1 introduced the midline lumbar interbody fusion (MIDLIF) with cortical bone trajectory (CBT) screws as an alternative to enhance screw fixation strength and mitigate screw loosening, a complication that is especially problematic in osteoporotic patients due to reduced fixation stability. Studies have shown that MIDLIF outperforms traditional pedicle screw (PS) fixation in terms of biomechanical stability and surgical outcomes.2,3 As a result, the MIDLIF has gained increasing traction in surgical practice in recent years. The annual volume of lumbar fusion surgeries continues to grow, making it one of the most expensive surgical procedures, with revision surgeries constituting a significant portion of the associated costs.4-7 Cage subsidence is a leading cause of revision surgeries, 8 potentially resulting in implant failure, pseudarthrosis, spinal kyphosis, adjacent segment disease, and loss of intervertebral height. Each of these complications may result in nerve root compression and subsequent radicular pain. 9 Over the past 2 decades, lumbar interbody fusion using the MIDLIF has become increasingly popular due to its favorable clinical outcomes. However, the incidence of cage subsidence remains high, with rates reported at up to 26%. 10
Multiple risk factors are closely associated with the occurrence of cage subsidence. First, osteoporosis is one of the primary risk factors, as reduced bone density compromises the bone structure’s ability to provide sufficient support, thereby increasing the likelihood of cage subsidence. 11 Dual-energy X-ray absorptiometry (DXA), considered the gold standard for measuring bone mineral density (BMD), is widely used for diagnosing osteopenia or osteoporosis. 12 However, reports suggest that DXA may not provide accurate BMD measurements in patients with lumbar degenerative disease.12,13 While quantitative computed tomography (QCT) is more accurate than DXA in assessing osteoporosis,13-15 its high cost limits its routine use. Additionally, both techniques expose patients to extra radiation beyond conventional imaging methods like lumbar CT and MRI, and DXA may show falsely elevated BMD in the presence of lumbar degeneration or vascular calcification.16,17 In response, this study innovatively proposes the use of endplate bone quality (EBQ) score and Hounsfield units (HU) as effective alternatives for assessing bone density. The EBQ score is an MRI-based metric that quantifies the signal intensity of the subchondral bone beneath the vertebral endplate. 18 On T1-weighted images, higher signal intensity typically reflects greater fatty marrow content and reduced trabecular bone density in this critical load-bearing zone. Physiologically, this corresponds to compromised bone microarchitecture, while biomechanically it indicates diminished stiffness and load-bearing capacity of the endplate—factors that predispose it to deformation or fracture under cage loading. EBQ scores has been shown to have excellent predictive performance for cage subsidence after lumbar interbody fusion.17-19 It may offer even better predictive ability for cage subsidence than the vertebral bone quality (VBQ) scoring system introduced by Conor Jones et al in 2020, 19 which has already been confirmed as an important predictor for healthy bone and bone loss/osteoporosis, with an accuracy of 81%. 20 In contrast, the HU is a quantitative CT value that reflects the radiodensity of a tissue relative to water and air. In vertebral assessment, lower HU values are associated with lower bone mineral density and reduced mechanical strength. Measuring the HU of the vertebras or endplates using routine CT scans as part of preoperative assessment has also been proven to provide detailed information about the bone quality and plays a role in predicting cage subsidence following interbody fusion.21,22
Additionally, the size and design of the cage are crucial factors influencing the risk of subsidence. Smaller or poorly designed cages can lead to increased contact stress, thereby raising the likelihood of subsidence. 23 Excessive restoration of disc height is also associated with a higher risk of subsidence, as it creates uneven stress distribution at the bone-cage interface.24-26 Moreover, surgical technique, particularly the placement and angle of the cage, can impact stress distribution. Improper positioning may lead to subsidence. 27 The body mass index (BMI) of the patient should not be overlooked, as higher BMI significantly increases the risk of subsidence due to additional mechanical load. 28 Thorough identification of these risk factors is essential for preoperative assessment, optimizing surgical plans, and reducing the incidence of CS, ultimately improving clinical outcomes for patients.
As the pathophysiological mechanisms of CS remain incompletely understood, continued research is essential. The progression of cage subsidence is influenced by both intrinsic degenerative changes and patient-specific factors over the medium and long term. This study aims to assess the incidence of cage subsidence in patients with lumbar degenerative disease undergoing MIDLIF, as well as to identify preoperative clinical and radiographic risk factors. The study also introduces the use of the EBQ score and HU as effective alternatives to traditional BMD measurements. The primary aim is to establish and validate a predictive model, presented as an online web-based calculator, to assist spine surgeons in preoperative decision-making and reduce the occurrence of CS after MIDLIF.
Materials and Methods
Study Population
This retrospective two-center study included 216 patients at the development center (Beijing Chaoyang Hospital, Capital Medical University) with lumbar degenerative diseases who underwent MIDLIF at Beijing Chaoyang Hospital, affiliated with Capital Medical University, from January 2018 to October 2023, and additional 100 patients at the external center (Tianjin Hospital, Tianjin, China) during the same period, under identical eligibility criteria and variable definitions. Among the development-center patients, 98 were male (45.4%) and 118 were female (54.6%), with an average age of 62.5 years. The dataset from the development center was randomly split using outcome-stratified sampling into a training set (152 patients, 70%) and an internal validation set (64 patients, 30%). Figure 1 depicts the comprehensive workflow of model development. The inclusion criteria were: (1) patients diagnosed with lumbar degenerative diseases—specifically lumbar disc herniation (LDH), degenerative spondylolisthesis (DS), or lumbar spinal stenosis (LSS); (2) patients who underwent one-level or two-level MIDLIF; (3) patients with a follow-up period of over 12 months. The exclusion criteria were: (1) presence of lumbar fractures, infections, tumors, or other spinal pathologies; (2) a history of prior lumbar surgery; (3) patients who underwent multi-level (≥3) MIDLIF; (4) patients developed complications intra-operatively including iatrogenic endplate injury or endplate penetration by the screw inserted; (5) follow-up duration less than 12 months. Flowchart of Model Building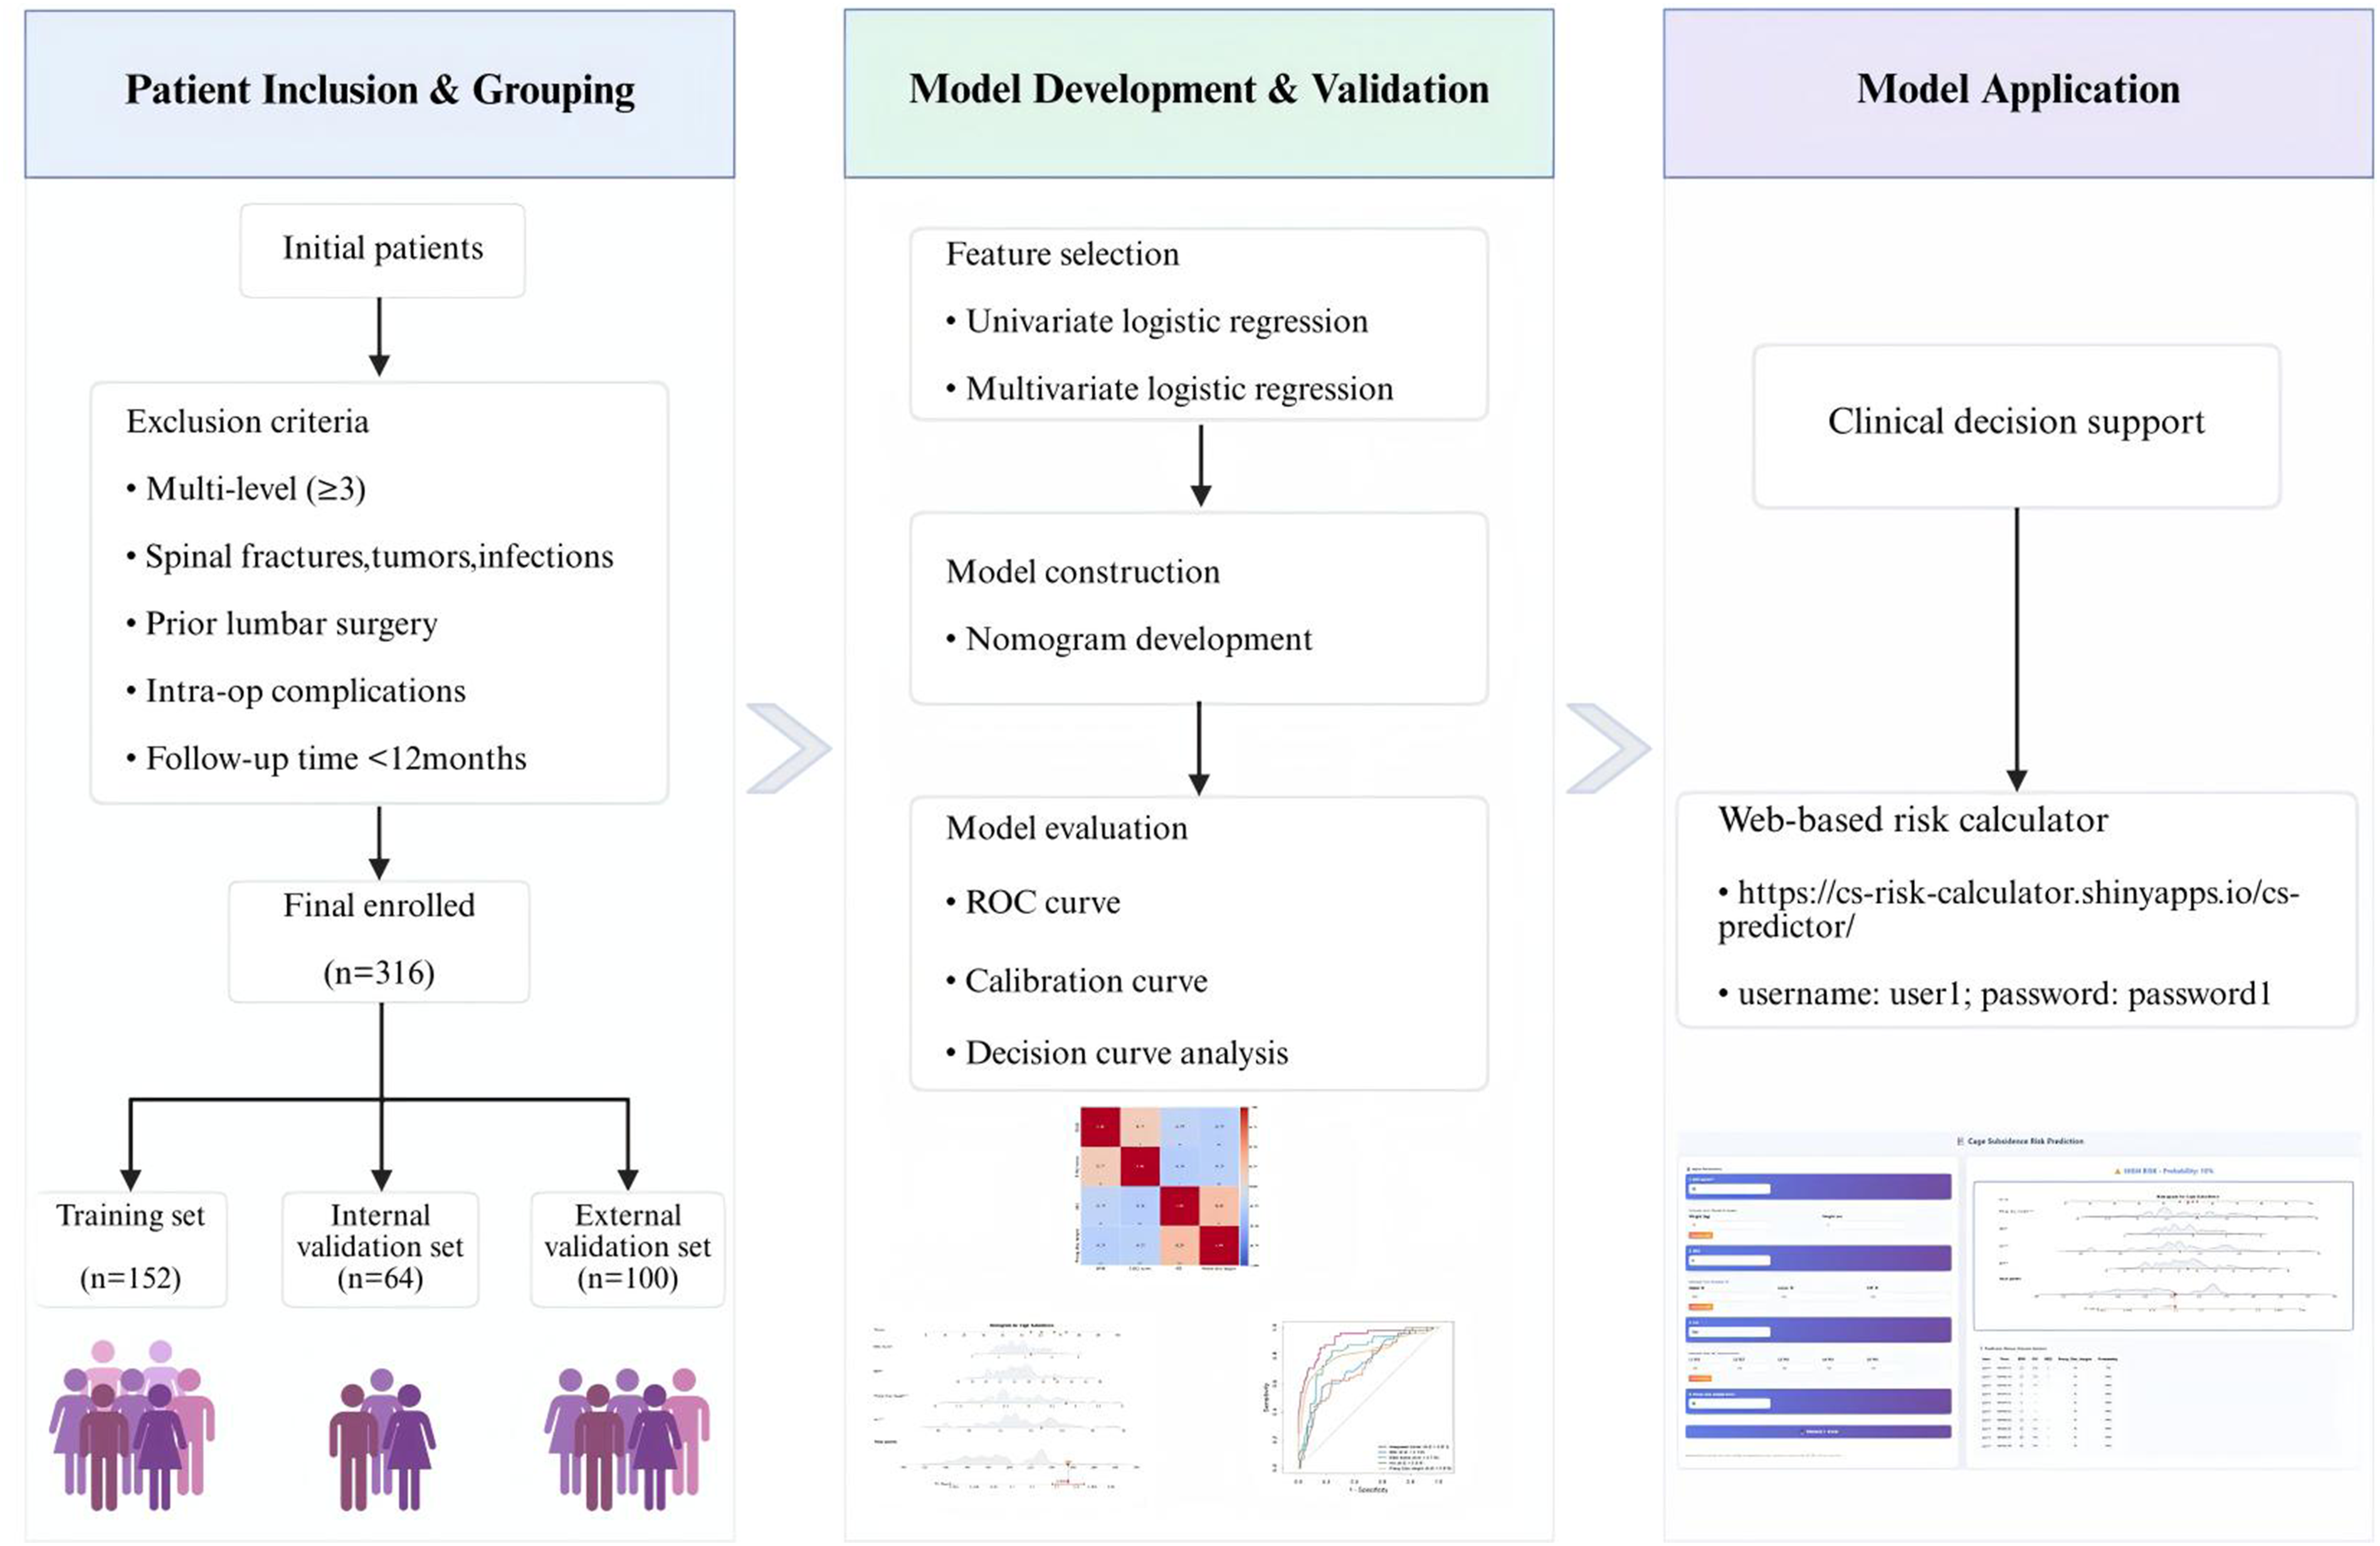
This study conforms to the TRIPOD + AI guidelines for reporting prediction models involving regression or machine learning. 29
Data Collection
Candidate predictors were initially selected based on a review of relevant literature and expert clinical opinion regarding their potential association with CS.11,30,31 The demographic data includes age (years), gender (male/female), body mass index (BMI, kg/m2), Charlson Comorbidity Index (CCI), hypertension (yes/no), diabetes (yes/no), smoking history (yes/no), and alcohol history (yes/no).The radiological parameters include EBQ score and HU value, Modic change (No/I/II/III), preoperative disc height (mm), immediate postoperative disc height (mm), and follow-up disc height (mm). Surgical-related data include blood loss (ml), fusion segments (levels), decompression range (unilateral/bilateral), surgical level, coflex (yes/no), cage height (mm), cage depth ratio, and cage coronary ratio. All radiological parameters were evaluated by 2 researchers. Prior to analysis, all clinical and radiological data underwent systematic data cleaning and quality control. Duplicate records were removed, and variable ranges were checked for plausibility. Continuous variables were visually inspected using histograms and boxplots; outliers beyond 3 standard deviations from the mean were carefully reviewed and, if determined to be data entry errors, were corrected or excluded. All categorical variables were checked for coding consistency. Missing data were handled using multiple imputation by chained equations (MICE) to reduce potential bias and account for the uncertainty associated with missing values. All preprocessing steps were applied uniformly across the development and external datasets using the same definitions and rules.
Criteria for CS and Calculation of EBQ Score and HU Value
CS is defined in CT scans as a decrease in the midpoint intervertebral height (MIVH) exceeding 2 mm at the final follow-up compared to the MIVH measured on postoperative day 1. 32
The measurement of the EBQ score follows a modified method described by Liyu Ran et al.18,33 Using the PACS software with the ROI tool, the measurement is performed on non-contrast T1-weighted MRIs of the lumbar spine. At the surgical level, rectangular regions of interest (ROIs) measuring 3 mm × 3 mm are placed below the cage contact surfaces of the upper endplate (b) and the lower endplate (a). The average signal intensity of these 2 endplates is then divided by the average signal intensity of the cerebrospinal fluid (CSF) in the L3 segment (c). The formula is as follows:

Careful placement of the ROIs is essential to include as much of the fusion device’s contact surface as possible while avoiding extension beyond the cortical margins. If Schmorl’s nodes are present at the region of interest, they are excluded during the EBQ measurement to ensure accuracy (Figure 2). Example of EBQ Measurement. Circles and Boxes Represent the Region of Interest (ROI). (A) is Average Signal Intensity of Lower End Plates, a = (356.2 + 348.5+378.6 + 369.1 + 364.6)/5 = 363.4; (B) is Average Signal Intensity of Upper End Plates, b = (346.2 + 353.1+352.4 + 361.7 + 355.2)/5 = 353.7; (C) is Signal Intensity of the Cerebrospinal Fluid Space at the L3 Level, c = 105.7. Mean a + b = (363.4 + 353.7)/2 = 358.55, EBQ Score = 358.55/105.7 = 3.39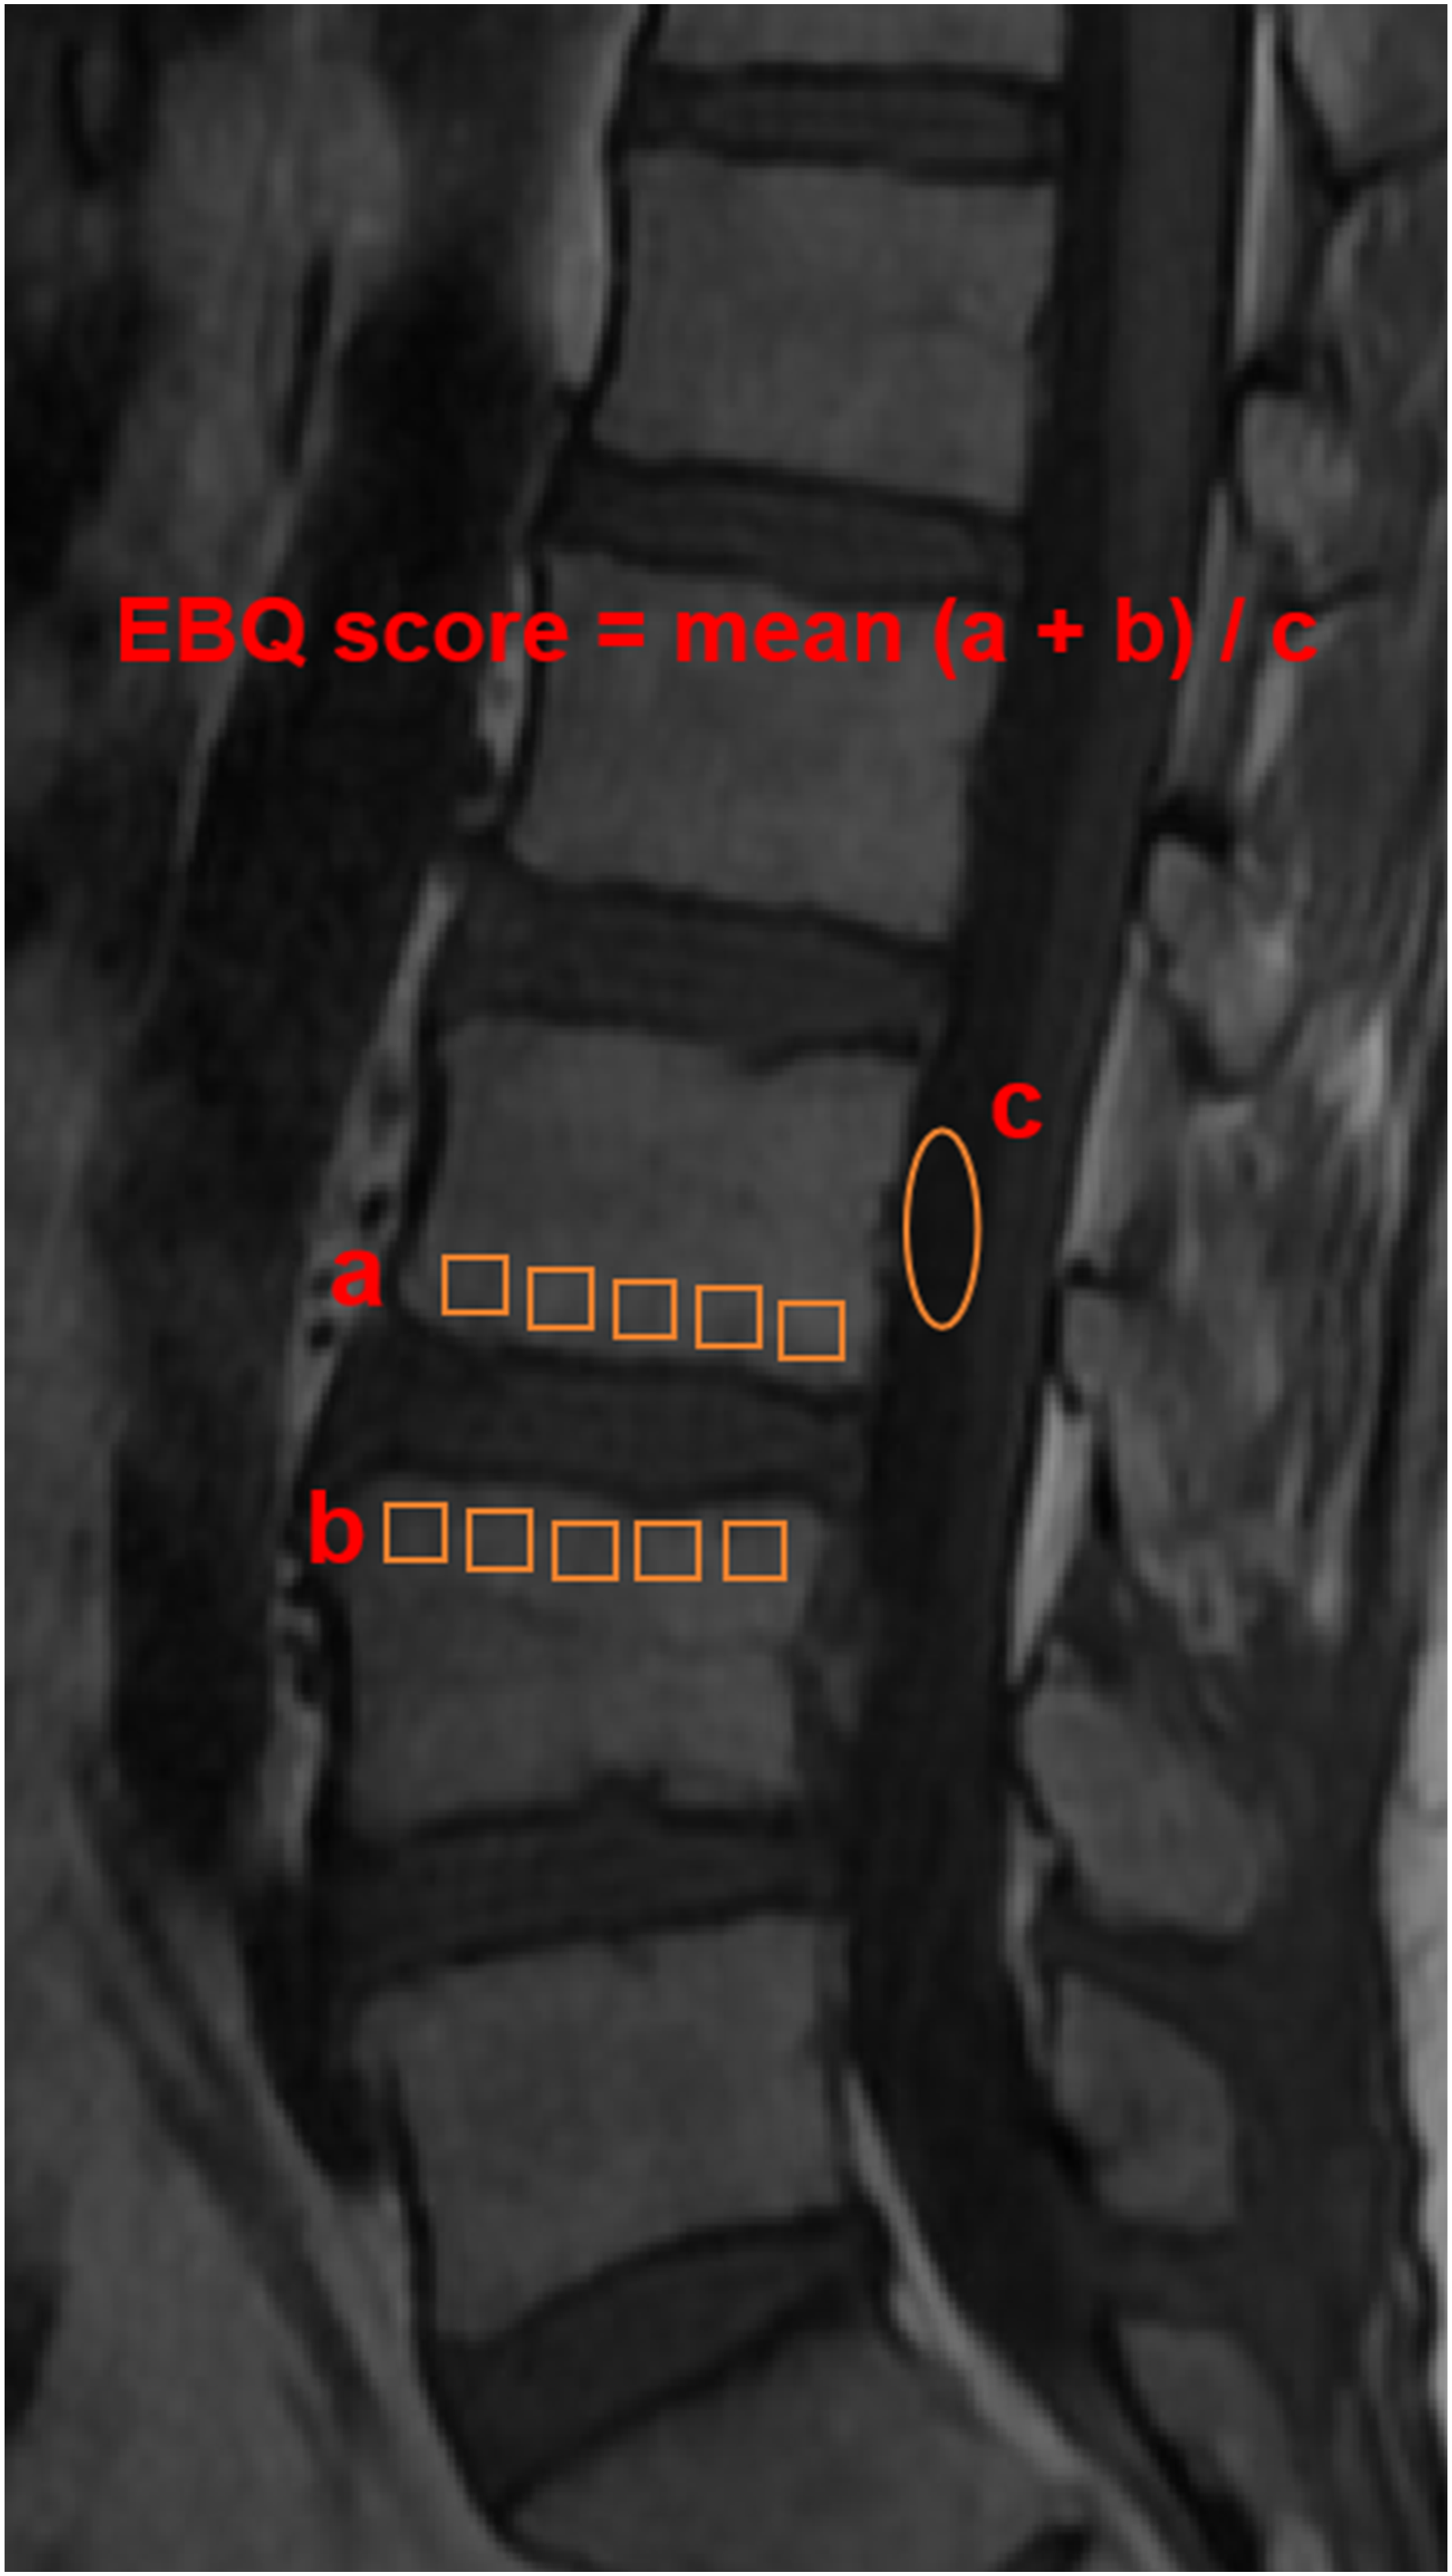
Similarly, HU values are measured using the PACS software and ROI tool on lumbar spine CT scans. When an ROI is placed in any section of the CT image, the system automatically calculates the average HU value for the selected region. The HU values of vertebral cancellous bone (VCB) are determined according to the method described by Schreiber et al.
34
ROIs are placed in 3 distinct axial locations within the vertebral body: beneath the superior endplate, at the vertebral body’s midpoint, and above the inferior endplate. The ROIs are expanded as much as possible (avoiding structures such as venous plexuses) but are restricted to the trabecular bone area to minimize the influence of cortical bone. The HU value for each vertebra is the average HU from the 3 axial images, and the overall lumbar spine HU is the average HU value from L1 to L5 (Figure 3). Illustration of Hounsfield Units (HU) Measurement for a Single Vertebra. On the Axial Plane of a Vertebra, the Largest Possible Elliptical Region of Interest (ROI) is Drawn to Obtain the HU Value (Left). Three Levels are Selected for Each Vertebra—Just Below the Superior Endplate, at the Mid-vertebral Level, and Just Above the Inferior Endplate—For Measurement (Right). The Average HU Value of These Three Levels is Calculated and Used as the HU Value of the Vertebra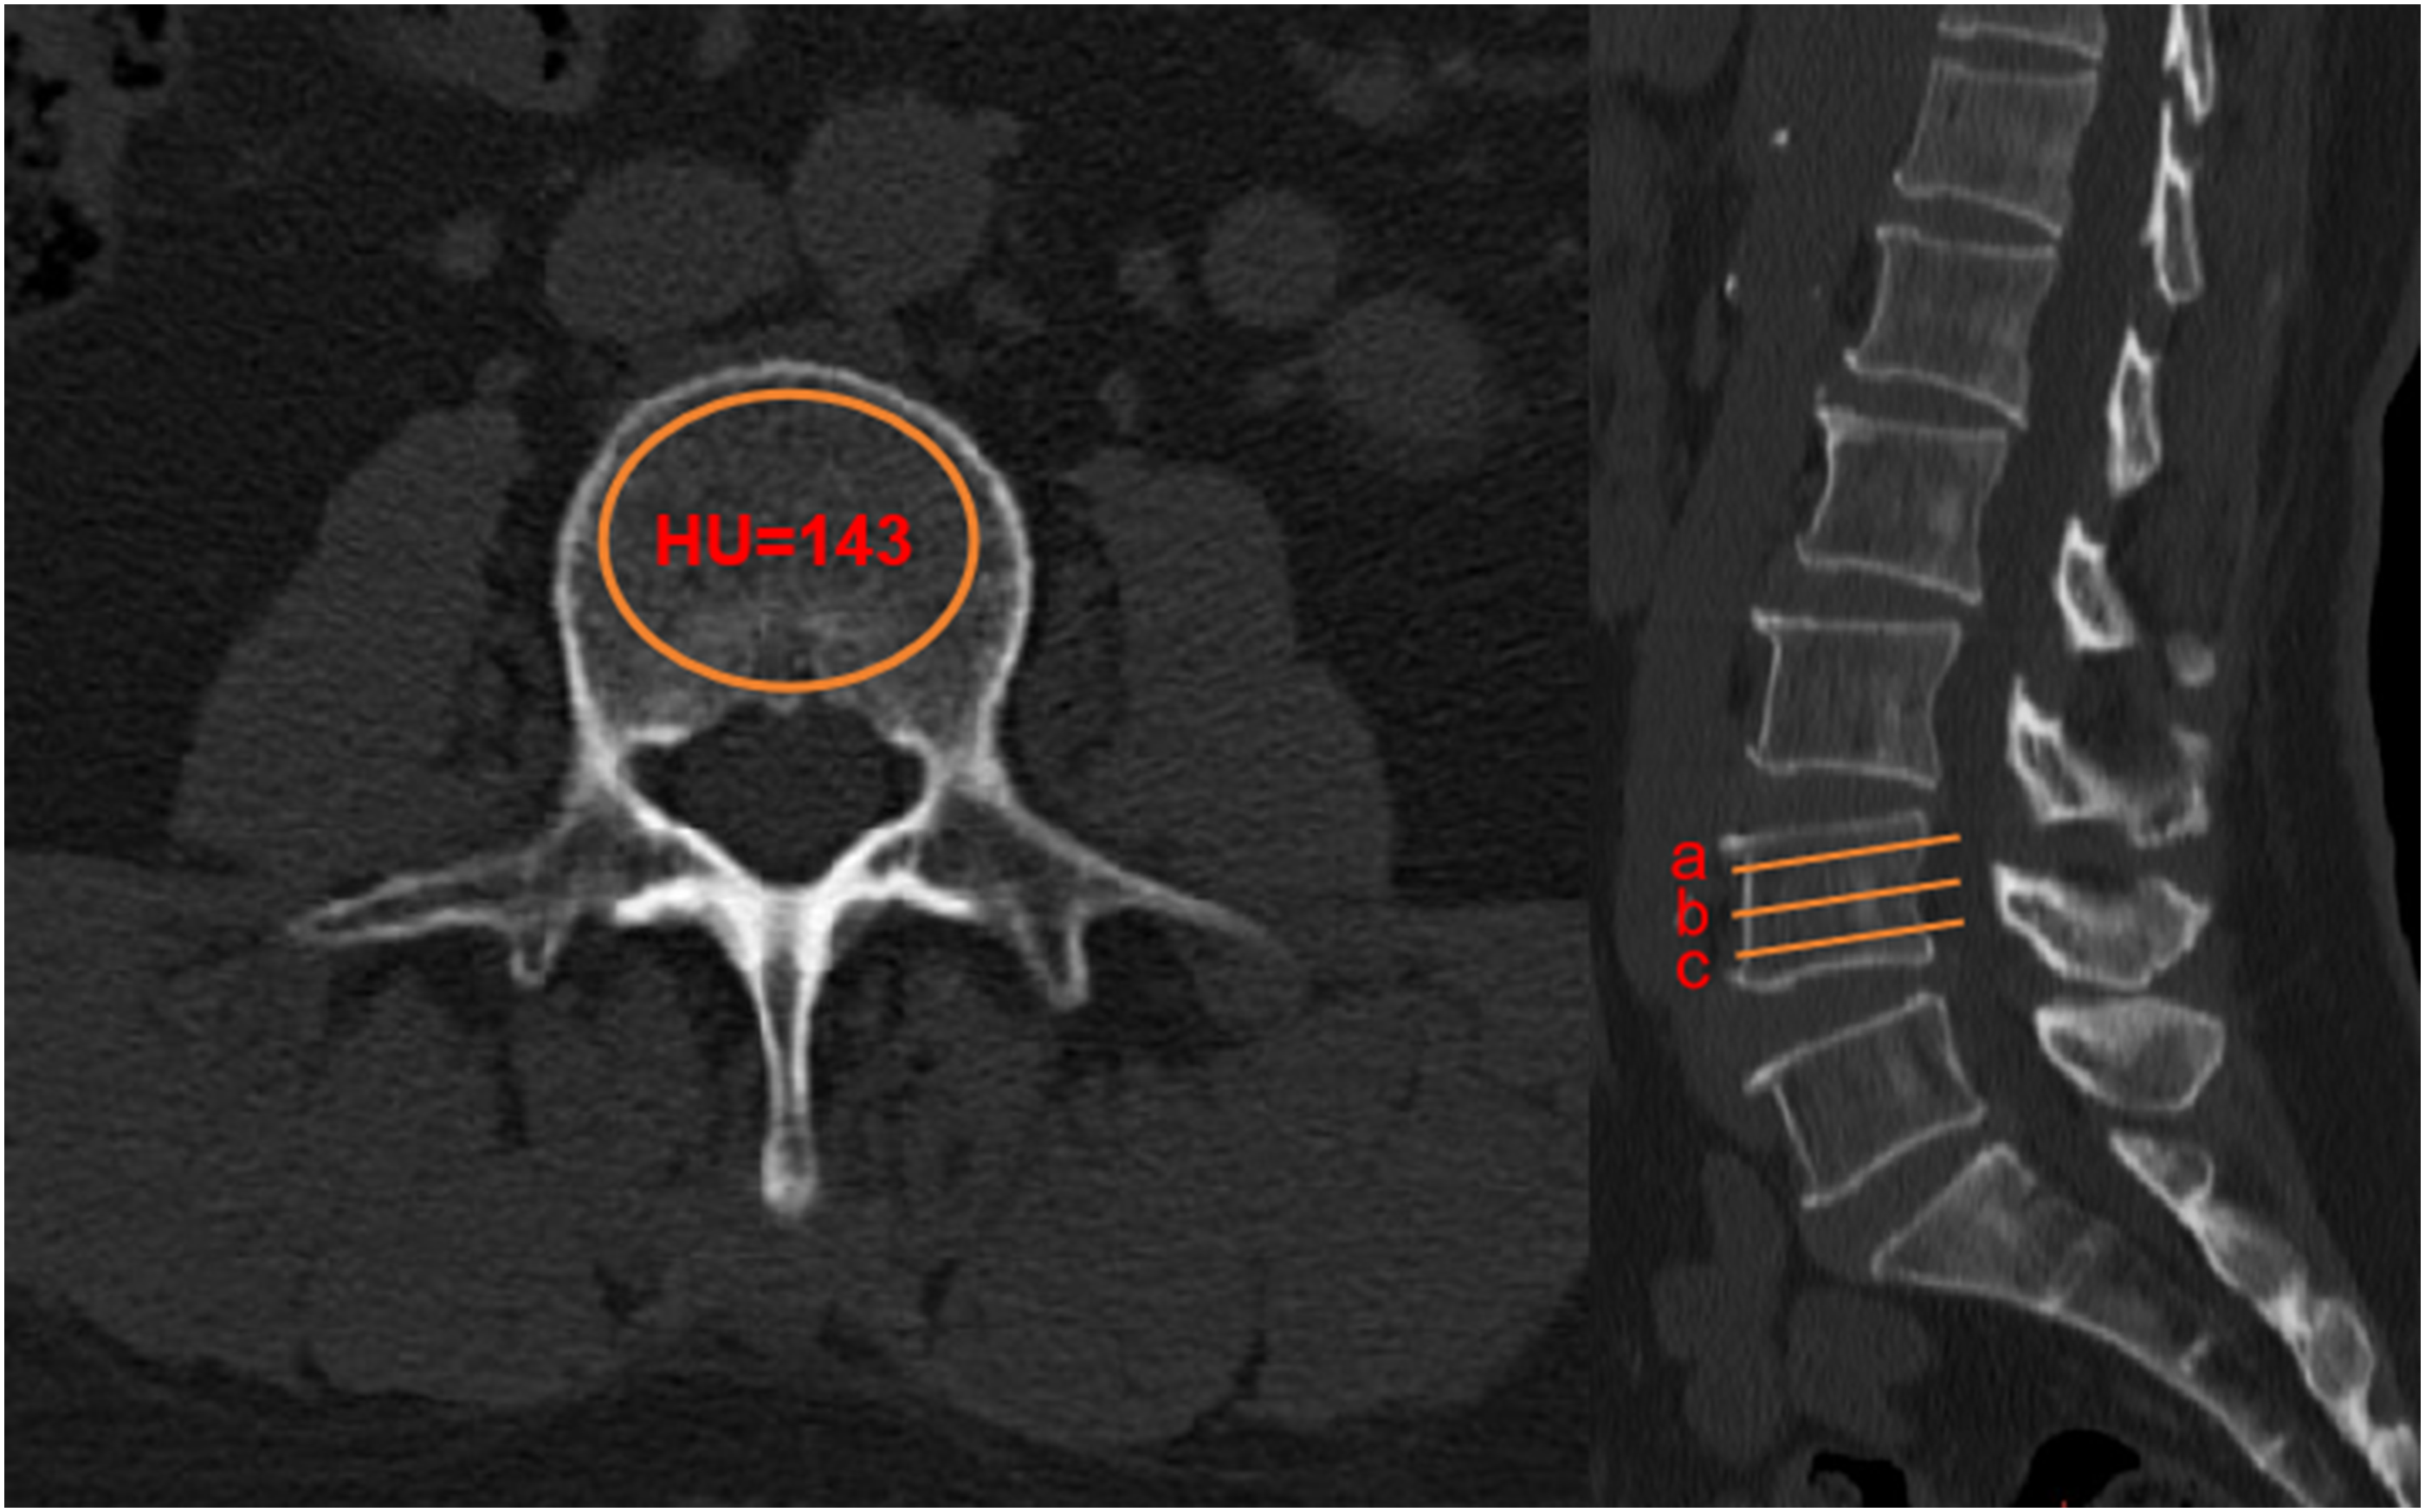
All parameters are independently measured by 2 authors with at least 5 years of experience in lumbar spine surgery. The authors were blinded to the CS status during the measurement process.
Surgical Procedure
All patients underwent standard MIDLIF performed by experienced spine surgeons at the participating centers with a harmonized operative protocol. The patients were positioned in a prone position, and a midline skin incision of approximately 5 cm was made at the lumbar region. The muscles were dissected layer by layer to expose the surgical site. The muscle was then retracted to expose the pars interarticularis. The facet joints were exposed, with care taken to avoid violation of the facet joints near the fusion segments. Decompression in each surgical level was achieved through partial laminectomy, unilateral or bilateral inferior facetectomy and partial superior facetectomy. The CBT screws used by the surgeon typically had a diameter of 5.5 mm and a length ranging from 35 to 40 mm.
An appropriate-sized cage was inserted into the intervertebral space. The height of the cage is selected based on the individual patient’s condition. If the height is too low, it will fail to maintain an effective intervertebral height, while if it is too high, subsidence is more likely to occur. For patients with mild to moderate lumbar degenerative disease, the cage height is typically no more than 2 mm higher than the original intervertebral height. For patients with severe degeneration, a cage close to the original intervertebral height can be chosen. The cage height can also be determined based on the intervertebral height of the adjacent segment, and should not exceed 1.5 mm of the height of the proximal disc. The most commonly used cage height is 10-12 mm. A longer cage is less likely to experience subsidence and better maintains segmental lordosis, while a shorter cage increases the risk of posterior migration. The cage length should be determined based on preoperative measurements and intraoperative fluoroscopy, with the most commonly used length being 22-28 mm.
Based on the concept of enhanced recovery after surgery, patients were asked to begin limb function exercises in bed as soon as they were awake from anesthesia. These exercises include ankle pumps, heel slides, single knee to chest stretch, and hamstring stretch. On the first postoperative day, patients could try to sit up and begin standing. It was recommended that patients started mobilizing after drainage tube removal. Postoperatively, back muscle exercises such as prone arms and legs raise, hip raise, walking, and swimming began to be performed 3 months after surgery.
Statistical Analysis
Statistical analyses were performed using SPSS (version 26) and R (version 4.2.1). Continuous variables with normal distribution were presented as mean ± standard deviation and were analyzed using independent t-tests. Data with a non-normal distribution were expressed as median (interquartile range, IQR) and analyzed using the Mann-Whitney U test. Categorical variables were presented as proportions and compared using the chi-square test. A P-value <0.05 was considered statistically significant. Significant variables from the univariate analysis were entered into a multivariate logistic regression model. A backward stepwise selection approach, using the Akaike Information Criterion (AIC) to achieve optimal model fit, was applied to identify independent prognostic factors. A visual nomogram was constructed using R, and the model’s predictive performance was evaluated by ROC, calibration curves, and DCA. Inter-rater reliability for EBQ was summarized using the intraclass correlation coefficient (ICC) with 95% confidence intervals. To define clinically meaningful operating thresholds, we prespecified a cost-sensitive threshold sensitivity analysis across a range of clinically plausible false-negative: false-positive (FN:FP) cost ratios and summarized sensitivity, specificity, positive predictive value (PPV), negative predictive value (NPV), F1-score, and net benefit across this range; the cost ratio and probability threshold determined by this procedure were applied to model risk stratification and implemented in the web-based calculator. The development-center cohort was randomly split into a training set and an internal validation set using stratified sampling by the outcome (CS vs non-CS) to preserve prevalence balance. To ensure reproducibility, we used a fixed random seed (eg, 2024) and the caret::createDataPartition strategy in R.
Results
Basic Characteristics of the Patients
Comparison of Baseline Characteristics Between Training Set, Internal Validation Set, and External Validation Set
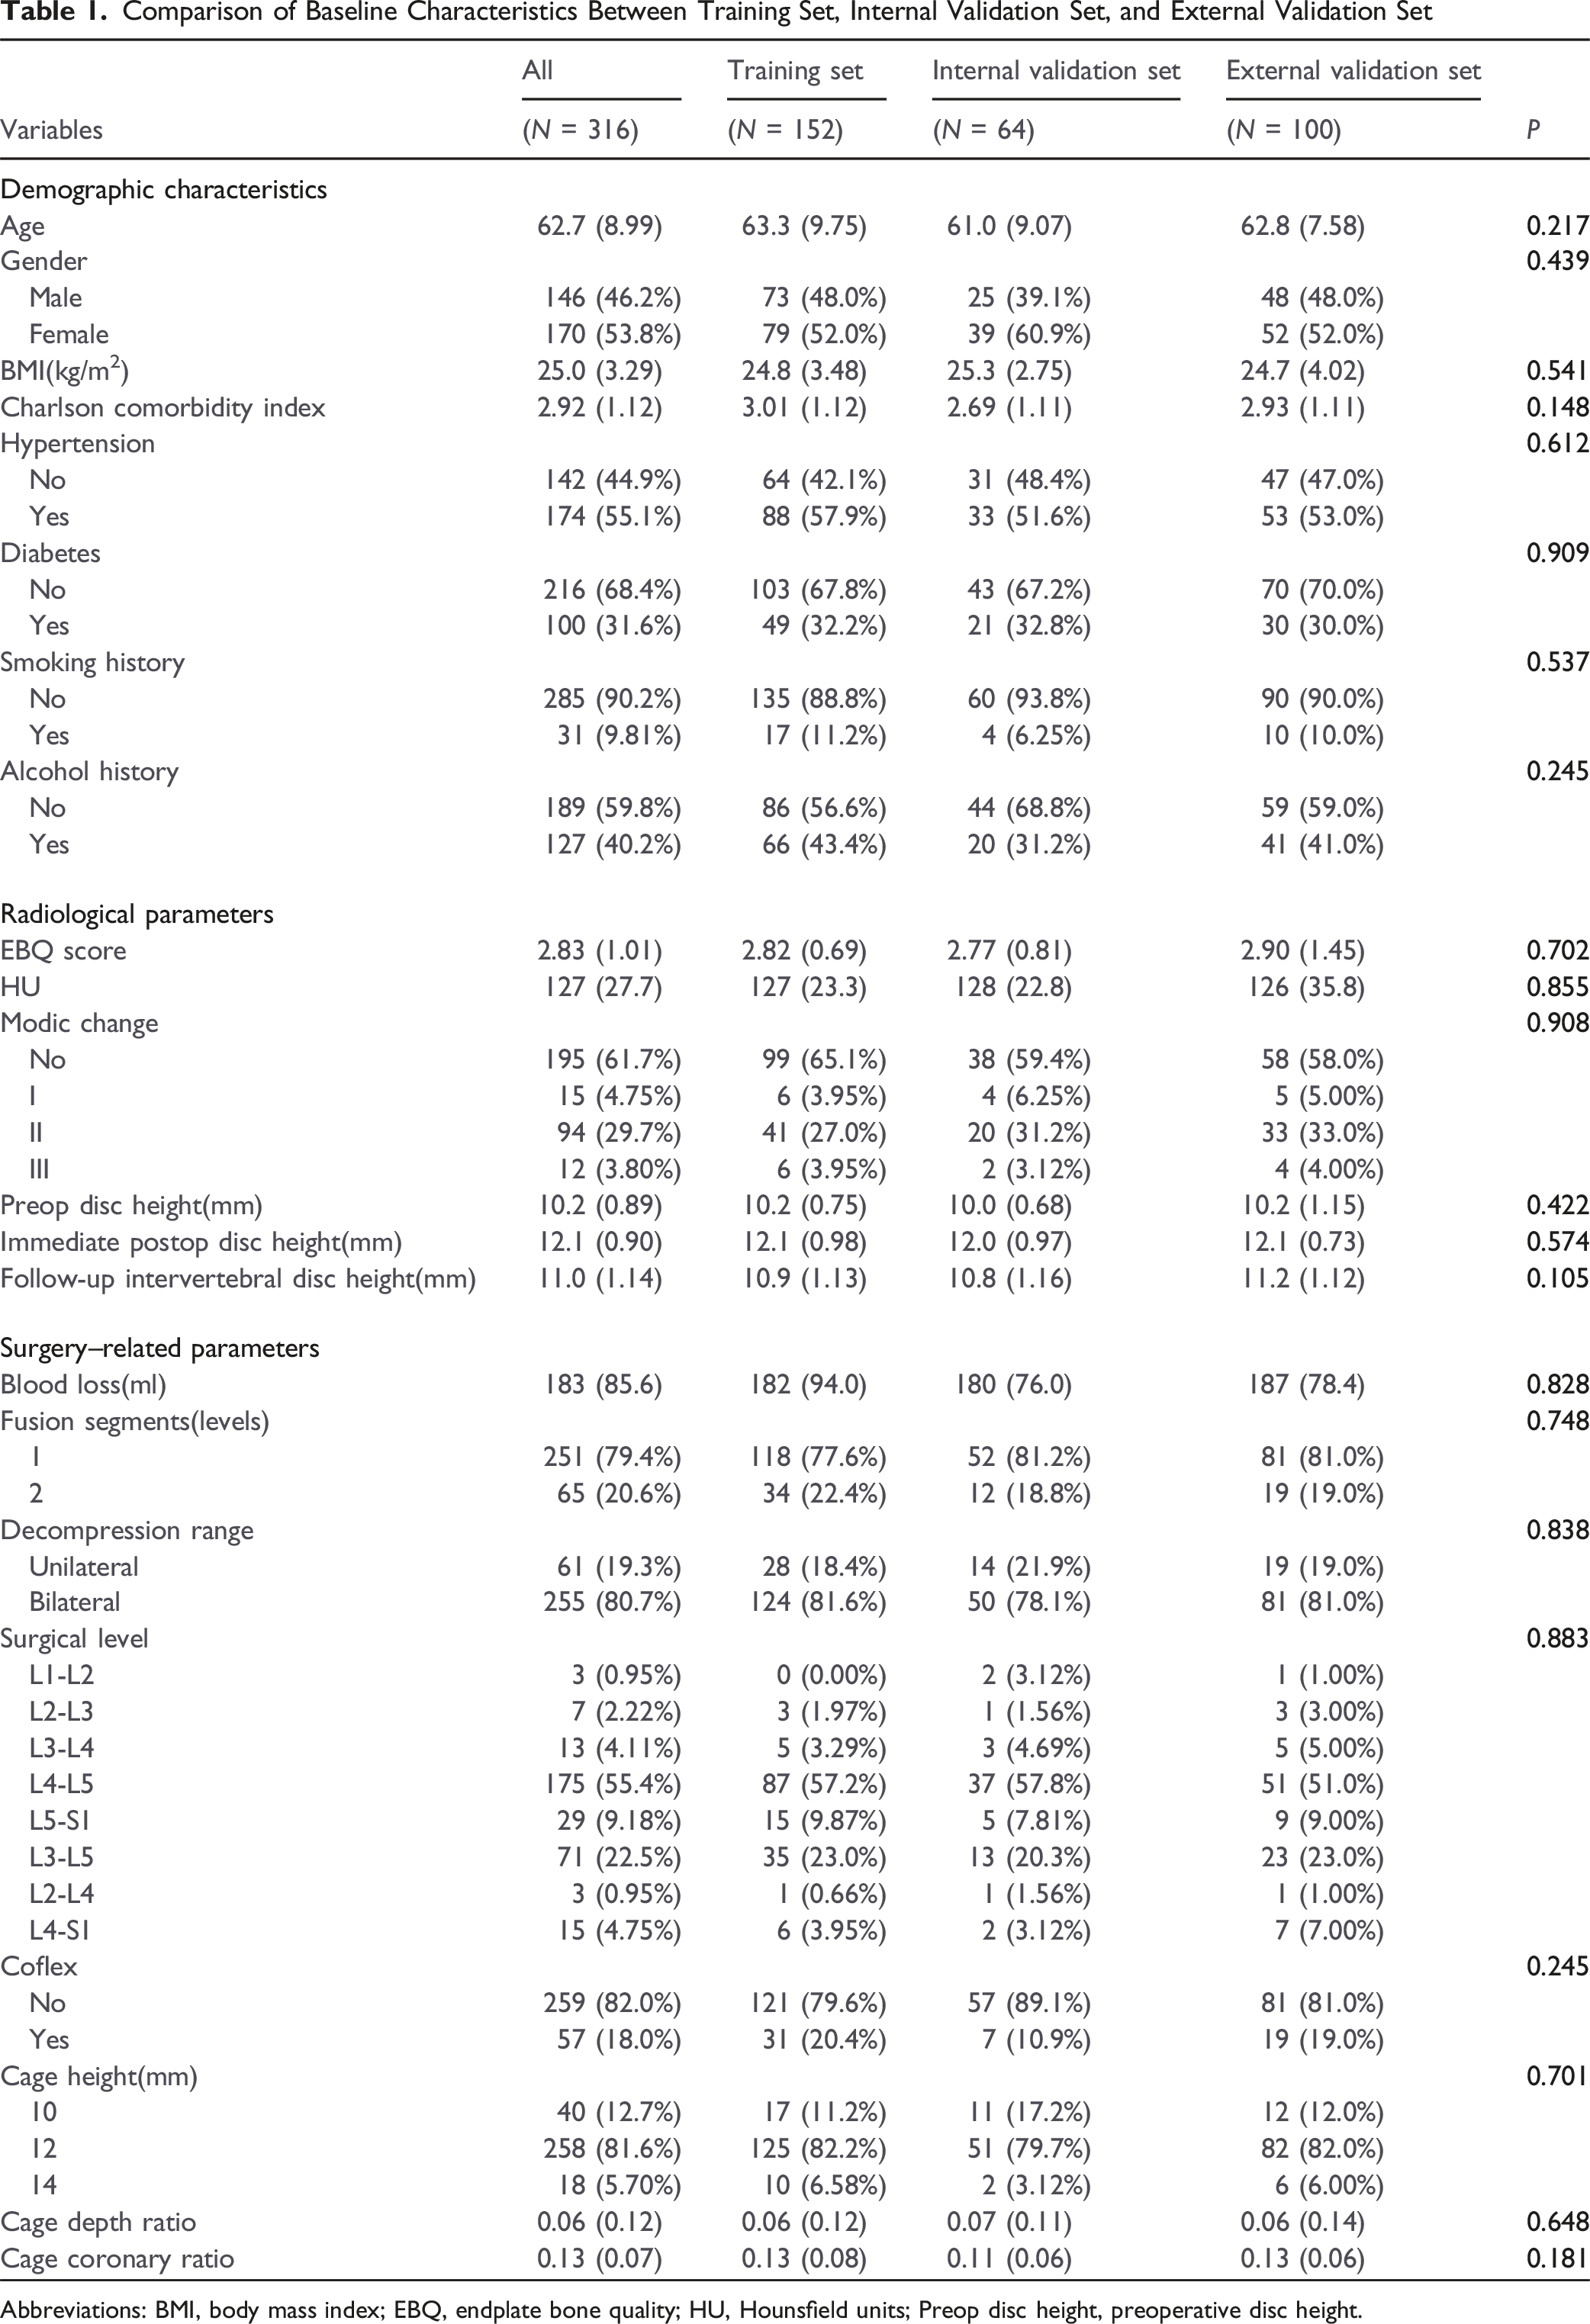
Abbreviations: BMI, body mass index; EBQ, endplate bone quality; HU, Hounsfield units; Preop disc height, preoperative disc height.
Univariate and Multivariate Analysis
Univariate Logistic Regression Analysis for Potential Risk Factors of Cage Subsidence After MIDLIF
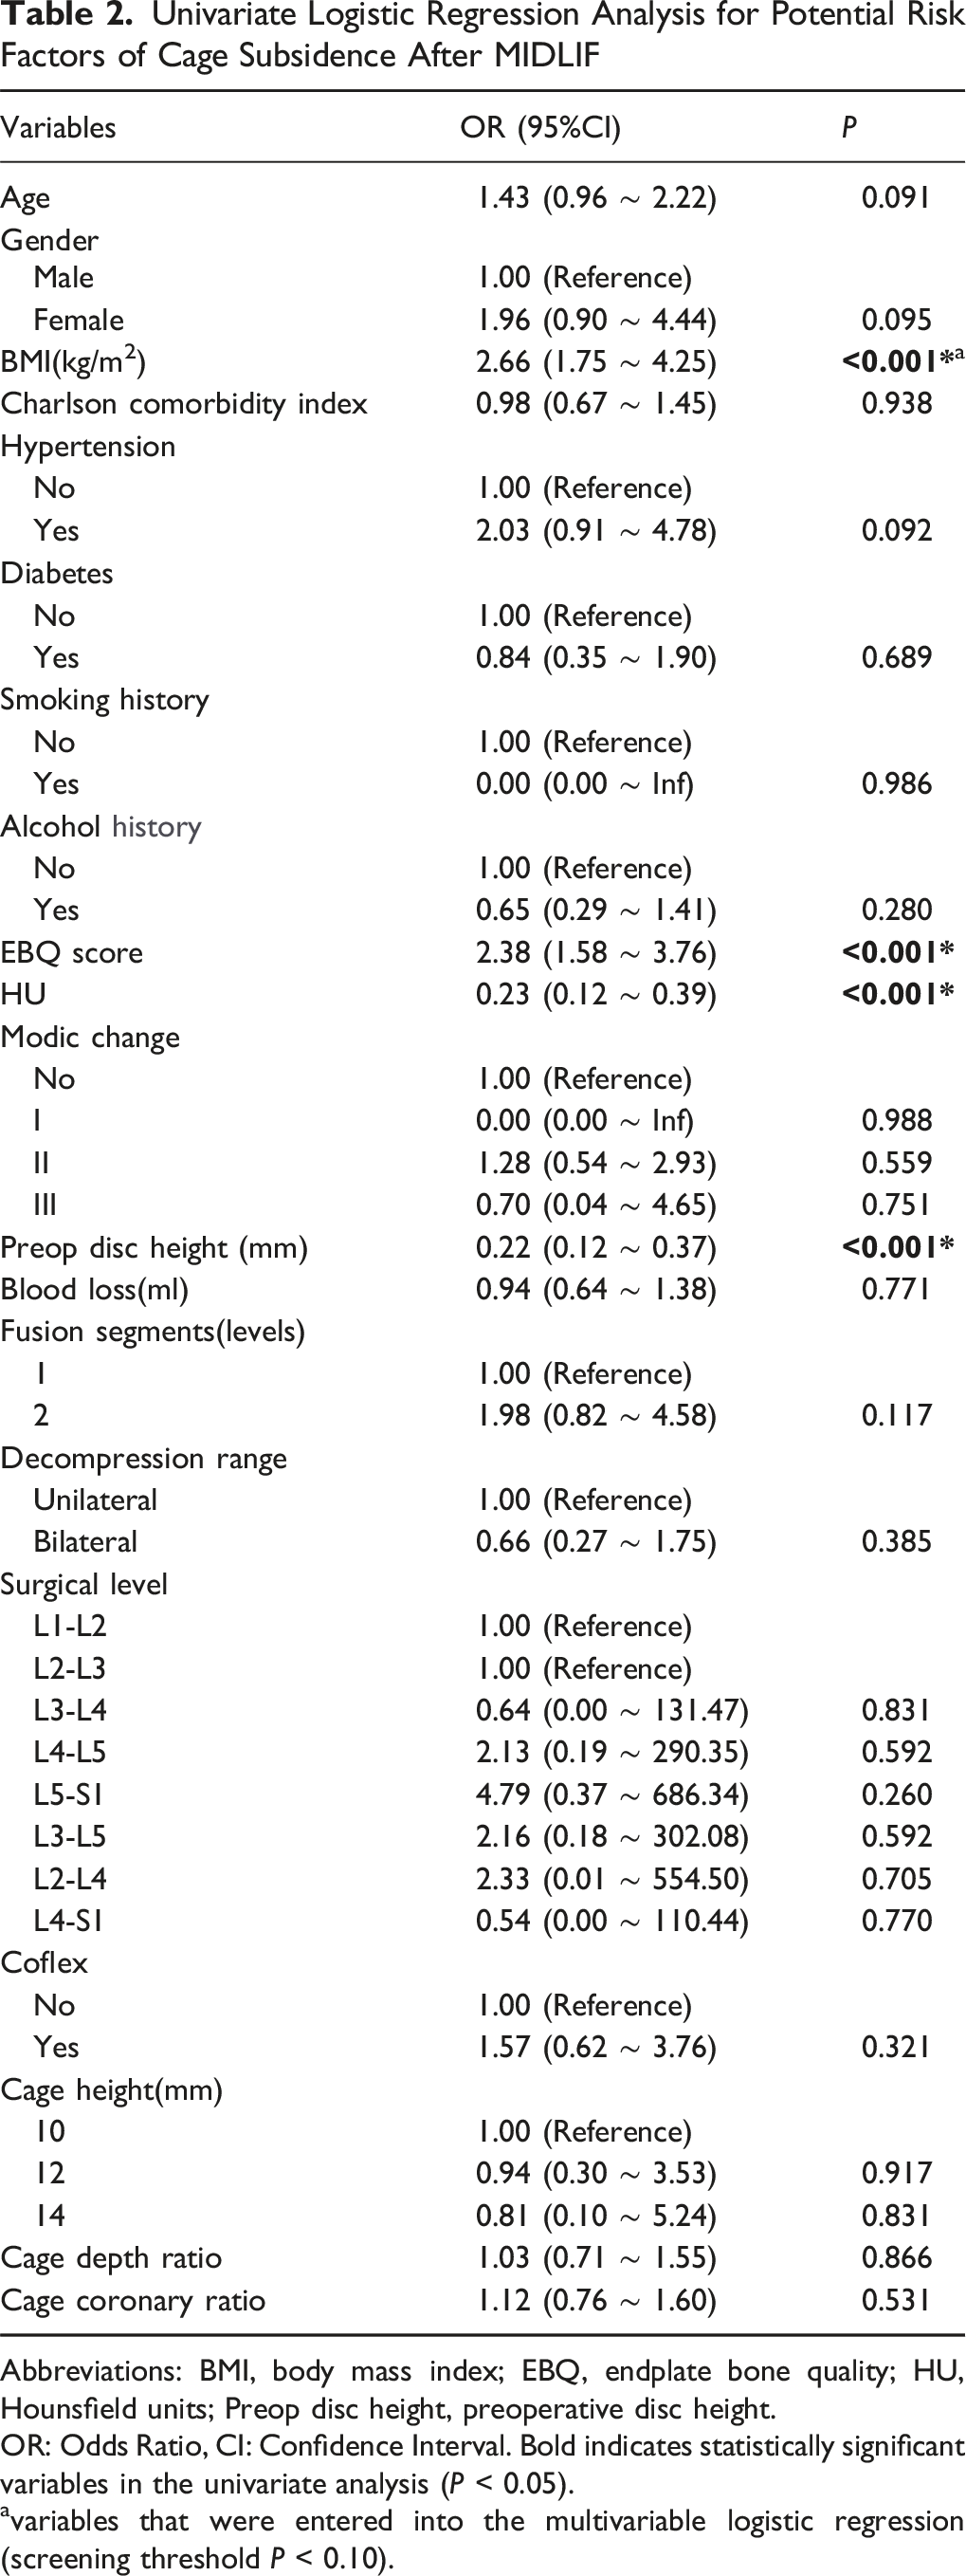
Abbreviations: BMI, body mass index; EBQ, endplate bone quality; HU, Hounsfield units; Preop disc height, preoperative disc height.
OR: Odds Ratio, CI: Confidence Interval. Bold indicates statistically significant variables in the univariate analysis (P < 0.05).
variables that were entered into the multivariable logistic regression (screening threshold P < 0.10).
Multivariate Logistic Regression Analysis for Potential Risk Factors of Cage Subsidence After MIDLIF
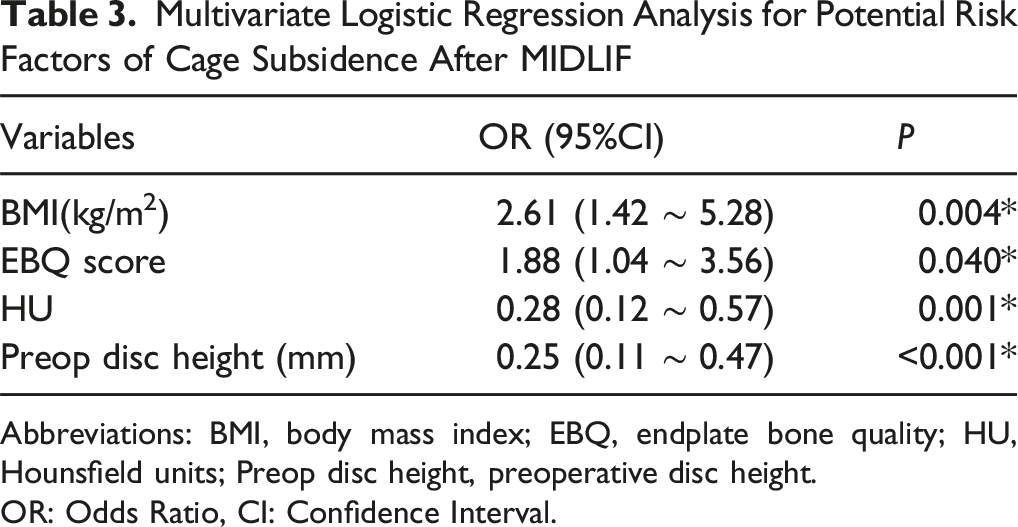
Abbreviations: BMI, body mass index; EBQ, endplate bone quality; HU, Hounsfield units; Preop disc height, preoperative disc height.
OR: Odds Ratio, CI: Confidence Interval.
To assess potential multicollinearity among the variables included in the multivariate regression model, Pearson correlation analysis was conducted. The correlation heatmap revealed that all pairwise Pearson correlation coefficients were below 0.3, indicating no significant collinearity between predictors (Figure 4). In addition, the variance inflation factor (VIF) analysis showed that all VIF values were below 2.0, confirming the absence of multicollinearity among the included variables. Therefore, all 4 variables (BMI, EBQ score, HU, and preoperative disc height) were considered suitable for inclusion in the final model. Pearson Correlation Heatmap of the Four Predictors Included in the Multivariate Logistic Regression Model. The Heatmap Shows the Pairwise Pearson Correlation Coefficients Among BMI, EBQ Score, HU Value, and Preoperative Disc Height in the Training Set. All Absolute Correlation Coefficients (|r|) are less than 0.3, Indicating No Significant Multicollinearity Among Variables. Asterisks Indicate Statistical Significance (*P < 0.1, **P < 0.05, ***P < 0.01)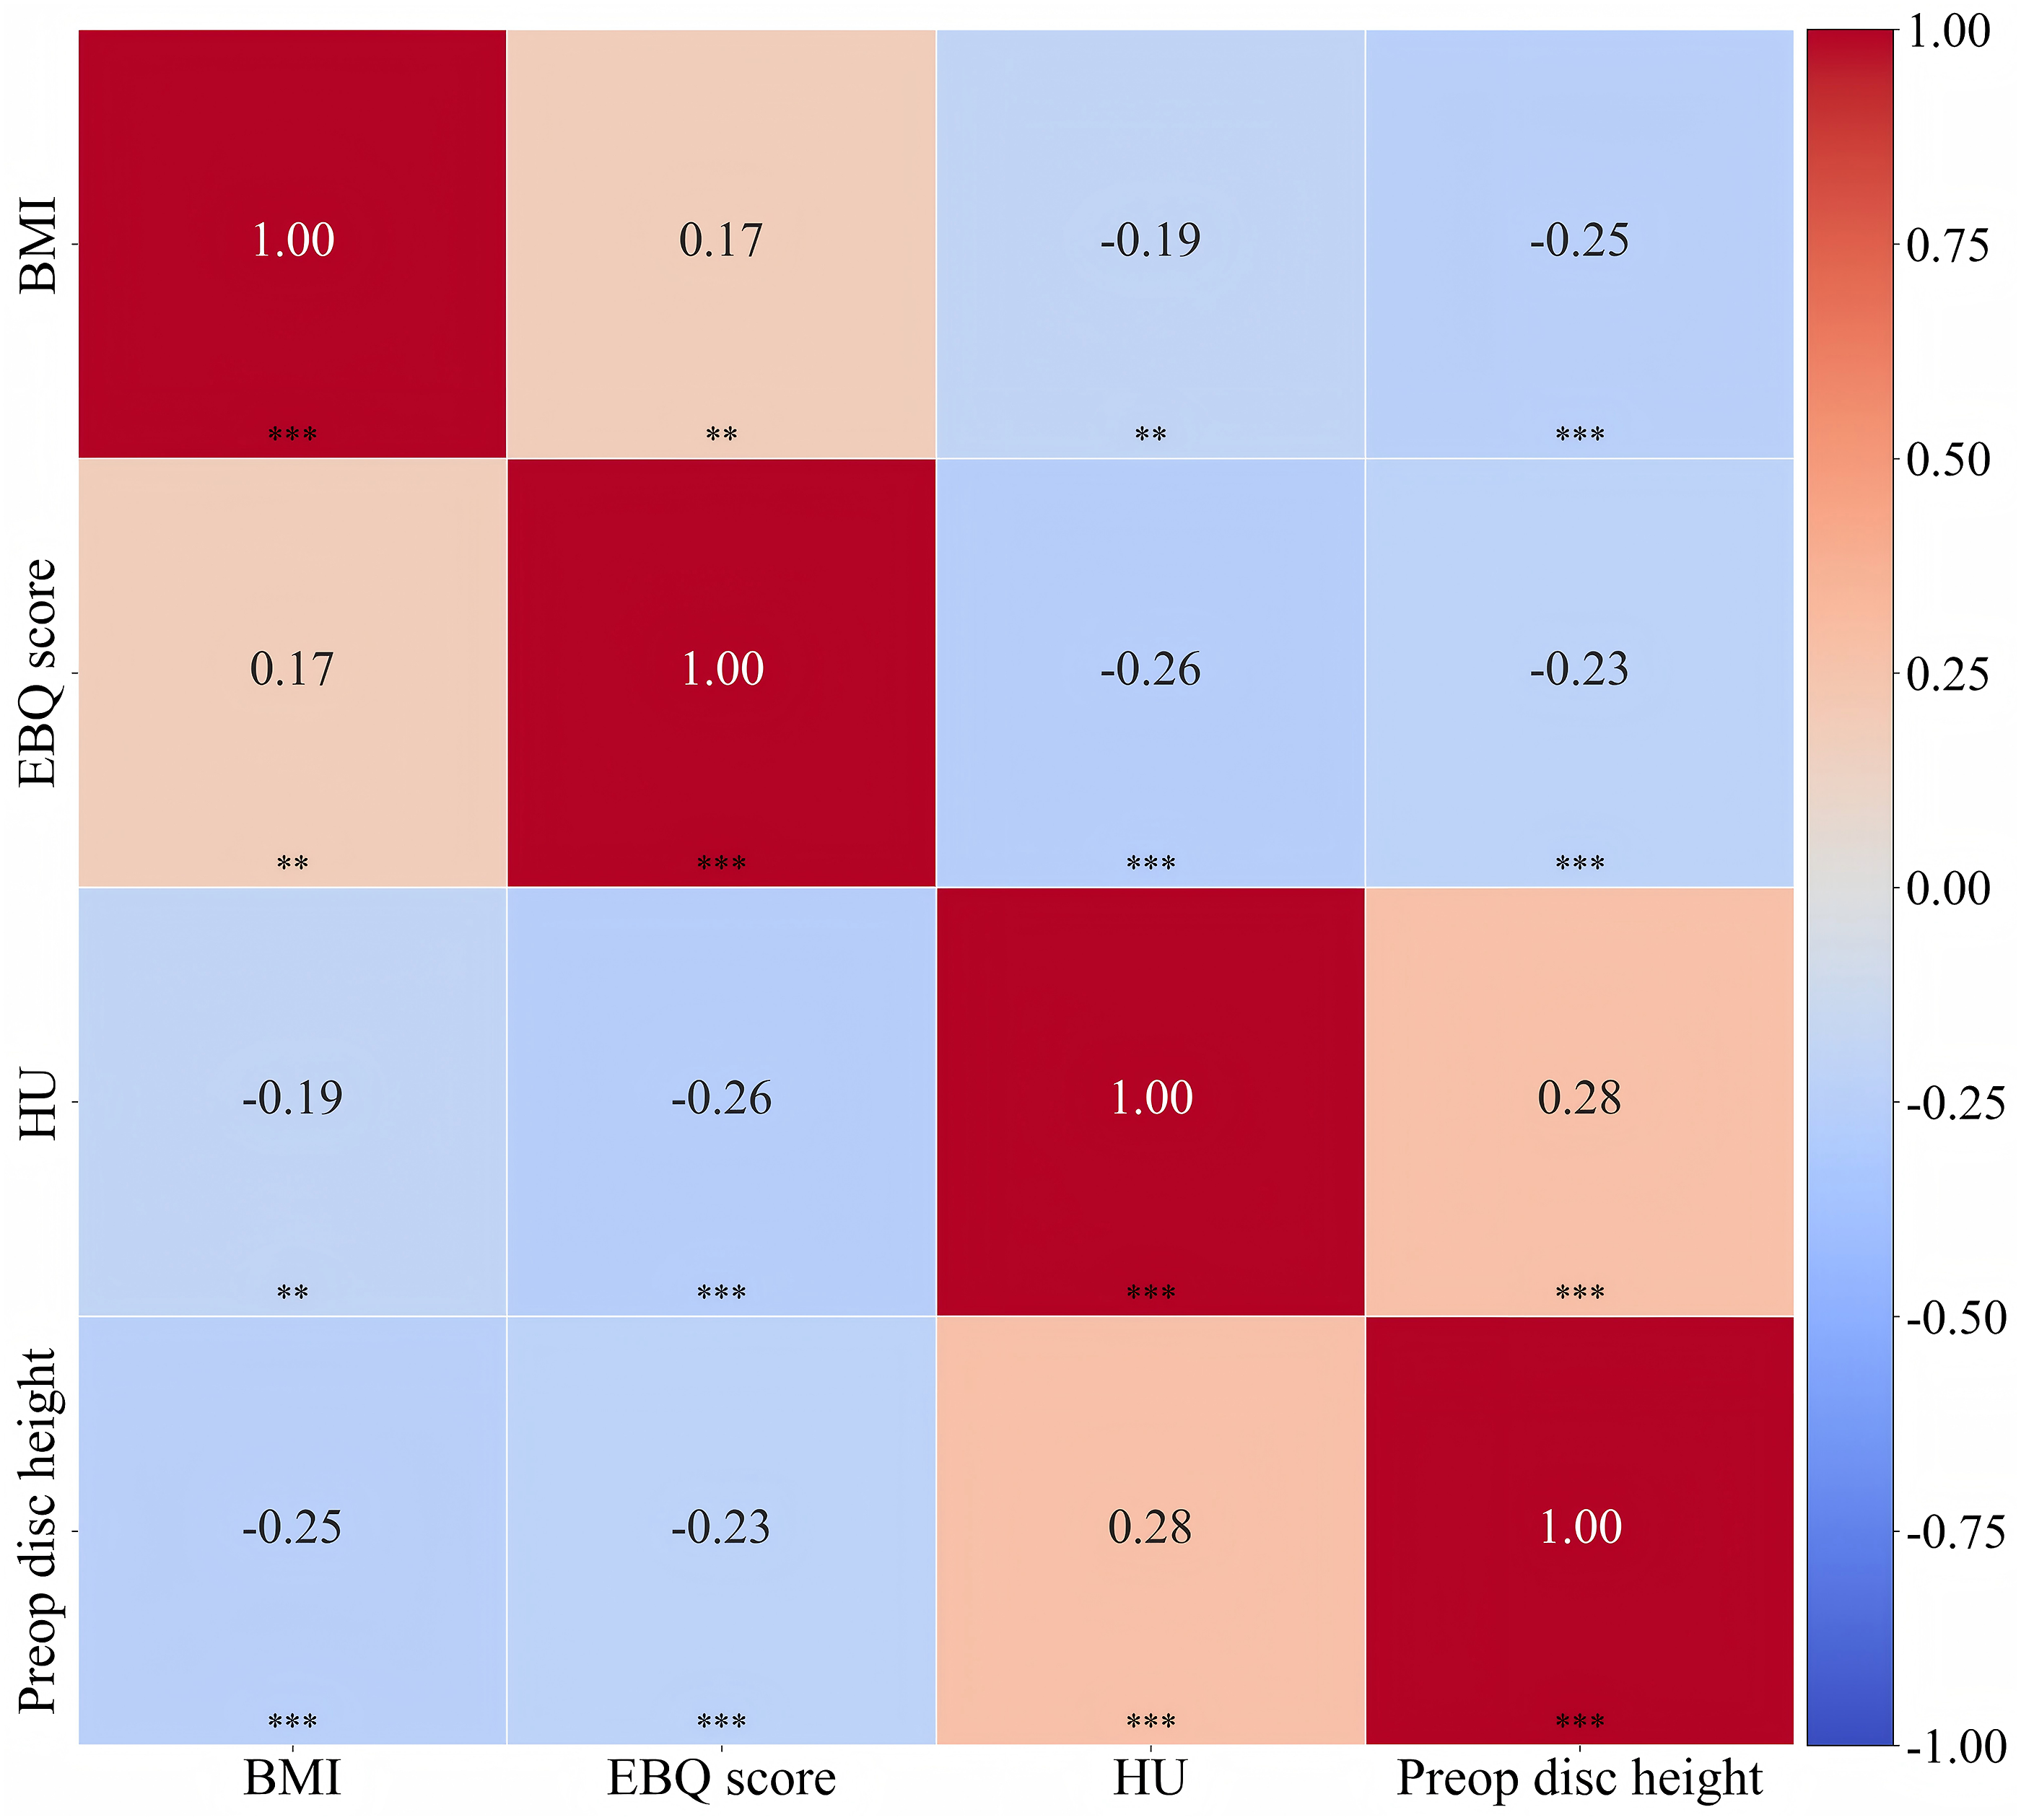
Establishment of the Nomogram
The nomogram was constructed using the training cohort. Initially, univariate logistic regression analysis was performed to identify variables significantly associated with CS. Significant variables from the univariate analysis were entered into a multivariate logistic regression model. A backward stepwise selection approach, using the Akaike Information Criterion (AIC) to achieve optimal model fit, was applied to identify independent prognostic factors. These identified factors were then incorporated into the nomogram to predict the probability of CS. Each parameter in the nomogram was allocated a weighted score based on its relative importance, and the sum of these scores yielded an overall risk estimate, which was then converted to the predicted probability of CS (Figure 5). The Nomogram of CS after MIDLIF in Patients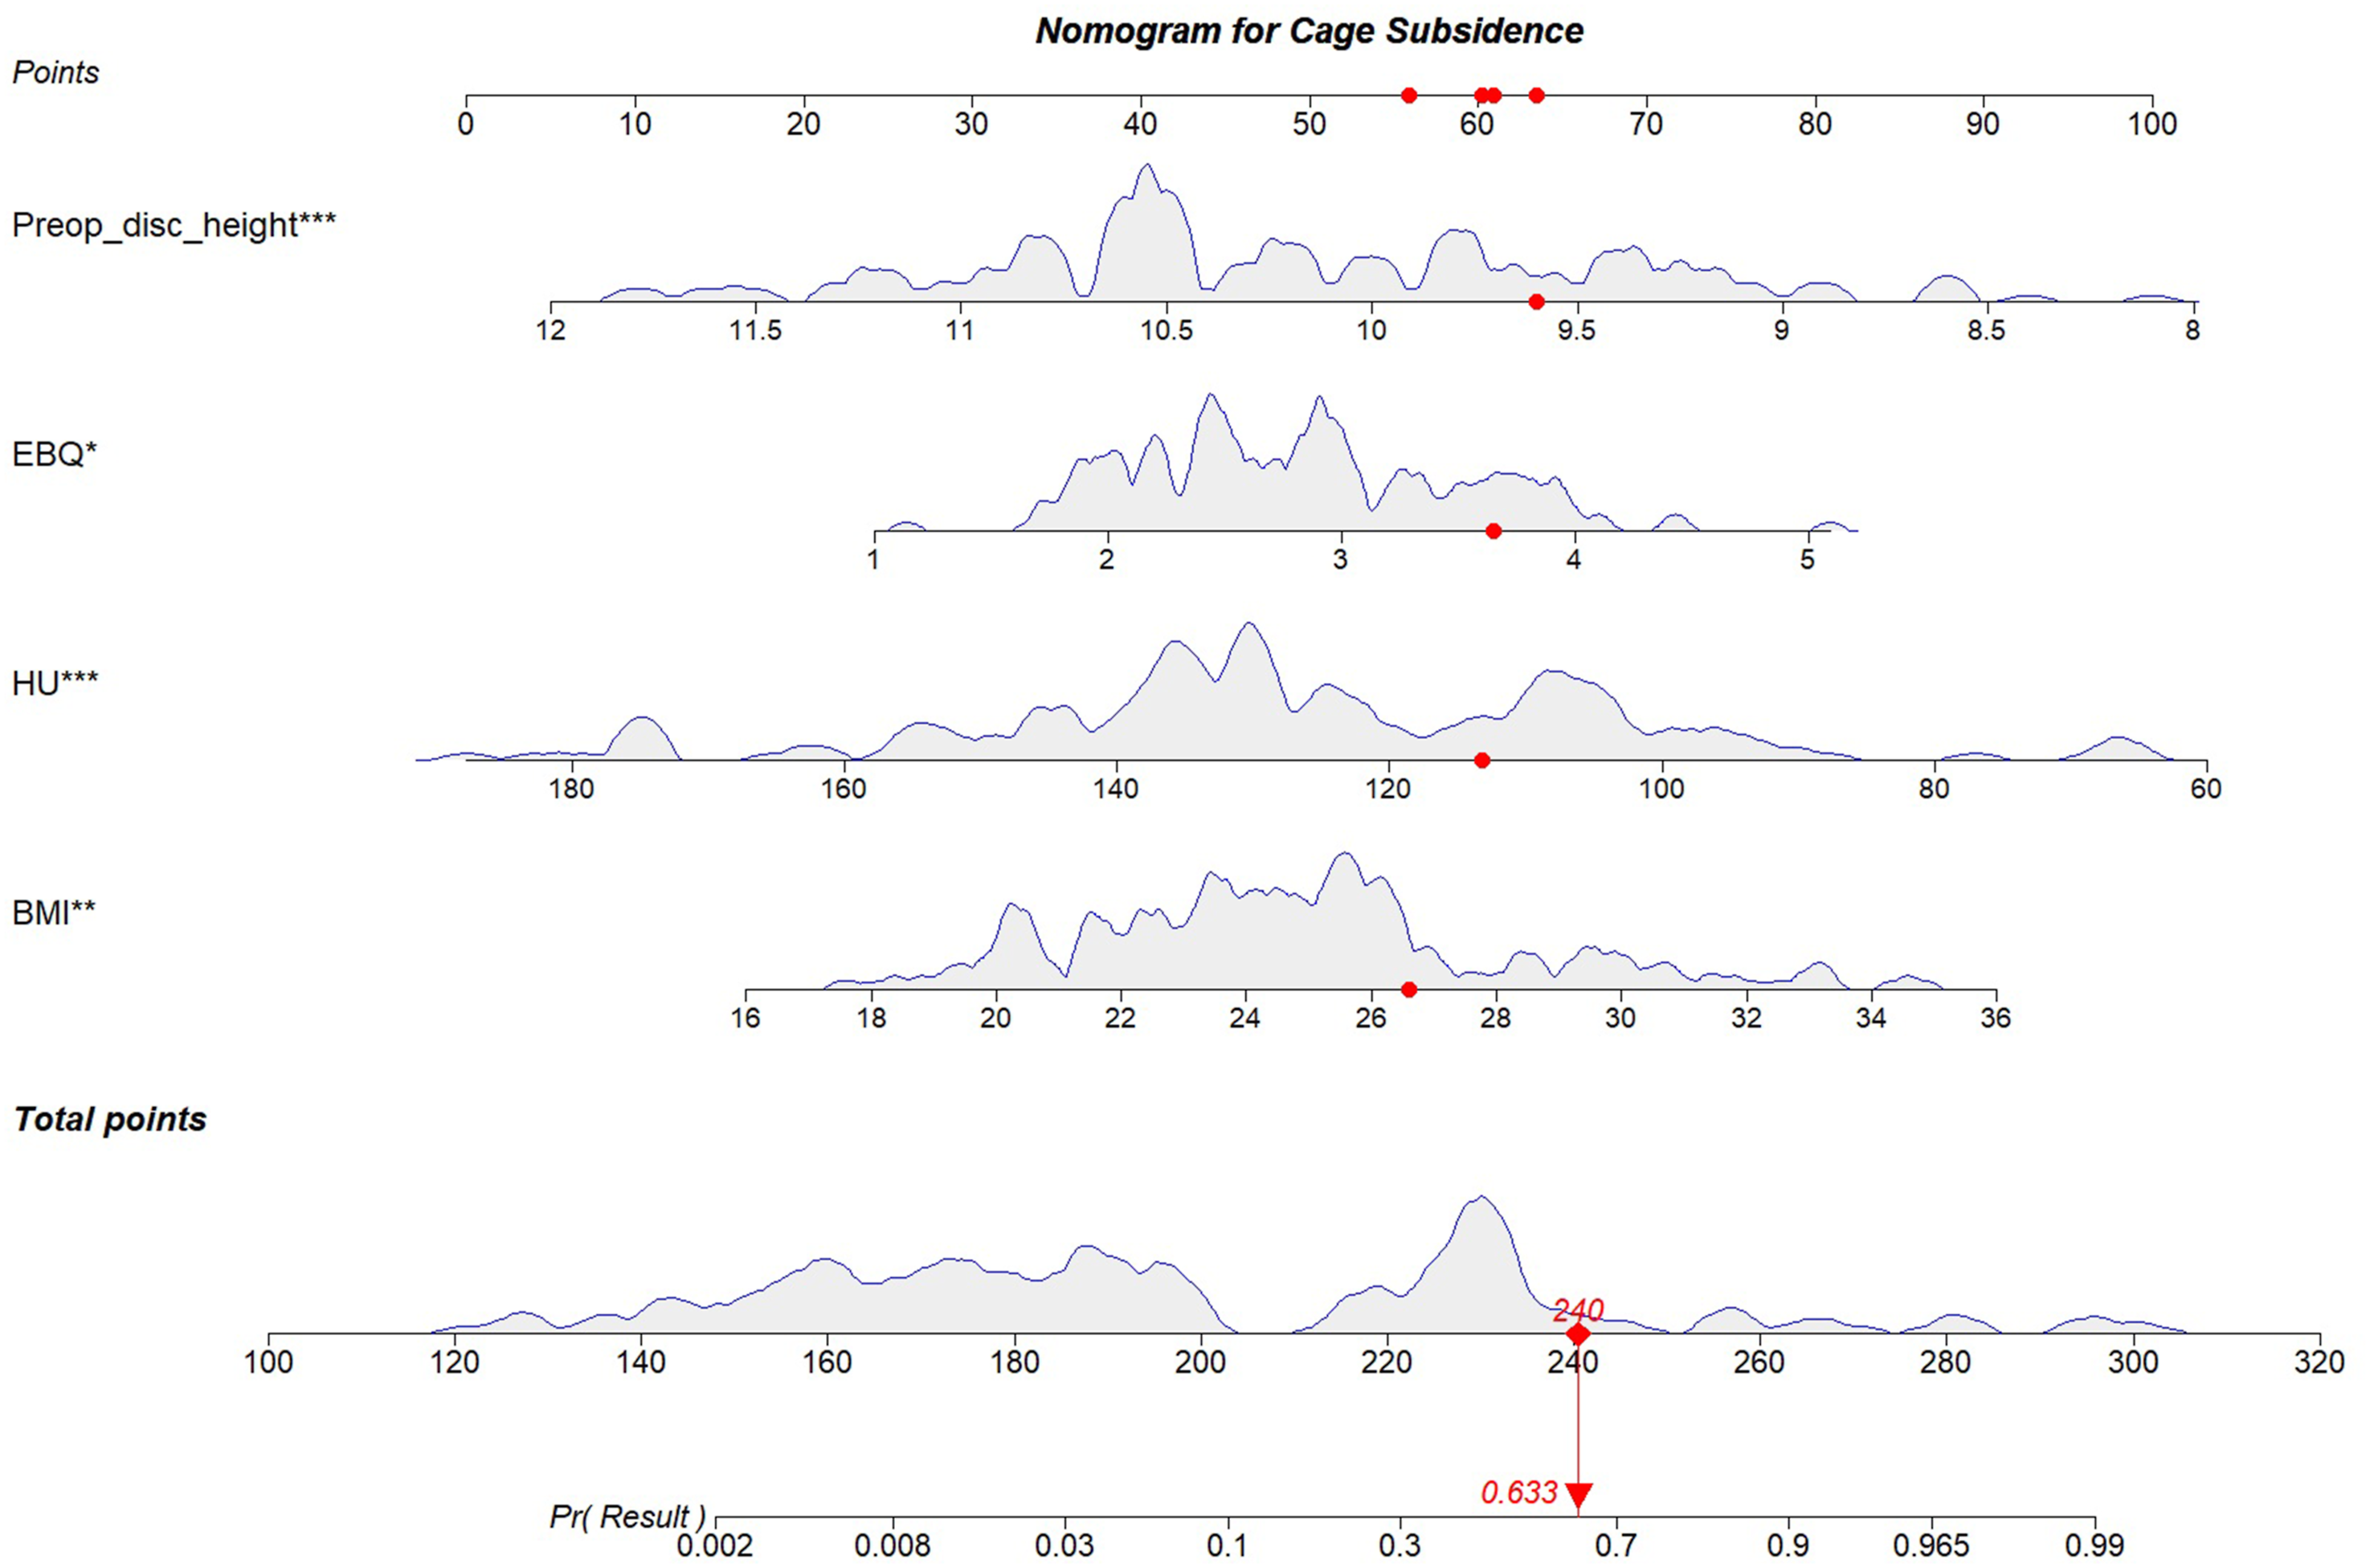
Validation of the Efficiency and Clinical Application of the Nomogram
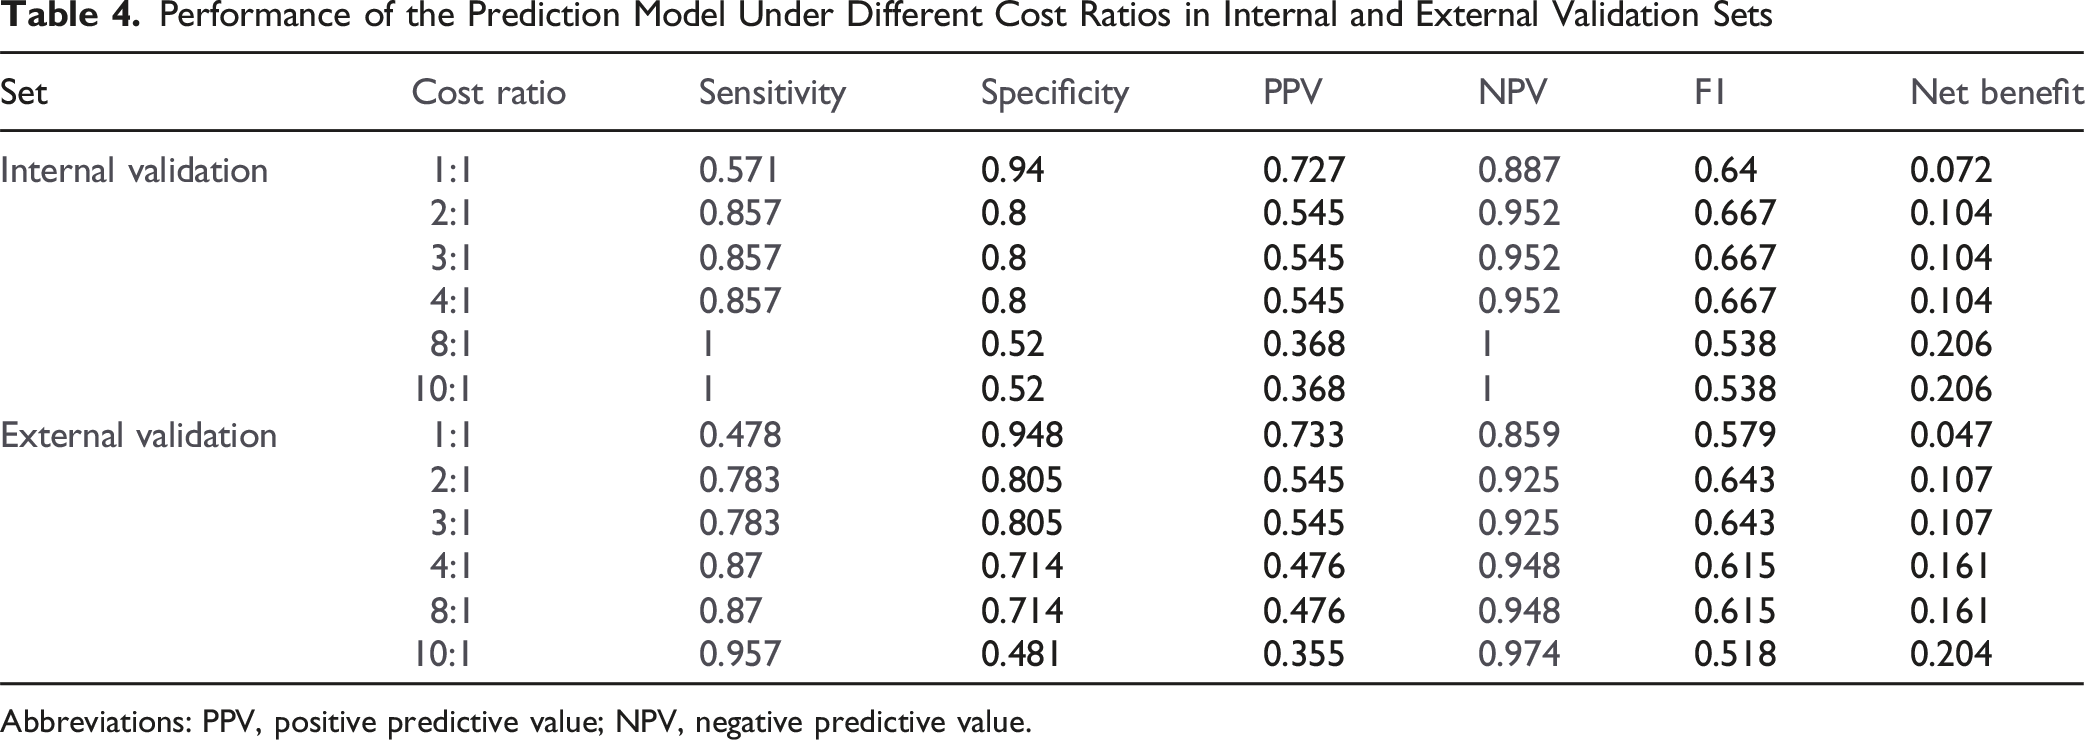
The prediction model demonstrated strong performance in both the training and validation cohorts. In the training set, the AUC was 0.924, and in the internal validation set, the AUC was 0.884, confirming excellent discrimination ability (Figure 6). In the geographically external cohort, the model maintained good discrimination (AUC = 0.842). The results of cost-sensitive threshold sensitivity analysis were demonstrated in Table 4. For the internal validation set, cost ratios in the 2:1-4:1 range offered a preferable trade-off—maintaining high sensitivity (0.857) while preserving acceptable specificity (0.800) and stable overall performance (F1 = 0.667, net benefit = 0.104); by contrast, moving to 8:1 increased sensitivity to 1.000 but at the expense of markedly lower specificity (0.520) and PPV (0.368) with a drop in F1 (0.538), implying excessive over-intervention. For the external cohort, the 4:1-8:1 range provided a better balance than 1:1-3:1, delivering higher sensitivity (0.870) with still-reasonable specificity (0.714) and improved F1 (0.615) and net benefit (0.161). In short, our operating principle was to prioritize not missing CS (keep sensitivity as high as feasible) while simultaneously balancing overall model performance (F1 and net benefit) and avoiding unacceptable losses in specificity/PPV. At an FN: FP = 4:1 cost ratio, the cost-minimizing probability cutoff was 0.074 for the training set (sensitivity 0.971, specificity 0.754). ROC of the Prediction Risk Model. (A) Training Cohort, (B) Internal Validation Cohort, (C) External Validation Cohort Performance of the Prediction Model Under Different Cost Ratios in Internal and External Validation Sets Abbreviations: PPV, positive predictive value; NPV, negative predictive value.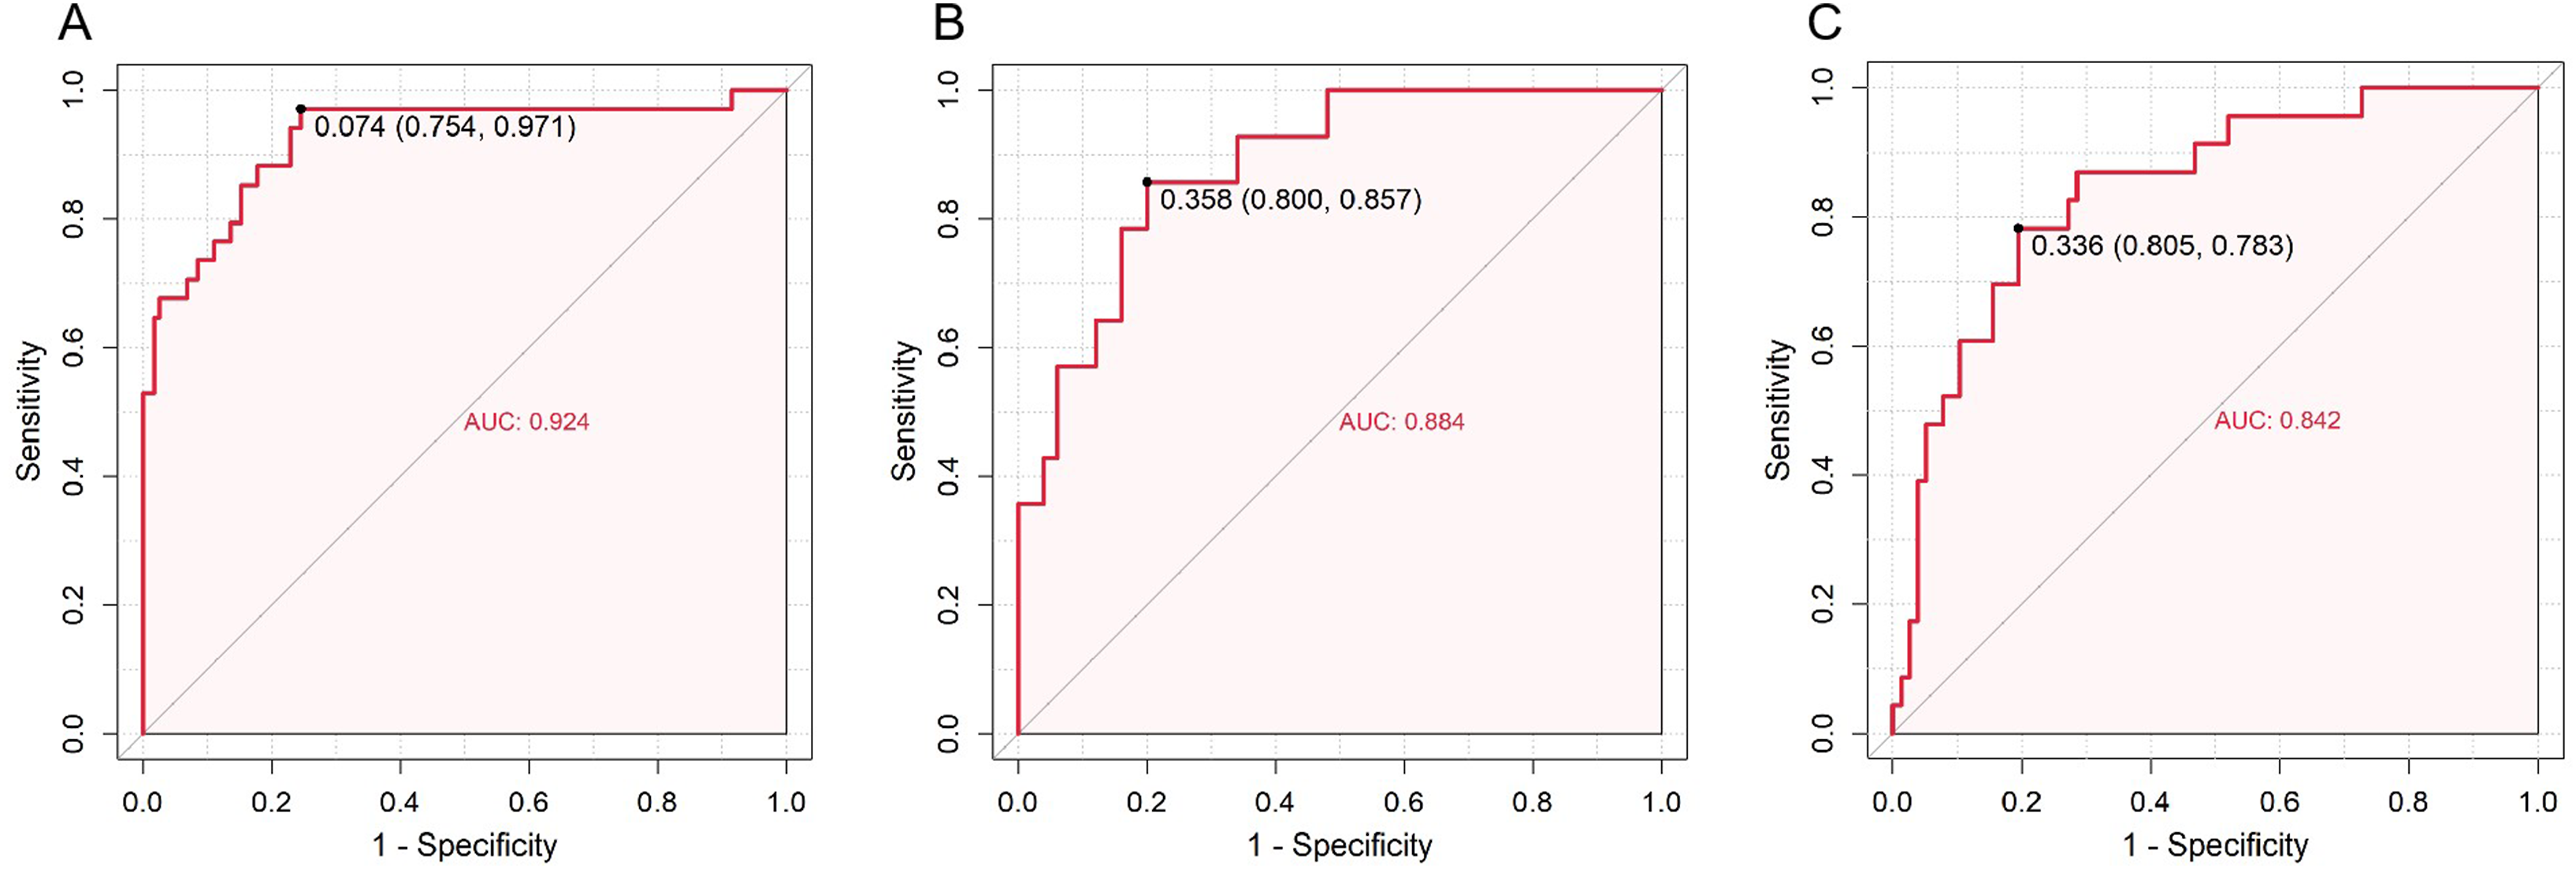
Calibration curves in all 3 cohorts showed good agreement between predicted and observed outcomes, indicating that the model was well-calibrated (Figure 7). Hosmer–Lemeshow tests supported acceptable calibration in both cohorts—the internal validation set (P = 0.7807) and the external cohort (P = 0.0547). Calibration Curve of the Prediction Risk Model. (A) Training Cohort, (B) Internal Validation Cohort, (C) External Validation Cohort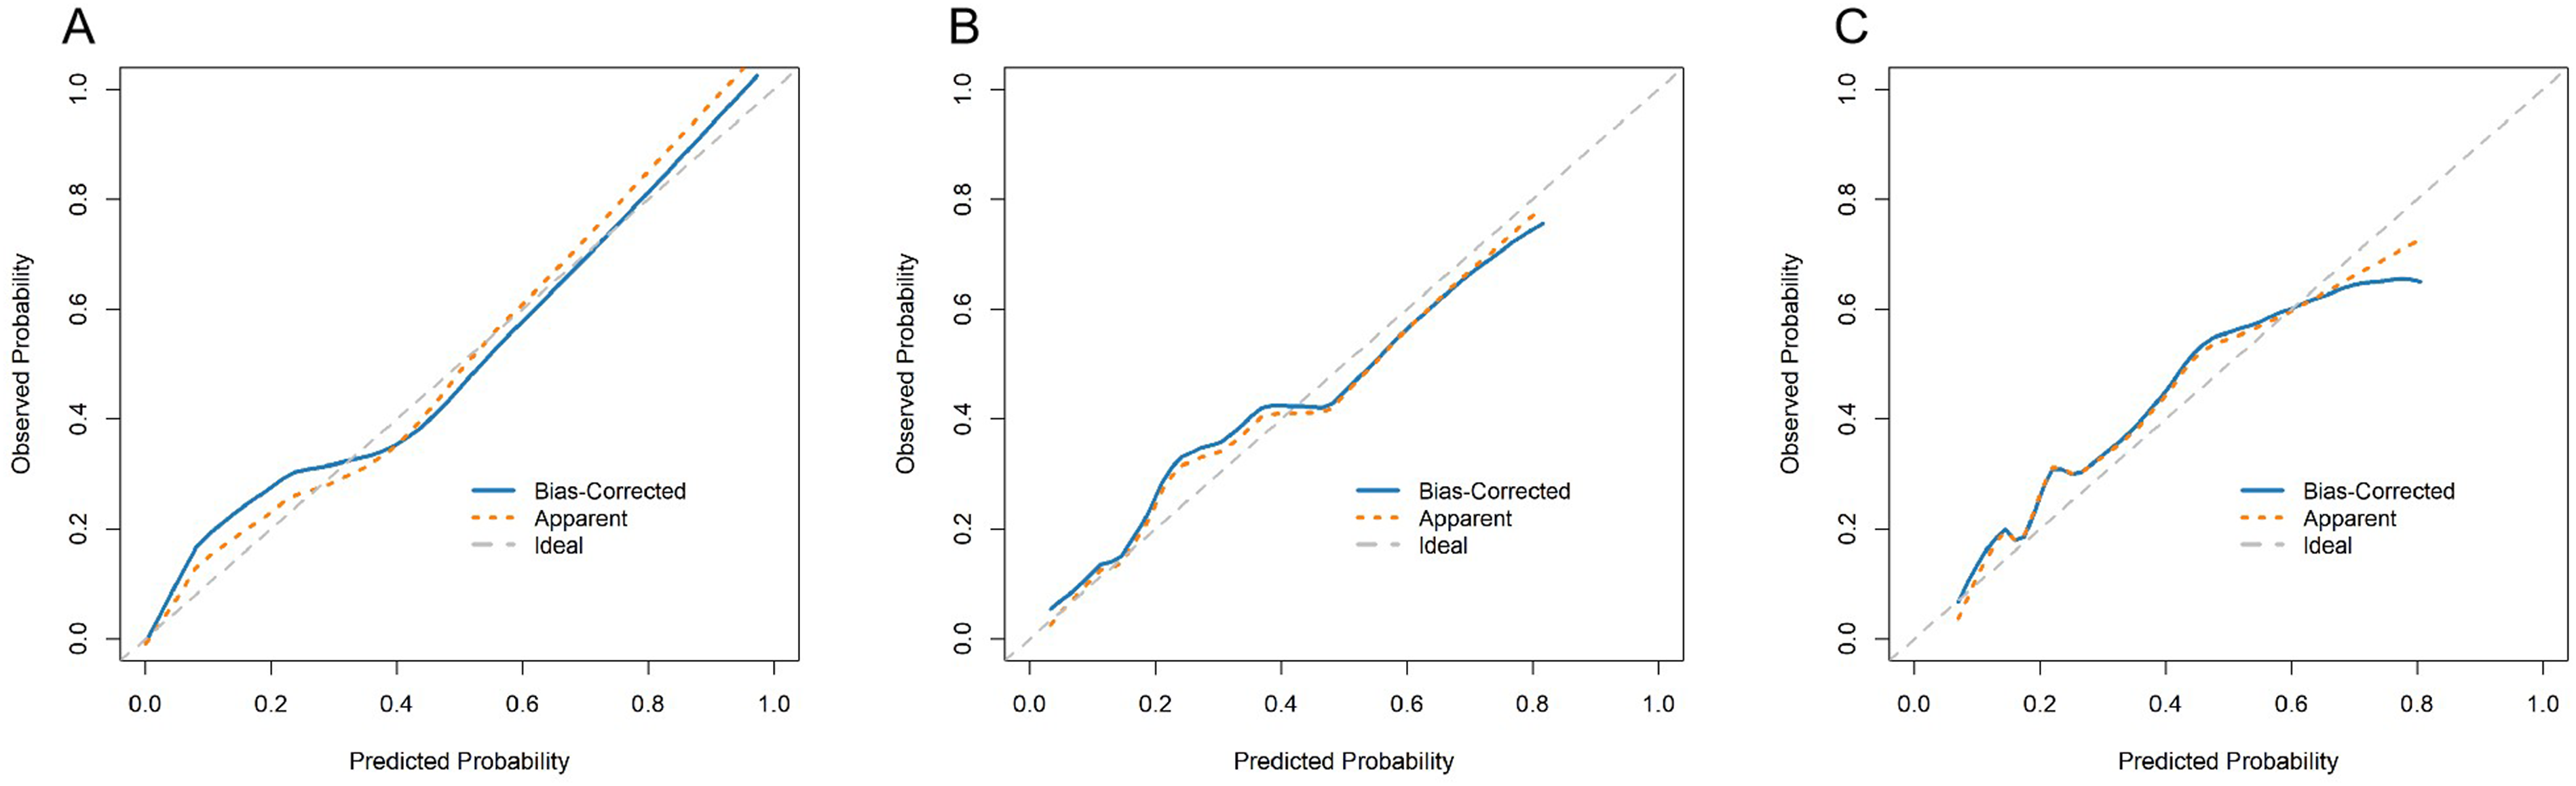
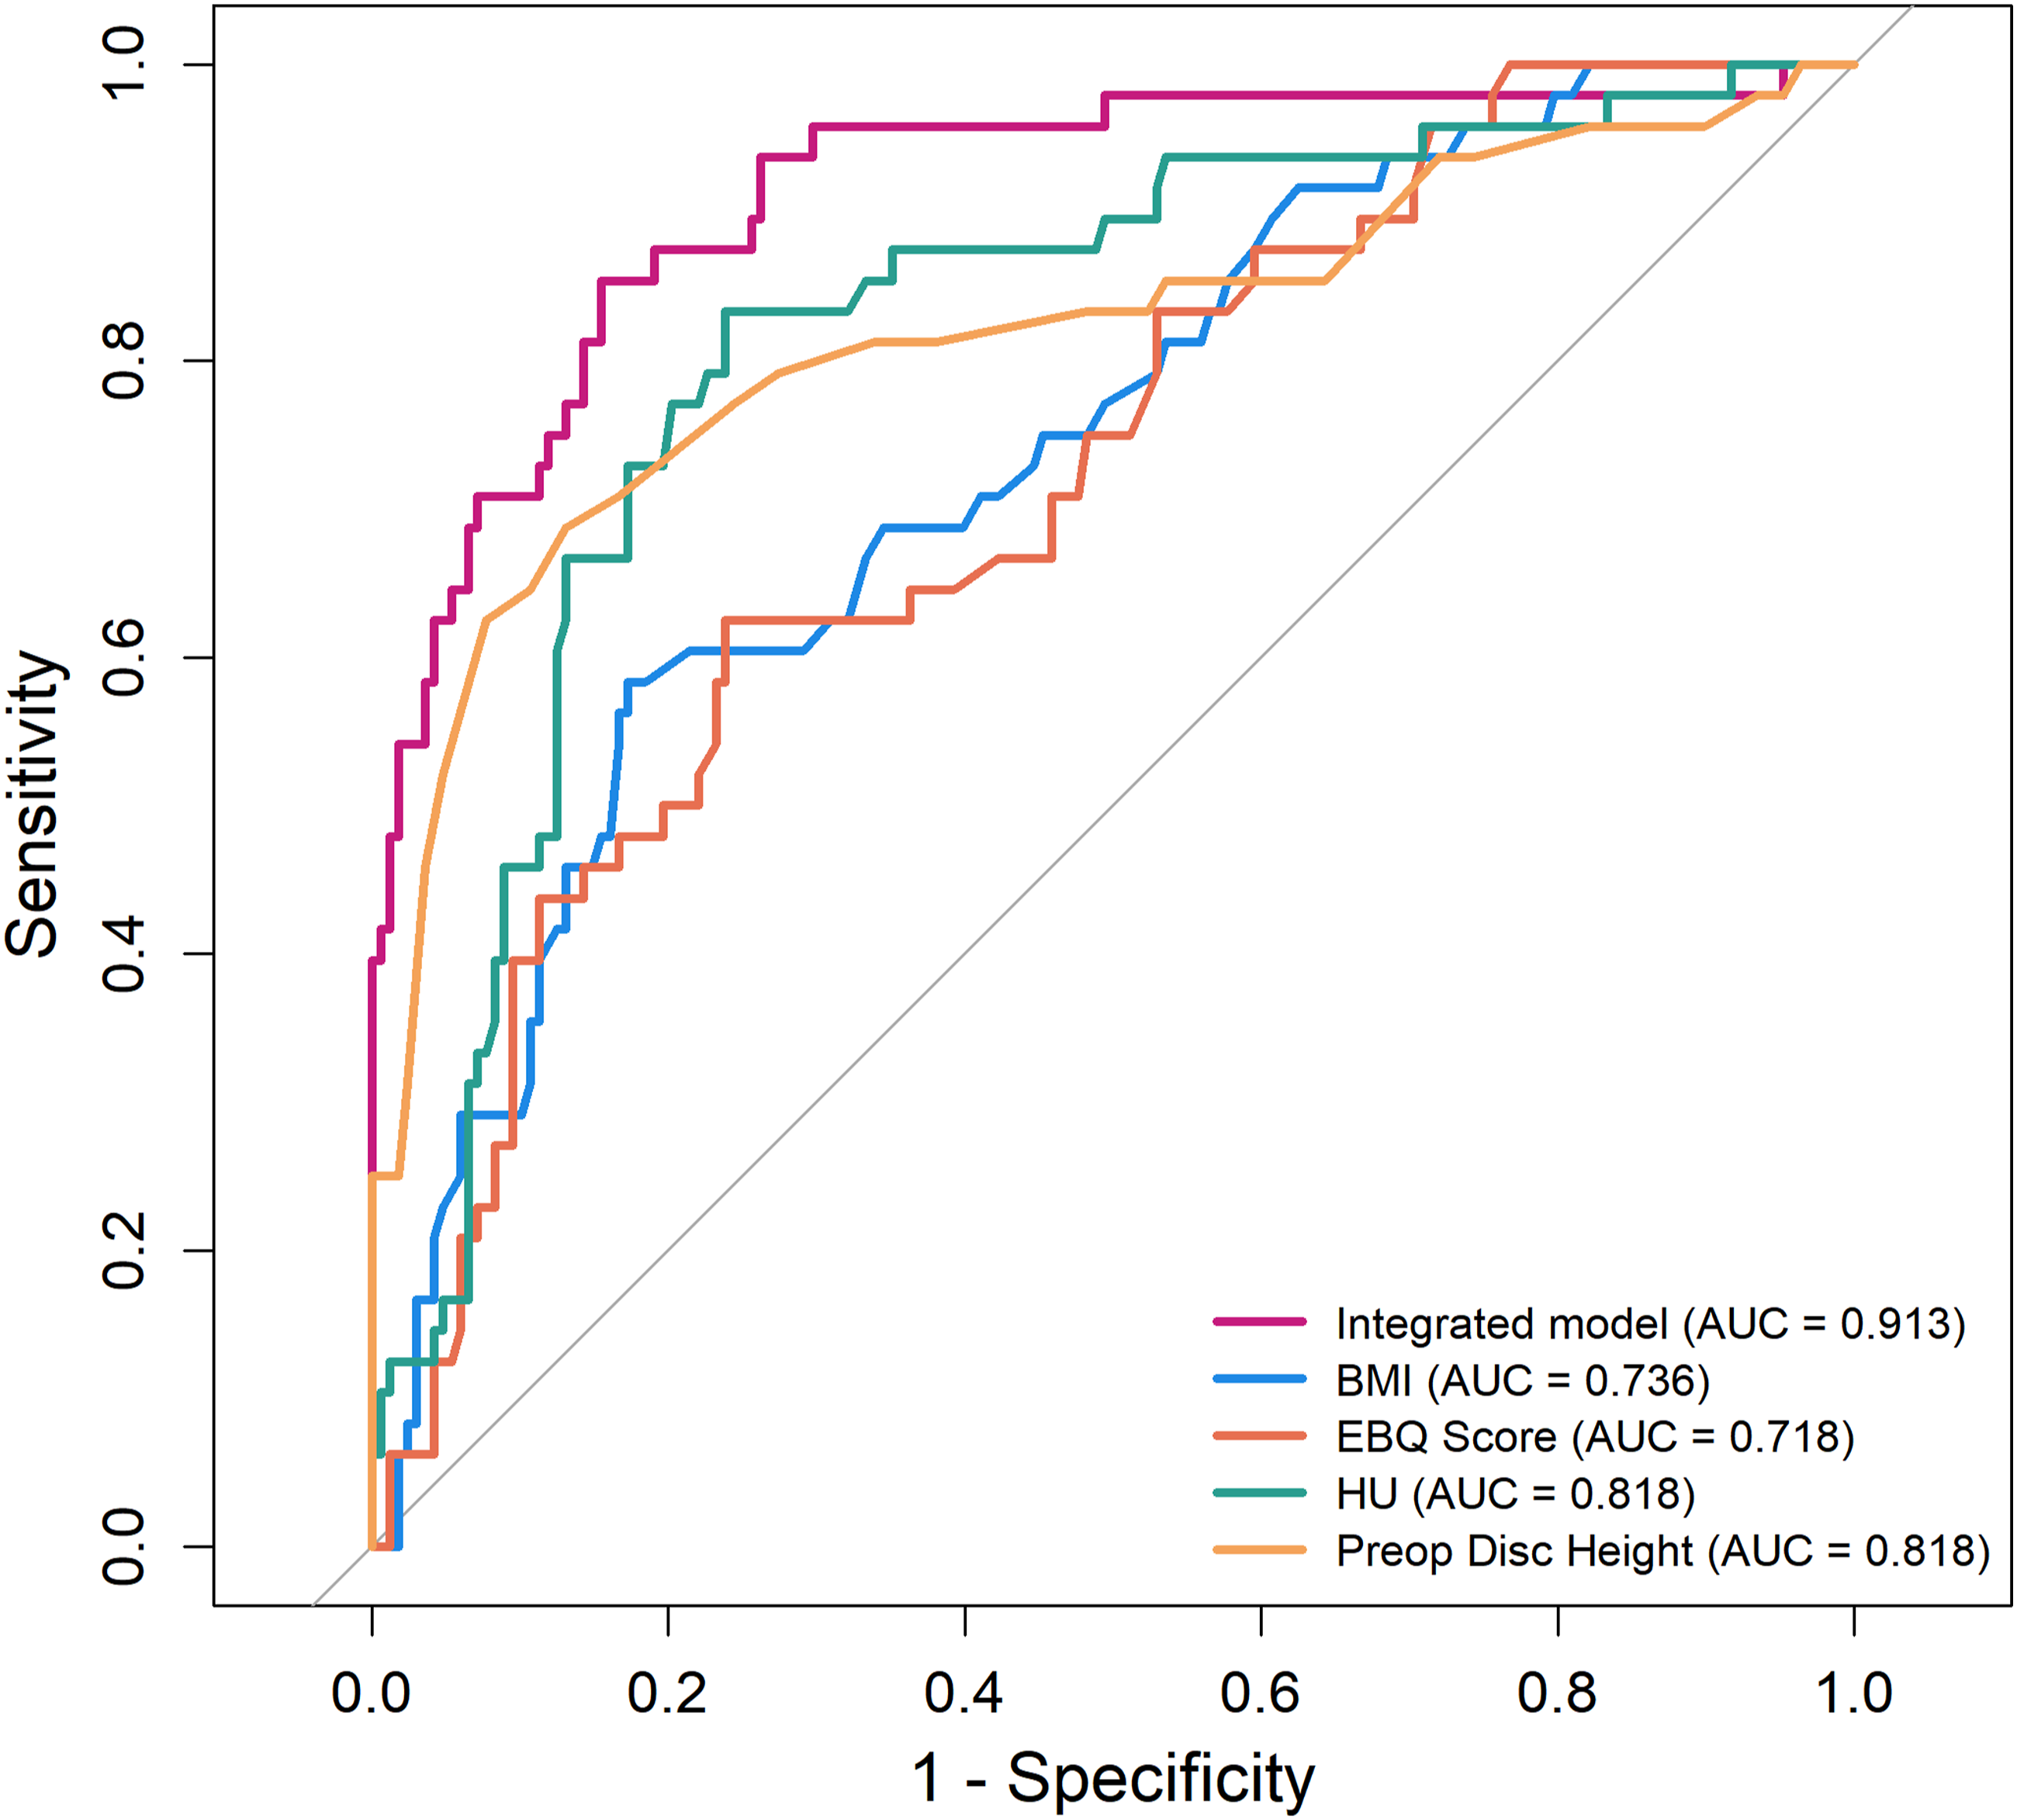
DCA demonstrated favorable clinical utility for the nomogram, showing positive net benefit across a broad, clinically relevant range of thresholds in all 3 cohorts (Figure 8). Although slightly lower than in the training and internal validation sets, the external cohort’s curve remained positive and exceeded the treat-none strategy across most thresholds; it was also generally higher than the treat-all strategy within clinically relevant thresholds. Additionally, ROC analysis based on the development-center cohort showed that the integrated model had higher AUC than each individual predictor, underscoring the superiority of the combined approach (Figure 9). DCA of the Prediction Risk Model. (A) Training Cohort, (B) Internal Validation Cohort, (C) External Validation Cohort ROC of all Development-Center Dataset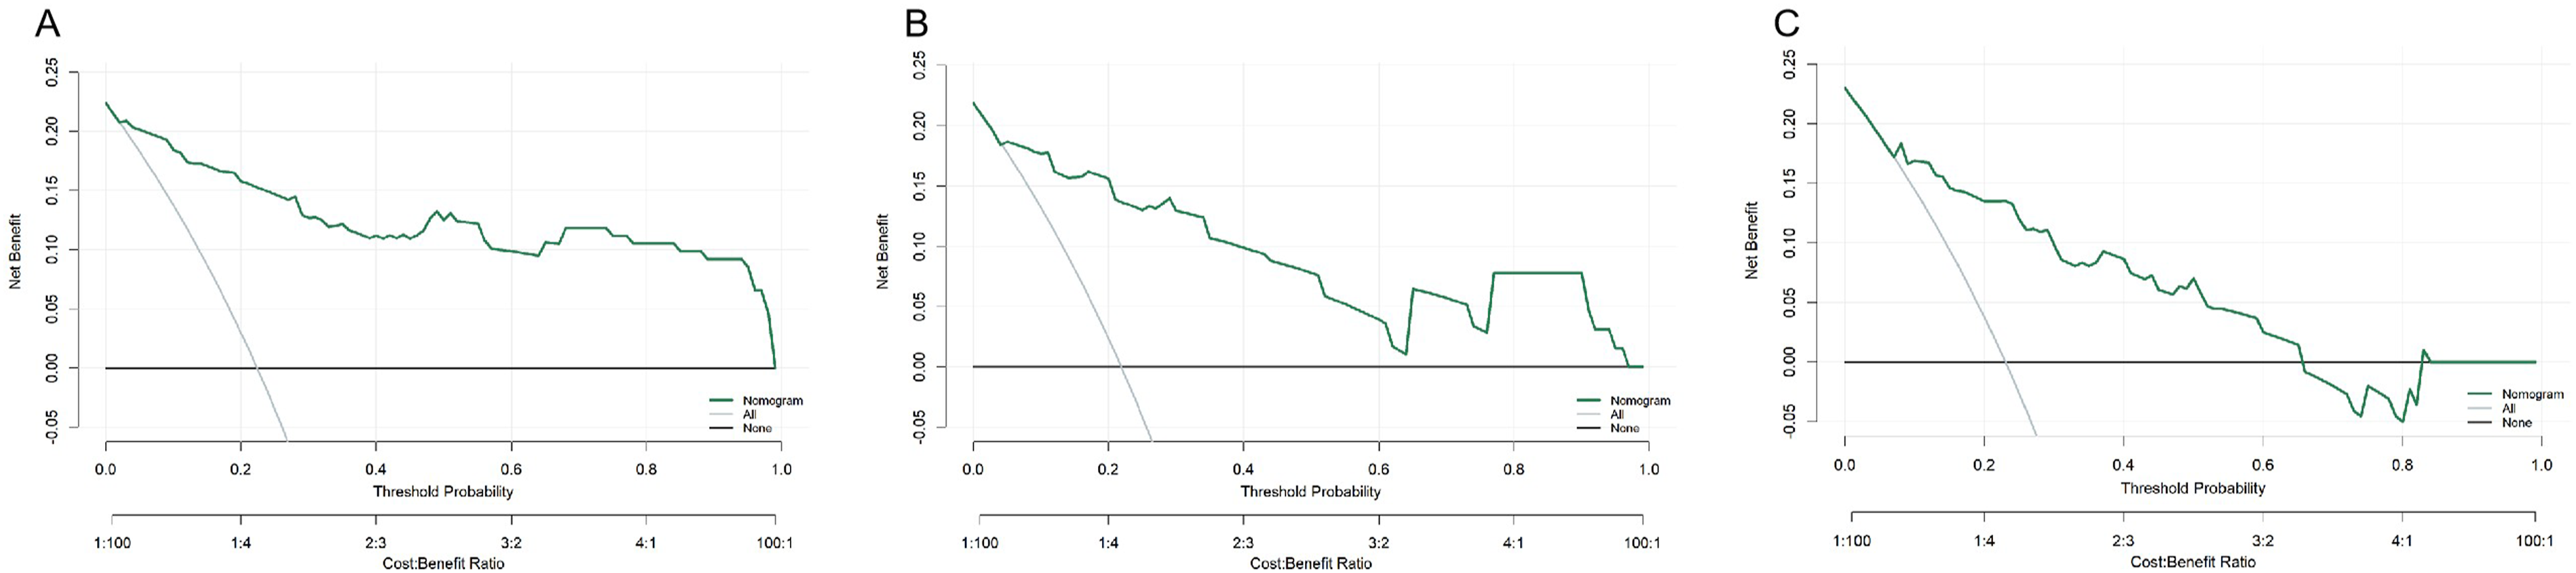
Furthermore, the nomogram was implemented as a web-based calculator to facilitate individualized prediction in clinical settings, and a demonstration of the online tool is presented in Figure 10 (https://cs-risk-calculator.shinyapps.io/cs-predictor/, username: user1, password: password1). An Online Calculator Converted From the Nomogram is Available for Generating Individualized Predictions of Cage Subsidence Risk after MIDLIF (https://cs-risk-calculator.shinyapps.io/cs-Predictor/, Username: user1, Password: password1). By Entering BMI, HU, EBQ Score, and Preoperative Disc Height, Users can Instantly Obtain a Numerical Probability for Clinical Reference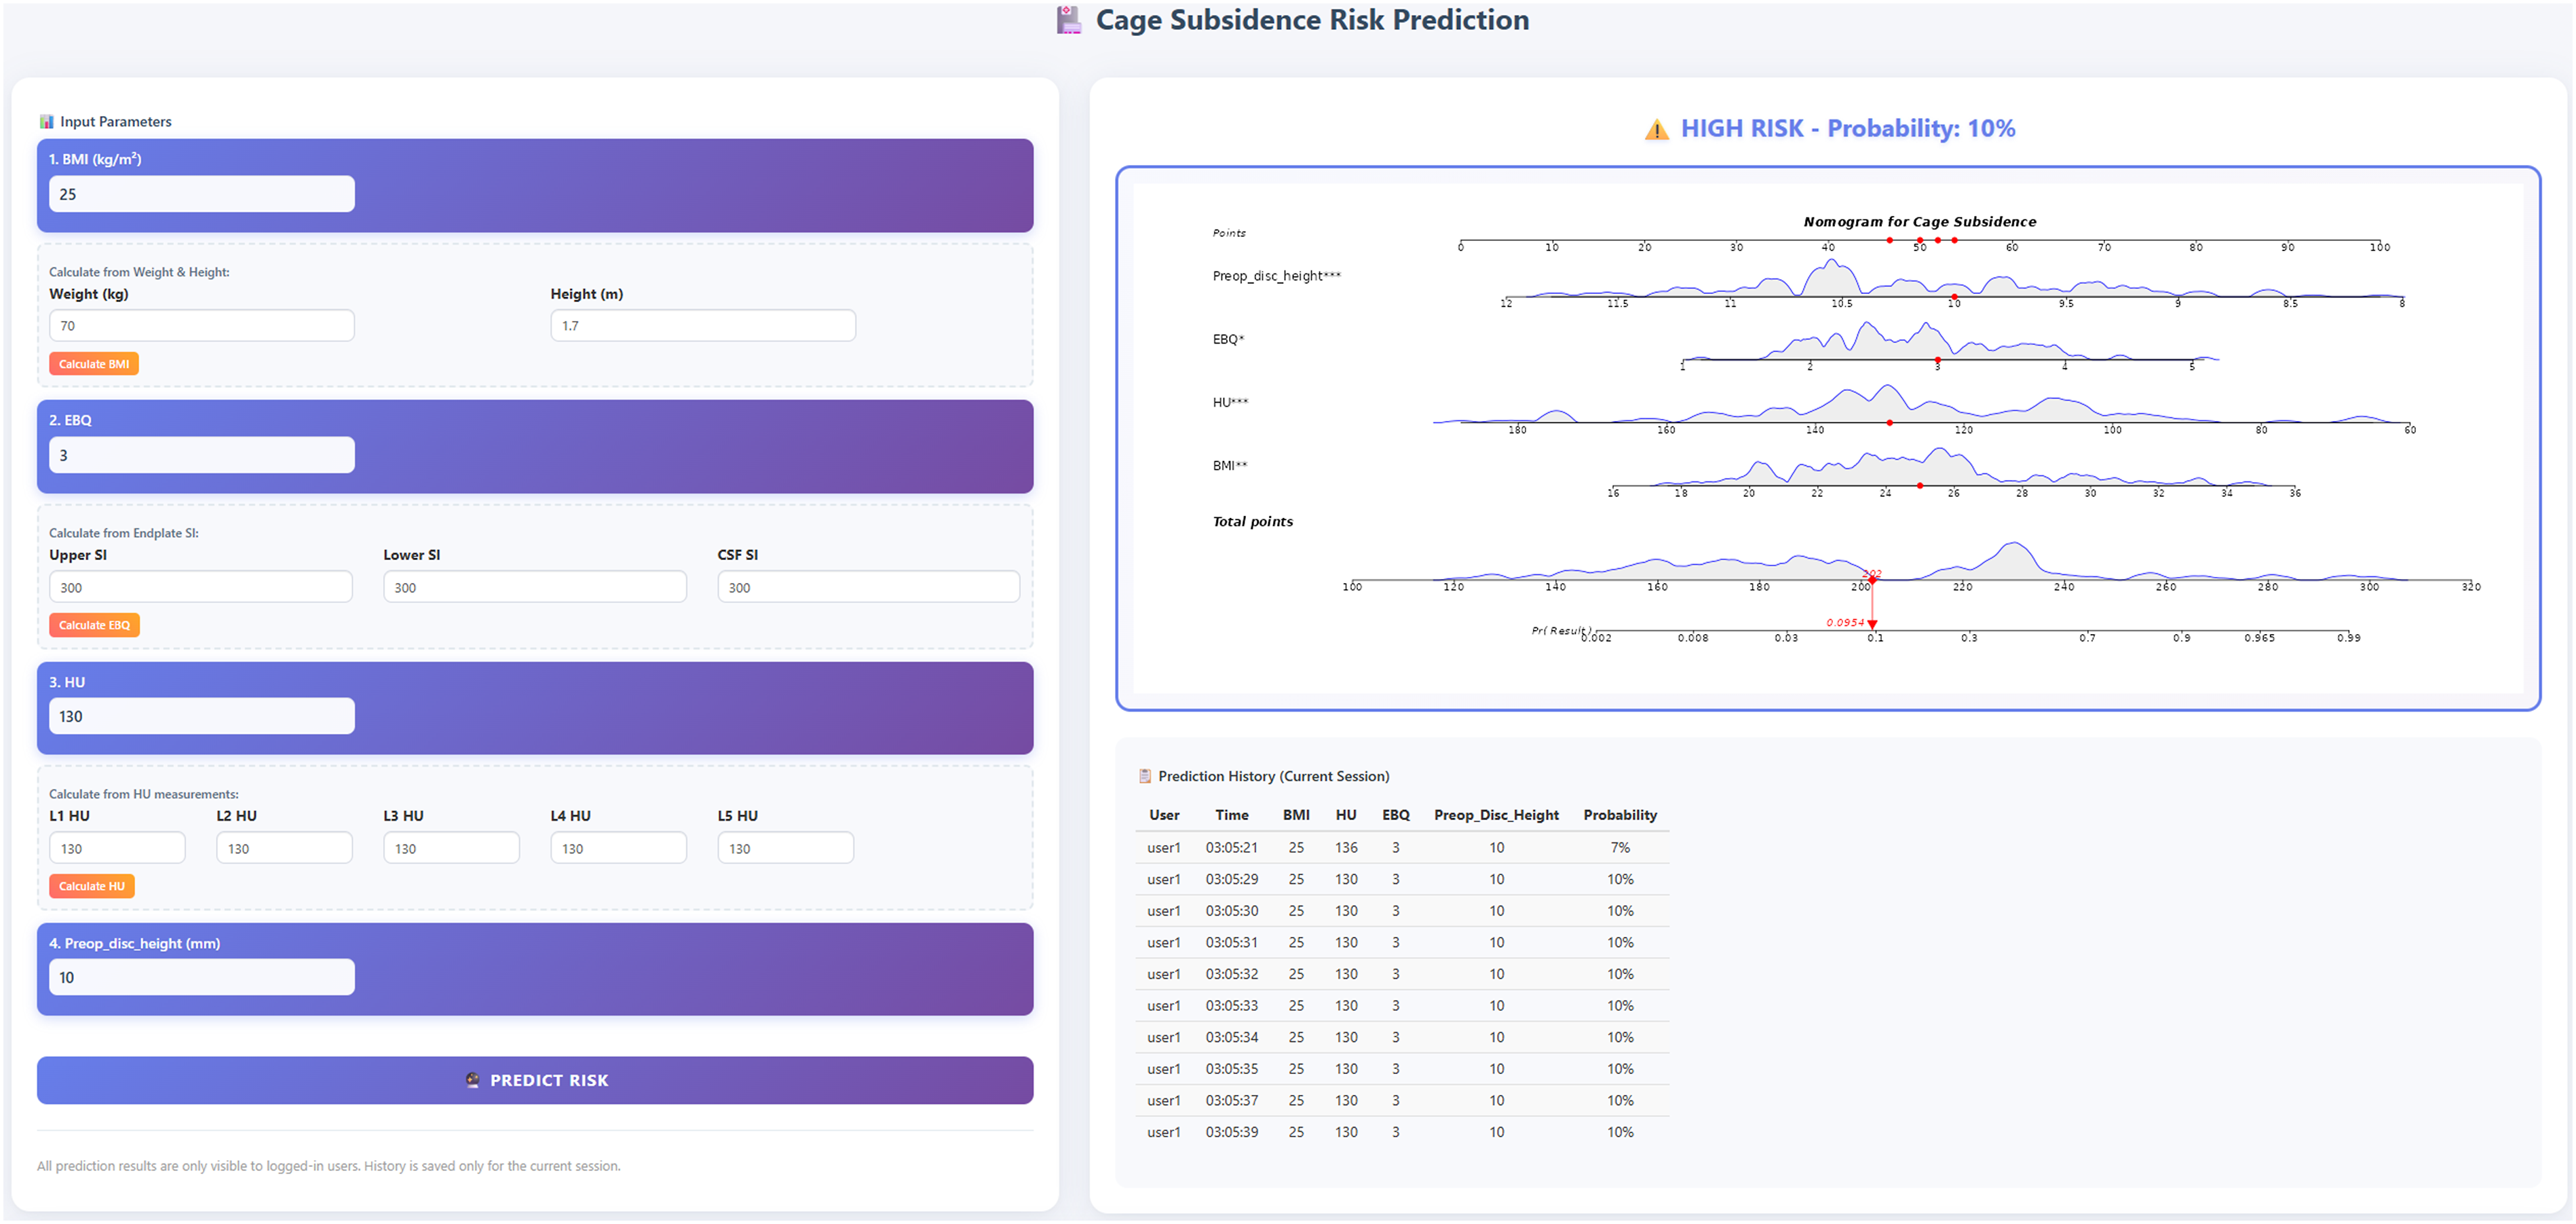
Discussion
Although several high-performing predictive models and scoring systems have been developed to assess CS risk after lumbar fusion, there remains a lack of predictive tools specifically targeting MIDLIF. Most existing models are based on other fusion techniques, such as TLIF or OLIF, and predominantly rely on traditional BMD assessments (eg, DXA or isolated radiographic measures).35,36 These approaches typically do not integrate multiple clinical and radiological factors, and very few have been implemented as web-based calculators for real-world clinical use. Previous studies have either focused on the predictive value of a single novel indicator for CS, or simply constructed risk models without developing an accessible online calculator for individualized, real-time decision-making.37,38
To the best of our knowledge, no previous studies have developed or implemented an online web-based calculator for predicting CS following lumbar fusion surgery. Most published models have not been translated into accessible online tools for clinical use, highlighting the novelty and clinical value of our work. In contrast, our study is the first to develop and validate a CS prediction model tailored to MIDLIF, integrating both EBQ scores from MRI and HU values from CT as validated bone quality surrogates, together with established clinical variables such as BMI and preoperative disc height. Importantly, the model’s performance was confirmed not only internally (AUC 0.924 training; 0.884 internal validation) but also in a geographically external cohort (AUC 0.842). Furthermore, by converting the nomogram into a user-friendly online calculator, our model bridges the gap between research and clinical application, providing spine surgeons with a comprehensive and practical tool for personalized risk assessment and perioperative planning in the MIDLIF population.
The occurrence of lumbar CS is influenced by a variety of factors. Current evidence suggests that patient-specific characteristics, including age, body weight, BMD, and preoperative disc height, play critical roles in determining cage stability. 30 In elderly patients, osteoporosis and endplate degeneration significantly weaken the structural support of the cage, thereby increasing the risk of subsidence. Elevated body weight imposes greater mechanical stress on the cage, while reduced preoperative disc height further predisposes patients to subsidence due to diminished intervertebral space. In addition to patient factors, cage-related attributes such as size, design, and the extent of disc height restoration, as well as surgical techniques—including cage placement position and angle—are pivotal in influencing subsidence risk.23,27 Therefore, a thorough preoperative evaluation that incorporates these factors is imperative to optimize surgical planning, reduce the incidence of CS, and enhance postoperative clinical outcomes.
Currently, the development of predictive models for lumbar CS remains limited. Existing studies have primarily focused on the role of decreased BMD in predicting CS following fusion techniques such as transforaminal lumbar interbody fusion(TLIF)and oblique lumbar interbody fusion(OLIF). However, these investigations largely assessed isolated preoperative patient-specific factors or individual radiographic features without integrating these variables into comprehensive and robust predictive models.33,39 Furthermore, no studies to date have explored the risk factors associated with CS in the context of MIDLIF or developed and validated dedicated prediction models for this technique. MIDLIF, first introduced by Santoni et al in 2009, 1 is an advanced lumbar reconstruction technique distinguished by its unique screw placement method and trajectory. This approach minimizes surgical trauma while significantly enhancing the biomechanical strength of internal fixation. It has been widely adopted in clinical practice and has consistently demonstrated favorable outcomes. For patients with lumbar degenerative diseases and spine surgeons, the development of a practical, efficient, and accurate CS prediction model specific to MIDLIF is of paramount importance to optimize patient outcomes and guide surgical decision-making.
Nomogram models have become widely adopted in clinical prediction research due to their ability to integrate multiple risk factors into a visually interpretable and user-friendly tool.40,41 In this study, clinical data (Figure 10) were utilized to incorporate BMI, EBQ scores, HU values, and preoperative disc height into the nomogram. The nomogram achieved AUCs of 0.924 in the training set and 0.884 in the internal validation set, and maintained performance in an external cohort (AUC 0.842), demonstrating excellent discriminatory power (Figure 6). Calibration curves revealed good agreement between predicted and observed outcomes, and Hosmer–Lemeshow tests supported acceptable fit in the internal (P = 0.7807) and external cohorts (P = 0.0547), indicating robust model calibration (Figure 7). Decision curve analysis showed positive net benefit across a broad, clinically relevant range of thresholds in all 3 cohorts; in the external cohort—although slightly lower than in development sets—the curve remained above treat-none for most thresholds and was generally higher than treat-all within clinically relevant ranges (Figure 8). Additionally, within the development-center cohort, the integrated model outperformed each single predictor on ROC analysis (Figure 9), underscoring the value of combining clinical and imaging markers. These findings highlight the reliability and broad applicability of our risk prediction model. Consistent with our prespecified principle of prioritizing missed-case avoidance while preserving overall performance, cost-sensitive threshold sensitivity analysis favored FN:FP cost ratios of 2:1-4:1 for internal validation and 4:1-8:1 for external validation (Table 4); at FN:FP = 4:1, the training-set cutoff of 0.074 achieved high sensitivity (0.971) with acceptable specificity (0.754). In addition, to improve clinical utility and promote personalized patient management, we have developed an easy-to-use online calculator derived from the nomogram (Figure 10, https://cs-risk-calculator.shinyapps.io/cs-predictor/, username: user1, password: password1). This tool enables clinicians to quickly estimate the risk of cage subsidence for individual patients using common clinical and radiographic indicators, supporting timely risk evaluation and more informed treatment planning in practice (Figure 11).
BMI may play an important role in the development of CS, but this remains a subject of debate. In a 2-year follow-up study of patients undergoing lumbar fusion surgery, Yao et al. reported that patients with postoperative CS had a significantly higher BMI compared to those without subsidence. This finding suggests that elevated BMI may increase the risk of CS, as overweight or obese individuals impose greater mechanical loads on the spine, thereby amplifying the pressure exerted on the cage and increasing the likelihood of subsidence. 42 Similarly, Chen et al. identified a strong association between higher BMI and postoperative CS, further highlighting the critical role of BMI in subsidence risk and underscoring the importance of addressing high BMI during preoperative evaluation. 43 Amorim et al also demonstrated that BMI is an independent risk factor for CS after lumbar fusion surgery. 11 While a minority of studies suggest no significant correlation between BMI and CS,44,45 the preponderance of evidence supports the conclusion that elevated BMI substantially increases the risk of cage subsidence.
BMD is a critical determinant of postoperative CS following spinal surgery. Studies have consistently demonstrated that patients with osteoporosis are at significantly higher risk of developing CS compared to those with normal bone quality. 46 Osteoporosis is characterized by reduced bone mass, compromised microarchitecture, and increased bone fragility, which collectively predispose the vertebral endplate to collapse under the mechanical load of the cage, resulting in subsidence. This study adopts an innovative approach by utilizing the EBQ score and vertebral HU values as reliable alternatives to DXA for assessing bone quality. Unlike DXA, which exposes patients to additional radiation beyond routine lumbar CT and MRI and is prone to overestimating BMD in the presence of lumbar degenerative changes or vascular calcifications,16,17 EBQ and HU values have been validated as accurate predictors of endplate failure and CS in various lumbar fusion procedures.21,33,47 Jones et al, in a retrospective cohort study, identified reduced EP-vBMD as a significant risk factor for CS following lateral lumbar interbody fusion (LLIF). 44 Chen et al. reported that higher EBQ scores are associated with an increased risk of CS following TLIF, with an AUC of 0.820, highlighting its strong predictive performance. 47 The research by Ran et al. also indicated that higher preoperative EBQ scores were significantly linked to CS following single-level OLIF. 33 Therefore, the current evidence suggested that the EBQ score demonstrated excellent predictive capability for endplate bone structure and density. Xi et al. identified preoperative HU values below 135.02 as a significant risk factor for CS following LLIF, with lower HU reflecting more severe bone loss. 32 Wu et al. additionally revealed that low HU value at the central endplate was significantly associated with CS in patients undergoing OLIF because it could represent the regional bone quality of the endplate in contact with the implant. 21 In a recent study, Levy et al validated the results of Wu et al and further indicated that the endplate HU values was a stronger predictor of CS (AUC = 0.704) than vertebral HU values (AUC = 0.640) while a combination of these 2 demonstrated the greatest predictive capacity (AUC = 0.738) following TLIF. 48 These evidence substantiated the rationale for employing HU values as a surrogate for endplate strength and density. In the current study, incorporation of both parameters capitalized on their complementary strengths—EBQ providing a localized assessment of endplate resilience and HU reflecting the overall structural integrity of the vertebral body—thereby enabling a more comprehensive evaluation of bone quality pertinent to the risk of CS. For elderly patients undergoing MIDLIF, preoperative lumbar CT and MRI should be routinely performed to measure EBQ scores and HU values. Patients with elevated EBQ scores or decreased HU values should be considered for anti-osteoporosis therapy to reduce the incidence of postoperative CS and improve surgical outcomes.
Preoperative disc height is a pivotal factor influencing CS, as it directly determines the initial support and mechanical stability of the cage following implantation. A retrospective cohort study by Yao et al 42 identified a negative correlation between preoperative disc height and the depth of CS, with significantly lower preoperative disc height observed in the CS group compared to the non-CS group. Similarly, Pisano et al 49 demonstrated that the Δ between cage height and disc height was markedly larger in the CS group, indicating that greater disc height restoration post-implantation may predispose to CS. Excessive oversizing of the cage relative to the disc height can result in over-distraction of the disc space, thereby increasing segmental stress and the likelihood of CS. Additionally, Yang et al 50 reported that excessive distraction of disc height using standalone cages significantly increased the risk of CS. This is attributed to the heightened axial stress at the cage-endplate interface caused by oversized cages, ultimately exacerbating the risk of further subsidence. The findings from the aforementioned studies are consistent with the results of this study. For patients with reduced preoperative disc height or irregular endplate morphology, meticulous handling of the endplate and precise selection of the cage are essential to mitigate the risk of CS. Selecting an appropriately sized cage can effectively restore disc height while avoiding the complications associated with over-distraction or insufficient distraction. This strategy is critical for optimizing segmental stability, preserving endplate integrity, and minimizing the likelihood of cage subsidence, ultimately ensuring improved postoperative outcomes.
Although this study yielded encouraging findings and highlighted the value of a nomogram for predicting CS in patients undergoing lumbar interbody fusion with MIDLIF, several limitations should be acknowledged. First, despite being two-center, the overall sample size remains modest; the number of events per variable in training may be < 10, which can introduce coefficient instability. Second, we did not apply explicit penalization/shrinkage (eg, LASSO/ridge or uniform slope shrinkage) to the final coefficients; while this was a deliberate choice for interpretability and ease of deployment with few predictors, penalization could further mitigate overfitting. Third, certain potentially relevant variables (eg, detailed disc/endplate morphology) were not available with sufficient granularity in routine records. Future studies should prioritize larger, prospective multicenter validation and consider penalized or Bayesian shrinkage and richer anatomical/biomechanical descriptors to further enhance generalizability and robustness. Application Example of the nomogram. (A) and (B) Preoperative Anteroposterior and Lateral Lumbar X-Rays.(C) and (D) Lumbar MRI Showing L4/5 Spinal Canal stenosis.(E) and (F) Immediate Postoperative Anteroposterior and Lateral Lumbar X-Rays.(G) and (H) Follow-Up Anteroposterior and Lateral Lumbar X-Rays. At the 2-Year Follow-Up, the Intervertebral Disc Height had Decreased Compared to the Immediate Postoperative Height, Indicating the Presence of Cage Subsidence. The Patient’s Preoperative BMI, EBQ Score, HU Value, and Disc Height Were 26.6, 3.65, 113.2, and 9.6, respectively. By Entering These Four Values Into the Web-Based Calculator, the Predicted Probability of Cage Subsidence was 63%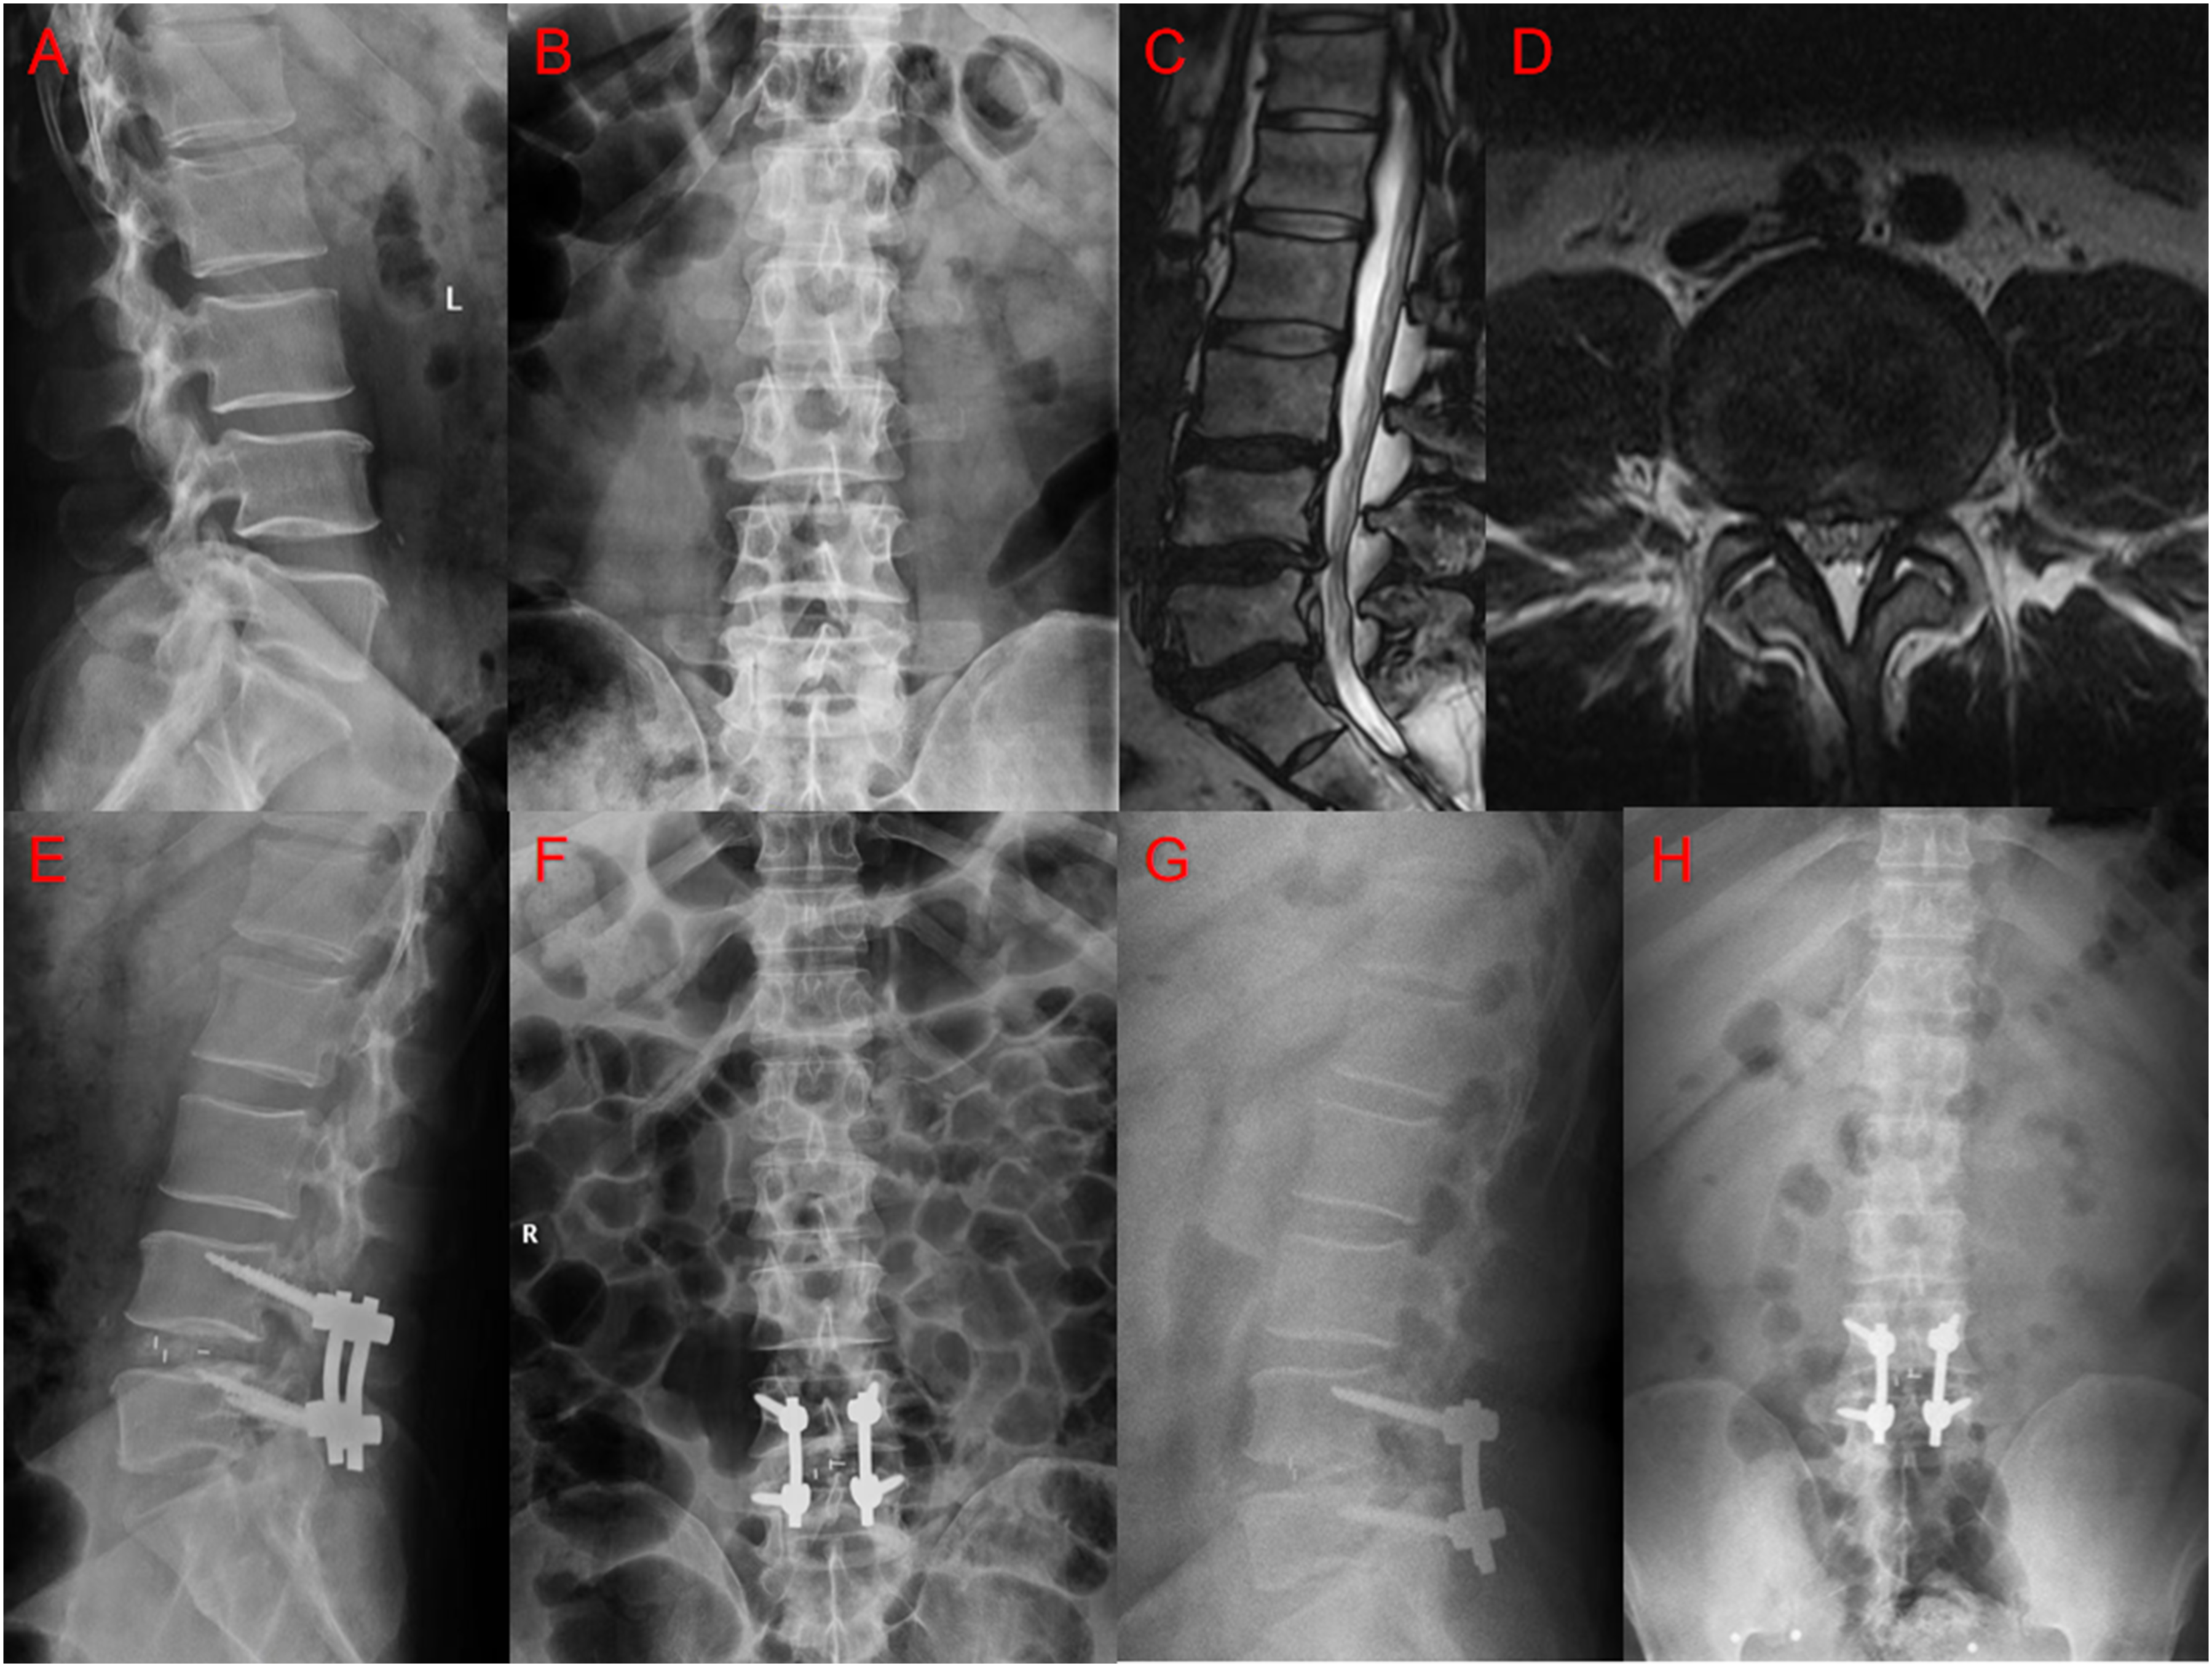
Conclusion
In summary, this study successfully integrated BMI, EBQ scores, HU values, and preoperative disc height to develop a nomogram with high accuracy, aimed at assisting spine surgeons in assessing the risk of postoperative CS following lumbar interbody fusion using the MIDLIF. Furthermore, we translated this nomogram into a practical online web-based calculator, providing clinicians with a convenient tool for personalized evaluation of CS risk and enabling the implementation of preventive strategies at an early stage.
Footnotes
Ethical Considerations
The study involving human participants was reviewed and approved by the Ethics Committee of Beijing Chao-Yang Hospital.
Consent to Participate
Written informed consent was obtained from all patients/participants prior to their inclusion in the study. We affirm that all methods were carried out in accordance with the relevant guidelines and regulations of the Declaration of Helsinki. As this was a retrospective study, clinical trial registration was not applicable.
Author Contributions
MZ, HY, and SG were responsible for conceptualizing and designing the study. MZ, ZZ, YZ, KL,JS and FC collected and analyzed the data. MZ, HY, and SG drafted the original manuscript. JM, YZ, YH, and YL provided substantial supervision and critical revisions. All authors have read and approved the final manuscript.
Funding
The authors disclosed receipt of the following financial support for the research, authorship, and/or publication of this article: This work was supported by National Clinical Medical Research Center of Orthopedics and Sports Rehabilitation Innovation Fund (2021-NCRC-CXJJPY-17); Clinical Research Incubation Program of Beijing Chao-Yang Hospital (CYFH202316); Beijing Natural Science Foundation (L252114).
Declaration of Conflicting Interests
The authors declared no potential conflicts of interest with respect to the research, authorship, and/or publication of this article.
Data Availability Statement
Generated Statement: The raw data supporting the conclusions of this article will be made available by the authors, without undue reservation. If anyone needs the data and information from this study, please contact the first author of this paper.