
Abstract
Study Design
Retrospective Study.
Objectives
To compare the efficacy of pedicle Hounsfield unit (HU) values and pedicle bone quality (PBQ) scores in predicting pedicle screw loosening (PSL) after posterior lumbar interbody fusion (PLIF) in elderly patients and to identify the most discriminative bone mineral density (BMD) assessment indicator.
Methods
This retrospective analysis included 275 consecutive patients who underwent PLIF. L1 and pedicle HU values were obtained from CT scans, whereas vertebral bone quality (VBQ) and PBQ scores were obtained from MRI. Logistic regression analysis determined factors associated with PSL. Receiver-operating characteristic curve analysis was conducted to assess the predictive value of pedicle HU and PBQ score for PSL and to additionally compare their predictive value with that of L1 HU value and VBQ score.
Results
The PSL rate was 20.36% (56/275). The loosening group demonstrated a higher postoperative low-back pain visual analog scale score (P < 0.05), lower L1 (P < 0.001) and pedicle HU values (P < 0.001) and higher VBQ (P < 0.001) and PBQ scores (P < 0.001) than the non-loosening group. The logistic regression analysis identified L1 (OR = 0.98, 95% CI = 0.97-0.99, P < 0.001) and pedicle HU values (OR = 0.99, 95% CI = 0.98-0.99, P < 0.001) and VBQ (OR = 2.81, 95% CI = 1.43-5.52, P = 0.003) and PBQ scores (OR = 3.85, 95% CI = 2.03-7.32, P < 0.001) as independent predictors of PSL. The area under the curve for L1 and pedicle HU values and VBQ and PBQ scores were 0.751, 0.766, 0.684, and 0.702, respectively. The optimal pedicle HU cut-off for predicting PSL was 106.32 (sensitivity: 78.49%; specificity: 75.00%).
Conclusions
Pedicle HU values exhibited a relatively higher predictive performance for PSL compared with the PBQ score and served as the most discriminative BMD indicator in patients who underwent PLIF. Measuring the pedicle HU value preoperatively help surgeons to select a more appropriate surgical plan and is expected to improve the patient outcomes.
Keywords
Introduction
Pedicle screw loosening is one of the most common complications after posterior lumbar interbody fusion (PLIF), 1 potentially causing low-back pain, functional impairment, and even requiring revision surgery.1,2 Further, PSL may precipitate further complications, such as screw breakage, nonunion, pseudarthrosis, and kyphosis,3,4 which substantially decrease patient quality of life and increase the economic burden. Accordingly, accurate preoperative prediction and prevention of PSL are essential for optimizing surgical outcomes.
Studies have revealed that low bone mineral density (BMD) is a major risk factor for PSL.5-7 The incidence of PSL ranges from 1% to 15% in patients with no osteoporosis but may reach up to 60% in those with osteoporosis.1,8,9 Biomechanical in vitro experiments have demonstrated that specimens with normal bone density require significantly higher screw pull-out forces than osteoporotic specimens.5,10 Furthermore, additional research indicates that pedicle bone density exerts a greater impact on screw stability than whole vertebral body density, with approximately 80% of the caudocephalad stiffness and 60% of the reduction in screw pullout strength attributable to the pedicle. 11
Dual-energy X-ray absorptiometry (DXA) is the current gold standard for bone density assessment. 12 However, its clinical application is limited by BMD overestimation in patients with degenerative lumbar disease13,14 and by low clinical application rates. 15 The vertebral body Hounsfield unit (HU) value obtained from computed tomography (CT) serves as a reliable BMD indicator,16,17 and the vertebral bone quality (VBQ) score derived from magnetic resonance imaging (MRI) has appeared as a novel tool for bone quality assessment. 18 Both appear to be viable alternatives to DXA and have been closely associated with PSL.19-23
The pedicle HU values and pedicle bone quality (PBQ) score have been developed for preoperative BMD assessment based on the vertebral body HU value and VBQ score, and further studies have determined both as independent predictors of PSL.24-28 However, it remains unclear whether pedicle HU or PBQ score has superior predictive ability for PSL. 11 The selection of BMD assessment indicators that are more closely associated with PSL is critical for individualized screw selection, fixation strategy decisions, and the development of tailored anti-osteoporotic treatment plans.1,29-32 Therefore, this study is the first to systematically compare the predictive efficacy of the pedicle HU value and PBQ score for PSL after PLIF in the same patient cohort. It further investigates BMD assessment indicators measured at the pedicle vs the conventional vertebral body regions, aiming to determine the more valuable PSL predictor to improve preoperative BMD evaluation, guide clinical decision-making, and ultimately reduce the risk of PSL.
Methods
Patients
We retrospectively reviewed data of consecutive patients who underwent surgery for degenerative lumbar disease at our institution from January 2016 to October 2023. Our Institutional Ethics Committee approved this study (approval number: 2024-KE-346). Informed consent was waived due to the retrospective study design. The inclusion criteria were (1) PLIF with pedicle screw fixation for degenerative lumbar disease; (2) lumbar CT and MRI performed within 1 month preoperatively; and (3) minimum follow-up of 12 months. The exclusion criteria were (1) prior lumbar surgery; (2) congenital spinal deformity, ankylosing spondylitis, lumbar infection, spinal tumor, or lumbar trauma; (3) metabolic bone disease or long-term use of medications affecting BMD (e.g., corticosteroids); (4) fixation levels of > 4; and (5) revision surgery within 12 months postoperatively for non-PSL reasons, such as intraoperative neural injury, postoperative infection or hematoma, or adjacent-segment disc degeneration. Postoperatively, all patients received long-term antiosteoporosis therapy and attend regular outpatient follow-up visits. This study ultimately included 275 patients. PSL was assessed at 12 months postoperatively. Two senior spine surgeons independently evaluated PSL on the radiographs (N.F. with 10 years of experience and P.D. with 18 years of experience). In cases of disagreement, the final decision was made by a spine expert (L.Z. with 21 years of experience). Figure 1 illustrates the flowchart of patient selection. Patient Inclusion and Exclusion Flow Chart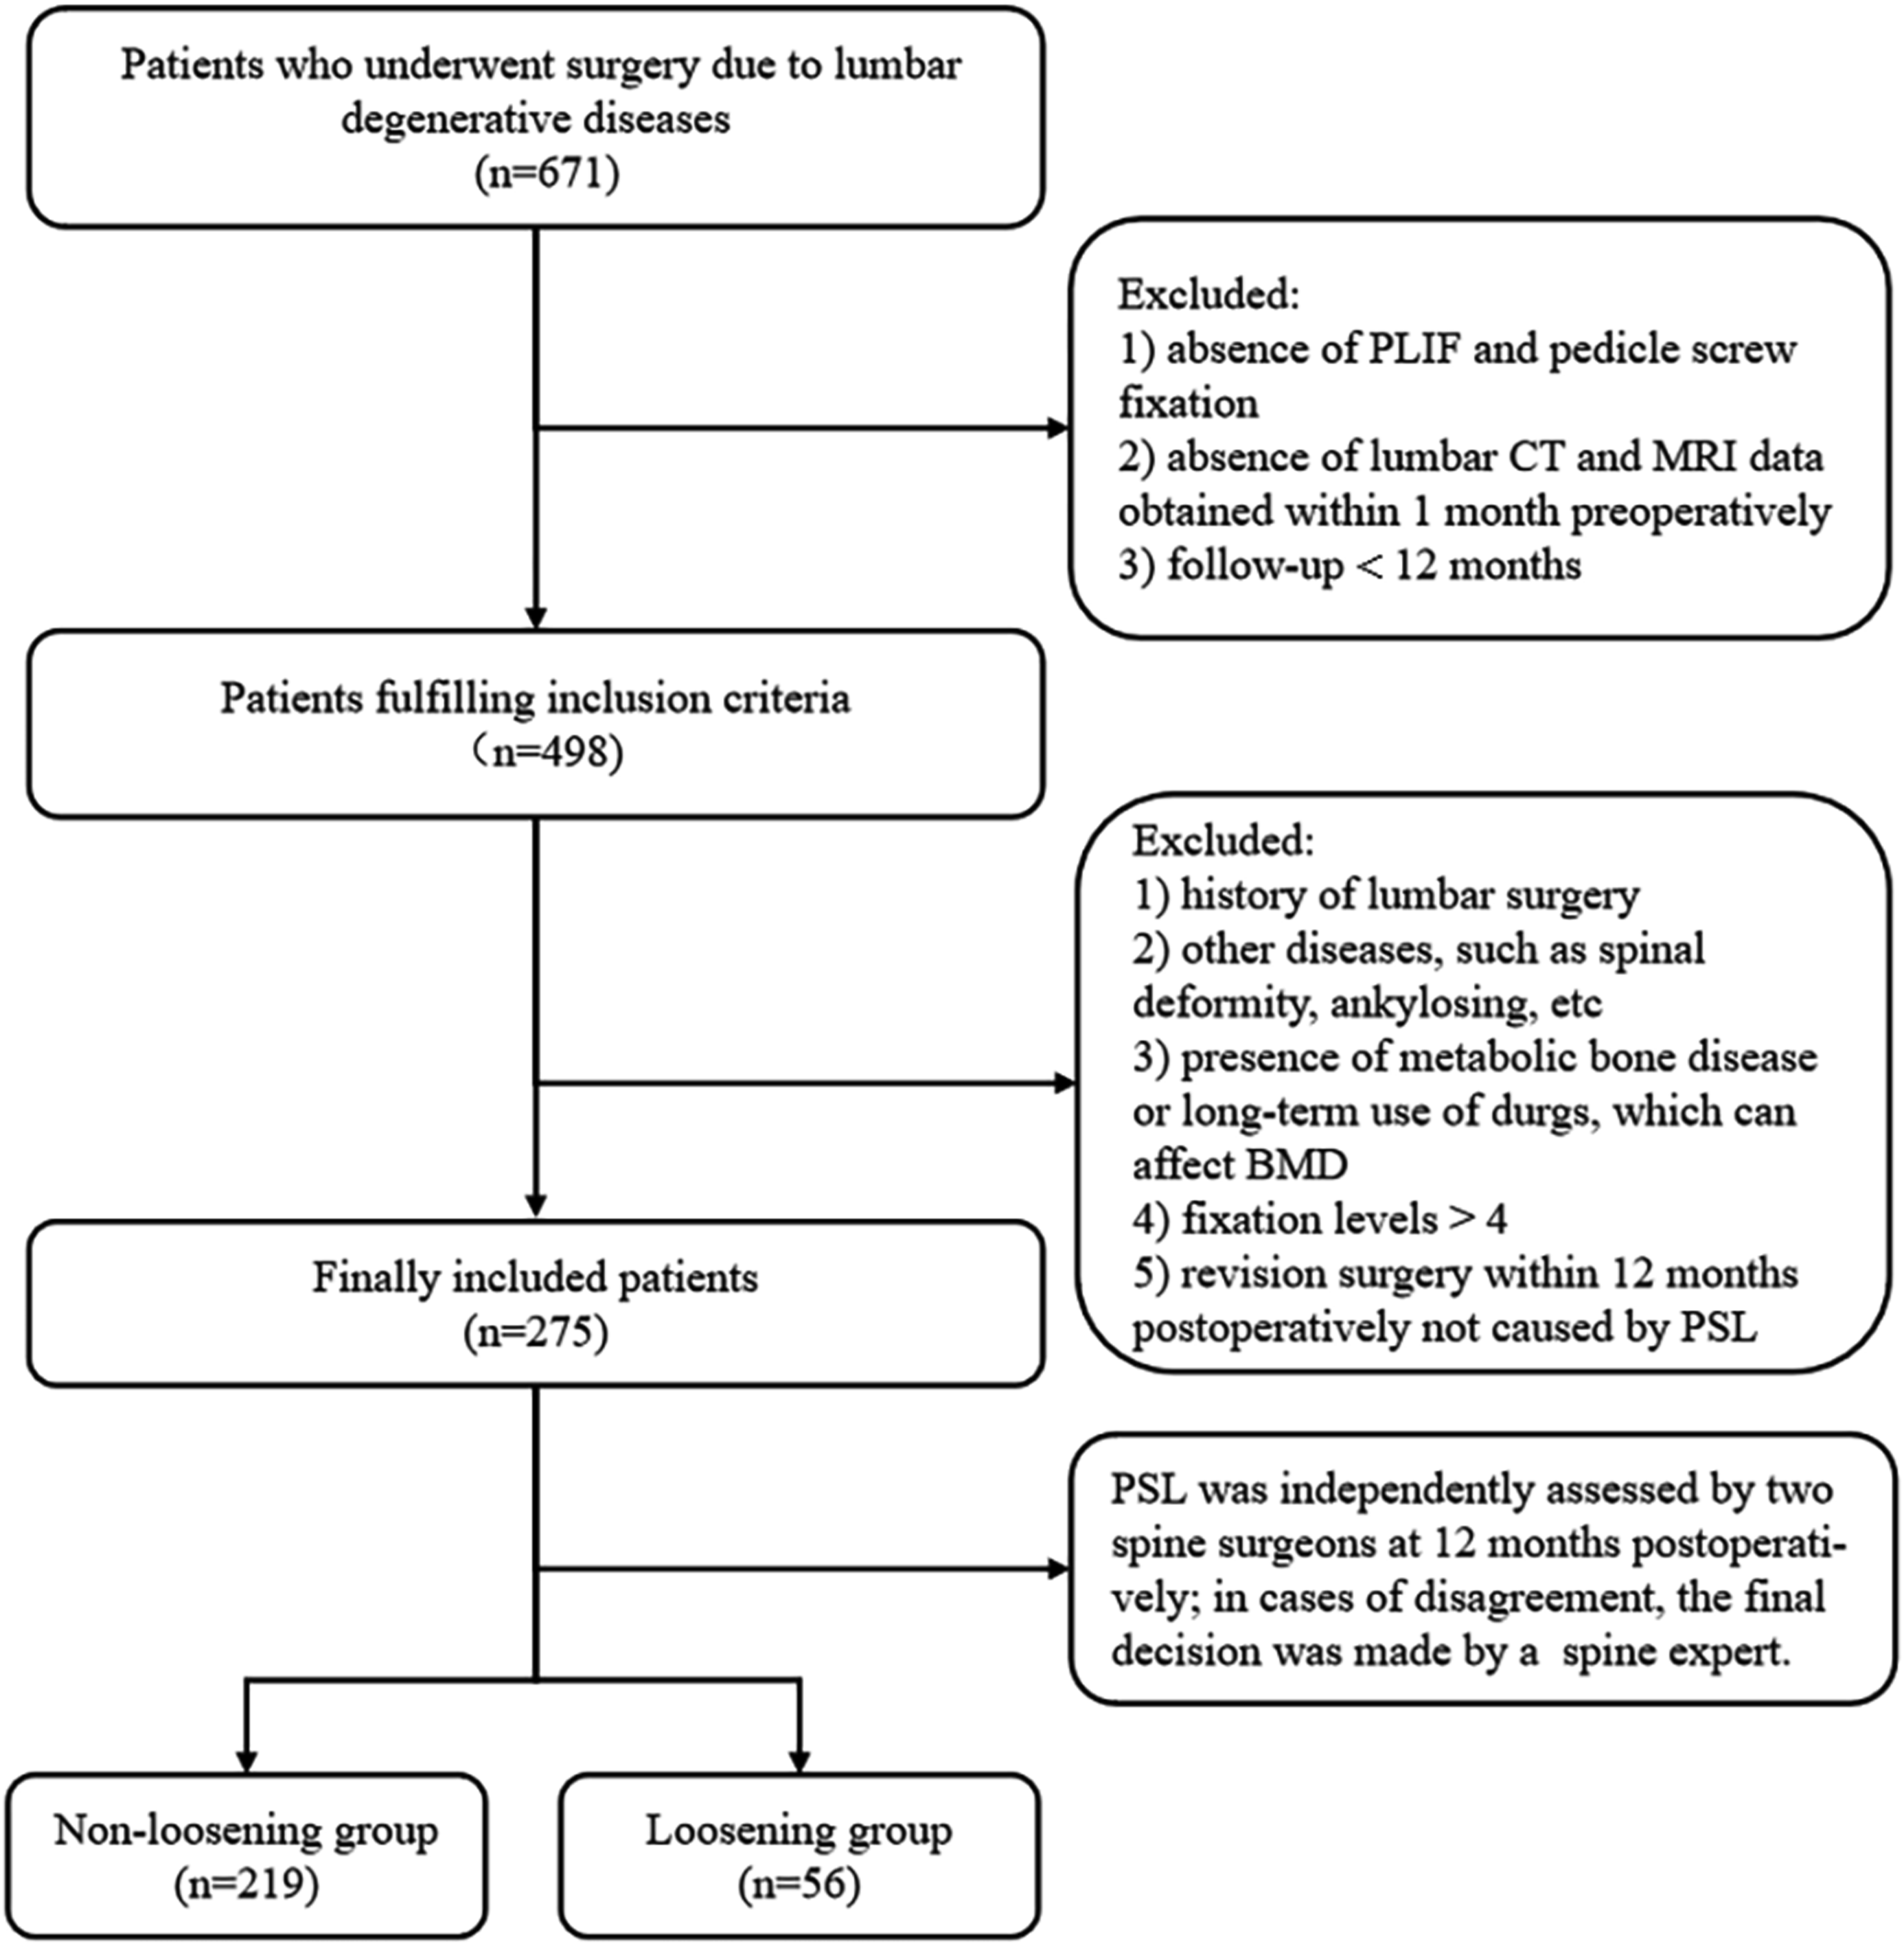
Data Collection and Outcome Assessment
The patient demographic data collected included age, sex, and body mass index (BMI). Radiological data included fixation levels, the lowest instrumented vertebra (LIV) at S1, L1 HU value, pedicle HU value, VBQ score, and PBQ score. Screw loosening was defined as the presence of a radiolucent zone ≥ 1 mm around the pedicle screw on radiography.1,33 Clinical outcomes were assessed using the visual analog scale (VAS) and the Oswestry Disability Index score at 12 months postoperatively.
HU Value Measurements
The L1 HU value was measured following the method of Schreiber et al.
34
An elliptical region of interest (ROI) was placed at 3 axial levels on CT scans: below the superior endplate, at the vertebral midsection, and above the inferior endplate. This encompasses as much trabecular bone as possible while avoiding cortical bone and heterogeneous areas such as the posterior venous plexus, bone islands, and endplate sclerosis. The mean of the 3 measurements was documented as the L1 HU value. The pedicle HU value was measured following the method of Xu et al.
35
the ROI was placed at the narrowest portion of the bilateral L1 pedicles, and the average of the 2 measurements was recorded (Figure 2). ROIs Were Placed at 3 Axial levels (Below the Superior Endplate, Vertebral Midsection, and Above the Inferior Endplate) of L1 for L1 HU Value Measurement (A). ROIs were Placed at the Narrowest point of the Bilateral Pedicles on the Midsagittal Slice of the L1 CT scan for Pedicle HU value Measurement (B)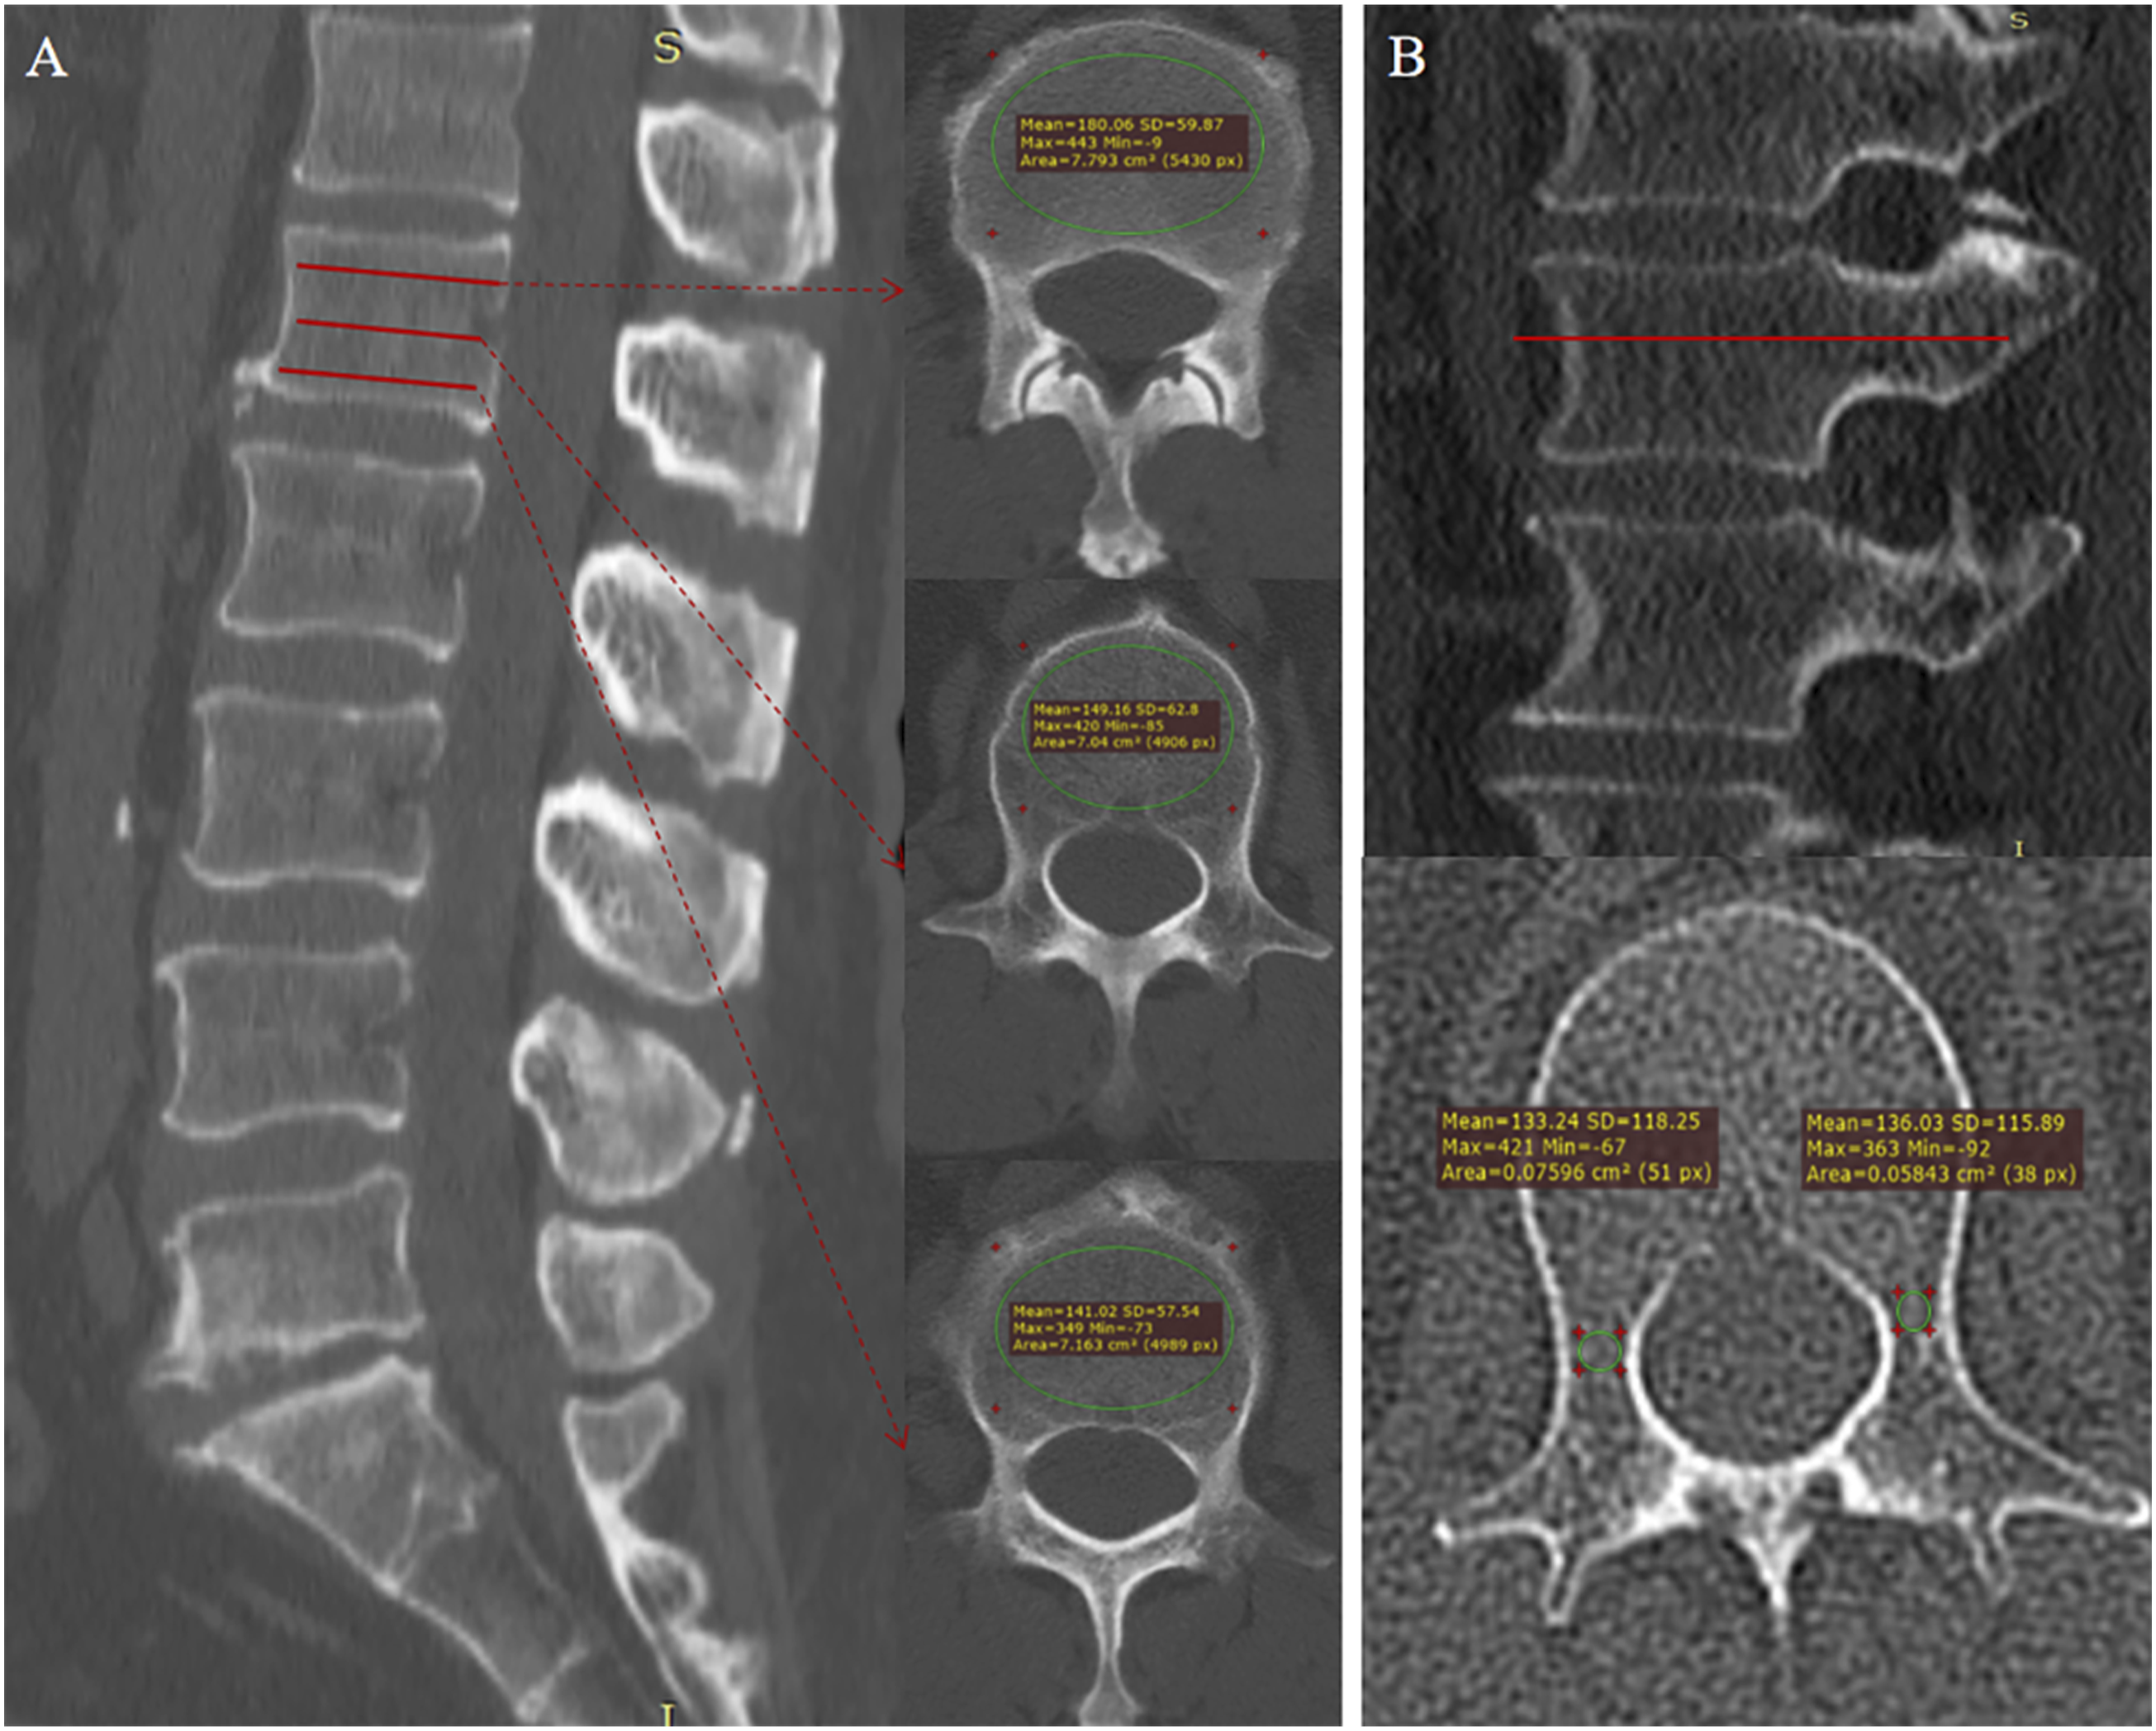
VBQ and PBQ Score Calculation
All MRI scans were performed on the same scanner. The VBQ score was calculated utilizing lumbar T1-weighted MRI without contrast. Following the method described by Ehresman et al.
18
ROIs were placed in the medullary region of L1–L4 at 3 mm from the cortical margin and the cerebrospinal fluid (CSF) space at the L3 level on the mid-sagittal plane. The mean signal intensity (SI) of each vertebral ROI and the CSF mean SI were recorded. The VBQ score was then calculated as the ratio of the average vertebral SI to the CSF SI. The PBQ score was measured following the VBQ method. ROIs were placed in L1–L4 regions 3 mm from the pedicle cortex to obtain the pedicle SI on T1-weighted sagittal MRI images. The PBQ score was then calculated as the average pedicle SI divided by the CSF SI at the L3 level. CSF from the L2 or L4 level was used instead if the CSF at the L3 level was unavailable (Figure 3). VBQ (A) and PBQ Scores (B) were Assessed on Preoperative Lumbar MRI and Standardized Based on the L3 Cerebrospinal Fluid (CSF) Signal Intensity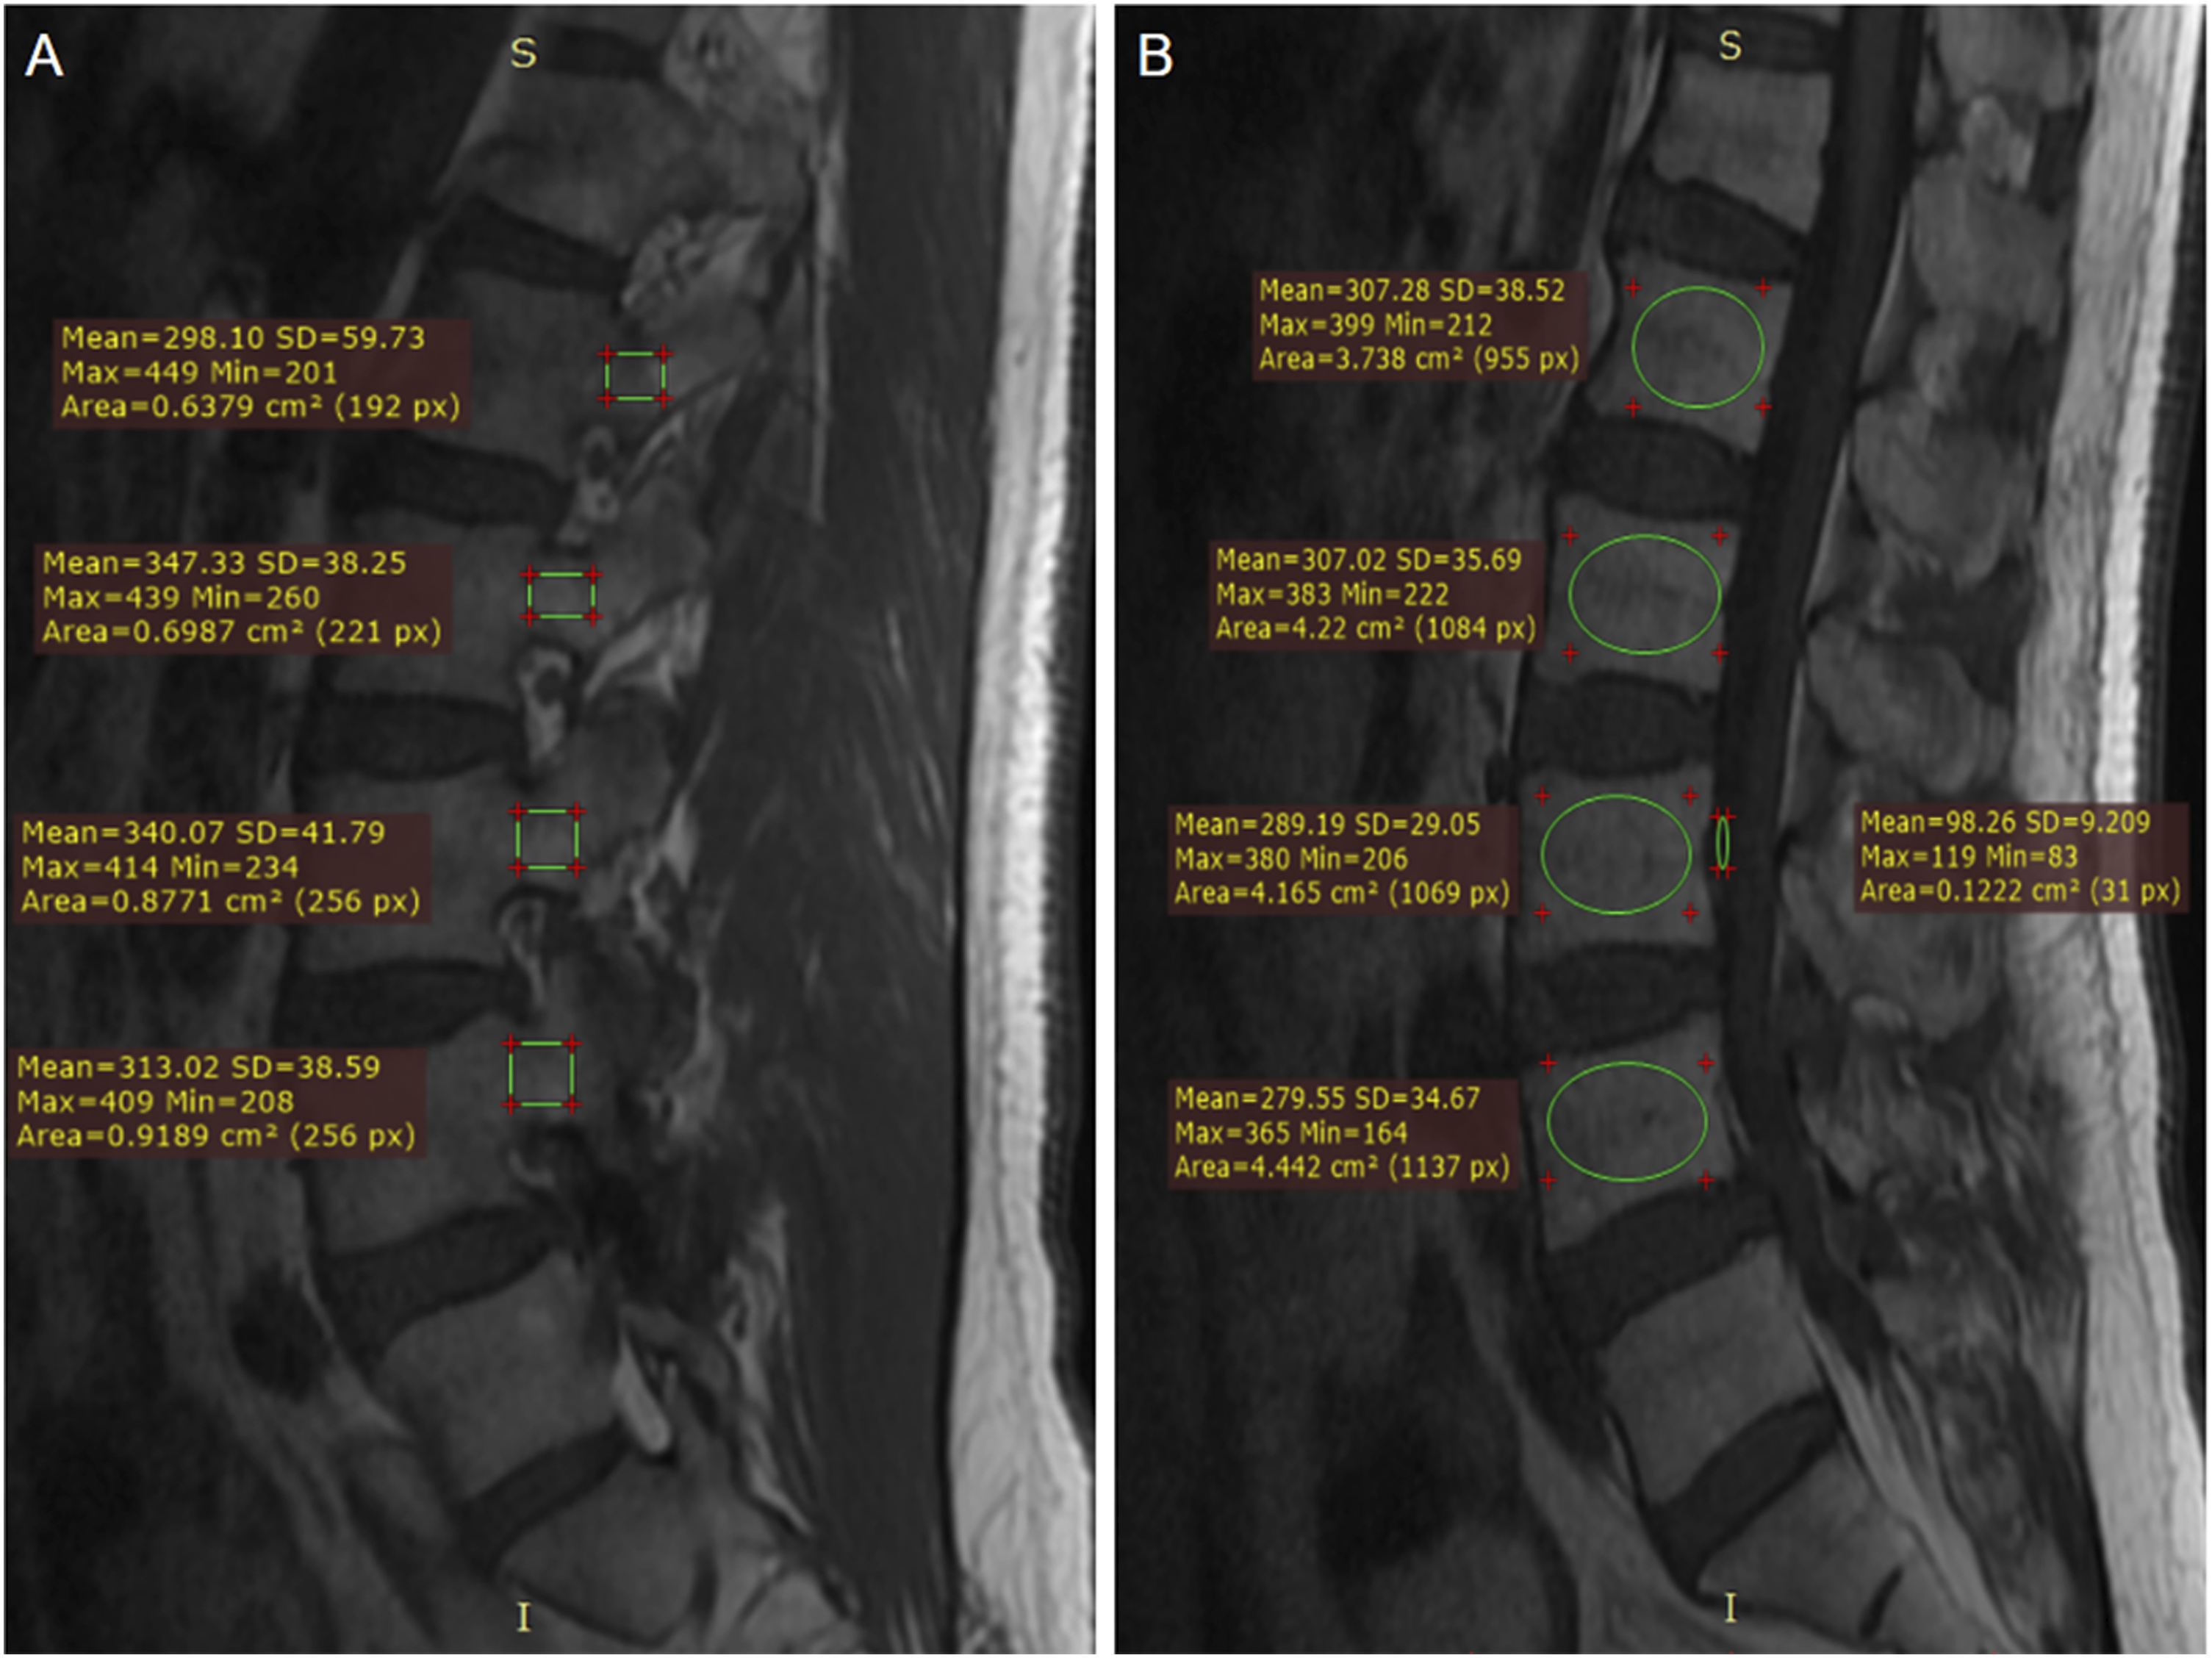
Supplemental File 1 presents detailed CT and MRI parameters, along with a description of the surgical procedure. Two experienced spine surgeons (T.W. with 5 years of experience and A.W. with 5 years of experience) independently measured the vertebral body and pedicle HU values, as well as the VBQ and PBQ scores using RadiAnt DICOM Viewer version 2025.1 (Medixant, Poznań, Poland), and the average of their measurements was recorded as the final result. The anonymised DICOMs were available. Both surgeons were blinded to the patient’s clinical outcomes and also blinded to each other’s first set of ROIs. After 2 weeks later, they repeated the measurements, and the intra- and inter-reader correlation coefficients (ICC) were calculated. The ICC values less than 0.5, between 0.5 and 0.75, between 0.75 and 0.9, and greater than 0.90 were defined as indicating poor, moderate, good, and excellent reliability, respectively. 36 A third spine surgeon independently assessed screw loosening.
Statistical Analysis
Comparison of Patient Characteristics Between the Loosening and Non-loosening Groups
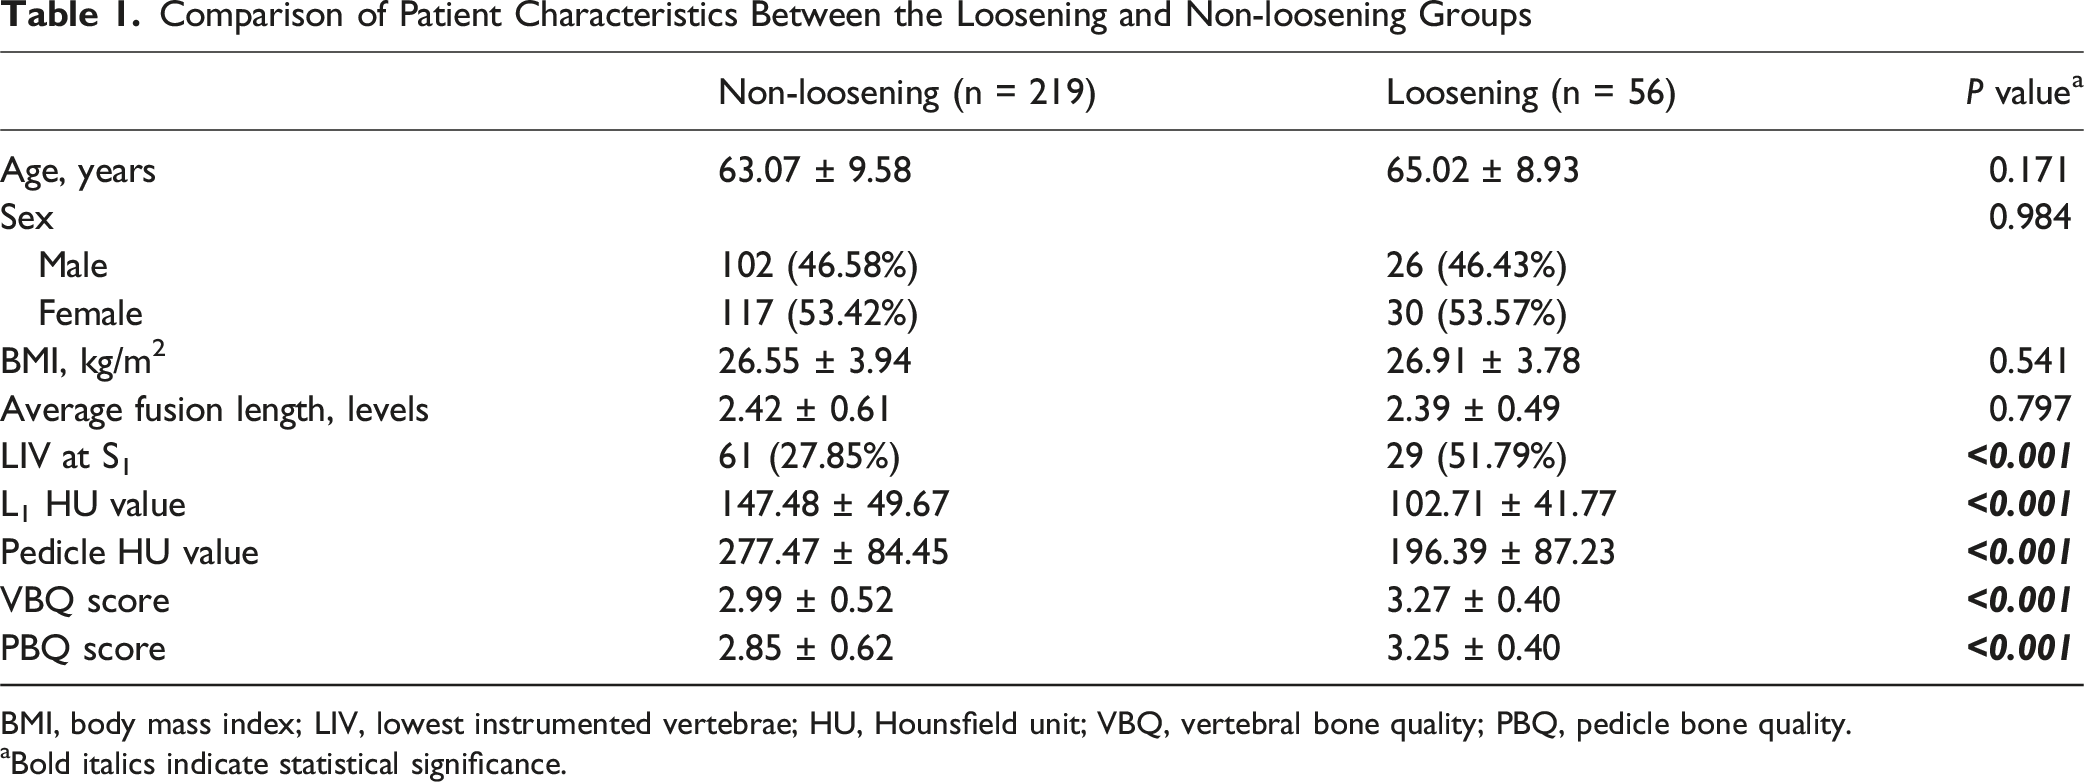
BMI, body mass index; LIV, lowest instrumented vertebrae; HU, Hounsfield unit; VBQ, vertebral bone quality; PBQ, pedicle bone quality.
aBold italics indicate statistical significance.
Results
This study included 275 patients (128 males and 147 females). The mean age was 63.47 ± 9.47 years, the mean BMI was 26.62 ± 3.91 kg/m2, and the mean fusion length was 2.41 ± 0.59 levels. The screw loosening rate was 20.36% (56/275), and 32.73% of patients had the LIV at S1. The mean L1 and pedicle HU values and mean VBQ and PBQ scores were 138.36 ± 51.38, 260.96 ± 90.95, 3.05 ± 0.51, and 2.91 ± 0.60, respectively. Postoperative low‐back pain VAS score was significantly higher in the loosening group, whereas other clinical outcomes did not significantly differ between the groups (Supplemental File 2). The ICCs for L1 and pedicle HU values, as well as VBQ and PBQ scores, all exceeded
Table 1 compares patient characteristics between the loosening and non-loosening groups. Age, sex, BMI, and fusion levels did not significantly differ between the groups (P > 0.05). Notably, the loosening group had significantly lower L1 and pedicle HU values and higher LIV proportions at S1, VBQ scores, and PBQ scores compared with the non-loosening group (P < 0.001).
Logistic Regression Analysis of the Influencing Factors for Screw Loosening After Lumbar Spine Surgery
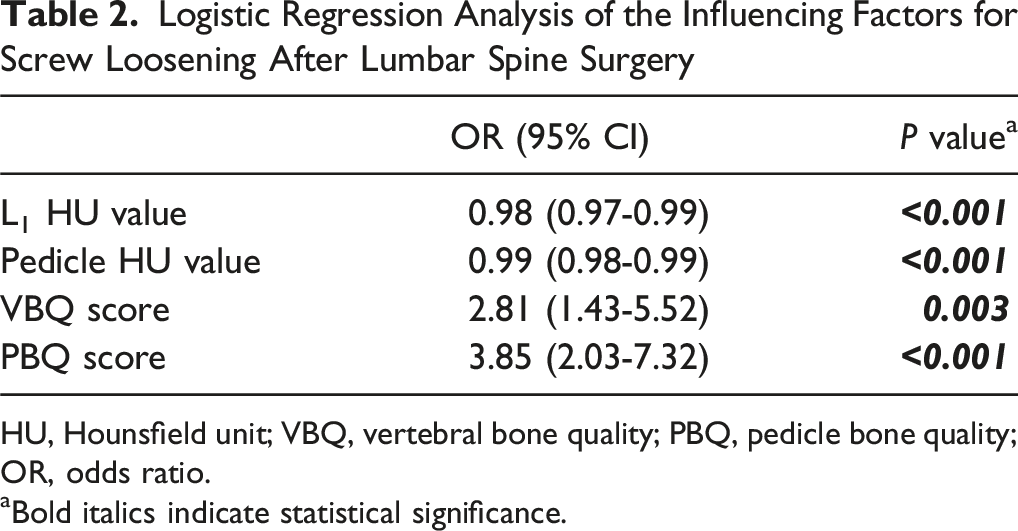
HU, Hounsfield unit; VBQ, vertebral bone quality; PBQ, pedicle bone quality; OR, odds ratio.
aBold italics indicate statistical significance.
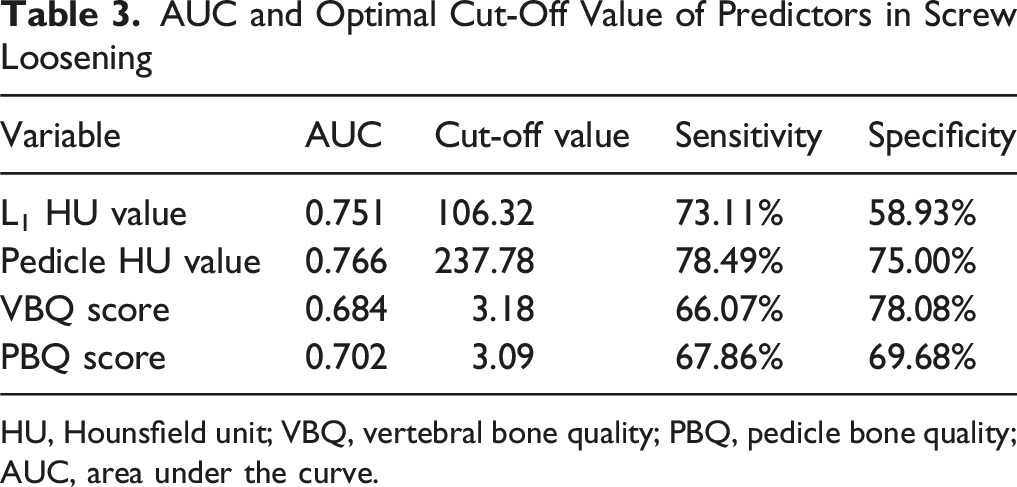
ROC curves were constructed to assess the predictive value of each bone quality indicator for PSL (Figure 4), and the Youden index was employed to determine the optimal cut-off values (Table 3). The AUC for L1 and pedicle HU values and VBQ and PBQ scores were 0.751 (optimal cut-off: 106.32; sensitivity: 73.11%; specificity: 58.93%), 0.766 (optimal cut-off: 237.78; sensitivity: 78.49%; specificity: 75.00%), 0.684 (optimal cut-off: 3.18; sensitivity: 66.07%; specificity: 78.08%), and 0.702 (optimal cut-off: 3.09; sensitivity: 67.86%; specificity: 69.68%), respectively. Using 110 as the simplified optimal cut-off value for pedicle HU, the McNemar test showed no statistically significant difference compared to 106.32 (P = 0.125). The DeLong test revealed that only the difference between the AUC of the pedicle HU value and the VBQ score reached statistical significance (P < 0.05) (Supplemental File 6). ROC Curve Analysis of L1 and Pedicle HU Values and VBQ and PBQ Scores AUC and Optimal Cut-Off Value of Predictors in Screw Loosening HU, Hounsfield unit; VBQ, vertebral bone quality; PBQ, pedicle bone quality; AUC, area under the curve.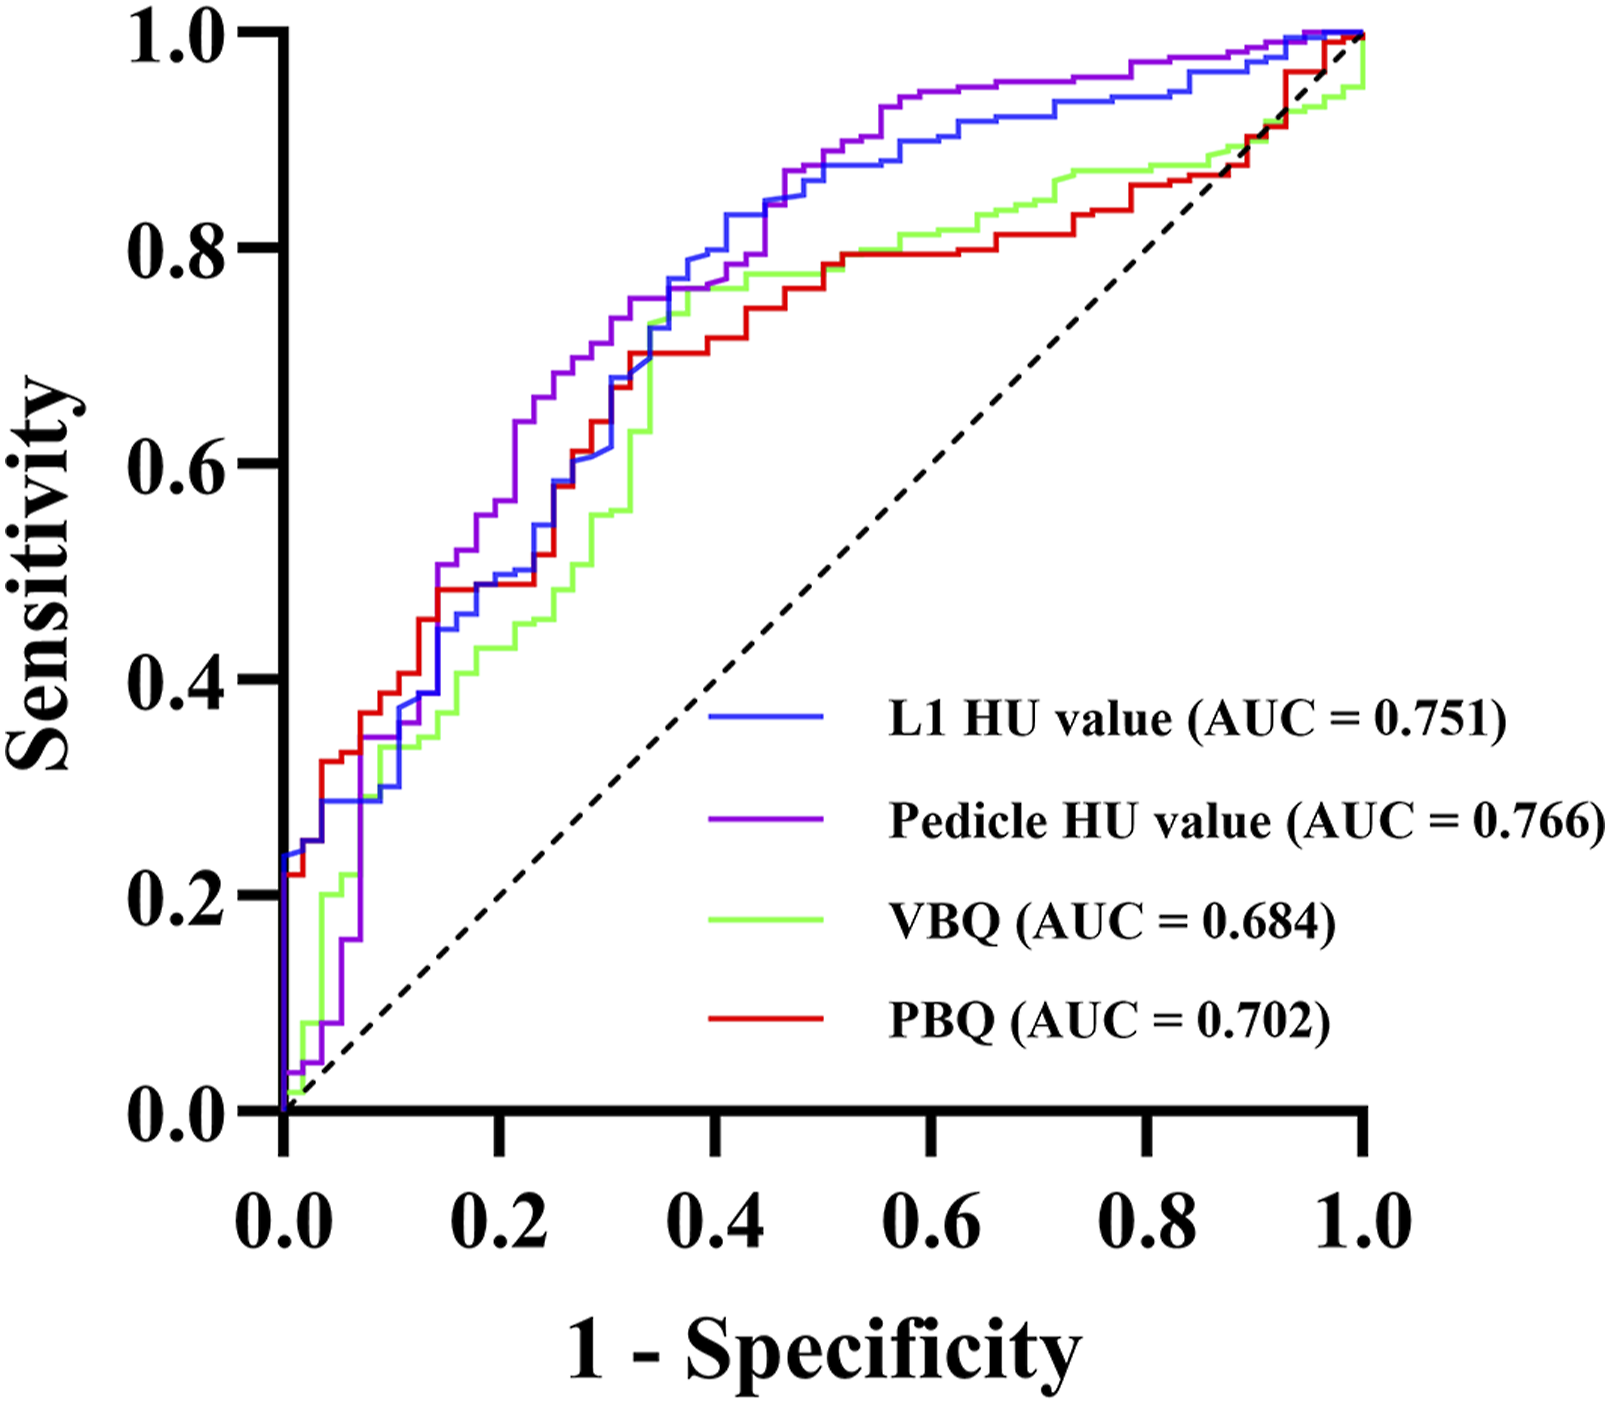
Discussion
To the best of our knowledge, this study is the first to systematically compare the predictive performance of the pedicle HU value and PBQ score for PSL after PLIF. We revealed that pedicle and L1 HU values and VBQ and PBQ scores were all independently associated with PSL after PLIF, and the pedicle HU value was the most discriminative BMD indicator.
PSL is a common complication after PLIF, 1 frequently causing restricted mobility and persistent low-back pain, with severe cases requiring revision surgery.1-3 In our study, the loosening group demonstrated a higher postoperative back VAS score (P < 0.05), consistent with the findings of Zou et al 21 Loosened screws may undergo micromotion during physical activity, causing repeated irritation of the surrounding bone and compromised spinal stability, which may ultimately result in low-back discomfort. These findings indicate that PSL is closely associated with poor clinical outcomes. 22 Therefore, the preoperative identification of high-risk patients and the implementation of individualized preventive strategies are crucial to improving surgical success and clinical outcomes. Previous studies have determined common risk factors for PSL, including advanced age, osteoporosis, sagittal imbalance, multilevel fixation, and LIV at S1.6,23,37,38 In our study, the screw loosening rate was 20.36% (56/275), consistent with previous reports.1,9,27 We revealed LIV at S1 as an independent risk factor for PSL, aligning with previous findings,22,23 possibly due to the shorter, wider anatomy of the S1 pedicle and the greater shear and torsional stresses borne by S1 as the stress conduction center between the spine and pelvis. 39 However, neither age nor fusion length appeared as a significant risk factor in our study. The former may indicate that bone loss, rather than age per se, drives screw loosening, whereas the latter may be caused by the limited statistical power from our sample size.
BMD is one of the major risk factors for PSL after lumbar instrumentation.5,6,40 DXA remains the gold standard for BMD assessment; however, DXA measurements in patients with degenerative lumbar changes are frequently spuriously increased due to osteophytes,14,41-43 making DXA alone insufficient to identify all high-risk individuals preoperatively. Recently, the CT-based HU value and MRI-based VBQ score have appeared as potential alternatives. 43 Joseph et al revealed that the HU value effectively differentiates healthy, osteopenic, and osteoporotic populations, 34 and the VBQ score correlates moderately with DXA T-scores 18 while exhibiting good intra- and inter-reader reliability. 44 In our study, both the L1 HU value and VBQ score were independent PSL predictors, consistent with prior reports.21-23,27 Ye et al revealed that the VBQ score outperformed the HU value in predicting PSL among patients with lumbar spinal stenosis (PAUC = 0.003). Similarly, Li et al. revealed that the VBQ score was superior to the HU value. 23 Contrasting these findings, our results indicated a lower AUC for the VBQ score compared with the L1 HU value (0.684 vs 0.751). We attribute this discrepancy to the following reasons. First, there are fundamental differences in the working principles of CT and MRI. The CT-based HU value was obtained by quantifying the degree of attenuation of X-rays passing through the trabecular bone during CT imaging. This is a direct positive correlation. Selectively delineating and measuring the ROI can prevent the influence of the cortical bone and osteophytes, thereby obtaining more accurate BMD measurement results. 34 The MRI-based VBQ score indirectly assesses bone quality via vertebral fat infiltration45,46; however, the fat content is susceptible to disc degeneration and inflammatory factors,47,48 and the errors are not fully mitigated by ROI selection. Wang et al. further demonstrated that vertebral marrow fat infiltration tends to plateau in individuals aged ≥ 80 years despite ongoing bone loss. 49 Second, our method for measuring vertebral HU values differs from that used by Li et al. Following the method described by Schreiber et al. 34 we measured the HU values at 3 levels of the L1 vertebral body—below the superior endplate, at the mid-vertebral body, and above the inferior endplate—and used the average value as the final result. Fan et al. also reported that HU measurements at L1 have the highest inter-observer consistency (ICC = 0.909), compared to T12 and L2 (ICC = 0.895 and 0.887, respectively), making L1 the most representative vertebral level. 50 Li et al defined the ROI only at the mid-vertebral body and averaged HU values across L1–L4, which may introduce greater variability and result in a lower AUC for HU values. Finally, the patients in our study were generally older than those in the study by Liu et al. Given that advanced age is associated with more severe disc degeneration, the resulting variability in VBQ scoring may have further contributed to the lower AUC observed for VBQ in our study. However, the difference between the HU value and VBQ score was not statistically significant (PAUC = 0.077), indicating that the HU value demonstrates greater reliability, but it remains intrinsically correlated with the VBQ score.
Screw stability depends on the structural characteristics of the pedicle,11,51,52 and pull-out strength correlates much more strongly with the pedicle region than with the vertebral body BMD, 53 and approximately 60% of the screw pull-out strength is attributable to the pedicle. 11 Consistent with previous studies, we revealed that the AUC for the pedicle HU value in predicting PSL was slightly greater than that for the vertebral body HU value,27,54 and that PBQ’s AUC slightly surpassed VBQ’s. 28 Using the same measurement machine, BMD assessment at the pedicle, which is the site most directly related to screw stability, provides a relatively higher predictive accuracy. To the best of our knowledge, no previous research has directly compared the predictive capacities of BMD indicators at the pedicle region. Our study revealed that the pedicle HU value not only outperformed PBQ in predicting PSL (0.766 vs 0.702) but also exhibited slightly higher sensitivity and specificity. Interestingly, we observed that the PBQ score’s AUC was slightly lower than that of the L1 HU value (0.702 vs 0.751), indicating that differences in measurement tools cannot be fully compensated by the choice of target region. These results emphasize that prioritizing CT as the tool for BMD evaluation—rather than focusing solely on the measurement site—may be a more valuable strategy in assessing the risk of PSL. Moreover, the difference between the AUC of the pedicle HU value and the VBQ score was statistically significant (PAUC = 0.047), which we attribute to the “superposition of differences” in the measurement tool and region. When there is a discrepancy between the pedicle HU value and the VBQ score in predicting the risk of PSL, surgeons should prioritize the pedicle HU value to formulate a more appropriate surgical strategy.
In addition to measuring BMD at the vertebral body and pedicle, some studies have explored measuring the three-dimensional (3D) HU value along the pedicle screw trajectory as a predictive tool for PSL. 54 However, this method requires specialized 3D image-analysis software and is not readily applicable in routine clinical practice. In summary, L1 and pedicle HU values and VBQ and PBQ scores all serve as independent PSL predictors after lumbar instrumentation in patients with degenerative lumbar disease, with the pedicle HU value showing greater predictive accuracy than the PBQ score, making it a more reliable and clinically valuable indicator. We recommend that surgeons utilize already-available preoperative CT scans to obtain pedicle HU values as a complementary tool to DXA for preoperative BMD assessment, in order to streamline patient selection for augmentation strategies. According to the results of the McNemar test, the threshold may be set at 110 (originally 106.32) for clinical convenience. We recommend adding teriparatide to conventional antiosteoporosis therapy for patients at high risk of screw loosening with pedicle HU values below 110. Ohtori et al. revealed that teriparatide can significantly reduce PSL. 55 Surgically, adopting novel materials and techniques that strengthen the screw–bone interface stability, such as expandable screws,1,30-32 hydroxyapatite-coating of pedicle screws, 56 or cement-augmented screws, 57 may improve patient outcomes.
Limitation
This study has several limitations. First, this was a single-center retrospective study, and patients with spinal deformity, tumors, infections, and metabolic bone diseases were excluded, which may limit the external validity and generalizability of the findings. Second, the duration and adherence of postoperative anti-osteoporotic treatment were not systematically recorded or compared, potentially introducing bias. Future multicenter prospective studies with larger sample sizes and standardized protocols for monitoring medication adherence and treatment duration are warranted to further validate the effectiveness and applicability of our findings. Third, data on patients’ DXA T scores were lacking, which prevented us from comparing the predictive ability of pedicle HU values with that of DXA for PSL. In future studies, we plan to incorporate patient DXA data to benchmark against standard BMD tools of the pedicle and vertebral body, and to compare their predictive performance. Fourth, the manual selection of ROIs for HU value and VBQ score measurements is prone to subjectivity. However, previous research has demonstrated that HU value and VBQ score measurements have good intra- and inter-reader reliability.44,58 Future development of a deep learning model capable of automated delineation of ROIs on CT/MRI scans for BMD assessment is anticipated to effectively resolve this issue. Fifth, constructing separate logistic regression models for each predictor may limit the ability to assess their relative contributions. Finally, we only analyzed some of the factors associated with PSL and other well-established influencing factors, such as pedicle screw size, insertion technique, postoperative sagittal alignment, and spinopelvic parameters, were not included in the statistical analysis due to limitations in sample size.4,59-62 Future studies are warranted to incorporate these surgical factors and integrate various BMD indicators, with the ultimate goal of developing a precise predictive model for clinical applications.
Conclusion
The pedicle HU value more accurately predicts PSL than the PBQ score and is the most discriminative indicator of BMD in patients undergoing PLIF for lumbar degeneration. Preoperative assessment of pedicle HU values facilitates the identification of patients at high risk of PSL and may help surgeons in optimizing surgical strategies to improve the patient’s clinical outcomes.
Supplemental Material
Supplemental Material - Comparison of the Predictive Roles of CT- and MRI-Based Pedicle Regional Osteoporosis Status Measurements for Pedicle Screw Loosening After Posterior Lumbar Interbody Fusion
Supplemental Material for Comparison of the Predictive Roles of CT- and MRI-Based Pedicle Regional Osteoporosis Status Measurements for Pedicle Screw Loosening After Posterior Lumbar Interbody Fusion by Peng Du, MM, Minghui Liang, MM, Ruiyuan Chen, MM, Tianyi Wang, MD, Ning Fan, MD, Shuo Yuan, MD, Aobo Wang, MD, Ziqian Ma, MD, Yu Xi, MM, Lei Zang, MD in Global Spine Journal
Footnotes
Ethical Considerations
The research conducted has been performed in accordance with the Declaration of Helsinki. Approval for the study was obtained from the ethics committees of the Beijing Chaoyang Hospital (2024-KE-346).
Author Contributions
PD and ML and RC contributed equally to this work. PD and ML and RC contributed equally to this work. Conception and design: LZ. Acquisition of data: PD and ML and RC. Analysis and interpretation of data: PD and ML and RC. Drafting the article: PD and ML and RC. Critically revising the article: LZ, TW, NF, SY, and AW. Reviewed submitted version of manuscript: ZM and YX.
Funding
The authors received no financial support for the research, authorship, and/or publication of this article.
Declaration of Conflicting Interests
The authors declared no potential conflicts of interest with respect to the research, authorship, and/or publication of this article.
Data Availability Statement
The datasets generated during and/or analysed during the current study are available from the corresponding author on reasonable request.
Supplemental Material
Supplemental material for this article is available online.
References
Supplementary Material
Please find the following supplemental material available below.
For Open Access articles published under a Creative Commons License, all supplemental material carries the same license as the article it is associated with.
For non-Open Access articles published, all supplemental material carries a non-exclusive license, and permission requests for re-use of supplemental material or any part of supplemental material shall be sent directly to the copyright owner as specified in the copyright notice associated with the article.