
Abstract
Study Design
A case-controlled retrospective study.
Objective
We aimed to explore the effectiveness of MRI-based VBQ scores derived by different MRI sequences in assessing risk of an osteoporotic vertebral compression fracture (OVCF) in age- and sex-controlled patients.
Methods
This retrospective study included patients hospitalized for OVCF (fracture group) and degenerative lumbar disease (non-fracture group) from July 2022 to July 2024. Patients in both groups were matched for sex and age in a 1:1 ratio. VBQ scores were acquired from non-contrast lumbosacral MRI T1-weighted, T2-weighted, and short tau inversion recovery (STIR)-weighted sequences. A receiver operating characteristic (ROC) curve and area under the ROC (AUC) were plotted to evaluate the diagnostic accuracy.
Results
A total of 168 patients (n = 84 in each group) were included. VBQ-T1 scores were higher in the fracture group (4.4 vs 4.1, P = 0.001), with an AUC of 0.641 to predict OVCF. VBQ-T2 scores were higher in the fracture group (0.60 vs 0.55, P < 0.001), with an AUC of 0.697. Additionally, VBQ-T2-STIR scores were higher in the fracture group (0.99 vs 0.83, P = 0.004), with an AUC of 0.644. Multivariate logistic regression analysis identified VBQ-T2, rather than VBQ-T1 or VBQ-T2-STIR, as an independent risk factor for OVFC.
Conclusion
This study evaluated the MRI-based VBQ scores in assessing risk of OVCF based on age- and sex-matched cases. The VBQ-T2 score appears most promising for evaluating the risk of OVCF in clinical practice.
Keywords
Introduction
Osteoporosis is characterized by decreased bone quality and impaired micro-structure; it increases bone fragility and the risk of fracture, primarily affecting the hip and spine. 1 An osteoporotic vertebral compression fracture (OVCF) causes complications, such as pain, disability, kyphosis, and even increased mortality. 2 However, osteoporosis remains underdiagnosed because it is either asymptomatic or presents with nonspecific mild pain. A T-score <-2.5 on dual-energy X-ray absorptiometry (DEXA) is the gold standard for diagnosing osteoporosis. 3 Alternatively, a volumetric bone mineral density (vBMD) <80 mg/cm3 using quantitative computerized tomography indicates osteoporosis. 4 Low BMD has been strongly associated with OVCF. However, neither the T-score nor vBMD is adequately examined.5,6
Researchers have been looking for alternative bone quality evaluation methods. In 2014, Michele et al developed a method for diagnosing osteoporosis through magnetic resonance imaging (MRI) T1-weighted sequence, utilizing a noise signal as the standard reference. However, this method was not applicable across MRI systems. 7 In 2019, a novel MRI-based vertebral bone quality (VBQ) assessment demonstrated excellent predictive value (area under the receiver operating characteristic curve, AUC = 0.81) for osteopenia and osteoporosis. It utilized the cerebrospinal fluid (CSF) signal at the L3 level as a standard reference, addressing the limitations of previous methods. 8 Taken together, MRI-based VBQ assessment is feasible for predicting the risk of OVCF. Jeff et al demonstrated that MRI-based VBQ scores predict a higher risk of fragility fractures. 9 Ruoyao et al reported that patients with OVCF demonstrated higher VBQ scores and lower T-scores than patients without OVCF. 10 Nonetheless, these studies calculated VBQ scores solely from T1-weighted sequences. Combining T1-weighted images (WI) with fat-saturated T2WI or short tau inversion recovery (STIR) images facilitates evaluating bone marrow lesions. 11 Fat infiltration, which can be determined from T1 signals, is associated with VBQ. 11 However, most studies have overlooked T2 and STIR signals when calculating VBQ scores. VBQ scores measured using both T1WI and T2WI displayed better predictive performance for new vertebral fractures after augmentation. In contrast, VBQ-STIR was considered ineffective. 12 Thus, VBQ should be assessed using T1, T2, and STIR sequences to thoroughly assess risk of OVCF. Moreover, age and sex have been associated with osteoporosis. However, the mentioned studies did not match the age and sex in the fracture and non-fracture groups, thus introducing bias.
Vertebral marrow fat content was proved significantly increased in the osteoporotic vertebrae. 13 The STIR sequence is obtained by inhibiting fat signals. It calculates VBQ-STIR as the mean signal intensity of vertebral bodies L1 to L4 divided by the CSF signal intensity at L3. Therefore, VBQ-STIR does not reflect changes in fat signals within vertebral bodies. 14 However, whether the difference of signal intensity between T2WI and STIR sequence reflecting the association of marrow fat and OVCF remains unknown. In this study, we aimed to introduce a novel approach to calculate VBQ-T2-STIR and determine its effectiveness in predicting OVCF. To eliminate confounding effects, we adopted an age- and sex-matching technique.
Materials and Methods
Selecting Study Population
The study was approved by the ethical review board of our hospital (2024-255-01), and the need for written informed consent was waived. The hospital information system was searched using terms, namely vertebral compressive fracture (fracture group) and lumbar degenerative disease (non-fracture group), to identify patients hospitalized from July 2022 to July 2024. The inclusion criteria for the fracture group were as follows: 1. Aged >55 years; 2. Complete non-contrast lumbosacral spine MRI. The exclusion criteria for the fracture group were as follows: 1. Vertebral compression fracture caused by tumor or infection; 2. More than 2 fractured vertebral bodies from L1 to L4; 3. Uncertain low-energy trauma; 4. A history of instrumented lumbar spine surgery; and 5. Non-first admission. We first confirm eligible OVCF patients, then, matching counterparts in the non-fracture group with the same age and sex in 1:1 ratio. Because patients in the non-fracture were more than that in the fracture group, we choose the 2 with closest MR acquisition date as a pair. The potential patients in the non-fracture group were ignored when meeting the following criteria: 1. Incomplete non-contrast lumbosacral spine MRI; 2. Vertebral compressive fracture; 3. A history of instrumented lumbar spine surgery; and 4. Tumor or infection. If any patient in the non-fracture group was diagnosed with asymptomatic OVCF by a senior physician, they were reassigned to the fracture group (Figure 1). Flow chart of patients selection.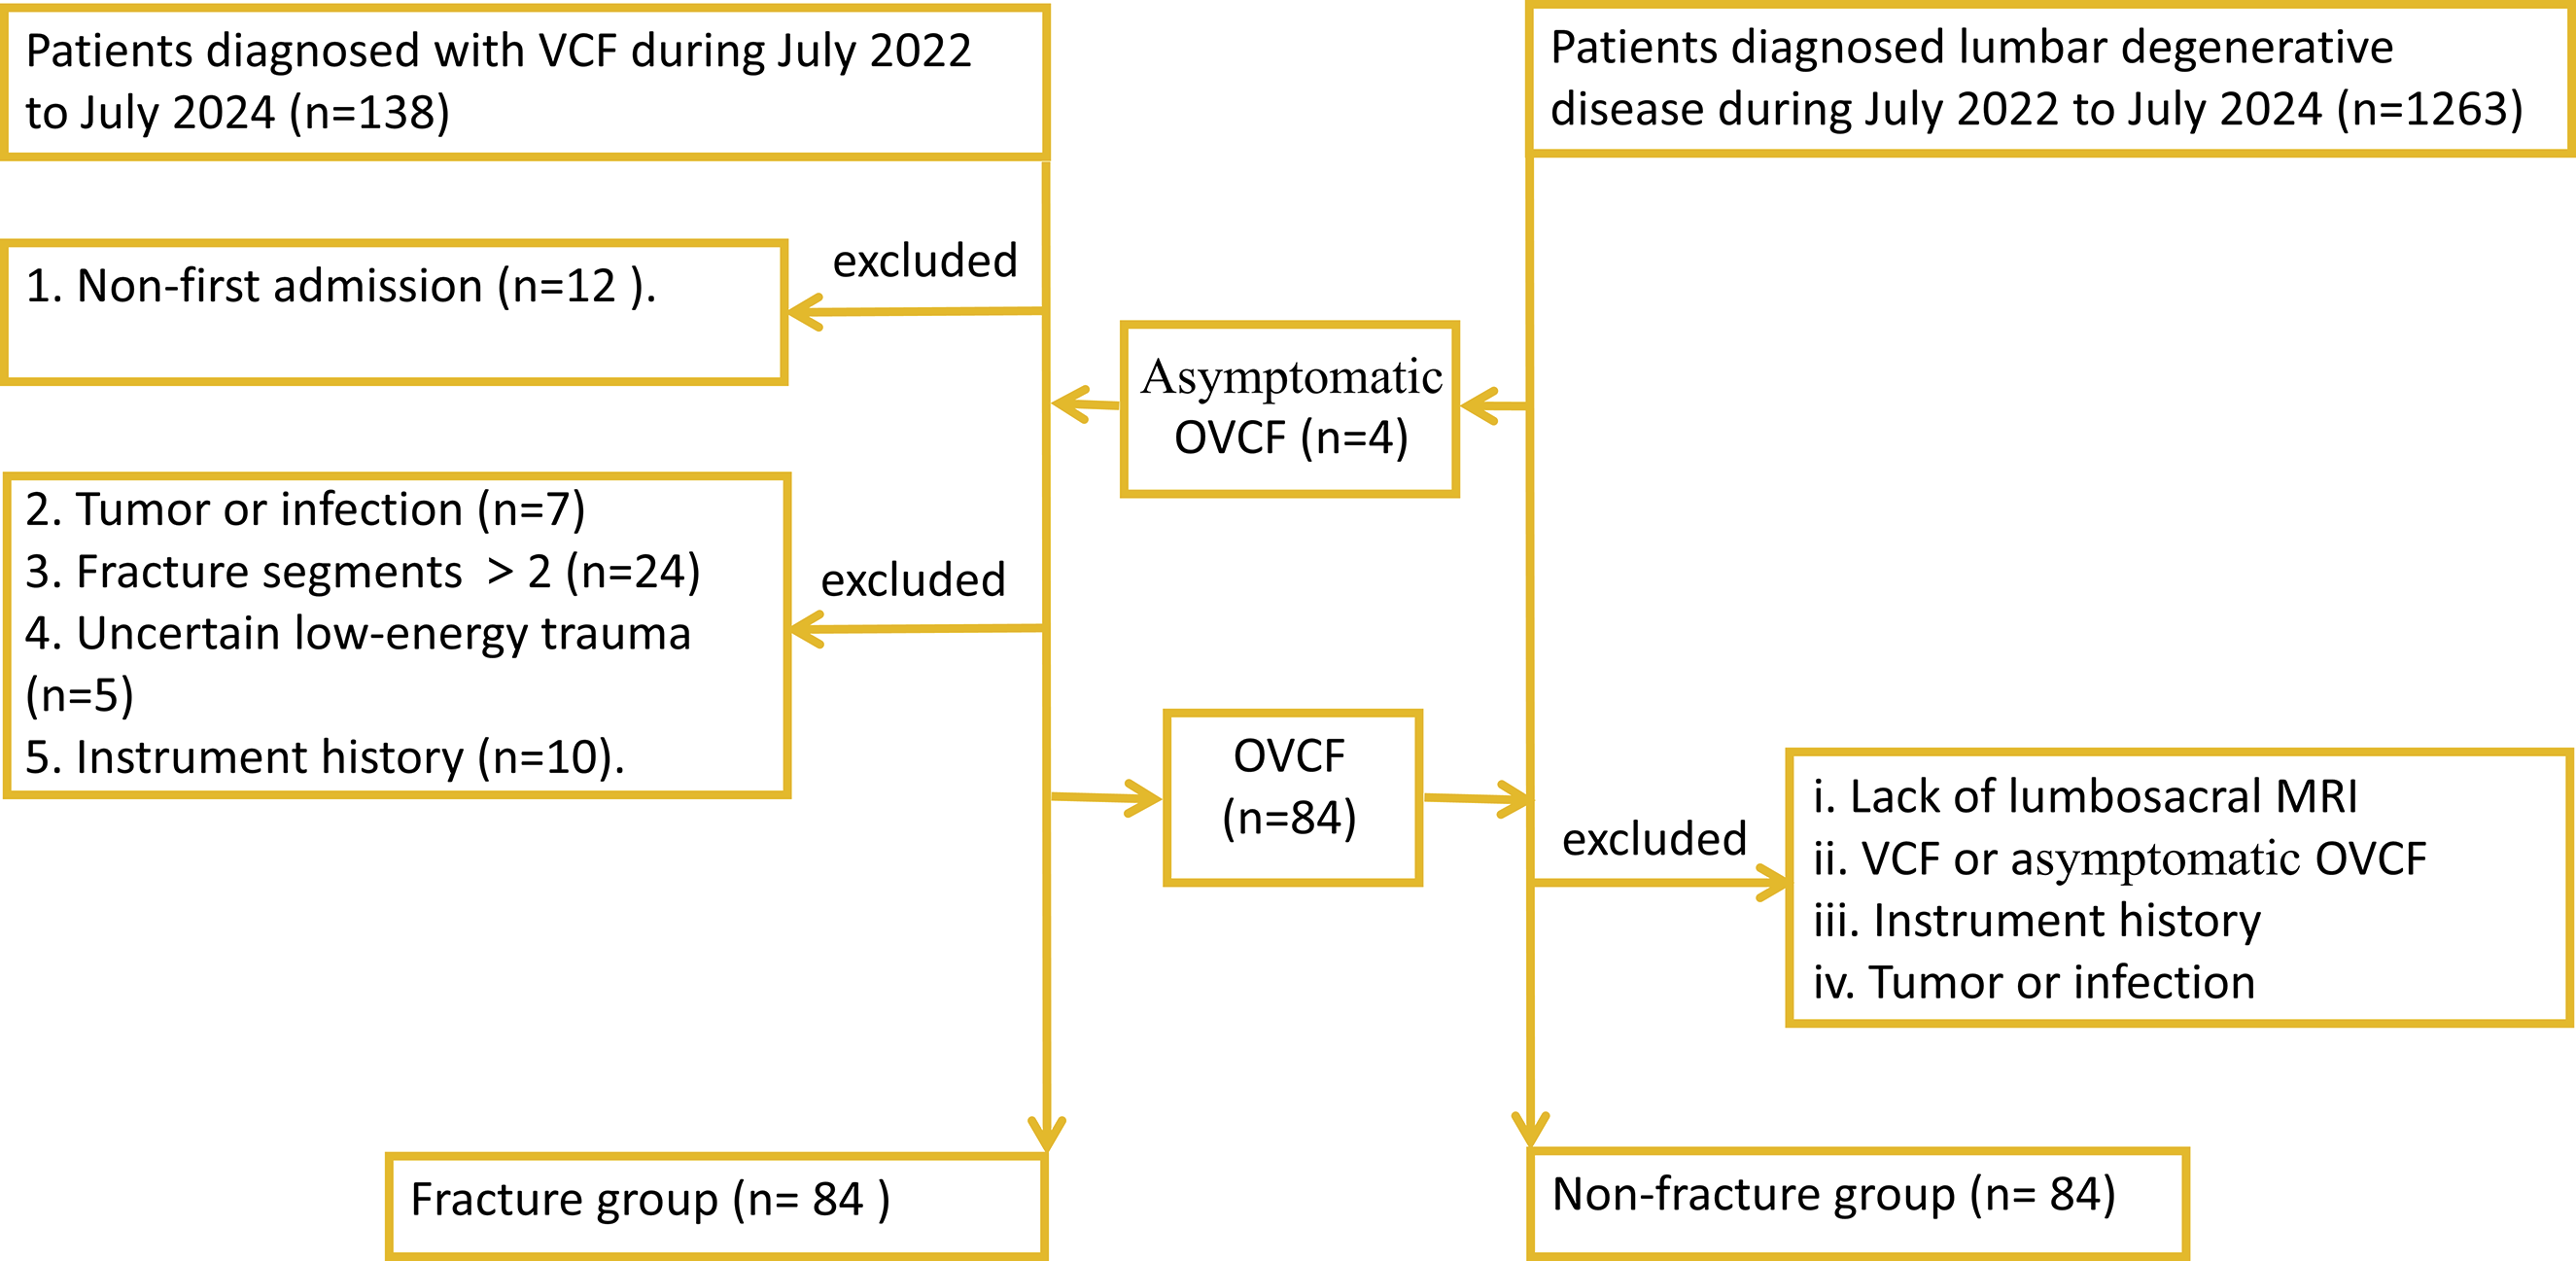
Clinical Data
Demographic data were recorded, including age, sex and body mass index (BMI). The radiological data were recorded, including BMD and corresponding T-scores of the L1–L4 and femoral neck from DEXA (Lunar DPX) reports, as well as VBQ scores calculated from the T1WI, T2WI and STIRWI lumbar MRI.
Measuring VBQ Scores
Two observers were trained to measure the signal intensity (SI), with inter-and intra-observer agreement determined using Bland-Altman plots. For inter-observer agreement, 20 randomly selected patients (10 from each group) were re-examined after an interval exceeding 4 weeks. Differences <10% were considered consistent.
MRI results were obtained using GE (Signa HDX 1.5 T), with a magnetic field of 1.5 T. VBQ-T1, VBQ-T2, and VBQ-STIR measurements were based on a previous study.
12
Briefly, the VBQ score was calculated as the mean SI of L1 to L4 divided by the SI of CSF at L3 (or adjacent levels where L3 displayed stenosis) on a mid-sagittal slice. The STIR sequence inhibits fat signals on T2-weighted images. Therefore, the VBQ-T2-STIR was calculated as the mean of SI differences in L1 to L4 between T2-weighted and STIR sequences; the value was divided by the mean SI difference of CSF between these sequences. For OVCF between L1 and L4, the fractured vertebrae were not included during SI calculation. Instead, adjacent vertebral bodies (T12 and/or L5) were selected as regions of interest (ROIs) for calculating VBQ scores. Parasagittal slices were used in cases of abnormalities, such as scoliosis. To minimize SI error, consistent ROIs were maintained and abnormal vertebral areas, such as hemangioma, venous plexus, and sclerosis, were excluded (Figure 2). Schematic diagrams of the ROI selecting. The mid-sagittal slice of non-contrast lumbosacral spinal MRI was chosen to obtain vertebral SI. SIs from (A) (T1-weighted sequence), (B) (T2-weighted sequence) and (C) (STIR-weighted sequence) calculated VBQ-T1, VBQ-T2 and VBQ-STIR, respectively. ROI, region of interest; MRI, magnetic resonance imaging; SI, signal intensity; STIR, short tau inversion recovery; VBQ, vertebral bone quality.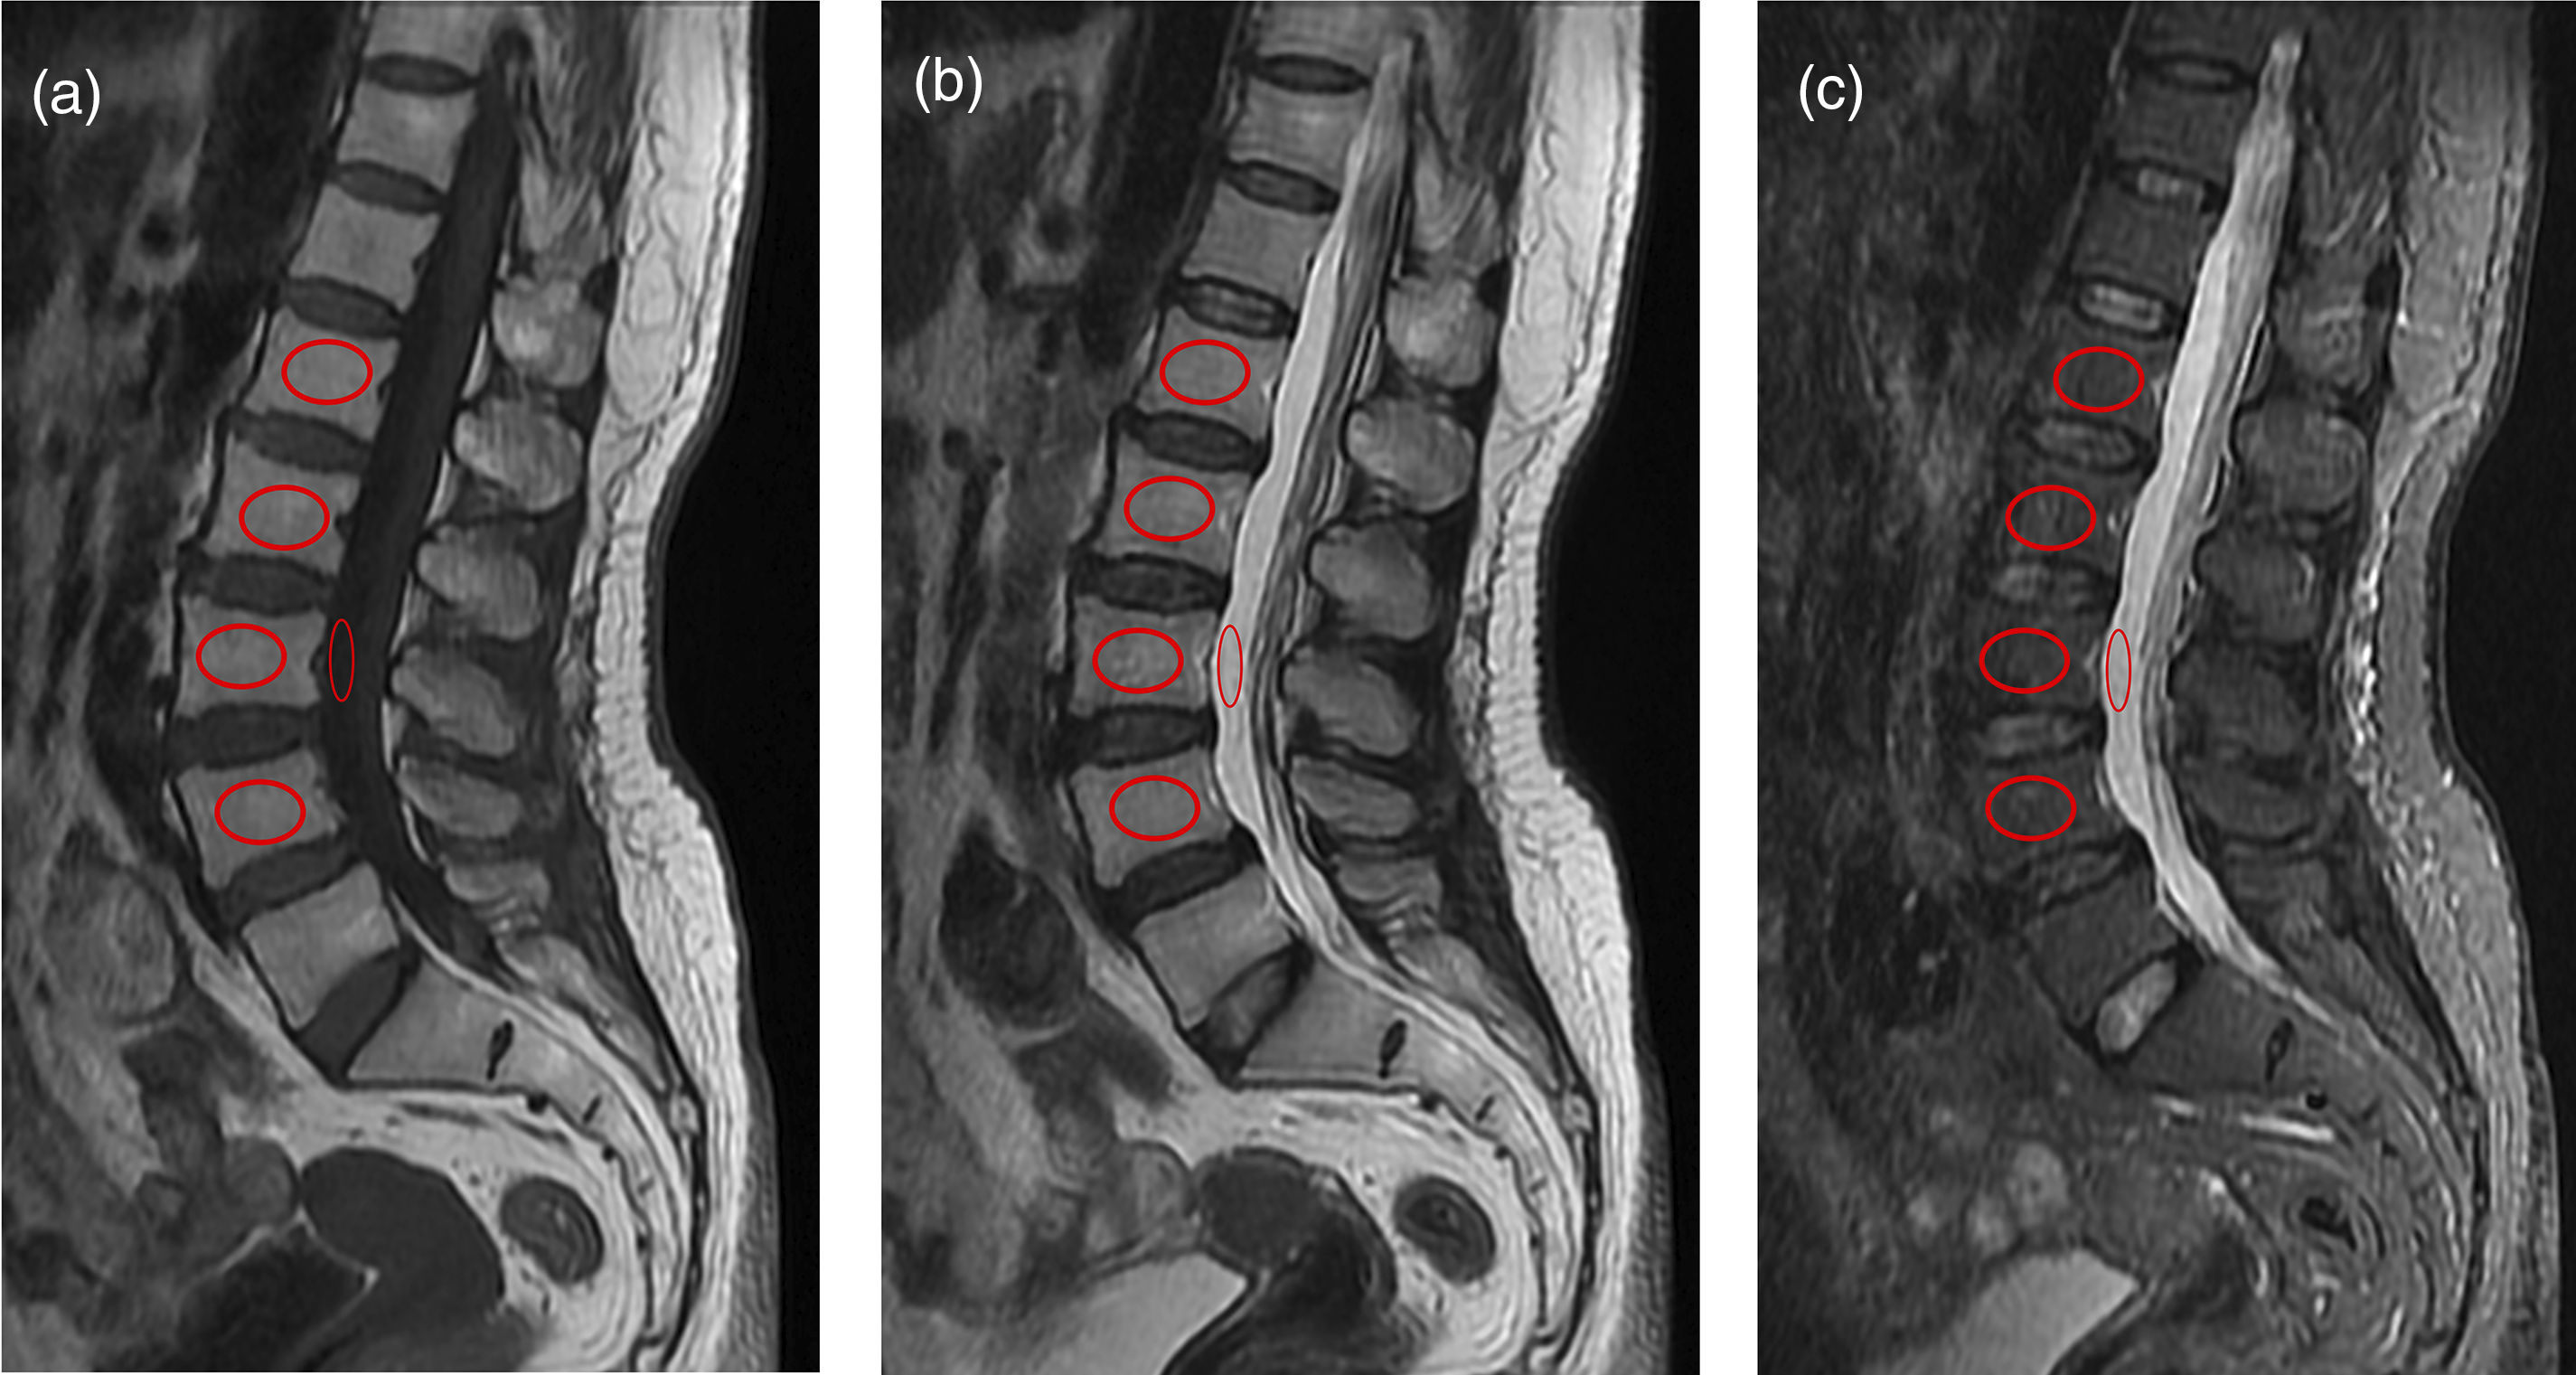
Statistical Analysis
Statistical analyses were conducted using SPSS statistical software, version 26.0 (SPSS, Chicago, IL). Quantitative statistics with normal distribution and homogeneous variance are presented as mean ± standard deviation and analyzed using t-tests. Otherwise, data was presented as median and interquartile range (IQR), test via Mann-Whitney U test. Logistic regression was adopted to identify the risk factors for OVCF. Factors that statistically significant in univariate logistic regression were further analyzed via multivariate logistic regression. ROCs and AUCs were plotted to evaluate the predictive accuracy of VBQ scores. P-values <0.05 indicated statistical significance. Intra- and inter-observer agreement were assessed using Bland-Altman plots from GraphPad Prism 8, with 10% of SI difference considered acceptable.
Results
Variables of Fracture Group and Non-fracture Group.
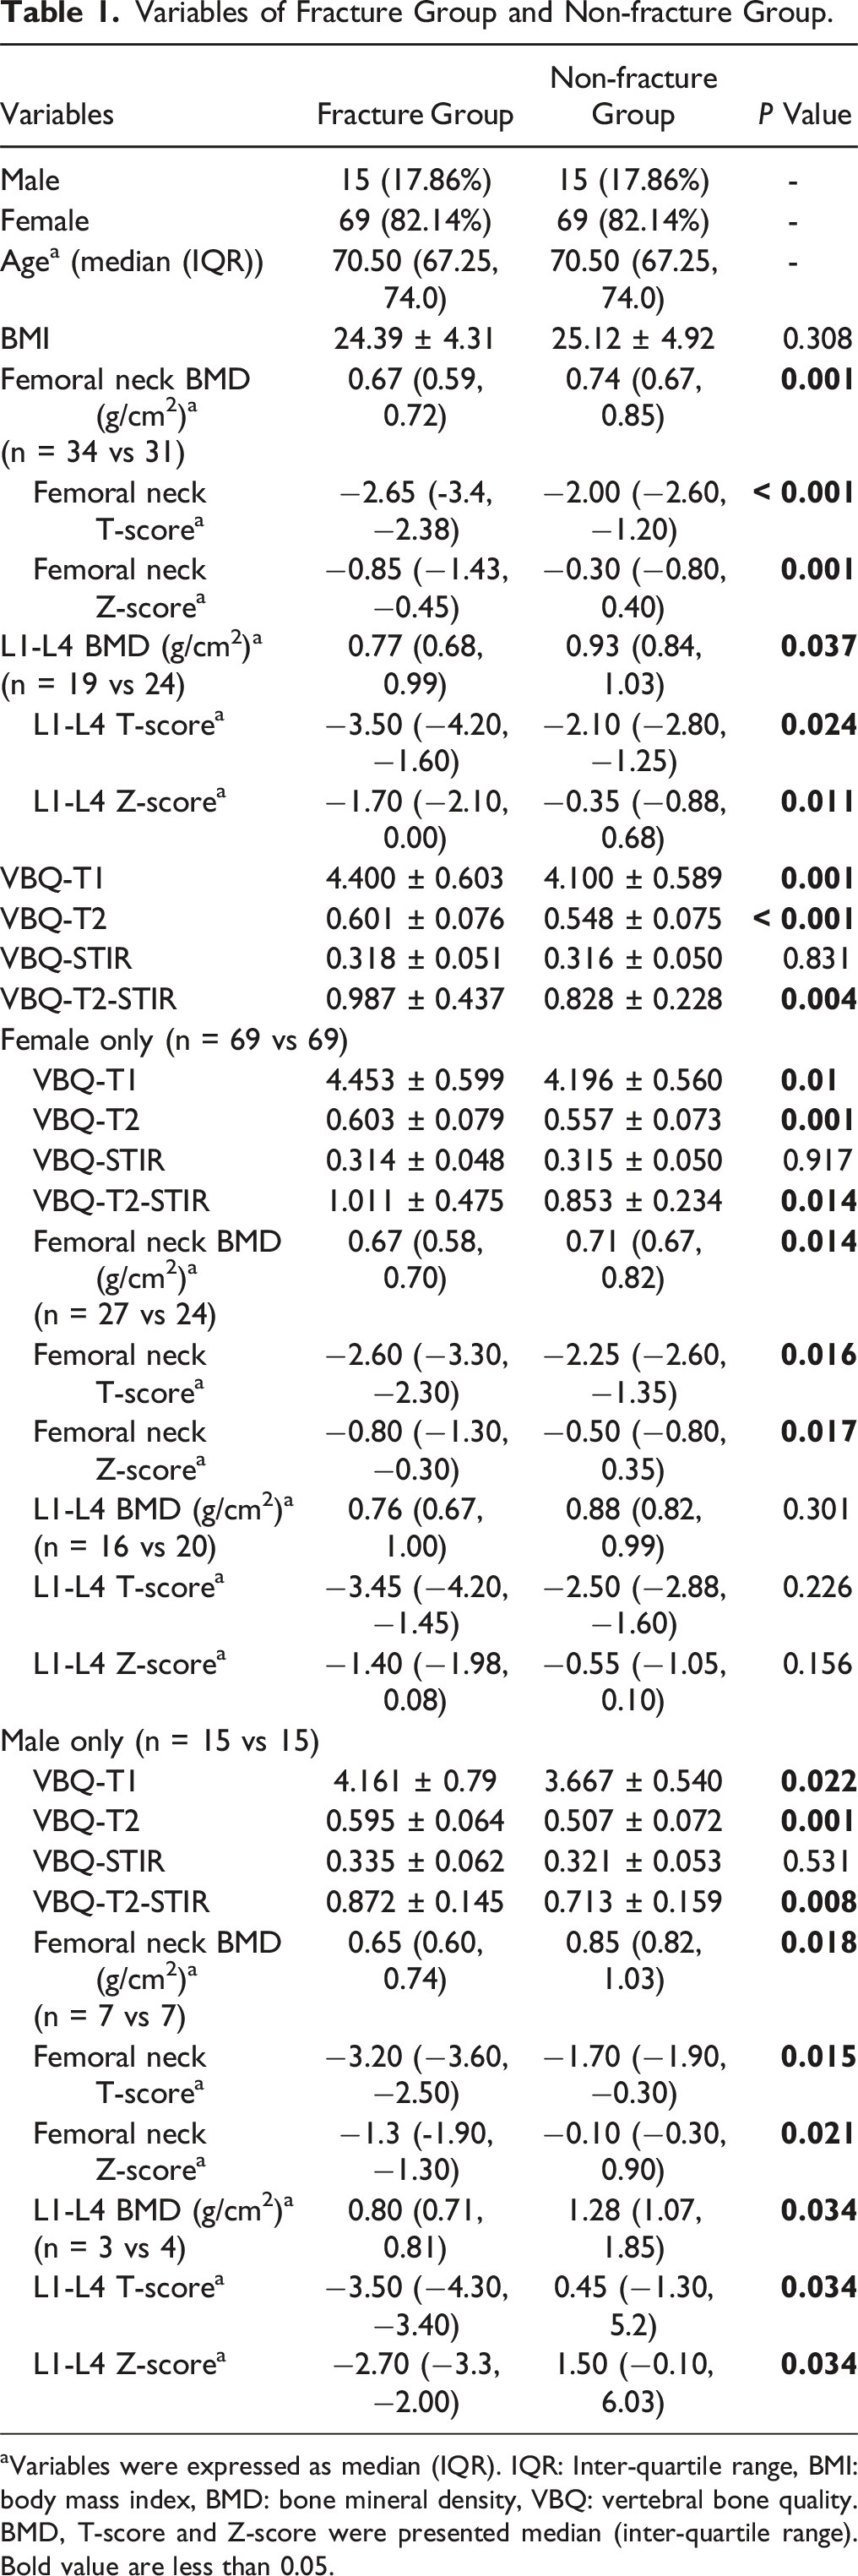
aVariables were expressed as median (IQR). IQR: Inter-quartile range, BMI: body mass index, BMD: bone mineral density, VBQ: vertebral bone quality. BMD, T-score and Z-score were presented median (inter-quartile range). Bold value are less than 0.05.
VBQ Scores
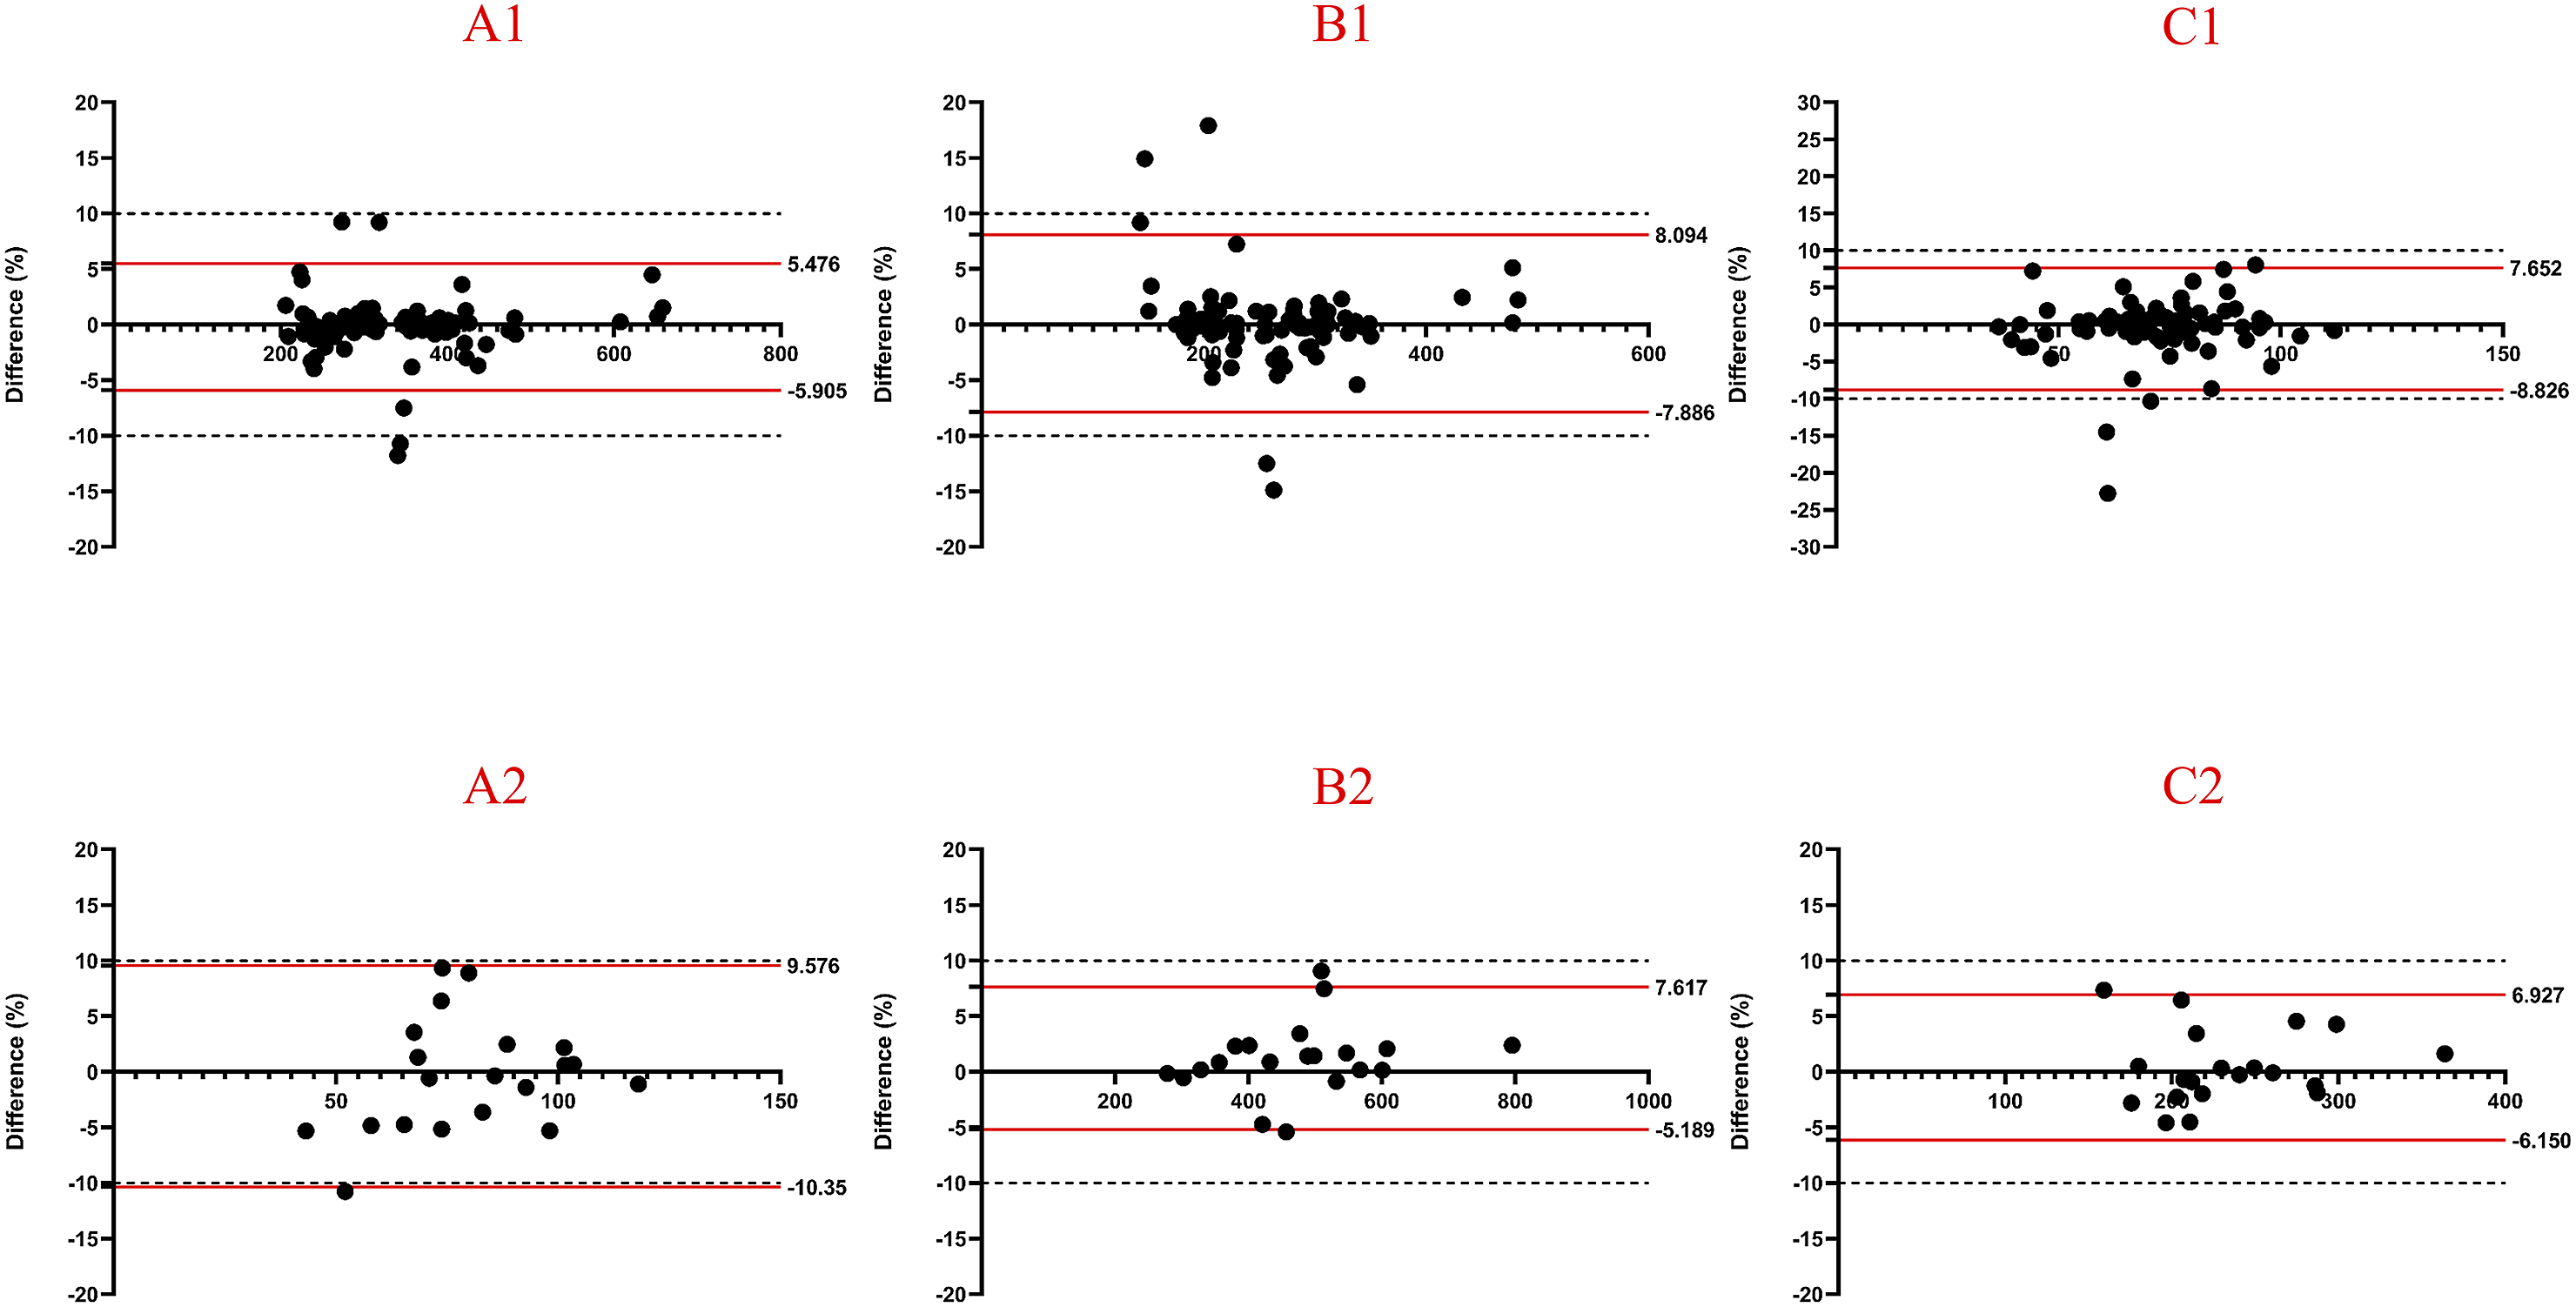
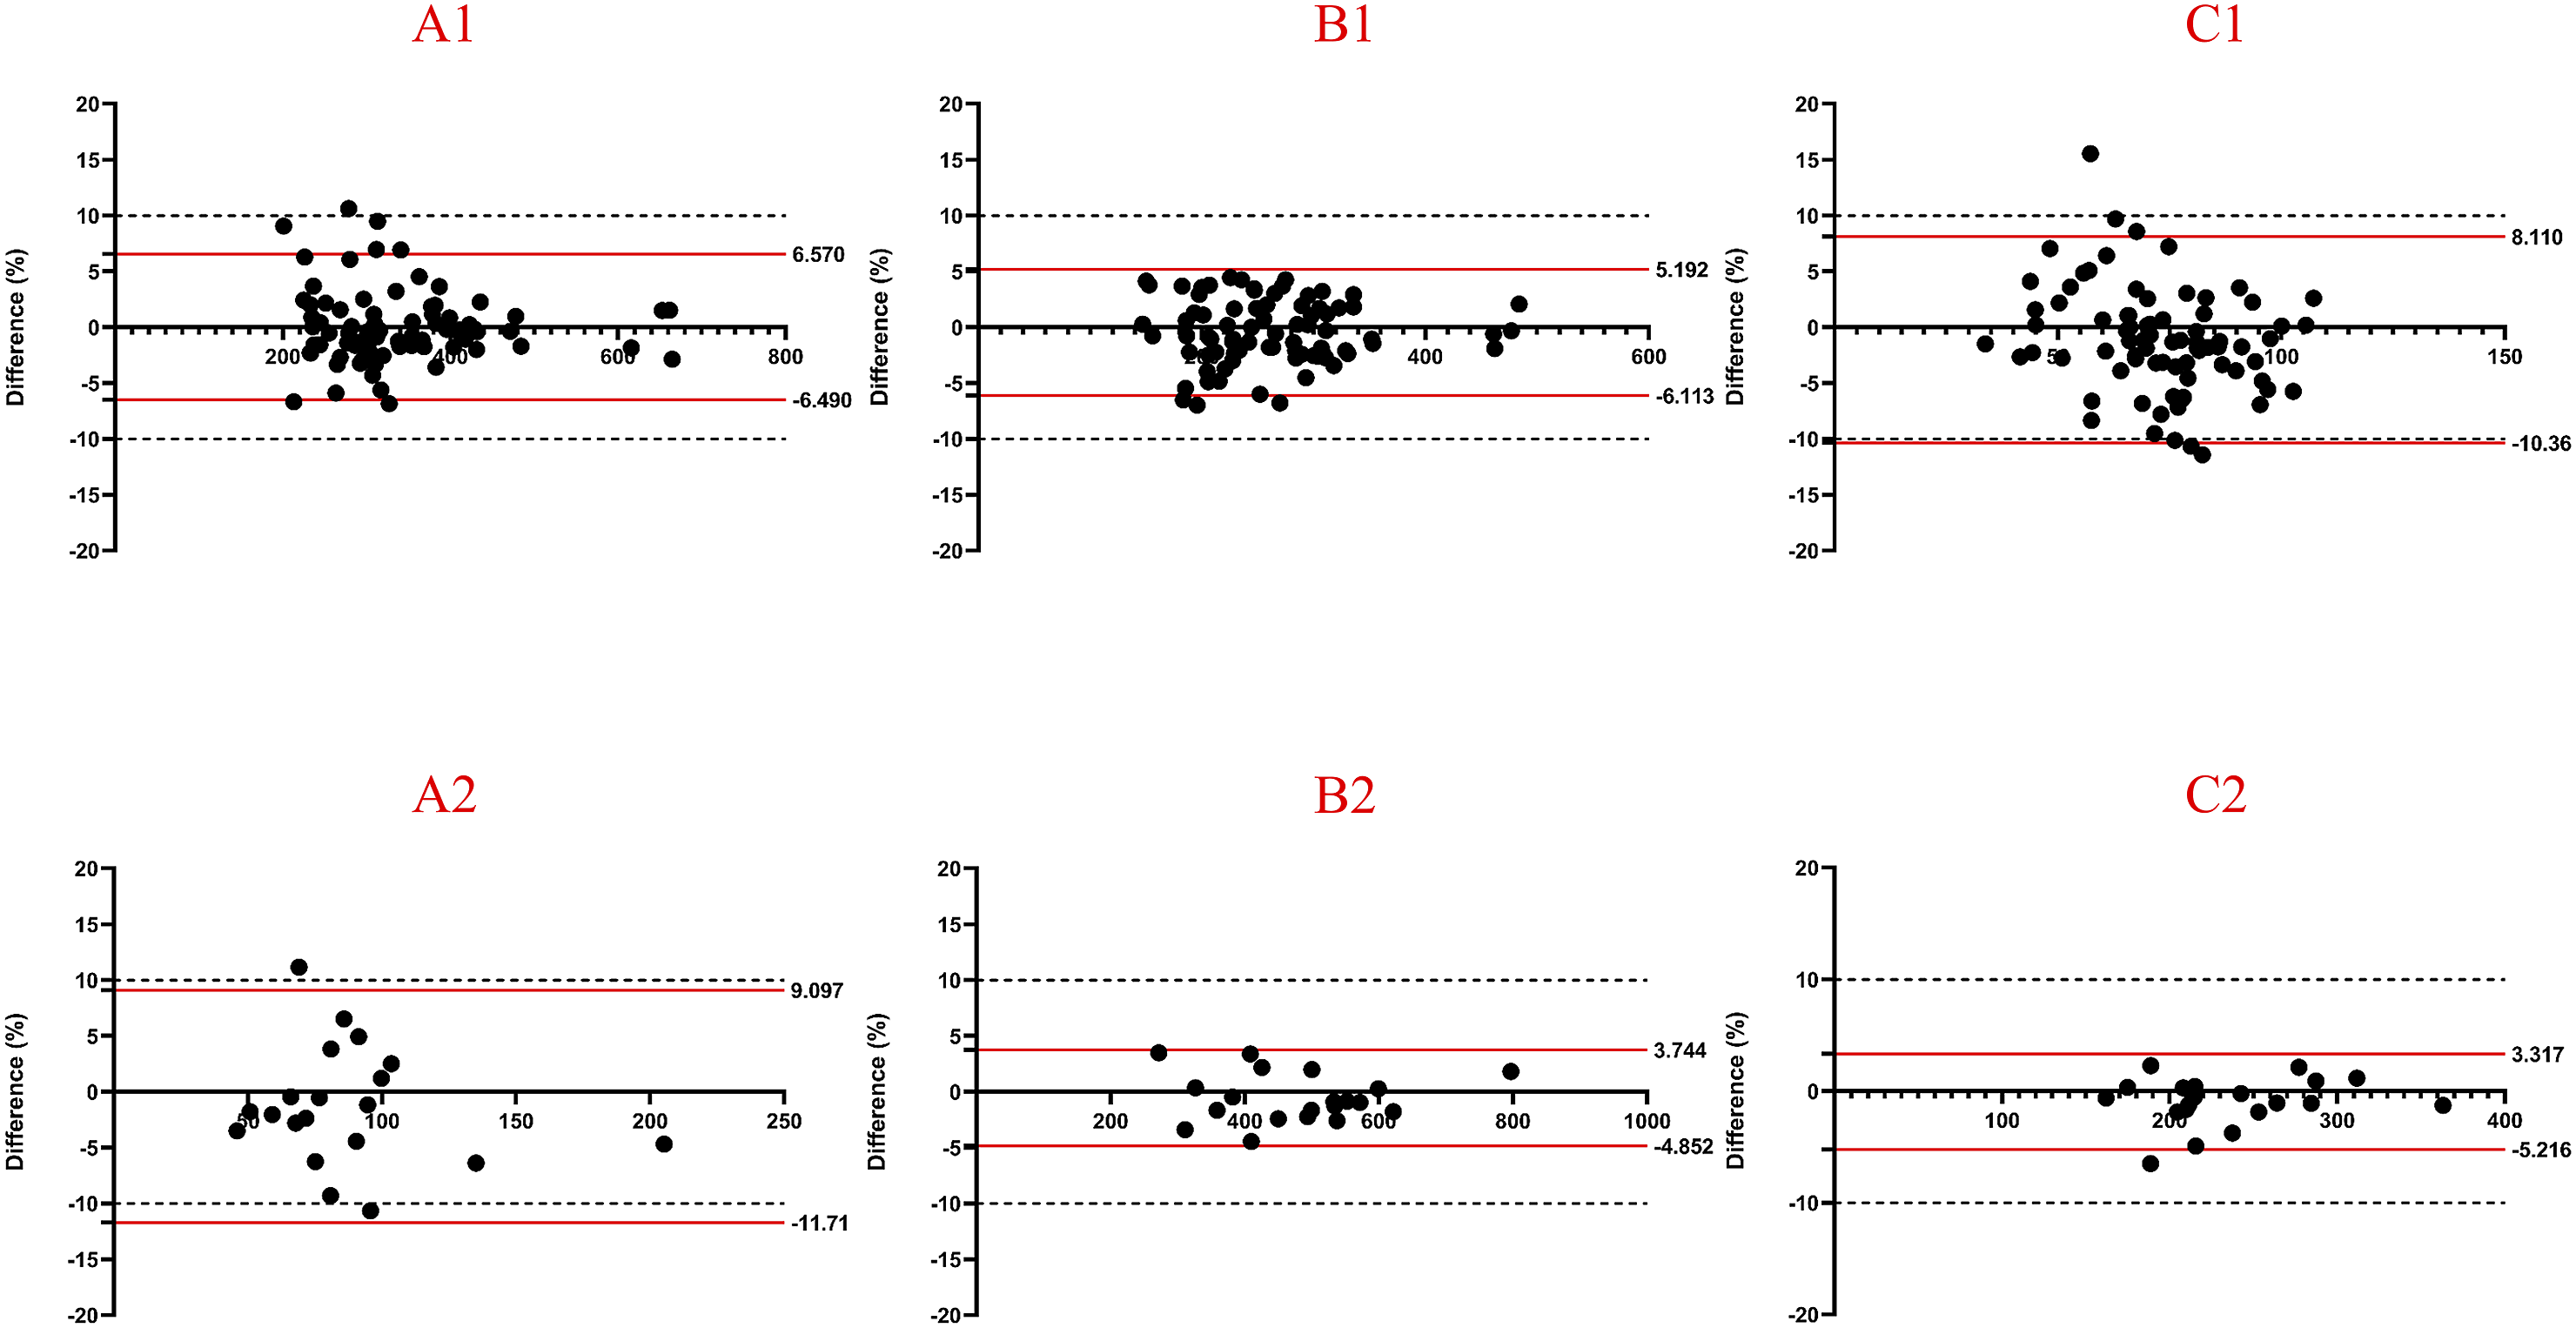
The inter-observer reliability and intra-observer reproducibility for measuring SIs were satisfactory. The 95% limit of agreement for inter-observer reliability ranged from −10.74% to 7.97%. Intra-observer reproducibility ranged from −10.35% to 8.09% for Observer 1 and from −11.71% to 8.11% for Observer 2 (Figure 3). Notably, only the 95% limits of agreement for CSF SIs on T1, T2, and STIR sequences slightly exceeded −10% (Figures 4 and 5). Bland-Altman plot of inter-observer agreement. (A1) depicted agreement of SIs of L1-L4 on T1-weighted sequence with 95% limits of agreement from −6.76% to 6.66%. (A2) depicted agreement of SIs of CSF on T1-weighted sequence with 95% limits of agreement from −10.74% to 8.86%. (B1) depicted agreement of SIs of L1-L4 on T2-weighted sequence with 95% limits of agreement from −7.15% to 7.97%. (B2) depicted agreement of SIs of CSF on T2-weighted sequence with 95% limits of agreement from −3.97% to 4.60%. (C1) depicted agreement of SIs of L1-L4 on STIR-weighted sequence with 95% limits of agreement from −8.67% to 7.68%. (C2) depicted agreement of SIs of CSF on STIR-weighted sequence with 95% limits of agreement from −5.71% to 6.21%. Bland-Altman plot of inter-observer (XM H) agreement. (A1) depicted agreement of SIs of L1-L4 on T1-weighted sequence with 95% limits of agreement from −5.91% to 5.48%. (A2) depicted agreement of SIs of CSF on T1-weighted sequence with 95% limits of agreement from −10.35% to 9.58%. (B1) depicted agreement of SIs of L1-L4 on T2-weighted sequence with 95% limits of agreement from −7.89% to 8.09%. (B2) depicted agreement of SIs of CSF on T2-weighted sequence with 95% limits of agreement from −5.19% to 7.62%. (C1) depicted agreement of SIs of L1-L4 on STIR-weighted sequence with 95% limits of agreement from −8.83% to 7.65%. (C2) depicted agreement of SIs of CSF on STIR-weighted sequence with 95% limits of agreement from −6.15% to 6.93%. Bland-Altman plot of inter-observer (CH C) agreement. (A1) depicted agreement of SIs of L1-L4 on T1-weighted sequence with 95% limits of agreement from −6.49% to 6.57%. (A2) depicted agreement of SIs of CSF on T1-weighted sequence with 95% limits of agreement from −11.71% to 9.10%. (B1) depicted agreement of SIs of L1-L4 on T2-weighted sequence with 95% limits of agreement from −6.11% to 5.19%. (B2) depicted agreement of SIs of CSF on T2-weighted sequence with 95% limits of agreement from −4.85% to 3.74%. (C1) depicted agreement of SIs of L1-L4 on STIR-weighted sequence with 95% limits of agreement from −10.36% to 8.11%. (C2) depicted agreement of SIs of CSF on STIR-weighted sequence with 95% limits of agreement from −5.2% to 3.31%.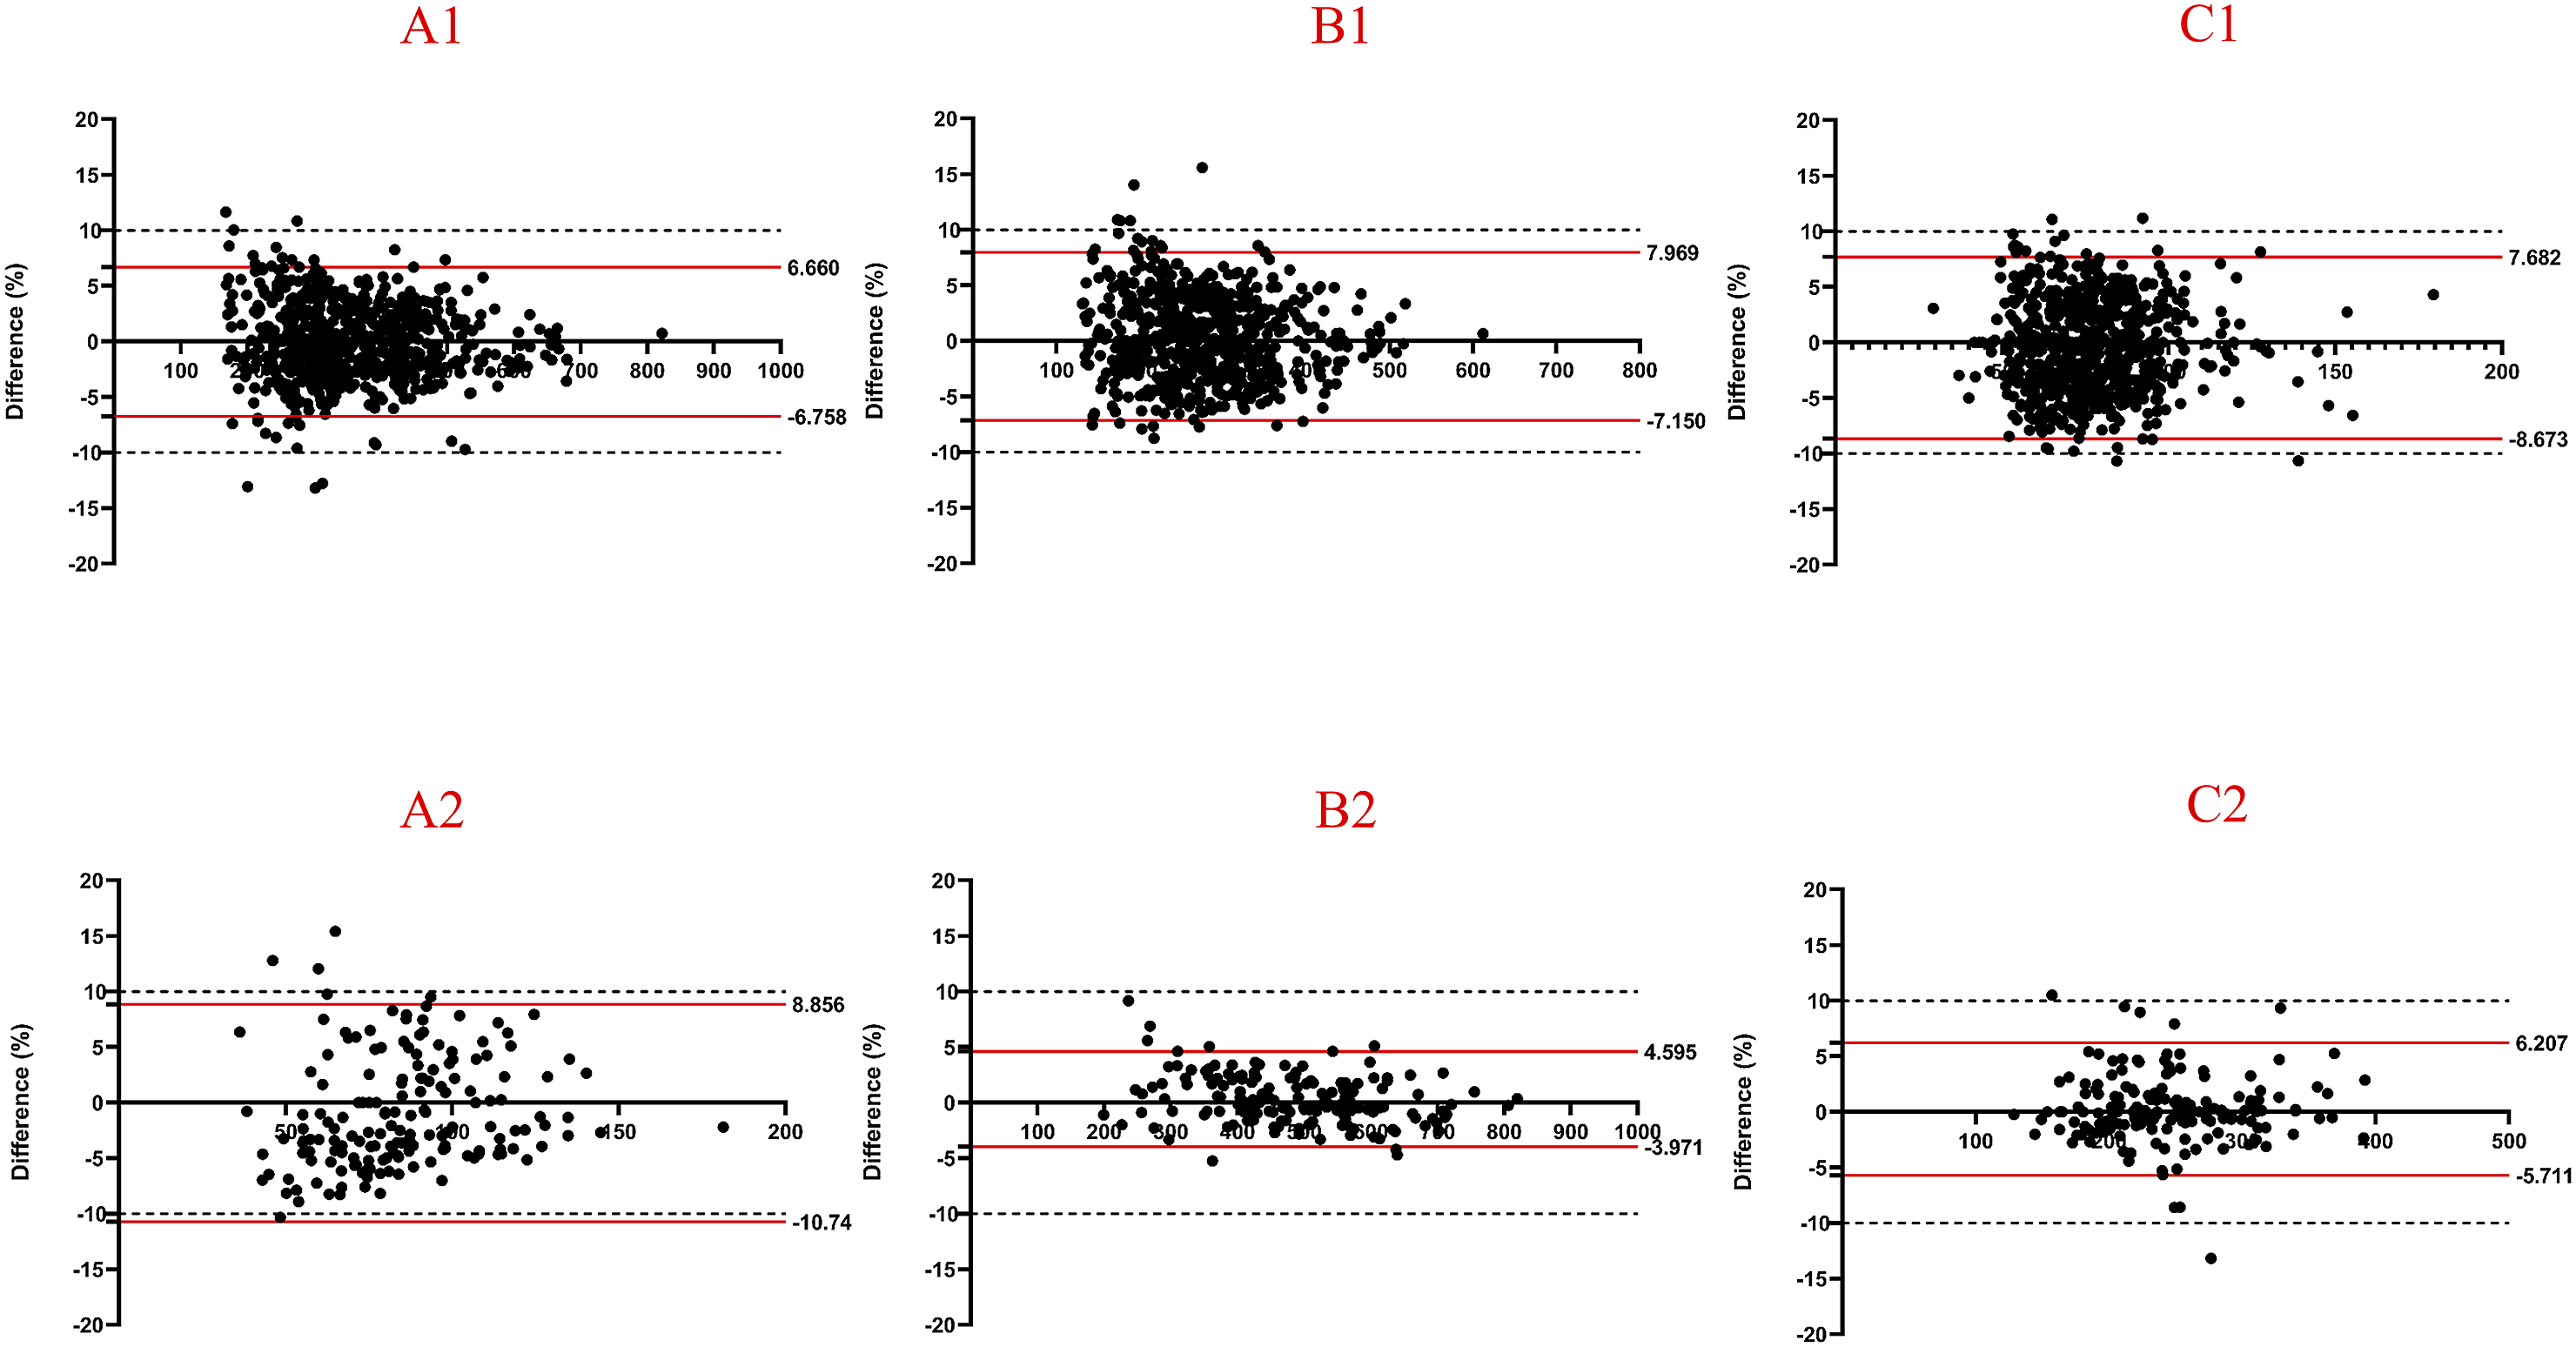
VBQ-T1, VBQ-T2, and VBQ-T2-STIR scores were higher in the fracture group than in the non-fracture group (4.40 vs 4.10, P = 0.001, 0.60 vs 0.55, P < 0.001, 0.99 vs 0.83, P = 0.004). However, VBQ-STIR scores did not differ between the fracture and non-fracture groups (0.318 vs 0.316, P = 0.831). Similar results were obtained in sex-based subgroup analyses (Table 1).
VBQ Score Performance in Predicting OVCF
AUCs of VBQ-T1, VBQ-T2 and VBQ-T2-STIR.
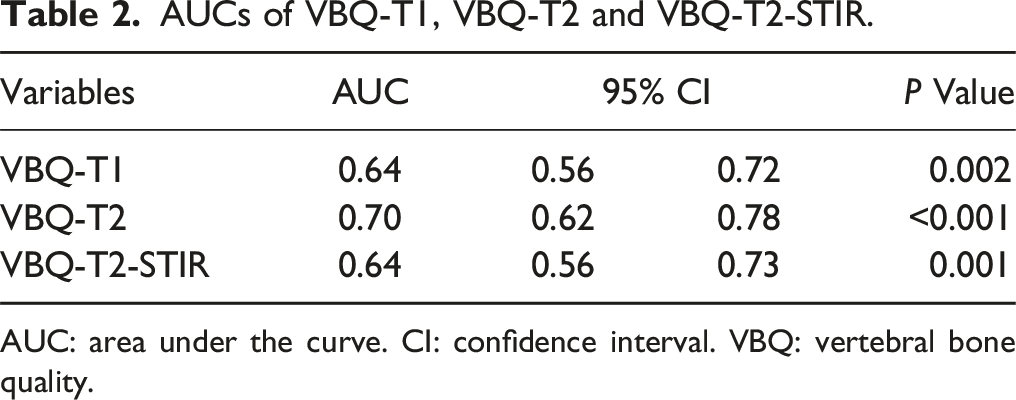
AUC: area under the curve. CI: confidence interval. VBQ: vertebral bone quality.
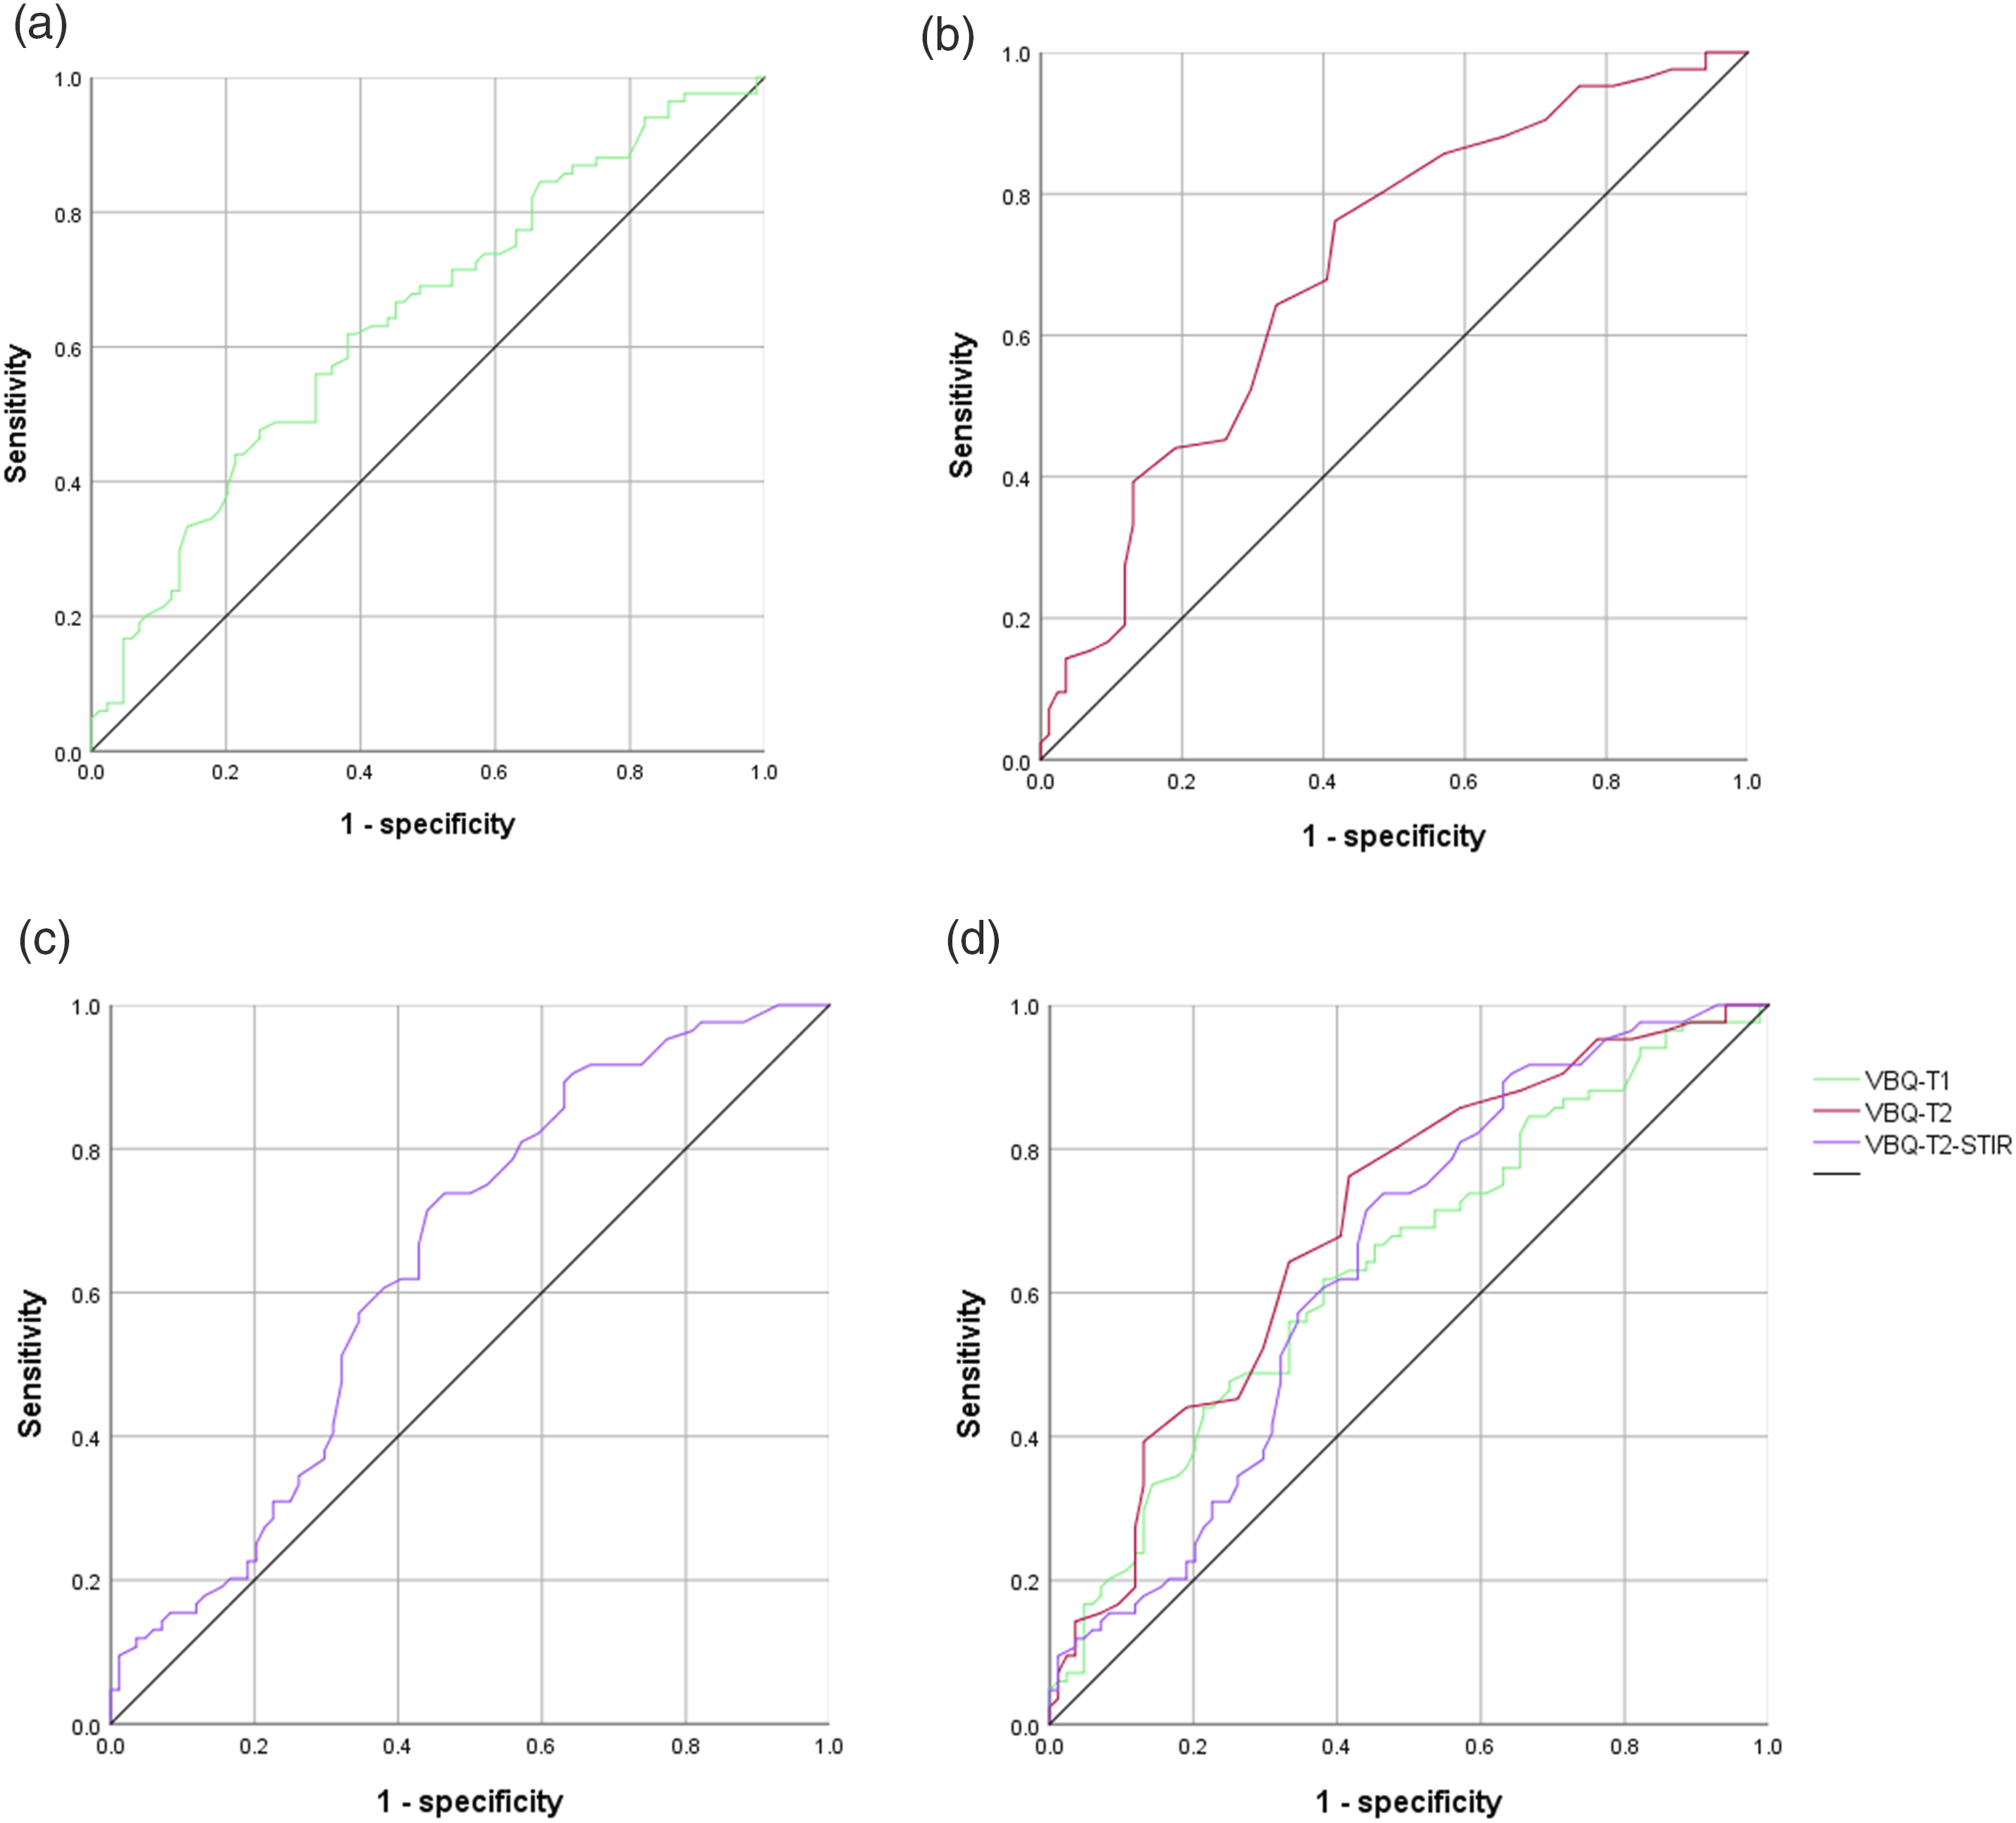
ROC curves of VBQ-T1, VBQ-T2 and VBQ-T2-STIR. (A) represented the ROC curve of VBQ-T1 with AUC = 0.64. (B) represented the ROC curve of VBQ-T2 with AUC = 0.70. (C) represented the ROC curve of VBQ-T2-STIR with AUC = 0.64. (D) represented the ROC curves of VBQ-T1, VBQ-T2 and VBQ-T2-STIR.
Cut-Off Points of VBQ-T1, VBQ-T2 and VBQ-T2-STIR.
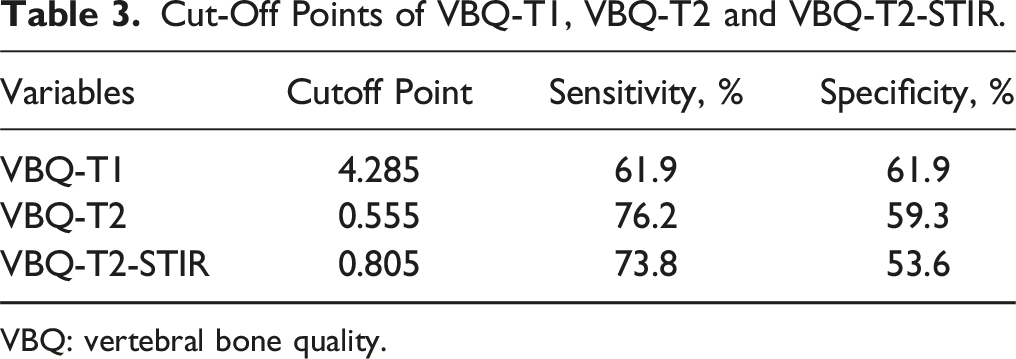
VBQ: vertebral bone quality.
Logistic Regression of VBQ Scores.
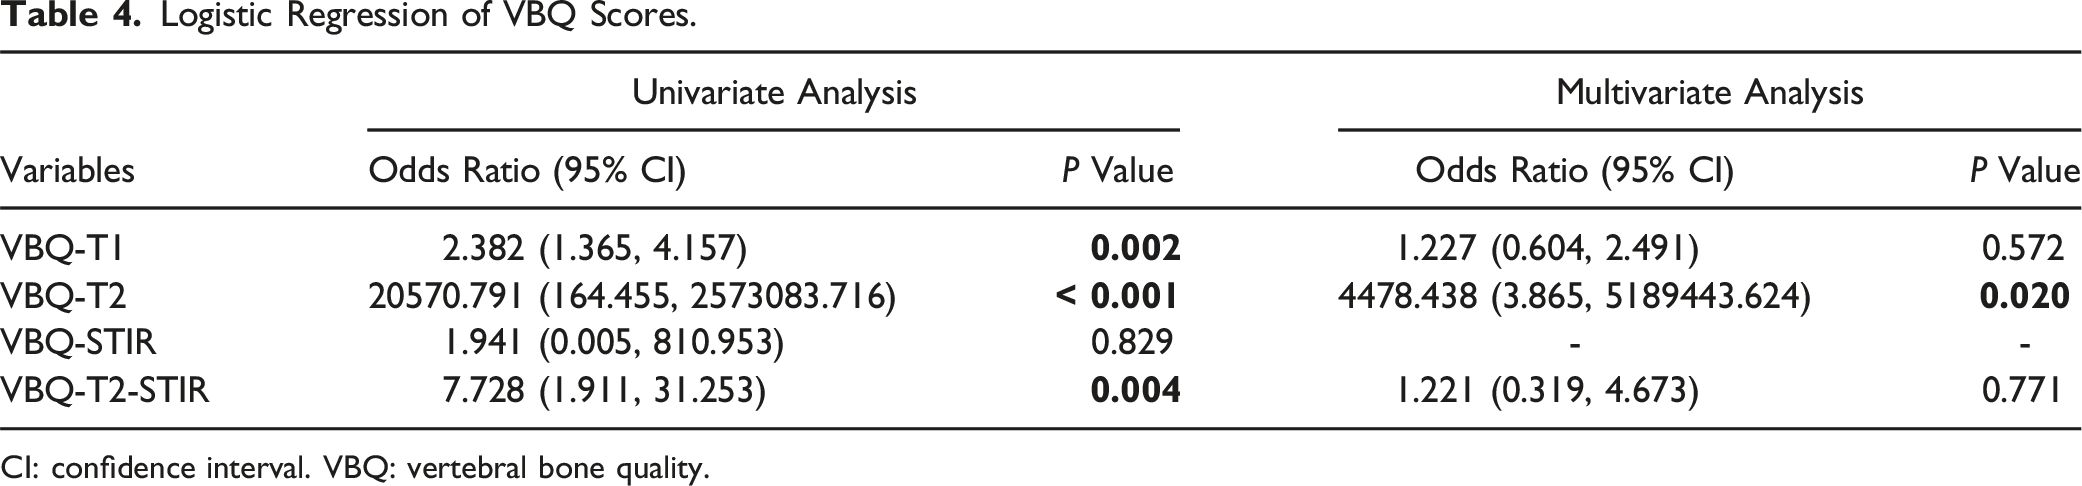
CI: confidence interval. VBQ: vertebral bone quality.
Discussion
In this retrospective study, age- and sex-matched patients in OVCF and non-OVCF groups were examined, reducing the effects of age and sex on bone quality. VBQ-T1, VBQ-T2, and VBQ-T2-STIR scores were associated with OVCF, with VBQ-T2 being an independent risk factor.
Osteoporosis is diagnosed based on a T-score <-2.5. Nonetheless, less than one-third of eligible patients undergo a DEXA scan. 15 Quantitative computed tomography-based vBMD is a feasible alternative approach, though MRI is more frequently conducted for spinal diseases. Michele et al first defined M-scores based on MRI SIs to assess bone density. However, it was inaccessible across different MRI systems. 7 Therefore, Jef et al proposed a novel MRI-based VBQ score predicting fragility fractures. 9 MRI-based VBQ scores have been associated with BMD. OVCF is 1 of the most common types of fragility fractures. However, few studies have focused on the association between VBQ scores and OVCF. Ruoyao et al demonstrated that VBQ-T1 is higher in the OVCF group than in the non-OVCF group (4.0 vs 3.5). Whereas VBQ-T1 score was invalid in patients aged 50-59. We hypothesized that age and sex may affect VBQ scores, particularly because the water fraction of lumbar vertebral bone marrow varies with age and sex. 16 Therefore, we conducted this age- and sex-matched study. VBQ-T1 scores were higher in the OVCF group than in the non-OVCF group (4.4 vs 4.1). Previously, most studies have focused solely on VBQ-T1. In 2024, VBQ-T1, VBQ-T2, and VBQ-STIR scores were calculated to predict new vertebral fractures after vertebral augmentation, with both VBQ-T1 and VBQ-T2 scores evaluating the risk of fracture. 12 Therefore, we investigated whether VBQ-T1, VBQ-T2, and VBQ-STIR scores can predict OVCF. In addition, bone marrow fat infiltration has been associated with low BMD. Thus, we speculated that fat-related SI changes may reflect bone quality, encouraging us to calculate VBQ-T2-STIR. In this study, VBQ-T2 and VBQ-T2-STIR scores were higher in the OVCF group. In contrast, the VBQ-STIR score was similar between the groups, consistent with previous findings. 12 VBQ-T2 displayed the best predictive accuracy, with an AUC of 0.70, emerging as an independent predictor. Lu et al recorded a higher AUC of 0.82 for VBQ-T2 in 96 age- and sex-matched patients. Nonetheless, VBQ-T1 did not display predictive accuracy. 17 The difference in AUC between their study and our study may be attributed to different sex proportions (men, 33.33% vs 17.86%), age distribution (64.69 vs 70.50) and sample size (96 vs 168). In China, the ratio of male to female OVCF patients is about 1:4. 18 The lower male proportion, older age and bigger sample size might result in decreased AUC, compared to study. 17 Notably, Lu et al measured 3 lumbar vertebrae in OVCF patients, in contrast, 4 vertebrae in the non-OVCF patients, which might result higher VBQ scores in the OVCF group than ours (0.83 vs 0.60). Such results might overestimate the AUC of VBQ-T2 in predicting OVCF. However, the VBQ-T2 cut-off value was similar (0.58 vs 0.56). Unlike previous studies, we recommend VBQ-T2, rather than VBQ-T1, as an important predictor of OVCF. Consequently, multimodal deep learning algorithm could segment sagittal and horizontal T2WI to automatically calculate VBQ score and paraspinal muscle parameters, which may promote efficacy of a deep learning predictive model and reinforce its interpretability.19,20
MRI offers information about tissue composition, such as protein, water, fat, and cells. Water and fat substantially affect the appearance of bone marrow on MRI. Fat shows intermediate to high SI on T1- and T2-weighted images. 14 Patients with osteoporosis exhibit increased fat infiltration in the bone marrow,21,22 thus explaining why VBQ-T1, VBQ-T2 and VBQ-T2-STIR scores can predict OVCF. Contrarily, the STIR sequence suppresses fat signals while preserving water signals. Therefore, in this study, no difference in VBQ-STIR scores between the fracture and non-fracture groups indicates that VBQ scores predict OVCF by detecting fat within the vertebral body. T1WI displays SI differences between yellow and red marrow, with the SI of yellow marrow comparable to that of subcutaneous fat. In contrast, the SI of red marrow is lower than that of subcutaneous fat. 23 Therefore, the T1-weighted SI depends on the proportion of yellow and red marrow. On T2WI, fatty marrow displays SI comparable to or moderately lower than that of subcutaneous fat. Moreover, it is challenging to distinguish between yellow and red marrow SI on T2-weighted images because of limited contrast. 24 Therefore, on T2WI, the SI of vertebral marrow reflects fat content more accurately than on T1WI; however, it does not reflect the fat proportion. Moreover, measuring the CSF SI is more convenient in T2-weighted images than T1-weighted images, because of its distinct higher signal than spinal cord.
This study has several limitations. First, its retrospective design and small sample size limit the generalization of our results. The present sample size was proved to be satisfactory via an online calculator (https://www.trialstats.com/statbox/index.htm/samplesize/estimation?sid=4). Under type 1 error rate (α) was 0.05 and power (1-β) was 0.8, the sample size from VBQ-T1 was 63 vs 63; and the sample size from VBQ-T2 was 33 vs 33. Both of the calculated numbers are smaller than 84. Second, whereas age and sex affect OVCF, the small sample size prevented a subgroup analysis by age. Further studies should assess VBQ scores in large age- and sex-matched cohorts. Third, the correlation between VBQ scores and BMD was not evaluated because of the low DEXA or QCT acquisition rate. For OVCF patients, 31 patients were absent of DEXA. Some of them were diagnosed osteoporosis long before, and some suffered from pain failing to undergo DEXA. For non-OVCF patients, 29 patients were absent of DEXA. Most of them underwent PEID surgery without internal instrument, where DEXA is unnecessary. Finally, other factors associated with OVCF were not considered, which may have contributed to the moderate AUC. Age, sex and BMI are known risk factors for OVCF.25,26 Moreover, paravertebral muscle parameters on lumbar cross-sectional T2WI MRI were proved to be associated with OVCF. 19 A comprehensive model comprising the VBQ-T2 score and above mentioned OVCF-associated factors may generate a higher AUC.
Conclusion
In this age- and sex-matched study, MRI-based VBQ scores predicted OVCF. The VBQ-T2 score was identified as an independent predictor and should be considered for evaluating osteoporotic fractures.
Footnotes
Author Contributions
All authors listed meet the authorship criteria according to the latest guidelines of the International Committee of Medical Journal Editors, and all authors are in agreement with the manuscript.
Declaration of Conflicting Interests
The author(s) declared no potential conflicts of interest with respect to the research, authorship, and/or publication of this article.
Funding
The author(s) disclosed receipt of the following financial support for the research, authorship, and/or publication of this article: The study was supported by grants from Chongqing Technology Innovation and Application Development Project: CSTB2022TIAD-KPX0192.
IRB approval
IRB approval was obtained (2024-255-01).
Data Availability Statement
All data in the study is accessible from