
Abstract
Study Design
Retrospective study.
Objective
This study aims to identify how CT HU values vary in degenerative lumbar scoliosis (DLS) patients with different scoliotic apexes and in those with different degree of scoliosis.
Methods
We included 222 DLS patients and 140 lumbar spinal stenosis (LSS) patients, dividing the DLS patients into 2 groups based on scoliotic apex location. Patients were further categorized by T scores into osteoporotic and non-osteoporotic groups, and by Cobb angle into mild (<20°) and severe (>20°) scoliosis. We analyzed CT value distribution in these groups and compared the area under the curve (AUC) for predicting osteoporosis based on HU values from different vertebrae.
Results
CT HU values for L1 and L2 were significantly lower in the DLS group compared to LSS group (P < 0.05). The lowest HU values in patients with a scoliotic apex at L2 or L2-3 were observed at the scoliotic apex region, while those with the scoliotic apex at L3, L3-4, and L4 had the lowest values at L3. This pattern was more pronounced in patients with a Cobb angle >20°. In the mild scoliosis group, the lowest CT value was found at L3 when the scoliotic apex was between L2 and L4. Additionally, L4 CT HU thresholds were better at distinguishing osteoporosis than other levels (P < 0.05), swhen the scoliotic apex was located at L2 or L2-3.
Conclusions
CT HU values in DLS patients, particularly with a Cobb angle >20°, decrease at the scoliotic apex. Caution is required when using HU values from L1, L2, and L3 to assess osteoporosis in patients with a scoliotic apex at L2 and L2-3.
Keywords
Introduction
As the prevalence of osteoporosis rises due to an aging population,1-3 it has emerged as a significant social concern. 4 Concurrently, osteoporosis is recognized as a prevalent cause of degenerative lumbar scoliosis (DLS).5,6 Among DLS patients, those with concomitant osteoporosis are at an elevated risk of complications following lumbar fusion surgery, including fixation failure, nonunion, and adjacent segment disease. 7 Consequently, preoperative osteoporosis screening in DLS patients is essential for optimal surgical planning.
Numerous studies advocate for the use of Hounsfield units (HU) from computed tomography (CT) scans as an adjunctive method for evaluating bone density.8-10 HU measurements can mitigate challenges associated with vertebral degeneration and cortical bone evaluation in three-dimensional CT imaging. Surgeons can manually define regions of interest (ROI) to assess HU values in trabecular bone. Assessment of trabecular bone is more critical than that of cortical bone for vertebral load-bearing. 9 Therefore, CT HU values may serve as an effective tool for evaluating vertebral bone volume in DLS patients.
Nevertheless, research concerning CT HU thresholds for osteoporosis primarily targets patients with typical degenerative lumbar stenosis. 10 The bone characteristics in DLS patients may vary due to biomechanical11-13 and kinematic changes,14,15 potentially leading to abnormal ossification and decreased bone volume at the scoliotic apex and terminal vertebrae. Thus, evaluating HU values for osteoporosis in DLS patients should be customized according to the scoliotic apex and the degree of scoliosis, as generalized thresholds such as L1 CT ≤110 HU, L2 CT ≤100 HU, L3 CT ≤85 HU, or L4 CT ≤80 HU may be less applicable 10
Thus, the primary objective of our study is to delineate the variation in CT HU characteristics among DLS patients with different scoliotic apex locations and degrees of scoliosis. Furthermore, we aim to utilize these characteristics to aid in the differentiation of osteoporosis in DLS patients.
Methods
This was a single-center retrospective cohort study. The study adhered to the Declaration of Helsinki (revised in 2013). The Research Ethics Committee of Peking University Third Hospital approved the study (No. M2020291), and the requirement for individual consent was waived for this retrospective analysis. Between January 2015 and December 2022, DLS patients were retrospectively recruited from our hospital. The inclusion criteria were: (1) age of 45 years or older; (2) diagnosis of DLS based on physical examination and full-spine X-rays (Cobb angle ≥10°); (3) scoliotic apex located at L2, L2-3, L3, L3-4, or L4; (4) lumbar CT and DXA scans performed at our hospital within 1 month prior to surgery, CT scans were all from our hospital. Exclusion criteria included: (1) history of spinal surgery; (2) presence of bone tumors, ankylosing spondylitis, or diffuse idiopathic skeletal hyperostosis. Additionally, we included 140 patients with typical lumbar stenosis, who were categorized as the lumbar spinal stenosis (LSS) group. Among patients with DLS, those with a scoliotic apex at L2 and L2-3 were classified into the upper lumbar scoliosis group, whereas those with a scoliotic apex at L3, L3-4, and L4 were categorized into the lower lumbar scoliosis group. Based on the Cobb angle, patients were categorized into mild scoliosis (<20°) and severe scoliosis (>20°).
Bone Density Evaluation
Dual-energy X-ray absorptiometry (DXA, Discover A densitometer, Hologic Inc., Bedford, MA, USA) was utilized to assess the lumbar spine (L1–L4) and both hips of each patient. T-scores were obtained using the NHANES III database provided by the manufacturer. Osteoporosis in each lumbar vertebrae was diagnosed according to its T-score. Osteoporosis was diagnosed following WHO criteria 16 : osteoporosis (T ≤ −2.5), osteopenia (−2.5 < T < −1) and normal bone mineral density (BMD) (T ≥ −1).
The Picture Archiving and Communication System (PACS) was employed to compute CT HU values. Lumbar CT scans were conducted using a CT scanner (Definition, Siemens). The type of CT window did not affect the HU values. CT HU values were measured by positioning an oval region of interest (ROI) over axial images of the vertebral mid-body from L1 to L5 (Figure 1). The ROI was placed to encompass as much trabecular bone as possible while excluding cortical bone and heterogeneous areas, such as the posterior venous plexus, bone islands, and compressed bone. The average HU value calculated by PACS was used to represent the bone density of the vertebral trabecular bone. According to previous study,
10
the CT HU values corresponding to a T-score of −2.5 were adjusted to 110, 100, 85, and 80 for L1, L2, L3, and L4, respectively. We selected the thresholds in receiver operating characteristic (ROC) curve. ROC analysis was performed to establish the area under the curves (AUCs) across the thresholds reported in previous studies for L1, L2, L3, and L4 to distinguish osteoporosis. The Methods of Measuring CT HU Values of Vertebral Body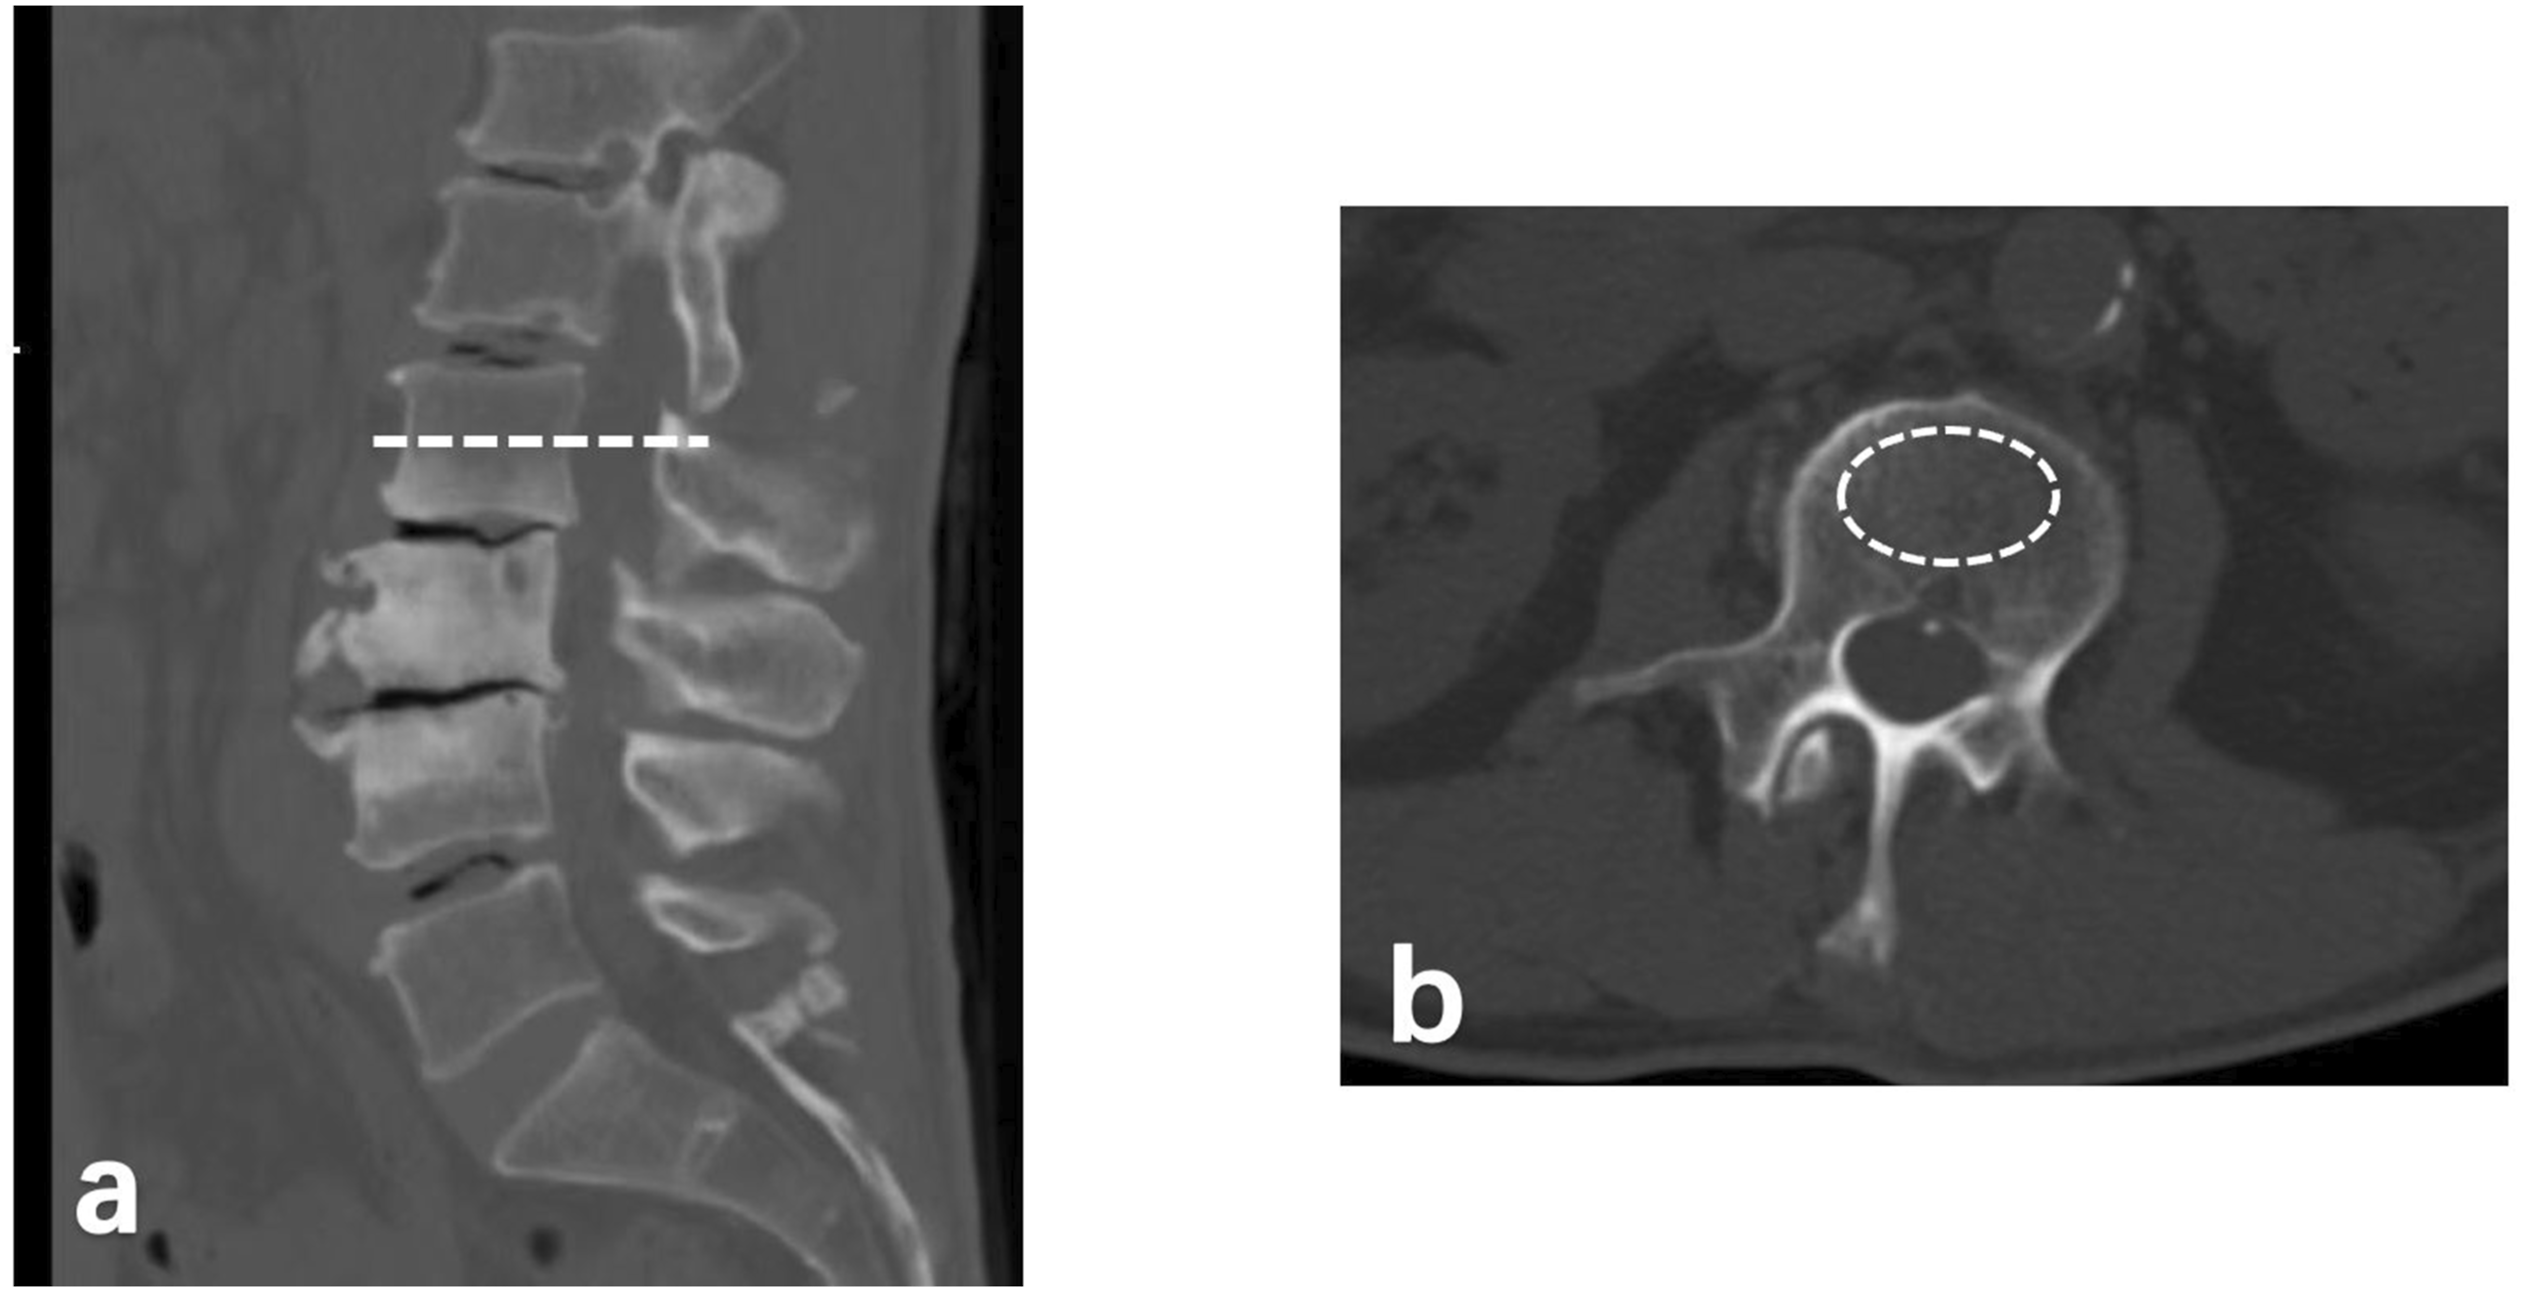
Statistical Analysis
Statistical analysis was conducted using SPSS version 23 (SPSS, USA). T The independent samples Student’s t-test was applied to continuous variables. Chi-squared test and One-Way ANOVA was used for categorical data. ROC curve analysis was employed to assess the utility of CT HU values in distinguishing osteoporosis. Comparisons of ROCs were conducted using MedCalc Statistical Software version 15.6.1 (MedCalc Software bvba, Ostend, Belgium; https://www.medcalc.org; 2015).
Results
Demographic Characteristics in DLS and LSS Group
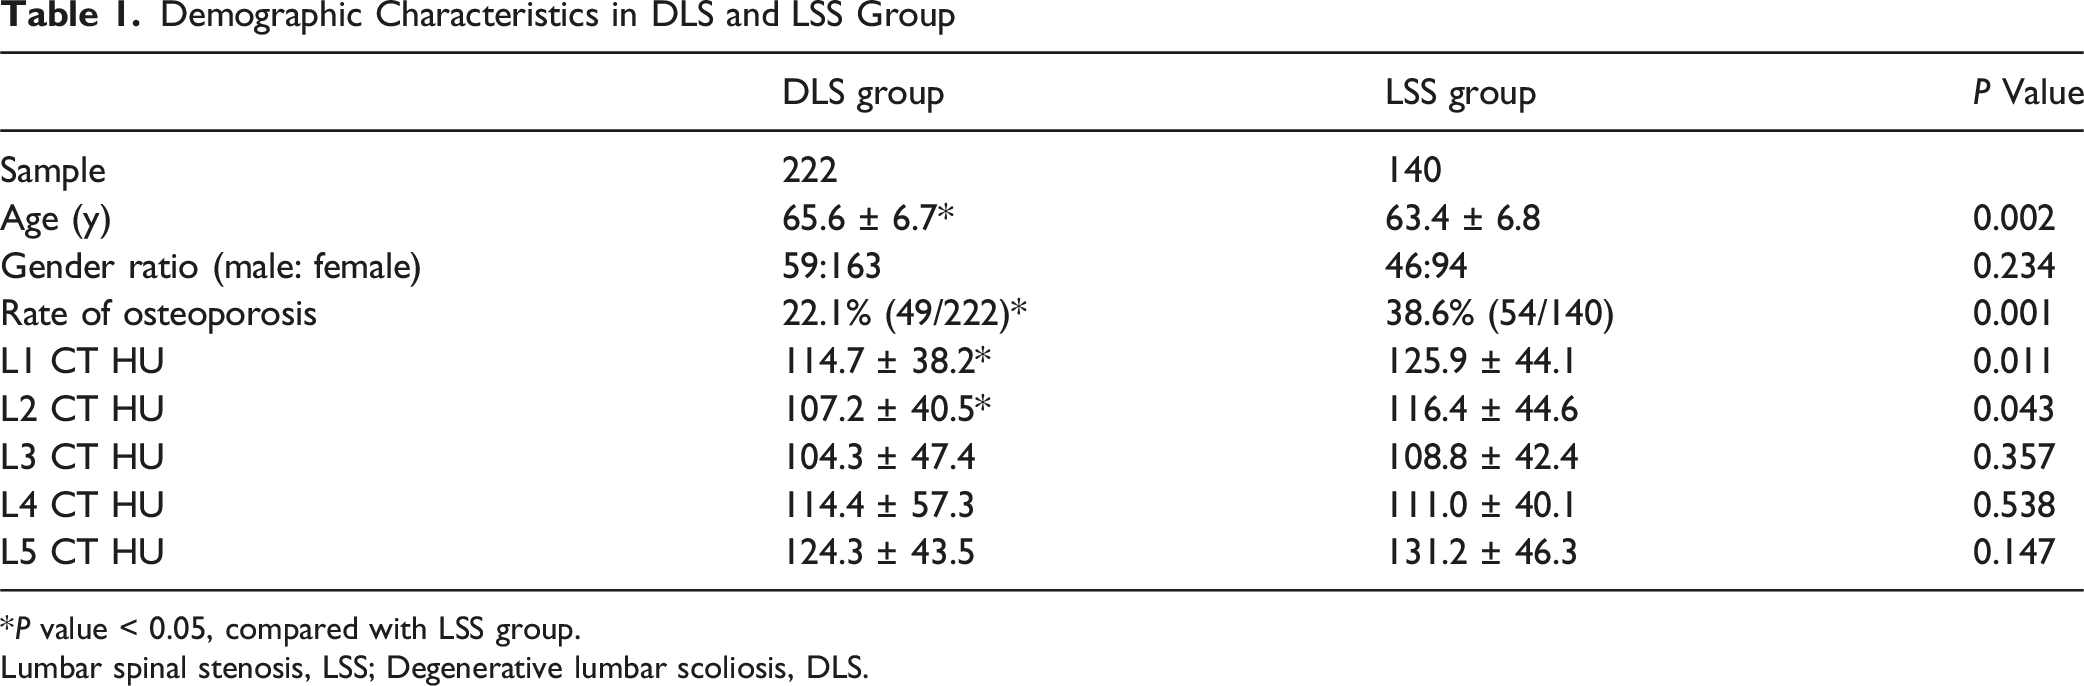
*P value < 0.05, compared with LSS group.
Lumbar spinal stenosis, LSS; Degenerative lumbar scoliosis, DLS.
Distribution Characteristics of CT Values in DLS and LSS Patients
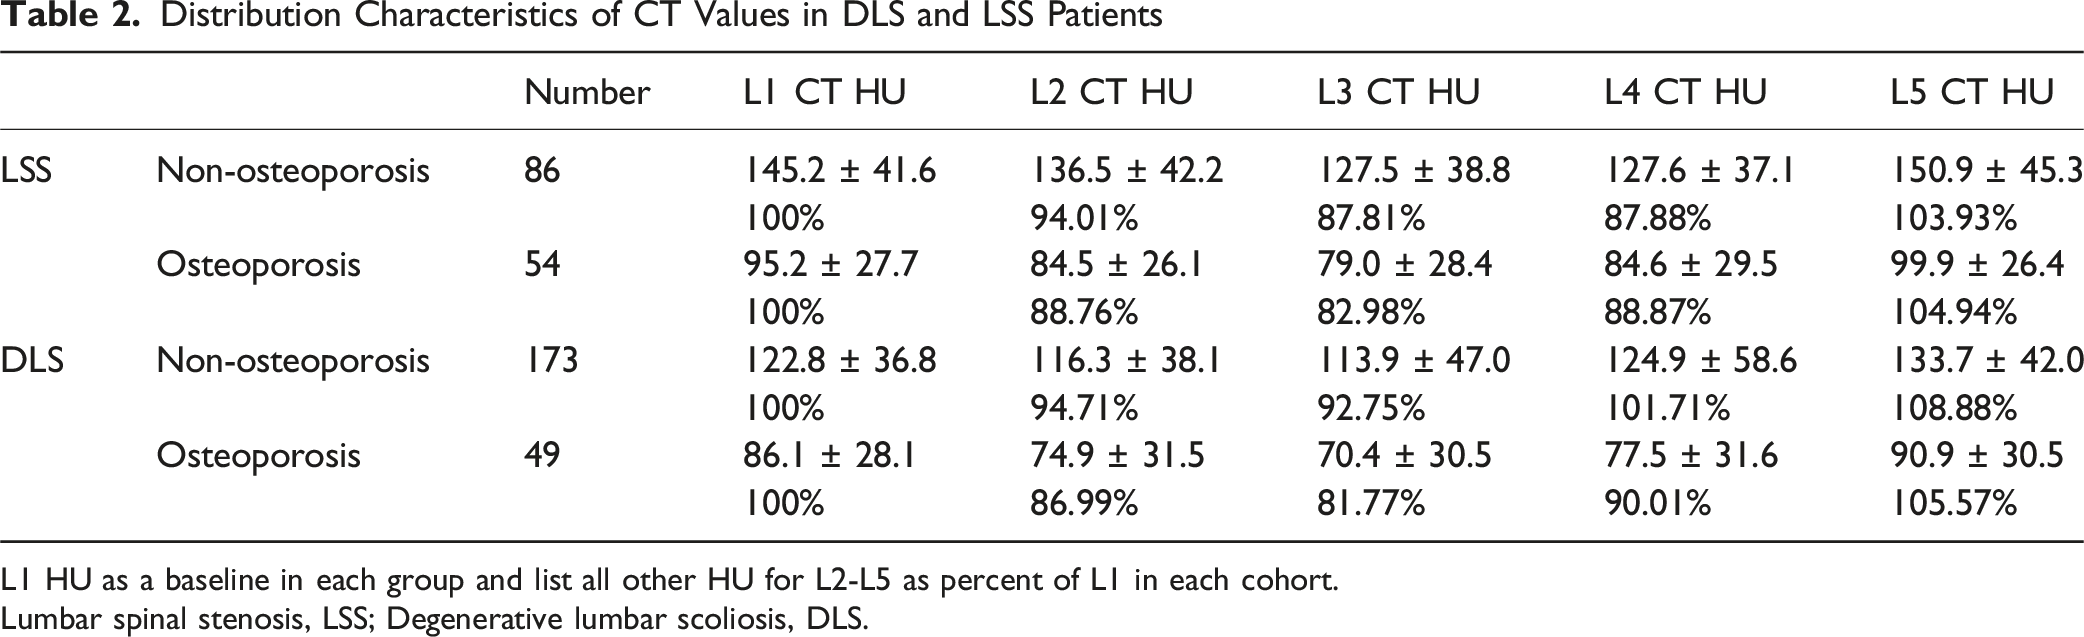
L1 HU as a baseline in each group and list all other HU for L2-L5 as percent of L1 in each cohort.
Lumbar spinal stenosis, LSS; Degenerative lumbar scoliosis, DLS.
Distribution Characteristics of CT Values for L1-L5 in DLS Patients With Different Scoliotic Apex Location
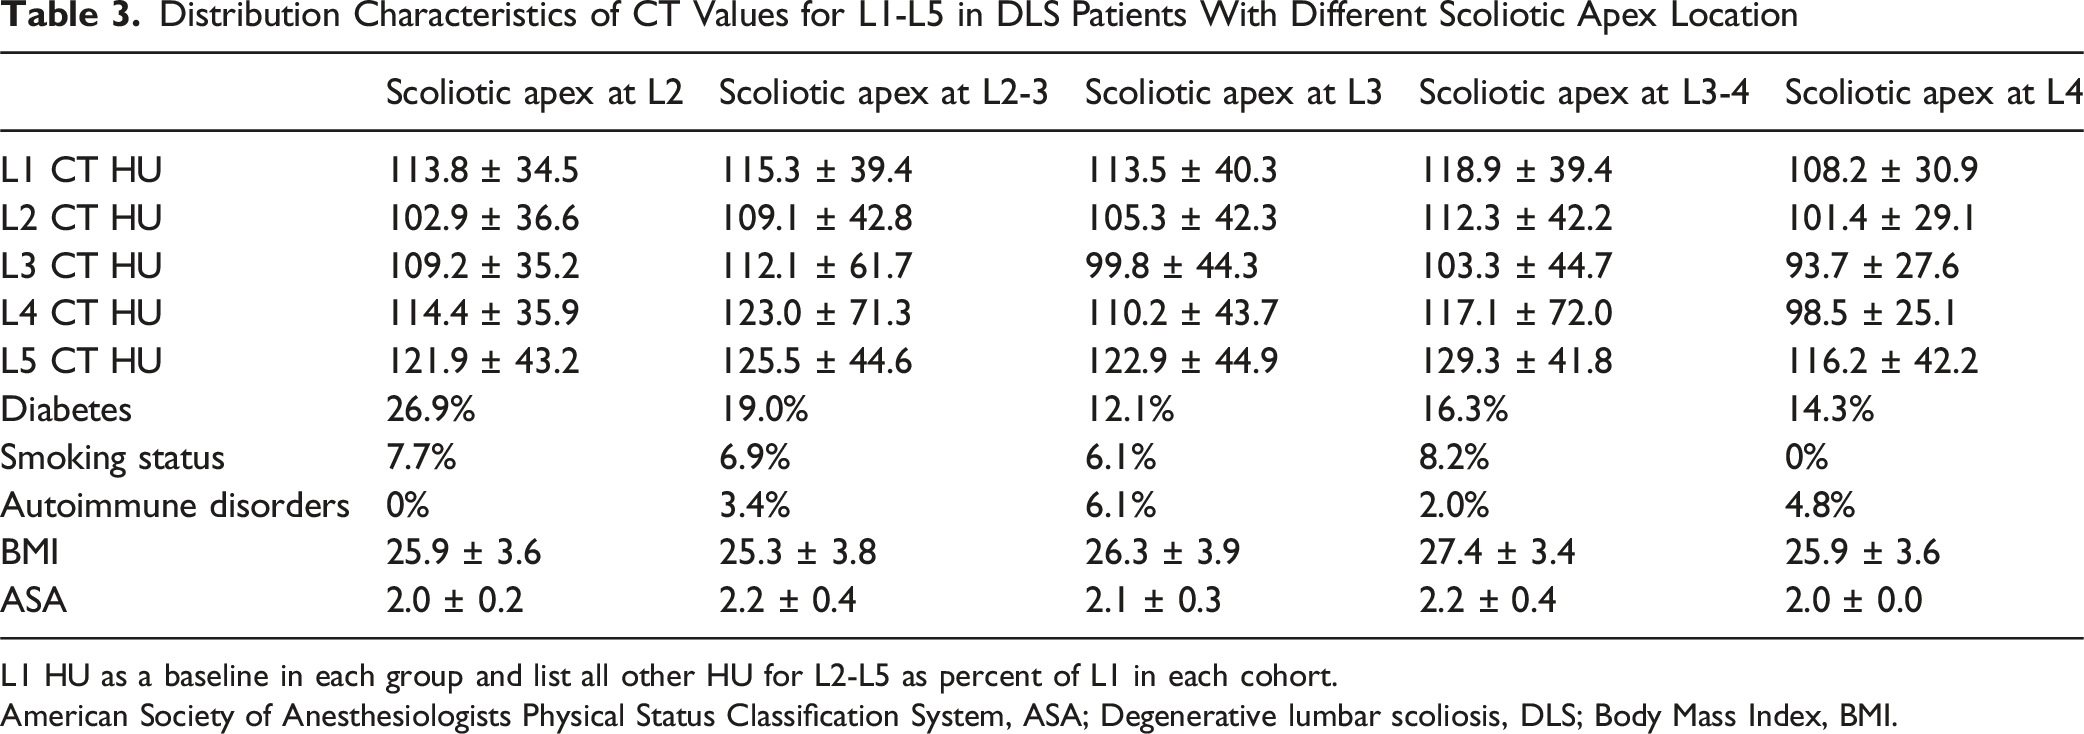
L1 HU as a baseline in each group and list all other HU for L2-L5 as percent of L1 in each cohort.
American Society of Anesthesiologists Physical Status Classification System, ASA; Degenerative lumbar scoliosis, DLS; Body Mass Index, BMI.
The Distribution of CT Values for Different Scoliosis Cobb Angles in DLS Patients
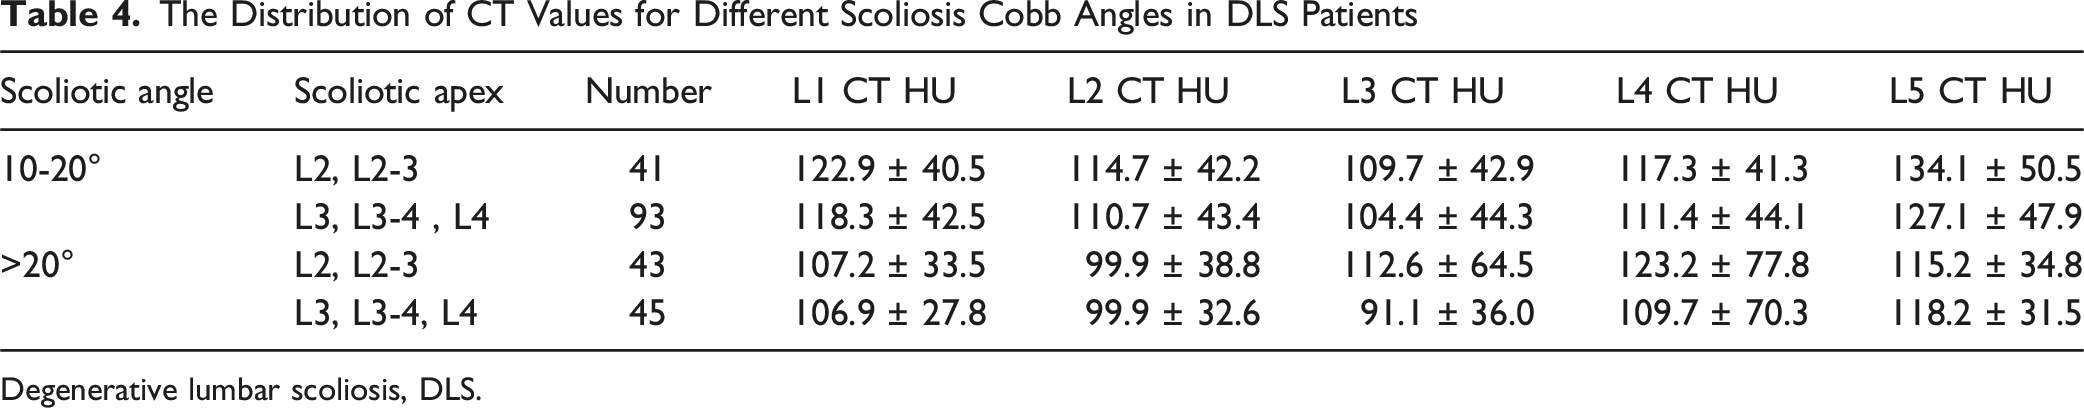
Degenerative lumbar scoliosis, DLS.
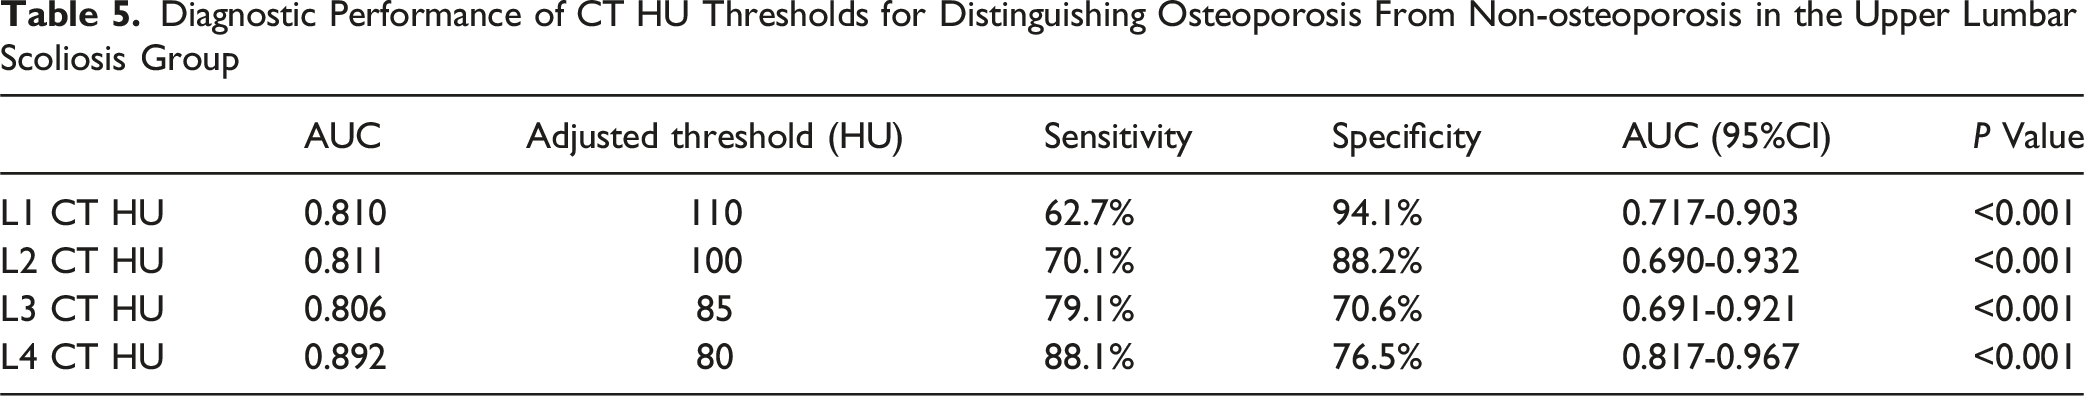
Diagnostic Performance of CT HU Thresholds for Distinguishing Osteoporosis From Non-osteoporosis in the Upper Lumbar Scoliosis Group
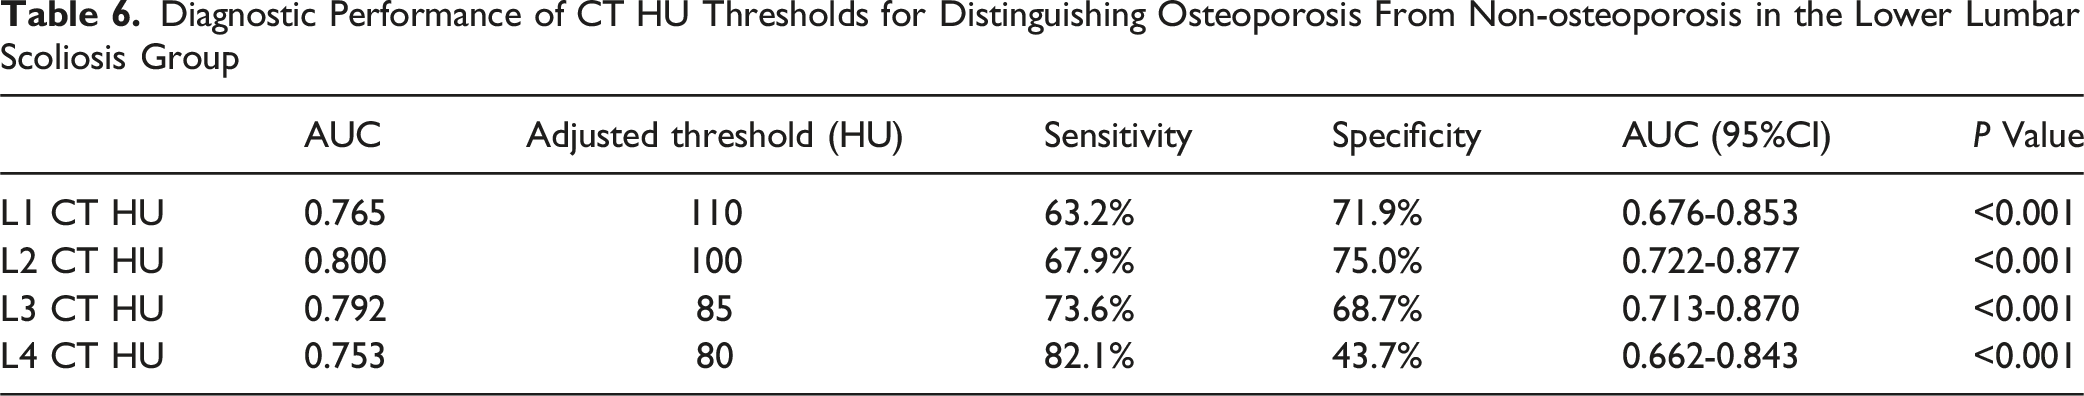
Diagnostic Performance of CT HU Thresholds for Distinguishing Osteoporosis From Non-osteoporosis in the Lower Lumbar Scoliosis Group
Comparison of ROC Curves in the Upper Lumbar Scoliosis Group (CT HU Thresholds Distinguishing Osteoporosis From Non-osteoporosis)
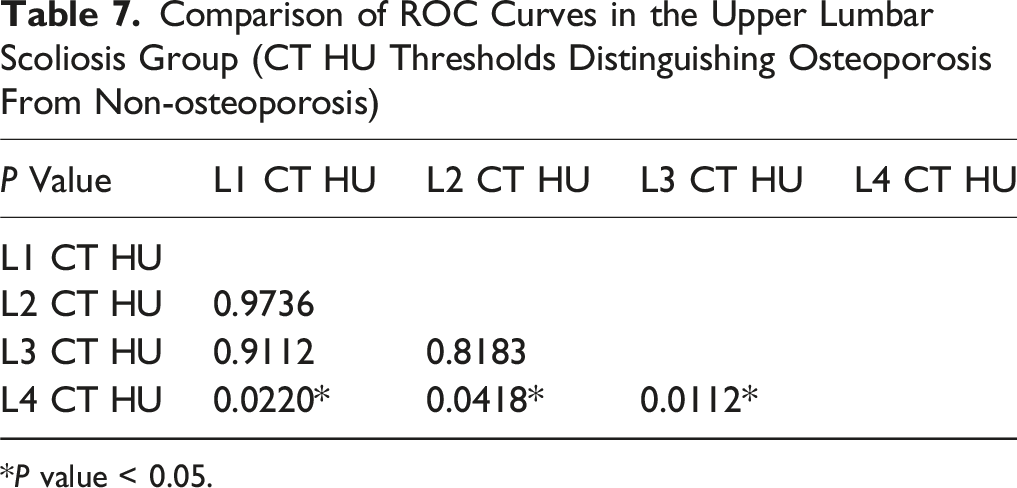
*P value < 0.05.
Comparison of ROC Curves in the Lower Lumbar Scoliosis Group (CT HU Thresholds Distinguishing Osteoporosis From Non-osteoporosis)
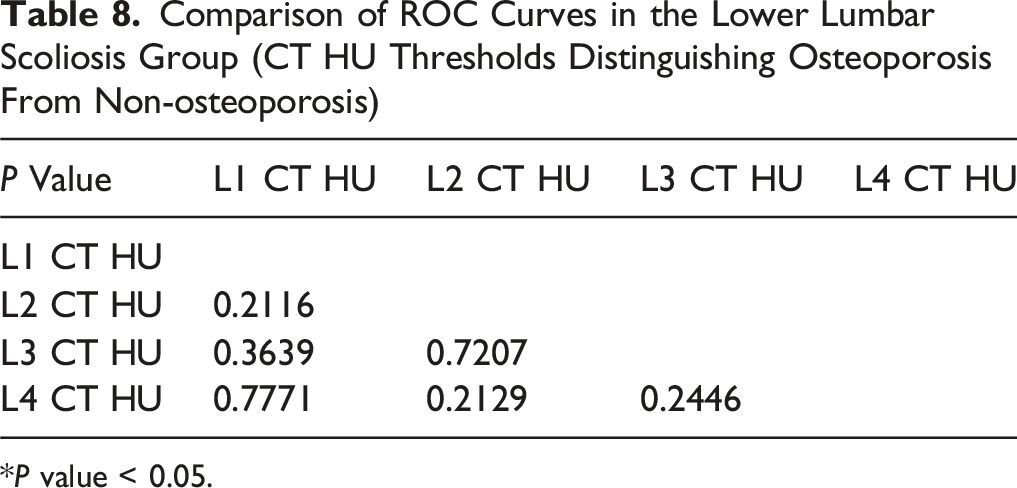
*P value < 0.05.
Discussion
It is crucial for spinal surgeons to meticulously monitor osteoporosis in DLS patients, especially those undergoing long-segment fixation, due to the increased risk of postoperative complications such as nonunion. 17 Besides, the quality of bone tissue is regarded as a key predictive factor for screw loosening. 18
In previous studies, it was recommended that patients undergoing preoperative lumbar CT scans also had CT HU measurements as a supplementary diagnostic method for osteoporosis. 10 CT HU measurement is a direct method for assessing BMD by evaluating the density of trabecular bone. Consequently, CT HU values have been extensively studied for evaluating bone density as they address challenges related to vertebral degeneration and cortical bone, focusing directly on trabecular bone density and avoiding additional costs for patients.8,10,19,20 Extensive research has been conducted on CT value assessment for osteoporosis in common degenerative lumbar spine diseases. Zou et al. established that the CT Hounsfield Unit (HU) thresholds for diagnosing osteoporosis are L1 ≤ 110 HU, L2 ≤ 100 HU, L3 ≤ 85 HU, and L4 ≤ 80 HU. 10 In DLS patients, alterations in movement patterns and force transmission can lead to abnormal localized bone formation or bone loss, influenced by the location of the scoliotic apex and the degree of scoliosis. These changes can cause HU values to either overestimate or underestimate bone density in DLS patients. Thus, it may not be appropriate to apply the uniform thresholds of L1 ≤ 110 HU, L2 ≤ 100 HU, L3 ≤ 85 HU, or L4 ≤ 80 HU as diagnostic criteria for osteoporosis in DLS patients, unlike in other common LSS. Previous studies on HU values in DLS patients mainly focused on asymmetrical CT value analysis, 21 and there is a lack of research on the distribution characteristics of HU values in different types of DLS patients and their impact on osteoporosis assessment.
In our study, we found that the distribution characteristics of HU values were generally similar between the osteoporosis and non-osteoporosis groups. Therefore, in the subsequent discussion, we will not separate the CT value distribution range into osteoporosis and non-osteoporosis categories. We selected patients within the most common range of scoliotic apex, L2-L4. 22 We found that the CT value distribution characteristics of DLS varied with different scoliotic apex locations. Specifically, in patients with scoliotic apex at L2 and L2-3, the lowest CT value of vertebrae was located in the region of scoliotic apex. However, in patients with scoliotic apex at L3, L3-4, or L4, the CT value of the L3 vertebrae was the lowest. This is consistent with the CT value distribution of vertebrae in LSS group in our study and aligns with previous research findings, 10 .
The variation in CT value distribution due to different scoliotic apex locations may be related to changes in biomechanical stress and movement patterns near the apex.11-15 Asymmetric loading forces can affect bone structure and soft tissues, thereby accelerating spinal degeneration. The degree of cell necrosis is positively correlated with the extent of pressure asymmetry.23,24 Asymmetric pressure on the intervertebral disc can cause the nucleus pulposus to lose its mechanical uniformity, leading to abnormally increased local pressure on the annulus fibrosus. 24 However, as degeneration progresses, the intervertebral disc dehydrates. 25 Collagen fibers replace the material of the nucleus pulposus, and the annulus fibrosus becomes brittle. 25 These changes affect the fluid statics of the intervertebral disc, reduce disc height, and lead to a redistribution of load on the surrounding structures. 11 Degenerative changes alter the way the intervertebral disc transmits mechanical loads. Wolff’s law theorizes that repetitive loading of bone induces adaptive responses, allowing the bone to better withstand these loads. 26 Mechanical loading may affect bone mass distribution. 27 Increased loading on bone will lead to remodeling. 28 This functional adaptation to habitual mechanical loading results in changes in bone mass through the bone remodeling process. 17 Additionally, some clinical and experimental studies have confirmed the relationship between the mechanical environment during movement and bone structure. 29 In our previous research, the vertebral motion patterns in DLS patients also varied with different scoliotic apex locations. 15 In the apex region of scoliosis, coupled motions are more pronounced, which may also lead to changes in bone density in the apex region, potentially causing inaccuracies in using HU values of the apex vertebra to infer osteoporosis. Coupled motion refers to activities that do not occur along the direction of the main motion axis, such as the bending and torsion motion of the vertebrae during the flexion-extension of the trunk.
Wang et al. found no significant correlation between the average HU values of the five lumbar vertebrae and the Cobb angle, nor between the HU values of individual lumbar vertebrae and the Cobb angle. 30 And our study revealed that in mild scoliosis patients, the lowest CT HU value was in L3 no matter whether the location of apex. But in the severe scoliosis patients, the lowest CT HU value was in the scoliotic apex region. So, the degree of scoliosis may expand the influence of the vertex of scoliosis on the CT value. This phenomenon might occur because greater spinal curvature causes increased deviation of the scoliosis apex from the midline, resulting in asymmetric stress distribution. The altered load transmission away from the vertebral body center ultimately leads to reduced CT values at the central region of apical vertebrae. Thus, it is crucial to consider the effects of varying scoliosis apices on bone density distribution in these patients.
Osteoporosis threshold assessment should account for DLS patients as a distinct group; thus, we generated ROC curves for all scoliosis patients. In our study, within the upper lumbar scoliosis group, the AUC for predicting osteoporosis using L4 was significantly higher compared to other vertebrae. Furthermore, the AUCs for L1 and L2 in our DLS patients were lower than those reported in Zou et al.’s study for degenerative lumbar diseases (0.810 vs 0.860, 0.811 vs 0.855). This finding suggests that the scoliosis apex may affect the local bone quality, reducing the effectiveness of predicting osteoporosis in the upper lumbar scoliosis group. Our data suggest that the decreasing trend in HU values at the scoliotic apex may lead to an increased risk of false positives, potentially including more osteoporotic patients. Consequently, for DLS patients with a scoliotic apex at L2 or L2-3, using the CT value of the L4 vertebrae may offer a more reliable method for clinical osteoporosis screening. In contrast, for patients with a scoliotic apex at L3, L3-4, or L4, no significant differences were observed in the AUCs for predicting osteoporosis among the HU values of various vertebrae. Based on these findings, we conclude that for patients with a scoliotic apex at L2 or L2-3, caution is warranted when using HU values of L1, L2, and L3 as diagnostic criteria for osteoporosis.
This was a retrospective study and may be subject to quality bias and inclusion bias. Secondly, with only 17 patients having a scoliotic Cobb angle greater than 40°, future research should aim to include a larger cohort with more severe scoliosis. Besides, changes in BMD of the apex region may cause inaccuracies of CT measurements, which may limit applicability of these study results. Furthermore, future studies should explore correlations with clinical outcomes, including reoperation rates and complication rates such as screw loosening and adjacent segmental diseases (ASD). Lastly, our study focused primarily on coronal plane parameters, neglecting the effects of sagittal plane parameters. Future research should consider larger sample sizes to comprehensively address these aspects.
Conclusions
The distribution of vertebral CT HU values in DLS patients varies according to the location of the scoliotic apex. When the apex is at L2 or L2-3, the lowest CT HU values are observed in the region of the scoliotic apex. Moreover, this distribution pattern of vertebral CT HU values is particularly pronounced in DLS patients with severe scoliosis. In DLS patients with the scoliotic apex at L2 or L2-3, utilizing the CT HU value of the L4 vertebrae may provide a more accurate assessment of osteoporosis.
Footnotes
Ethical Considerations
This study was approved by the institutional review board of the hospital.
Funding
The author(s) disclosed receipt of the following financial support for the research, authorship, and/or publication of this article: This work was supported by National Key Research and Development Program of China (2023YFC3604400) and the National Natural Science Foundation of China (Grant No.81871807). The funders had no role in study design, data collection and analysis, decision to publish, or preparation of the manuscript.
Declaration of Conflicting Interests
The author(s) declared no potential conflicts of interest with respect to the research, authorship, and/or publication of this article.
Data Availability Statement
The datasets used and/or analysed during the current study are available from the corresponding author on reasonable request.