
Abstract
Study Design
Retrospective magnetic resonance imaging grading with comparison between experts and deep convolutional neural networks (CNNs).
Objective
The application of deep learning to clinical diagnosis has gained popularity. This approach can accelerate image interpretation and serve as a screening tool to help doctors.
Methods
A comparison was conducted between retrospective magnetic resonance imaging (MRI) grading performed by experts and grading obtained using CNN classifiers. Data were collected from the lumbar axial dataset in the DICOM format. Two experts labeled the sampled images using the same diagnostic tools: localization of patches near the spinal canal, rootlet leveling, and stenosis grading. Comprehensive comparisons were presented for both rootlet cord classification and stenosis grading.
Results
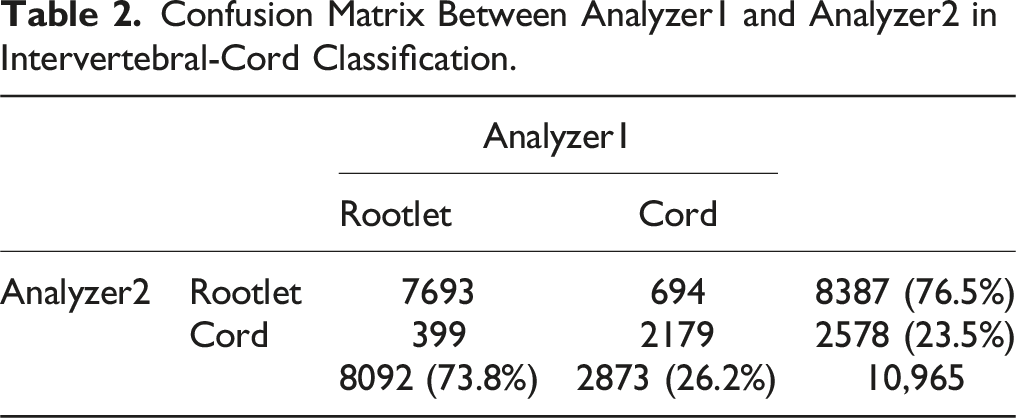
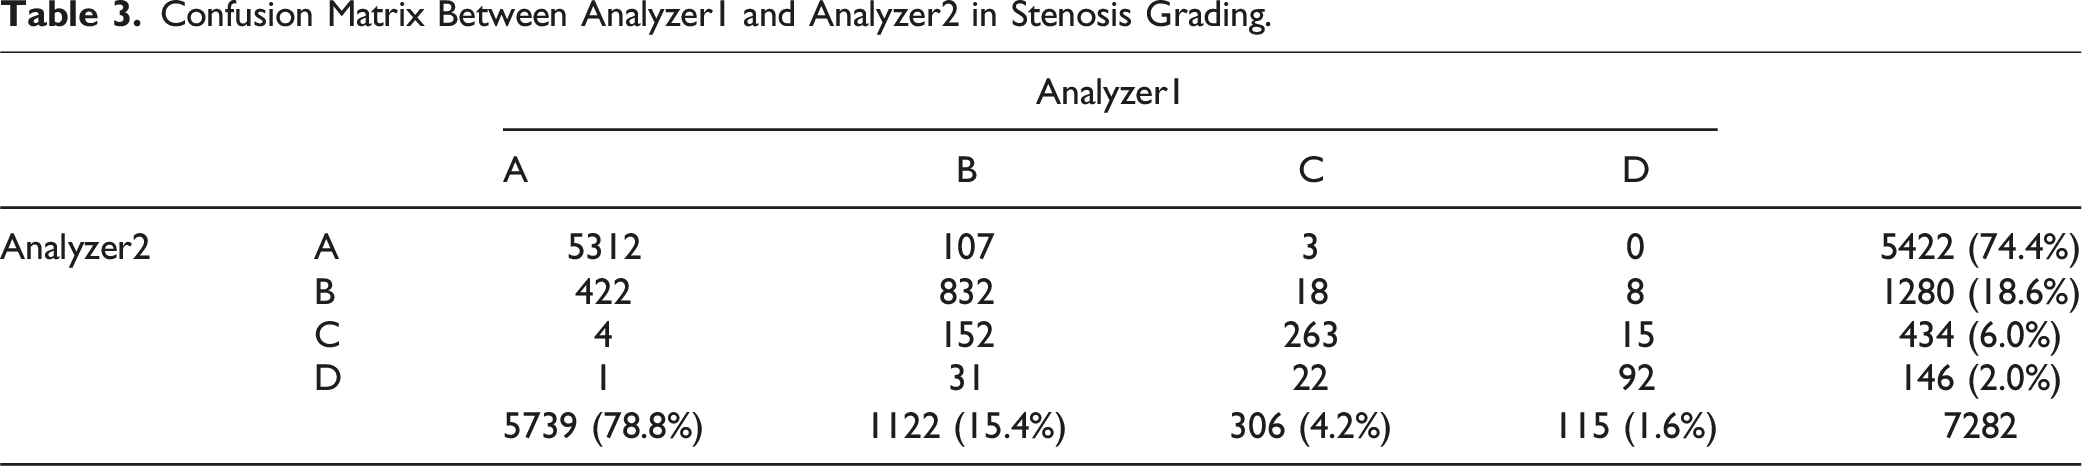
Rootlet-cord classification for the two analyzers was 90.3% and the F1 score was 86.6%. The agreement of Analyzers-Classifiers was 92.7% and 96.8% for data with 90.6% and 95.6% F1 scores, respectively. For stenosis grading, there was an agreement of 89.2% between the two analyzers, resulting in an F1 score of 76.5%. The grades of the Analyzers-Classifiers agreed on 91.5/89.4% of the data, with an F1 score of 78.4/75.7%. Analyzer1 and Analyzer2 classified >74% as grade A (78.8% and 74.4%, respectively), 15.4% and 18.6% as grade B, 4.2% and 6.0% as grade C, and 1.6% and 2.0% as grade D, respectively.
Conclusions
The fully automated deep learning model showed competitive results in stenosis grade diagnosis and rootlet cord classification under similar anatomical conditions. However, abrupt anatomical changes can lead to a puzzle diagnosis based only on images.
Introduction
Lumbar spinal stenosis is a disease of spinal canal narrowing by hypertrophied ligaments or bone spurs. Even though sagittal image is required to enhance the diagnostic accuracy, 1 dural sac cross-sectional surface area in T2-weighted axial MR images of the lumbar spine is crucial for diagnosis. The grade is frequently determined by the morphological characteristics of the cerebrospinal fluid and rootlet contents in proximity to the dural sac.2,3
Artificial intelligence (AI) in medicine has gained popularity owing to its high-precision and time-saving capabilities. AI has the potential to assist doctors in accomplishing repetitive and time-consuming tasks such as reading multiple medical images and automatically identifying medically relevant indicators.
In spinal diseases, approximately 90 studies have proven the usability of deep learning to help clinicians diagnose and predict prognosis and outcome. 4 Lehnen et al. reported the feasibility of using AI to detect degenerative changes by segmenting tissues in the spinal canal and classifying the changes using convolutional neural networks (CNNs). 5 Ouyang et al 6 utilized AI to evaluate a detection model specifically designed for spinal tumors on magnetic resonance imaging (MRI), demonstrating its effectiveness. 6 Wang et al 7 demonstrated the efficacy of a deep learning model for identifying intervertebral foraminal stenosis in the postoperative view. 7 Additionally, Yeh et al. and to analyze the diagnostic performances and errors between human and deep learning models for vertebral fractures on MRI. 8
Won et al. showed the reliability of AI for the diagnosis of spinal stenosis at the uni-level, exhibiting a strong correlation with clinical experts. 9 These studies collectively highlight the potential of AI in enhancing diagnostic accuracy and clinical decision-making. However, the previous study was limited in its scope, as it focused solely on the L4/5 level; therefore, doctors needed to manually select and input the images of the 4/5 level from multiple images of a single patient into the artificial intelligence system. To broaden the clinical utility of this study, we expanded our training dataset to include all imaging data from the entire lumbar region and its related levels. By incorporating this comprehensive dataset, we developed a multilevel automatic detection system capable of identifying narrow spinal canals across various levels and then classifying the grades of intervertebral stenosis. Thus, the proposed technique can automatically assess the characteristics of all vertebrae and provide grading without the need for manual intervention once MR images are acquired.
The primary objective of this study was to evaluate the agreement between the grades labeled by the two experts and classifiers using a multilevel dataset from each expert. In addition, we investigated the transferability of the deep learning algorithm trained at the lumbar level to the cord level.
Materials and Methods
Dataset
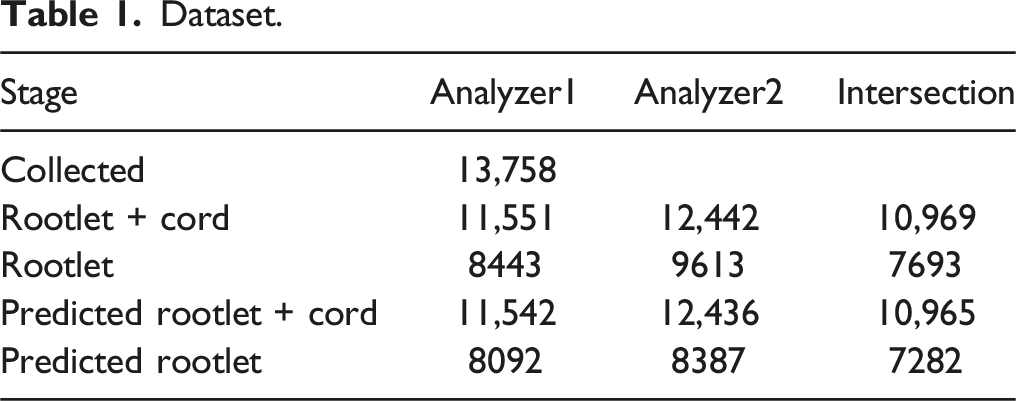
The Institutional Review Board of our hospital approved the use of this dataset. Initially, 13,758 lumbar spine MR images from 542 consecutive patients who performed lumbar spine MRI were used. These images were extracted from at least 15-46 slices, regardless of the rootlet and cord level, between all MR images of each patient. Axial mages were obtained with a slice thickness of 4 mm. The data samples were collected in Digital Imaging and Communications in Medicine (DICOM) format from the Picture Archiving and Communication System, which contained T2-weighted axial images of the lumbar, lower thoracic, and upper sacral spine. All MR images per patient were collected as a set, regardless of level. Furthermore, we collected T2 axial images using Siemens (1.5 T) and used them for the analysis. During the data collection process, there was no communication between the analyzers, and the final collected data were selected as the intersection of the data collected from each analyzer.
Classification by Two Experts
The images were classified and graded by two expert surgeons who assessed the center of the spinal canal, rootlet/cord level, and stenosis grade. Specifically, two analyzers labeled the locations of the spinal canal and determined the level at which the spinal canal was assigned between the rootlet and cord. The images were graded into one of the four levels using an existing grading tool for stenosis grading. Among the collected MR images, images of difficult cases for clinical operations or those lacking quality were discarded in our classifier training. Analyzer1 is a spine surgeon with over 10 years of experience, while Analyzer2 is an orthopedic surgeon with an equivalent level of clinical practice. There was no communication between the experts for any labeling process, such as localization of the spinal canal, rootlet-cord classification, or stenosis grading.
Stenosis Grade Classification Using Deep Convoluted Neural Network (CNN)
Using the labels generated by the two surgeons, we constructed a fully automatic diagnostic framework for stenosis grading. The framework for the stenosis grading is shown in Figure 1. This framework consists of 3 parts: a canal detector for localizing the spinal canal in collected images, which is the bounding box; a rootlet classifier that classifies the rootlet and cord levels from the patches extracted by the detector; and a stenosis classifier that classifies the stenosis grade of predicted rootlet patches from the rootlet classifier. Our deep learning based spinal stenosis grading system. Our grading system consists of 3 stages; Canal Detector, Rootlet/Cord Classifier and Stenosis Classifier. Canal Detector predicts the spinal canal region, and the classifiers predict rootlet/cord level and stenosis grade on localized canal region from the detector, respectively.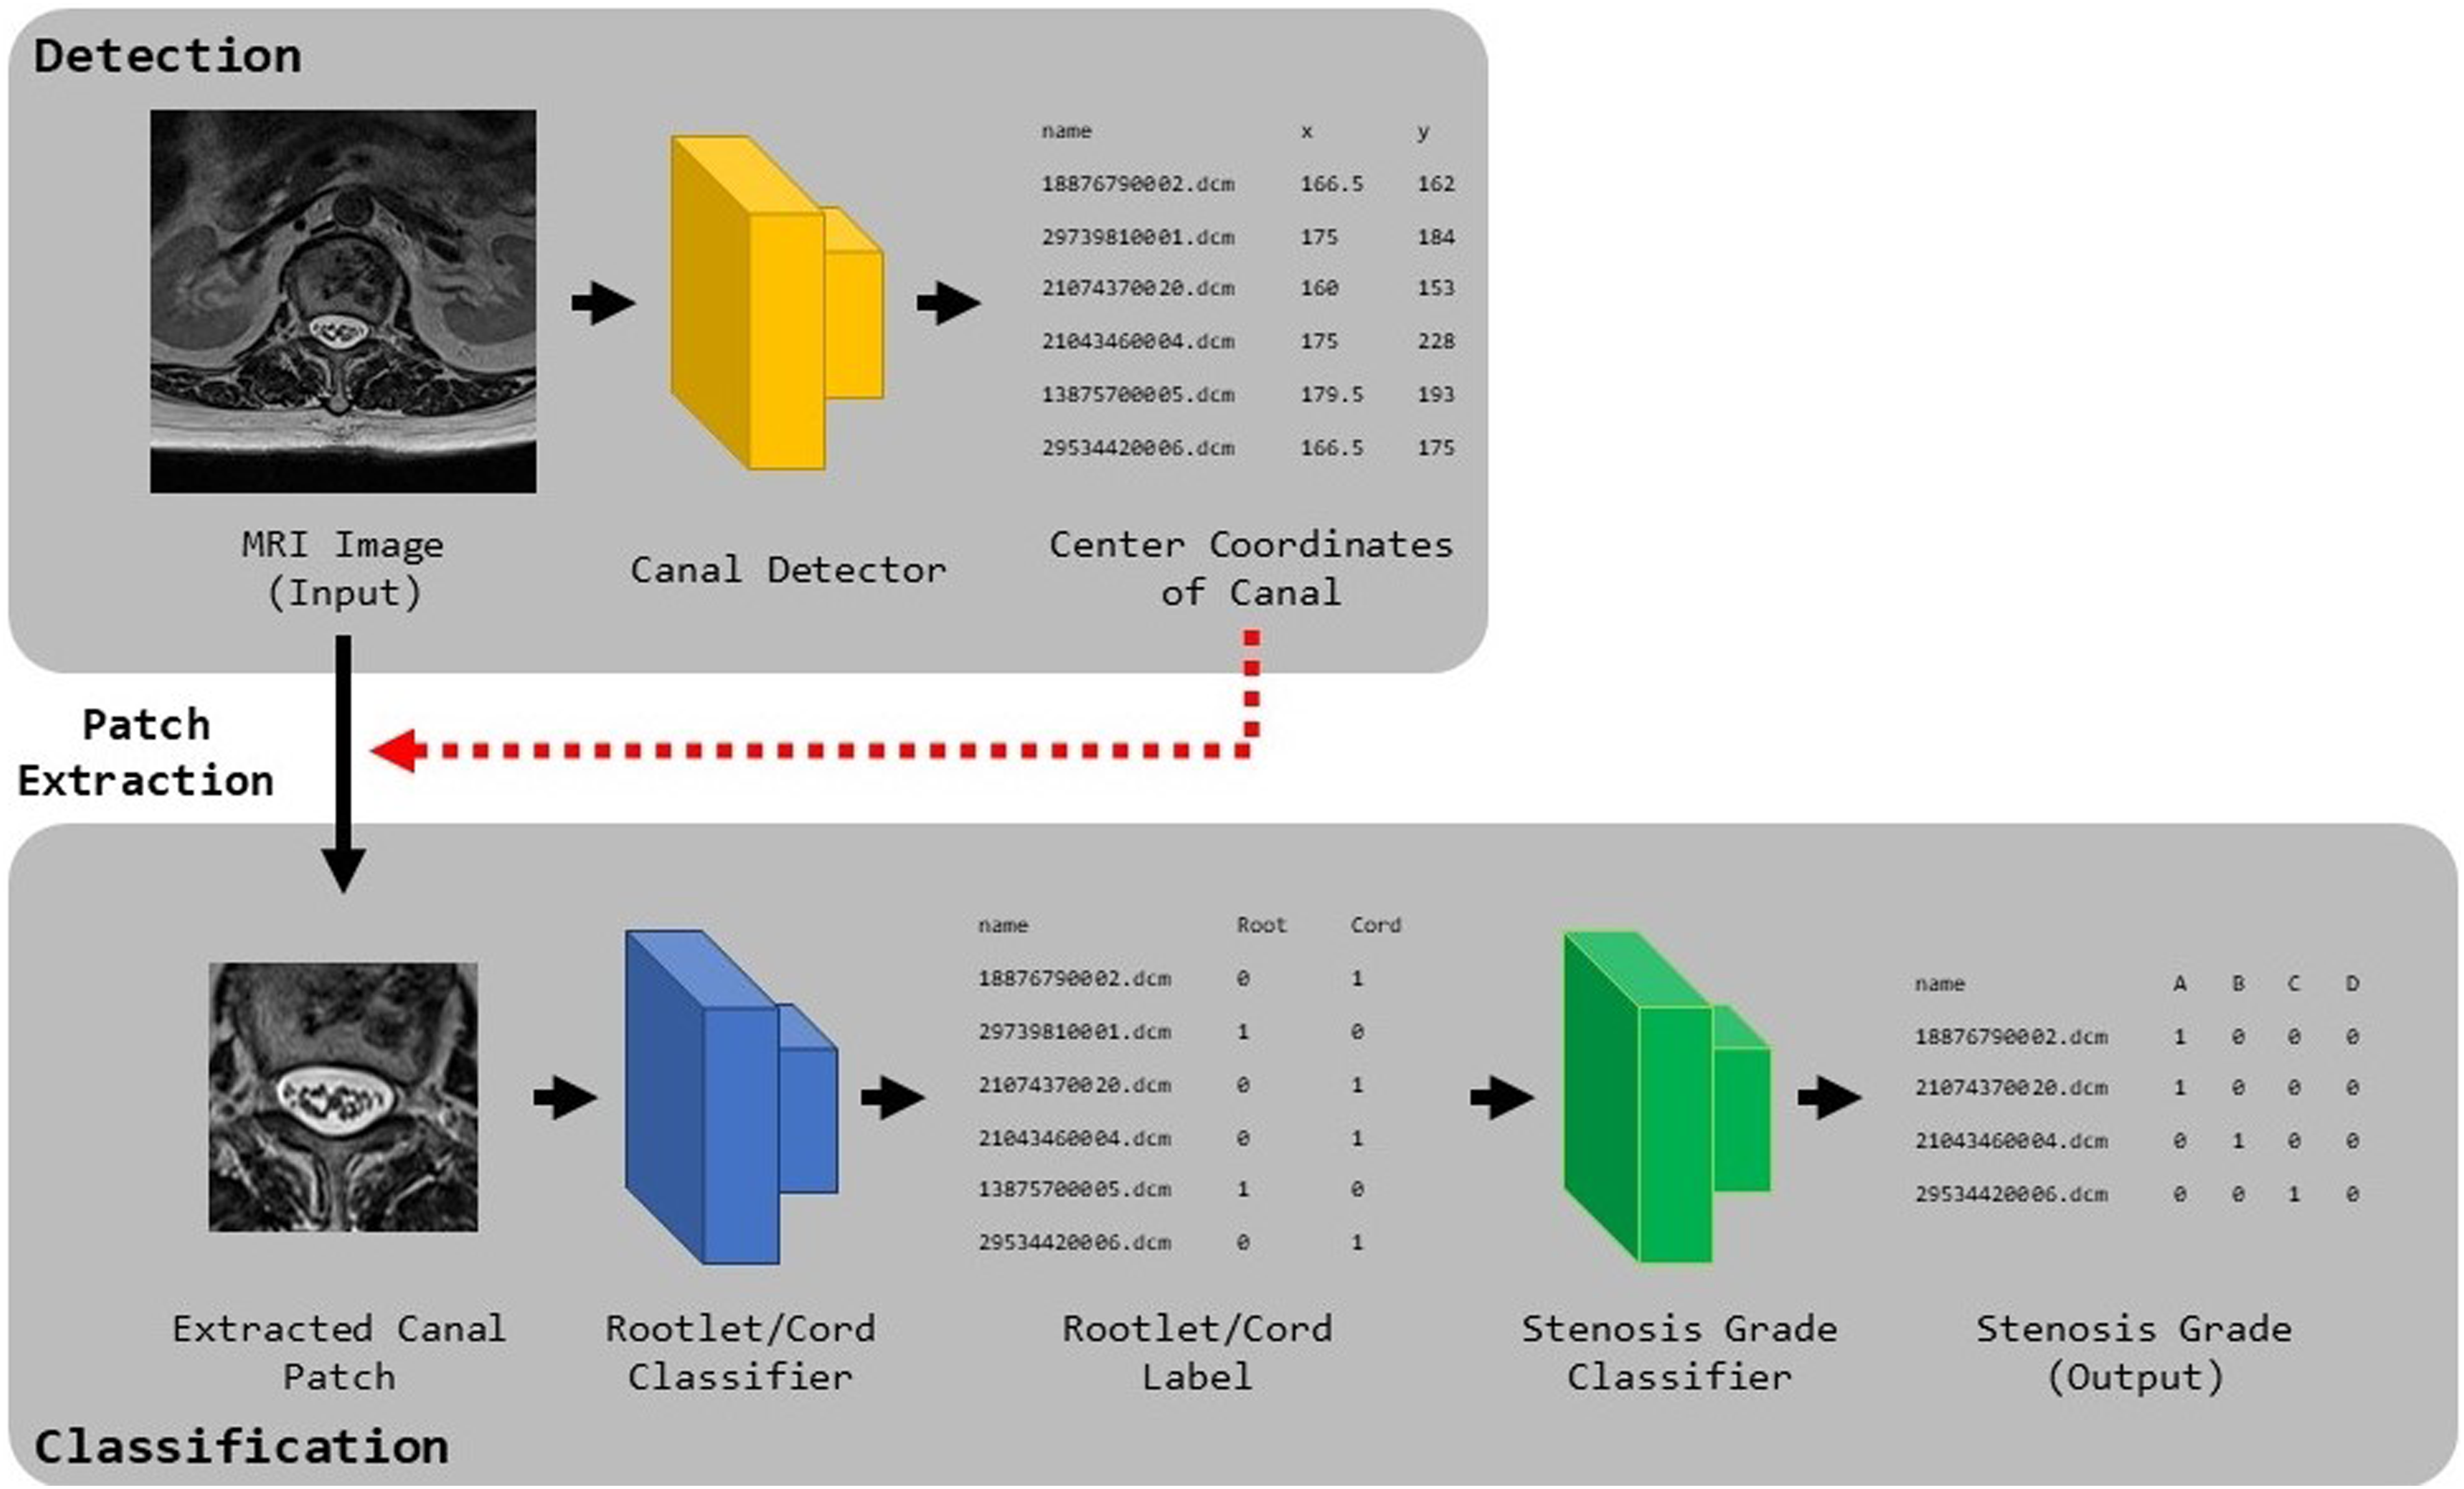
To locate the spinal canal, Faster R-CNN, 10 which trains the bounding boxes of the spinal canal labeled by experts, was used. This model consists of one backbone network, region proposal network (RPN), and region of interest (ROI) pooling layer. The backbone network, comprising ImageNet pre-trained ResNet50, 11 extracts the features of the input MR images. Using features from the backbone, the RPN generates bounding-box proposals and probability scores using a regression and classification module. The regression module minimizes the error between the ground truth and the predicted bounding boxes, and the classification module learns whether the class in the predicted bounding box is assigned to the spinal canal. To match the sizes of the feature maps from the RPN, ROI pooling was utilized so that the spinal canal detector could always train feature maps of the same size. The predicted bounding boxes and their scores were predicted by placing the features from the ROI pooling layers into the fully connected layers.
For rootlet-cord classification, we trained a Visual Geometry Group (VGG) 12 network using the extracted bounding box from the detector, where the spinal canal was located. We used a VGG network with 10 convolutional layers, 4 max pooling layers, 1 global average pooling layer, and 1 fully connected layer. As the network learns an image, the convolutional layers extract meaningful features of the rootlet on the input image. To calculate the error between the labels and predictions, we used the binary cross-entropy loss. The model was optimized using an ADAM 13 optimizer for 200 epochs. The learning rate was initially set to 0.0001 and was decreased by 50% when the validation accuracy did not increase from the last best validation accuracy. The best model was selected with high accuracy during validation.
For stenosis grading, we trained a VGG 12 likewise rootlet classifier using the predicted rootlet patches from the rootlet classifier. A fully connected layer with four outputs, that is, the final stenosis grade level, was used in our stenosis classifier. Softmax with cross-entropy loss was calculated to measure the error between the predictions and labels. The model was optimized using the ADAM 13 optimizer and was trained for 100 epochs. The initial learning rate was set to 0.0001 and reduced by 50% when the validation accuracy did not improve during the validation steps. The model with the highest accuracy for the validation dataset was chosen.
In the testing stage, our trained Faster R-CNN detects the bounding box of the spinal canal from a test MR image. The rootlet classifier subsequently classifies whether the patch extracted from the bounding box is at the rootlet or cord. Finally, the stenosis classifier predicted the grade with the highest probability among the four probabilities on the rootlet patches as the final stenosis.
To evaluate our framework, we divided our collected dataset into 10 sets and performed 10-fold cross-validation, where 1-fold training was formed with 7 training, two validation, and one test data. Each set was stratified by constructing an equal distribution of the grade levels.
Since our collected dataset was highly imbalanced (larger number of intervertebral discs and A and B grades on stenosis), we performed weighted sampling and data augmentation. Specifically, weighted sampling samples an even number of levels and grades on the mini-batch to ensure that the model trains equally on each label. For data augmentation, we used random rotation, scaling, translation, and horizontal flipping at the image level, and zero-mean Gaussian noise at the pixel level. Our experiments were performed on a GPU server with an Intel Xeon Silver 4210 2.2 GHz CPU, NVIDIA RTX 2080Ti, and 256 GB RAM, with a PyTorch implementation.
Comparison Between Inter-observer Agreement and Observer-Classifier Agreement
To evaluate our framework, the inter-observer and observer-classifier agreements of the rootlet and stenosis classifiers were measured. The inter-observer agreement reflects the degree of agreement in the diagnostic results between analyzers, whereas the observer-classifier agreement represents the diagnostic agreements between analyzers and classifiers.
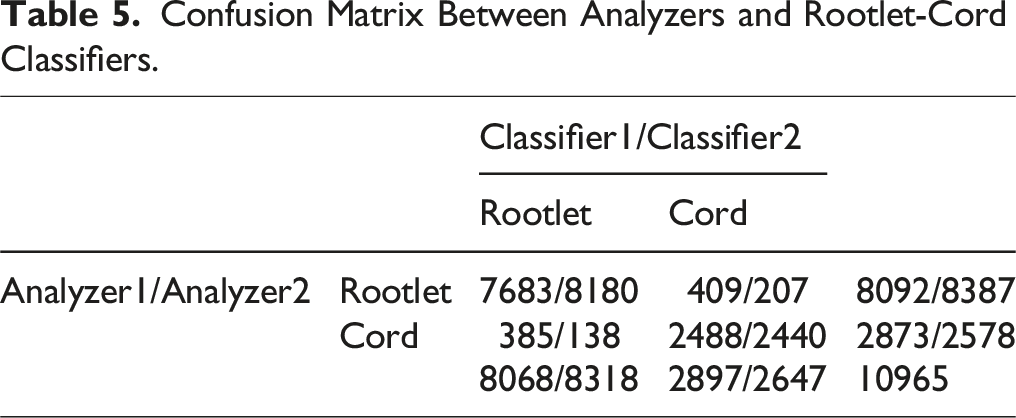
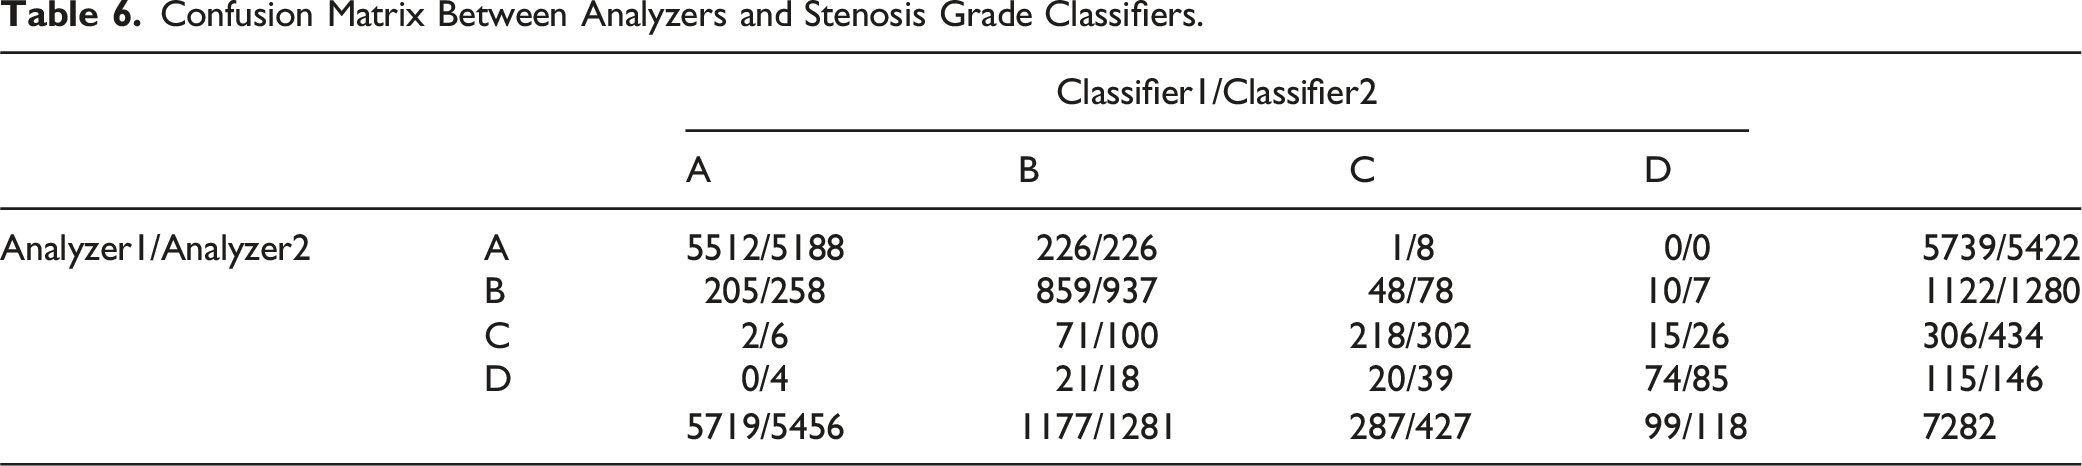
For a fair comparison, the inter-observer and observer-classifier agreements were compared at the intersection of the data used in both analyzers’ labels. To represent the agreements visually, we generated confusion matrices to illustrate the agreement between the following pairs: Analyzer1 and Analyzer2, Analyzer1 and Classifier1 trained using Analyzer1’s labels, and Analyzer2 and Classifier2 trained using Analyzer2’s labels. We further provided confusion matrices for each task, rootlet-level classification, and stenosis-grade classification. To validate the efficacy of our framework quantitatively, we utilized accuracy, F1 scores, and a two-sample paired t-test to assess the statistical significance of the variations in diagnostic outcomes.
Results
Number of Labeled Data
Dataset.
Inter-observer Agreement
Confusion Matrix Between Analyzer1 and Analyzer2 in Intervertebral-Cord Classification.
Confusion Matrix Between Analyzer1 and Analyzer2 in Stenosis Grading.
Observer-Classifier Agreement
The F-Score, Accuracy, and P Value of Rootlet-Cord and Stenosis Grade Classification Models.
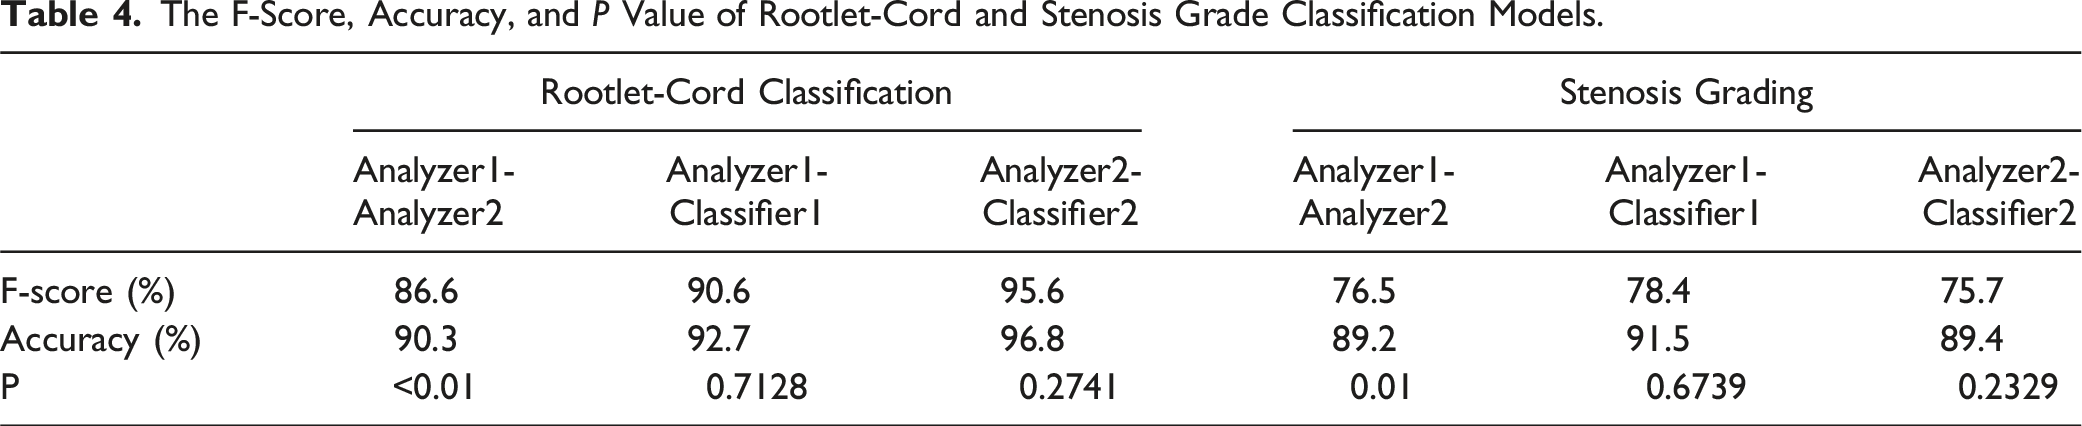
The stenosis grading agreement and F1-score are shown on the right side of Table 4. The two analyzers agreed on 89.2% of the data, resulting in an F1 score of 76.5%. The accuracy and F-score between Analyzer1-Classifier1 and Analyzer2-Classifier2 are comparable to or higher than those between Analyzer1-Analyzer2. There was a significant difference between Analyzer1 and 2 in both rootlet/cord classification and stenosis grading. Conversely, the differences between the analyzers and classifiers were not significant.
Confusion Matrix Between Analyzers and Rootlet-Cord Classifiers.
Confusion Matrix Between Analyzers and Stenosis Grade Classifiers.
Discussion
In summary, this study showed similar diagnostic agreement levels between experts and the agreement between experts and CNN classifiers trained in two specific areas: 1) distinguishing between rootlet and cord levels, and 2) grading stenosis across multiple lumbar levels. In general, the agreement between the analyzers and classifiers ranged from 91.5% to 92.7%, surpassing the level of agreement seen between Analyzer1 and Analyzer2, which was 89.2%. In both the rootlet/cord classification and stenosis grading, analyzers 1 and 2 showed significant differences. However, there were no significant differences between the Analyzers and Classifiers. The agreement between Analyzers and Classifiers for stenosis grading in this study was higher than that in a previous study (77.9%–83%). 6 We confirmed that the decisions generated by deep learning are reasonable for spinal stenosis grading and rootlet level differentiation from the cord level, at least at the entire lumbar level, with one grading system.
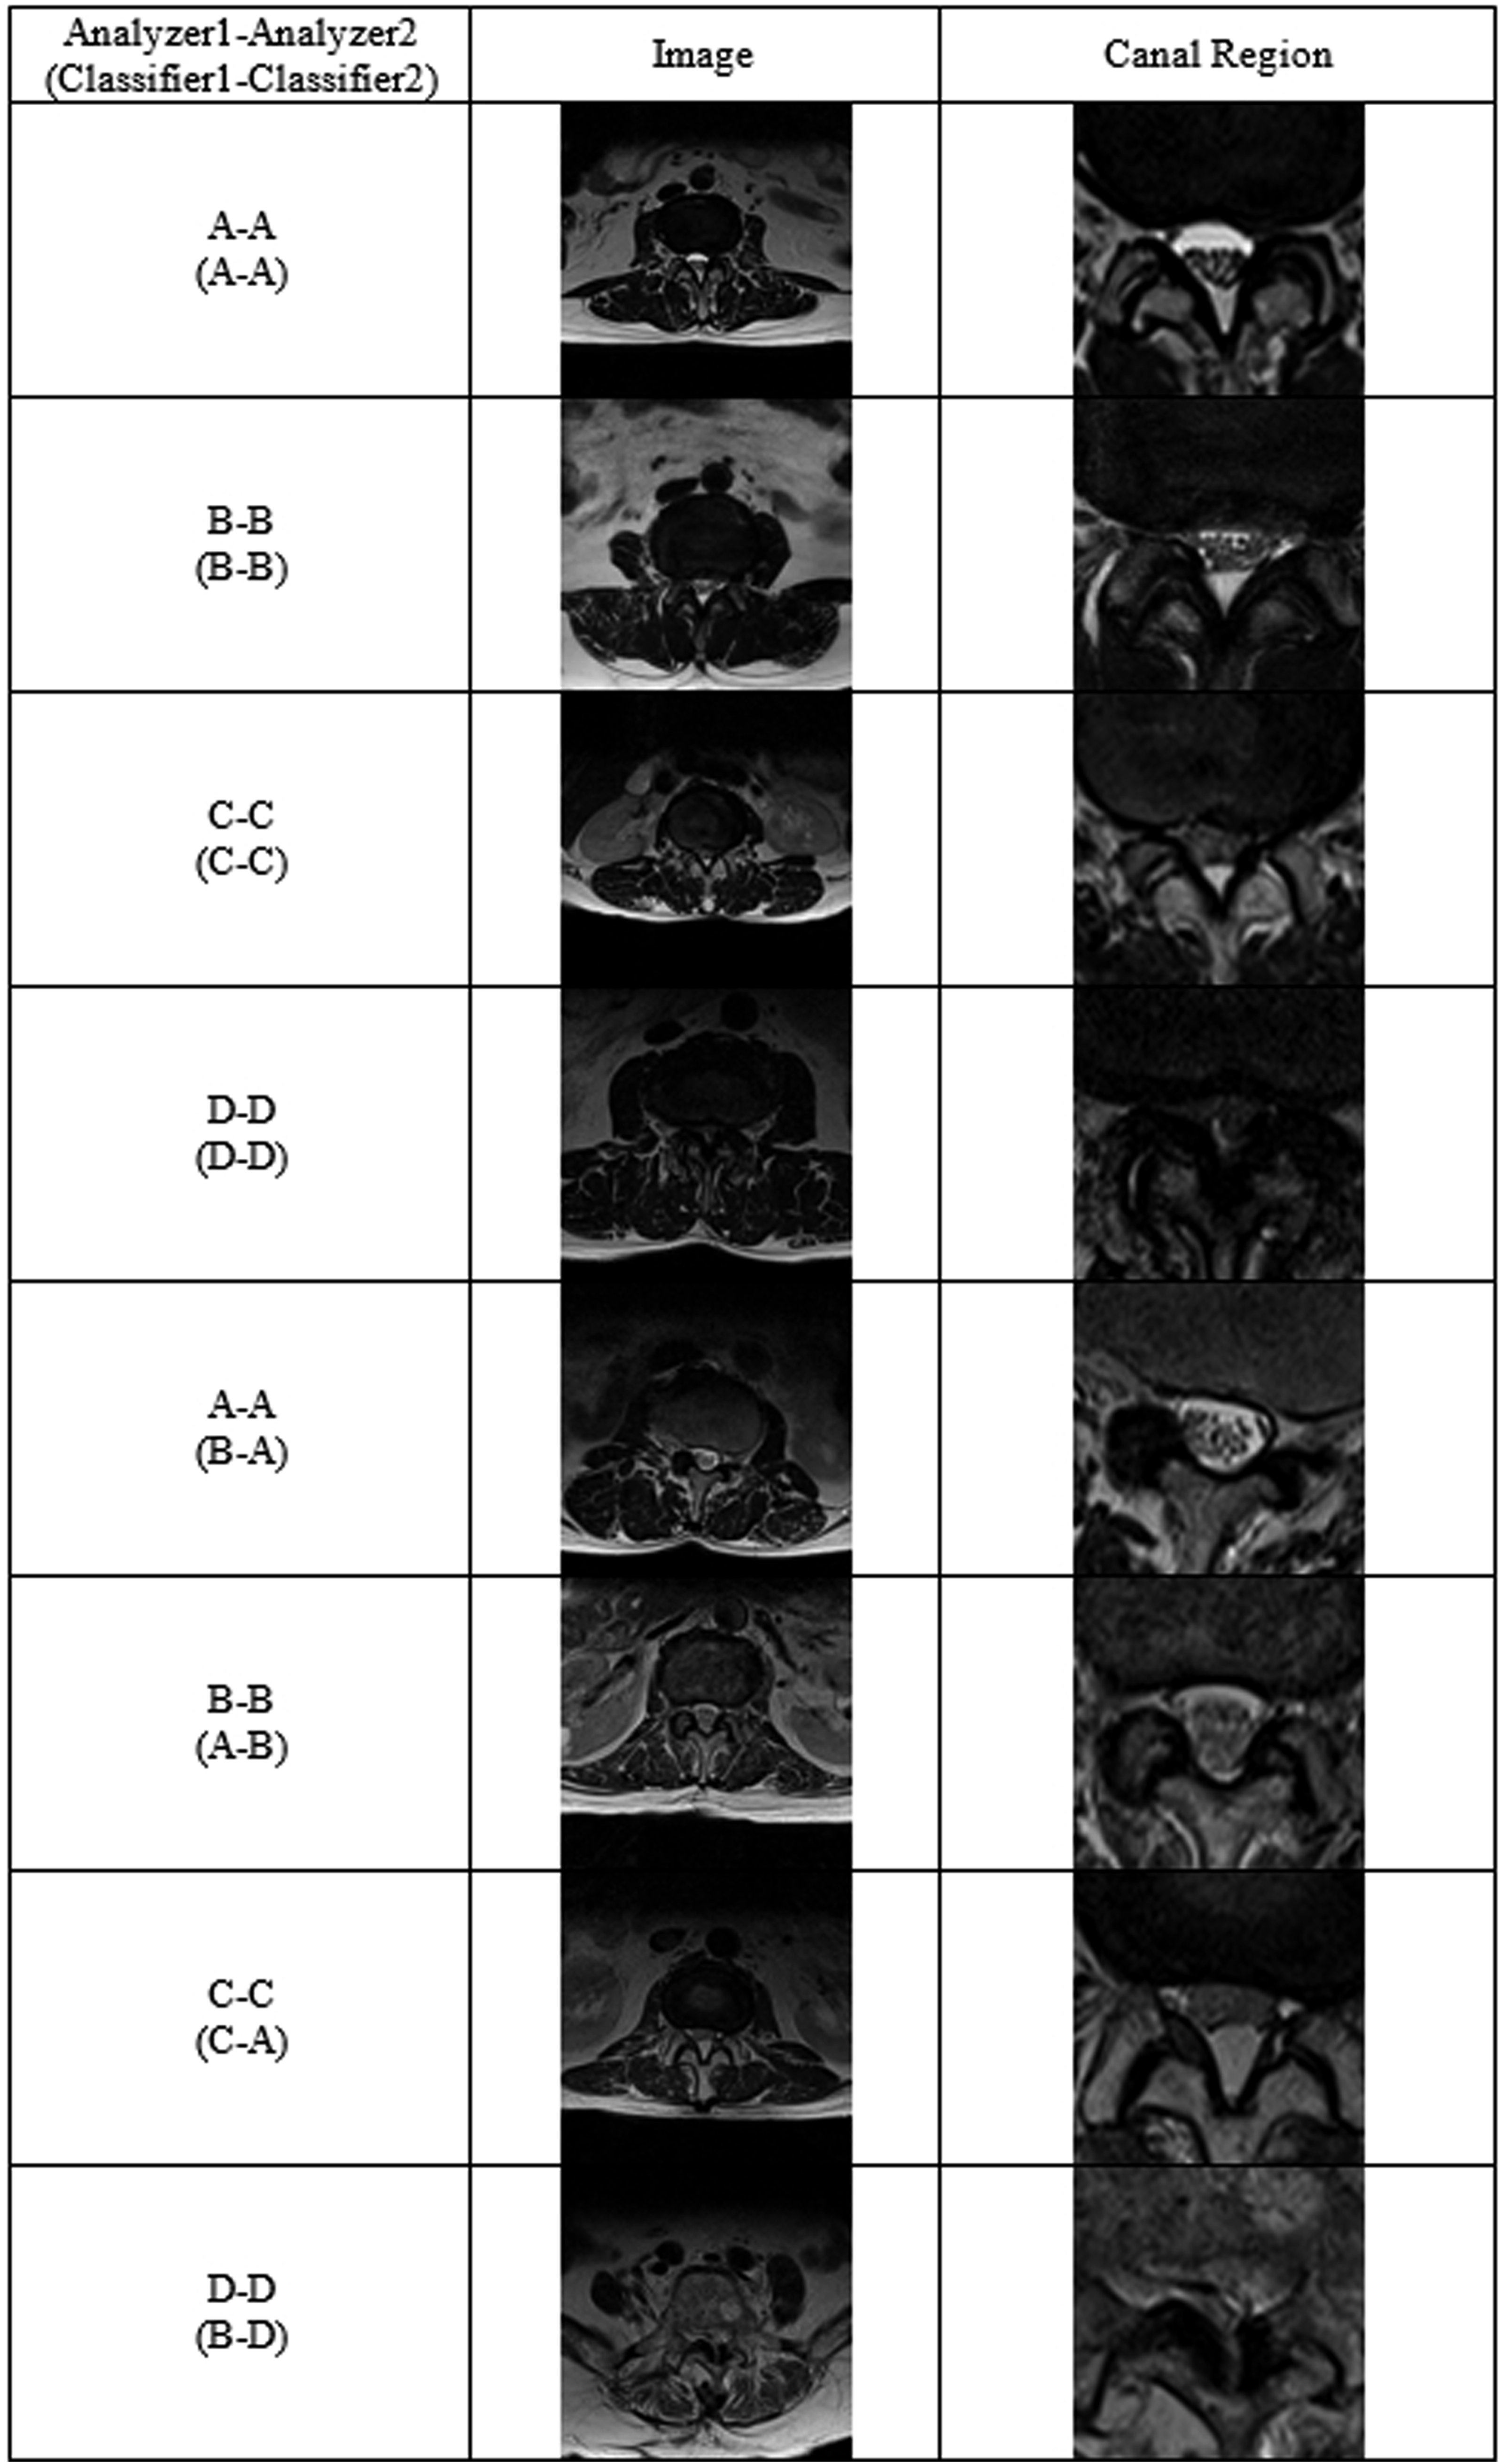
The classifier which had been trained at a single level can be applied to other lumbar levels with a higher level of consistency. The classified samples for the lumbar levels are presented in Figures 2 and 3. We speculate that this is possible because of the similar anatomical morphology of other lumbar levels with the single L4/5 level. To develop a more clinical situation-based deep learning model for determining the grade of spinal stenosis, extensibility to multiple levels is necessary. Although single- to multiple-level transfer learning is possible, the specific level that contains the spinal cord results in incorrect categorization by the algorithm. Thus, for a versatile diagnostic tool using deep learning, an additional rootlet classifier with cord compression classification is required at the cord level. Rootlet/Cord classification cases between analyzers or an analyzer and a classifier. Matched cases between analyzers.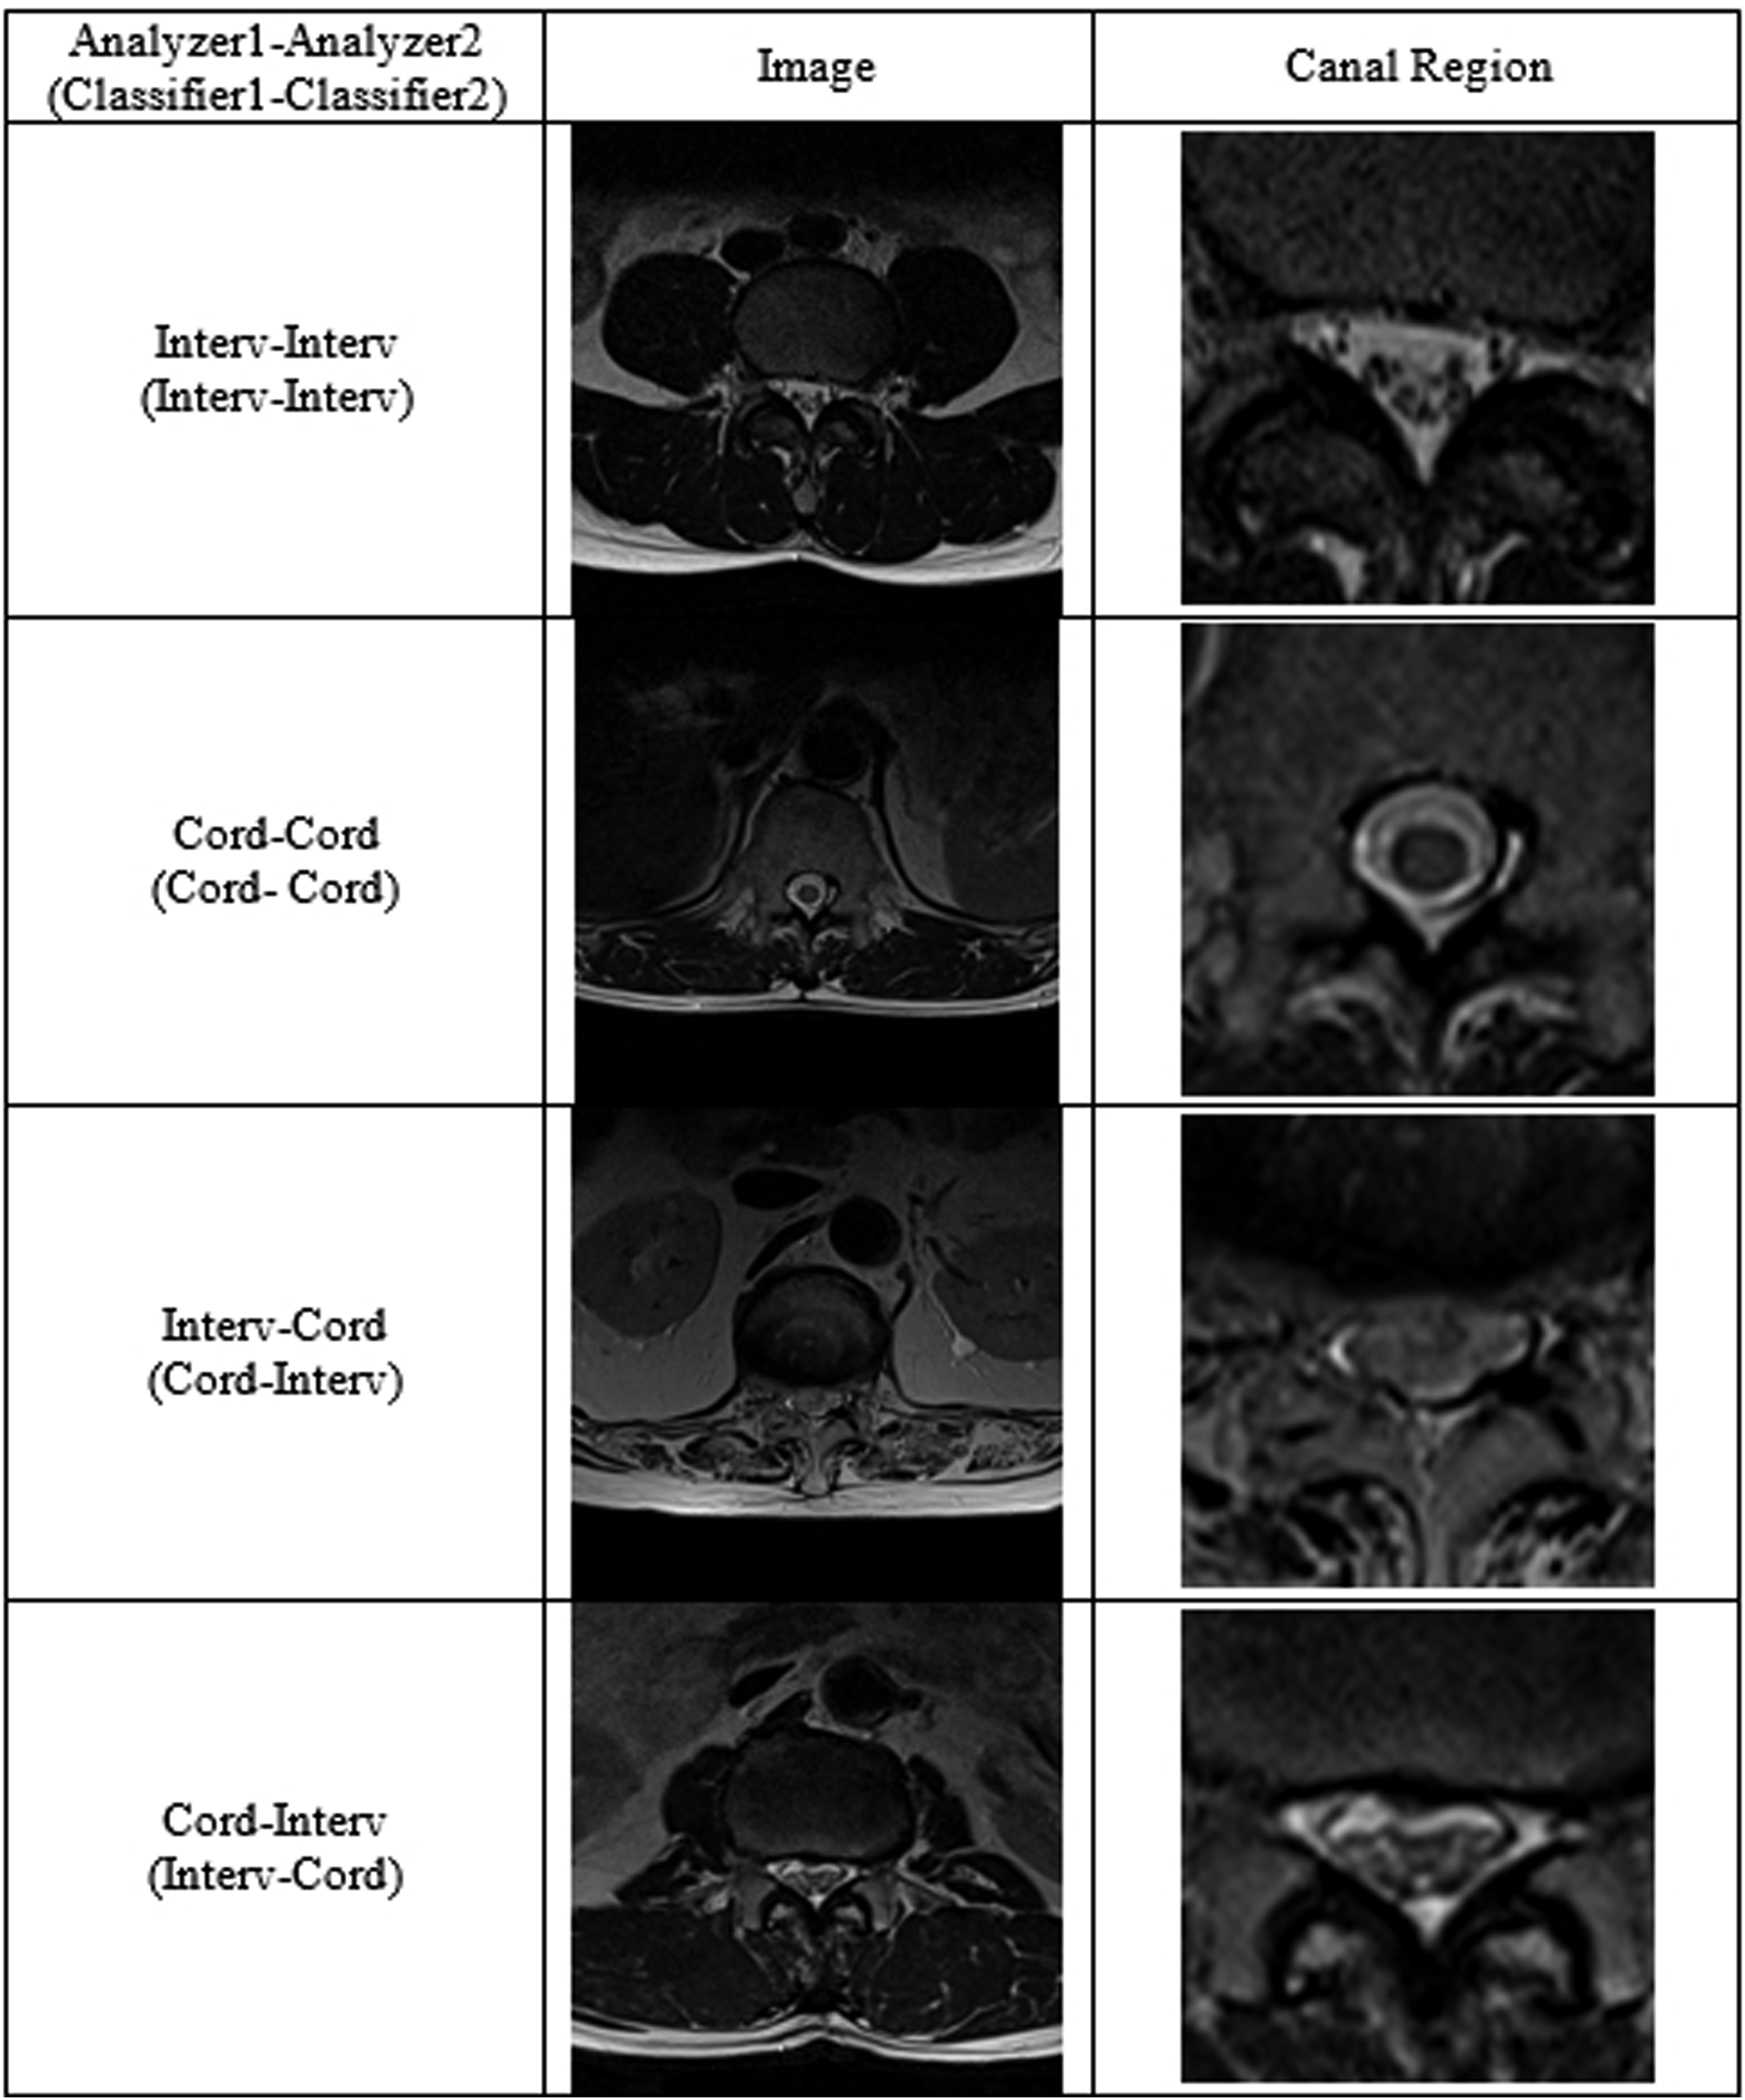
At the spinal cord level, the disagreement between analyzers and classifiers was higher than at other levels where the spinal cord was not present. We assumed that the classifier was confused by spinal cord morphology, which mimicked the aggregated spinal root, as it did not have information on spinal cord morphology. Therefore, we speculated that training data at the cord level is needed to broaden the deep learning model to the thoracic lumbar level.
Image-based diagnosis is a key procedure in the final diagnosis of spinal stenosis. AI-based image interpretation has gained popularity to enhance diagnostic accuracy and for fast detection excluding critical human error.8,14,15 The spine has multiple levels with a similar shape, and requires considerable time for level checking and diagnostic decisions. As Herzog described, more clinically practical tools are needed to perform relevant analyses. 16
We found that the highly imbalanced dataset across the grades caused current results, and the data augmentation and class-wise sampling techniques used in this experiment were insufficient to cover the sample diversity of severe cases such as grades C and D. Nevertheless, we found that trained classifiers still perform competitive diagnosis in grades A and B, similar to human analyzers. We expect that more samples or undersampling processes with respect to Grades C and D for sample diversity could resolve the current issues.
This study had several limitations. Despite our efforts to collect a substantial MRI dataset, an imbalance in grades occurred within the training dataset, primarily owing to the relatively smaller number of collected images for Grades C and D compared to Grades A and B. In this study, we did not consider the priority of under-diagnosis or over-diagnosis. However, high sensitivity is often required for screening. To use this model as a screening tool, a loss function using regression or classification is required. Therefore, overdiagnosis should be considered. Furthermore, to improve diagnostic accuracy, the inclusion of sagittal images is essential. We anticipate that the effective utilization of these images will necessitate the development of more advanced segmentation techniques and the application of multiple classifiers. This will be a focus of our future research.
Conclusion
Our trained deep learning model can be used when anatomical conditions are similar. However, anatomical changes can lead to a puzzle diagnosis based only on images. Doctors should be involved in interpreting the model for medical diagnosis.
Supplemental Material
Supplemental Material - Lumbar Spinal Stenosis Grading in Multiple Level Magnetic Resonance Imaging Using Deep Convolutional Neural Networks
Supplemental Material for Lumbar Spinal Stenosis Grading in Multiple Level Magnetic Resonance Imaging Using Deep Convolutional Neural Networks by Dongkyu Won, BS, Hyun-Joo Lee, MD, PhD, Suk-Joong Lee, MD, PhD and Sang Hyun Park, PhD in Global Spine Journal
Footnotes
Acknowledgments
This work was supported by the National Research Foundation of Korea (NRF) grant funded by the Korean government (
Authors’ Contributions
HJL and SJL analyzed and interpreted the image data. WD and SJL wrote the manuscript. HJL,SJL and SHP reviewed and edited the manuscript. WD and SHP analyzed the interpreted data using this model. All authors have read and approved the final manuscript.
Declaration of Conflicting Interests
The author(s) declared no potential conflicts of interest with respect to the research, authorship, and/or publication of this article.
Funding
The author(s) disclosed receipt of the following financial support for the research, authorship, and/or publication of this article: This study was supported by a National Research Foundation of Korea (NRF) grant funded by the Korean government (NRF-2022R1F1A1068306).
Ethical Statement
Data Availability Statement
The datasets generated and/or analyzed during the current study are not publicly available because of privacy issues but are available from the corresponding author upon reasonable request.
Supplemental Material
Supplemental material for this article is available online.
Appendix
References
Supplementary Material
Please find the following supplemental material available below.
For Open Access articles published under a Creative Commons License, all supplemental material carries the same license as the article it is associated with.
For non-Open Access articles published, all supplemental material carries a non-exclusive license, and permission requests for re-use of supplemental material or any part of supplemental material shall be sent directly to the copyright owner as specified in the copyright notice associated with the article.