
Abstract
Study Design
Systematic literature review.
Objectives
To develop a predictive model for osteoporotic vertebral compression fractures (OVCF) in the elderly, utilizing current tools that are sensitive to bone and paraspinal muscle changes.
Methods
A retrospective analysis of data from 260 patients from October 2020 to December 2022, to form the Model population. This group was split into Training and Testing sets. The Training set aided in creating a nomogram through binary logistic regression. From January 2023 to January 2024, we prospectively collected data from 106 patients to constitute the Validation population. The model’s performance was evaluated using concordance index (C-index), calibration curves, and decision curve analysis (DCA) for both internal and external validation.
Results
The study included 366 patients. The Training and Testing sets were used for nomogram construction and internal validation, while the prospectively collected data was for external validation. Binary logistic regression identified nine independent OVCF risk factors: age, bone mineral density (BMD), quantitative computed tomography (QCT), vertebral bone quality (VBQ), relative functional cross-sectional area of psoas muscles (rFCSAPS), gross and functional muscle fat infiltration of multifidus and psoas muscles (GMFIES+MF and FMFIES+MF), FMFIPS, and mean muscle ratio. The nomogram showed an area under the curve (AUC) of 0.91 for the C-index, with internal and external validation AUCs of 0.90 and 0.92. Calibration curves and DCA indicated a good model fit.
Conclusions
This study identified nine factors as independent predictors of OVCF in the elderly. A nomogram including these factors was developed, proving effective for OVCF prediction.
Keywords
Introduction
With the aging global population, osteoporosis prevalence in the elderly is escalating, leading to an increase in osteoporotic vertebral compression fractures (OVCF). 1 OVCF, a serious osteoporosis complication, not only causes pain and limited mobility but also exacerbates underlying cardiopulmonary conditions in the elderly, potentially resulting in long-term disability or mortality. 2
Bone Mineral Density (BMD) is a clinically recognized quantitative standard for assessing bone strength. Dual Energy X-ray Absorptiometry (DEXA) and Quantitative Computed Tomography (QCT) are pivotal in measuring bone strength, each providing essential insights into bone density.3-5 Recently, the Vertebral Bone Quality score (VBQ), assessable via MRI, has emerged as a method for evaluating vertebral bone quality. VBQ offers a more comprehensive assessment of spinal health than DEXA’s T-score and QCT, with the added benefit of avoiding radiation exposure, making it an increasingly preferred clinical tool. 6
Paraspinal muscles, crucial for spinal biomechanical stability, encompass the psoas muscles (PS), erector spinae (ES), and multifidus (MF). Their degeneration typically involves functional muscle atrophy and increased fat infiltration (FI). 7 Recent studies have linked decreased Paraspinal muscle area with lower back pain (LBP). 8 Further, a reduction in these muscles’ cross-sectional area (CSA) and increased FI correlate with lower BMD and a heightened risk of OVCF. 9
Predictive models for OVCF are vital for early screening of high-risk individuals, aiming to decrease the incidence and mortality rate of OVCF. 10 Our study seeks to incorporate Paraspinal muscle metrics, VBQ, and QCT to identify independent OVCF risk factors, striving for a comprehensive skeletal muscle evaluation. The goal is to develop a clinically viable, consistent, and accurate OVCF predictive model.
Materials and Methods
Patient Selection
This study entailed a retrospective analysis of data from 260 patients who visited the Department of Spinal Surgery from October 2020 to December 2022. Furthermore, a prospective data collection from January 2023 to January 2024 at our hospital encompassed 106 patients, culminating in a total of 366 cases. The inclusion criteria were delineated as follows: (1) patients aged 45 years or older and/or those presenting with recent thoracolumbar vertebral fractures; (2) patients possessing complete medical records, including bone density and radiological data; (3) bone density measurements acquired using the same densitometer; and (4) patients who provided informed consent for study participation and fulfilled the follow-up criteria. Conversely, the exclusion criteria encompassed: (1) long-term usage of steroids or hormones; (2) exclusion due to other underlying conditions affecting bone quality, such as bone tumors or metabolic bone diseases; (3) presence of burst fractures; and (4) individuals in the non-OVCF group who developed OVCF during the follow-up.
The prospective case collection adhered strictly to randomized control principles, ensuring that the inclusion and exclusion criteria, along with the content of data collection, were consistent with those of the Model population. The endpoint of collection was established upon achieving a sample size constituting 40% of the Model population, with an emphasis on matching gender distribution and outcome composition.
In our investigation, all participants were stratified into two cohorts: the Model population, comprising 260 cases from the retrospective collection, and the Validation population, consisting of 106 cases from the prospective collection. The Model population was further segmented into a Training set (182 cases, 70%) and a Testing set (78 cases, 30%). We developed a nomogram model using the Training set, employing the Testing set for internal validation and the Validation population for external validation.
Guided by our comprehensive review and analysis of the literature regarding independent risk factors for OVCF, this research compiled general information (such as age, gender, BMI, BMD T-score) and radiological data (including lumbar spine CT and MRI) for subsequent imaging analysis.
Radiographic Assessment
Quantitative Computed Tomography and VBQ Measurement Methods
In this study, lumbar CT imaging data were exclusively sourced from our hospital’s CT scanner (Philips Medical Systems, Best, the Netherlands), utilizing the QCT analysis module to yield an average QCT value.
11
The VBQ measurement was conducted using lumbar MRI with T1-weighted signals, without any contrast enhancement, to ensure the acquisition of high-quality MRI slices.
12
This process entailed selecting the region of interest (ROI) in the sagittal position from the L1-4 vertebrae, approximately 200 mm2, and the ROI of the cerebrospinal fluid space (CSF) of the L3 vertebra, approximately 4 cm2 in size (Figure 1(a)). The VBQ was calculated using the formula: VBQ = Median (SIL1-L4)/SIL3CSF. (a) This image originates from a patient in the current study with a fresh compressive fracture of the T12 vertebra. The signal intensity of vertebrae L1-4 is indicated by the intensity within the red Region of Interest (ROI), while L3CSF is represented by the signal intensity within the green ROI. (b). A schematic representation of the measurement of paravertebral muscle parameters on lumbar cross-sectional images (L4/5) under MRI T2 signal. The CSAIVD (green ROI), CSAPS (blue ROI), MFIPS (blue ROI), SFI (black ROI), and the calculations for GCSAES+MF, GMFIES+MF on the right-side ROIES+MF (yellow ROI) and FCSAES+MF, FMFIES+MF (red ROI) on the left-side ROIES+MF are shown.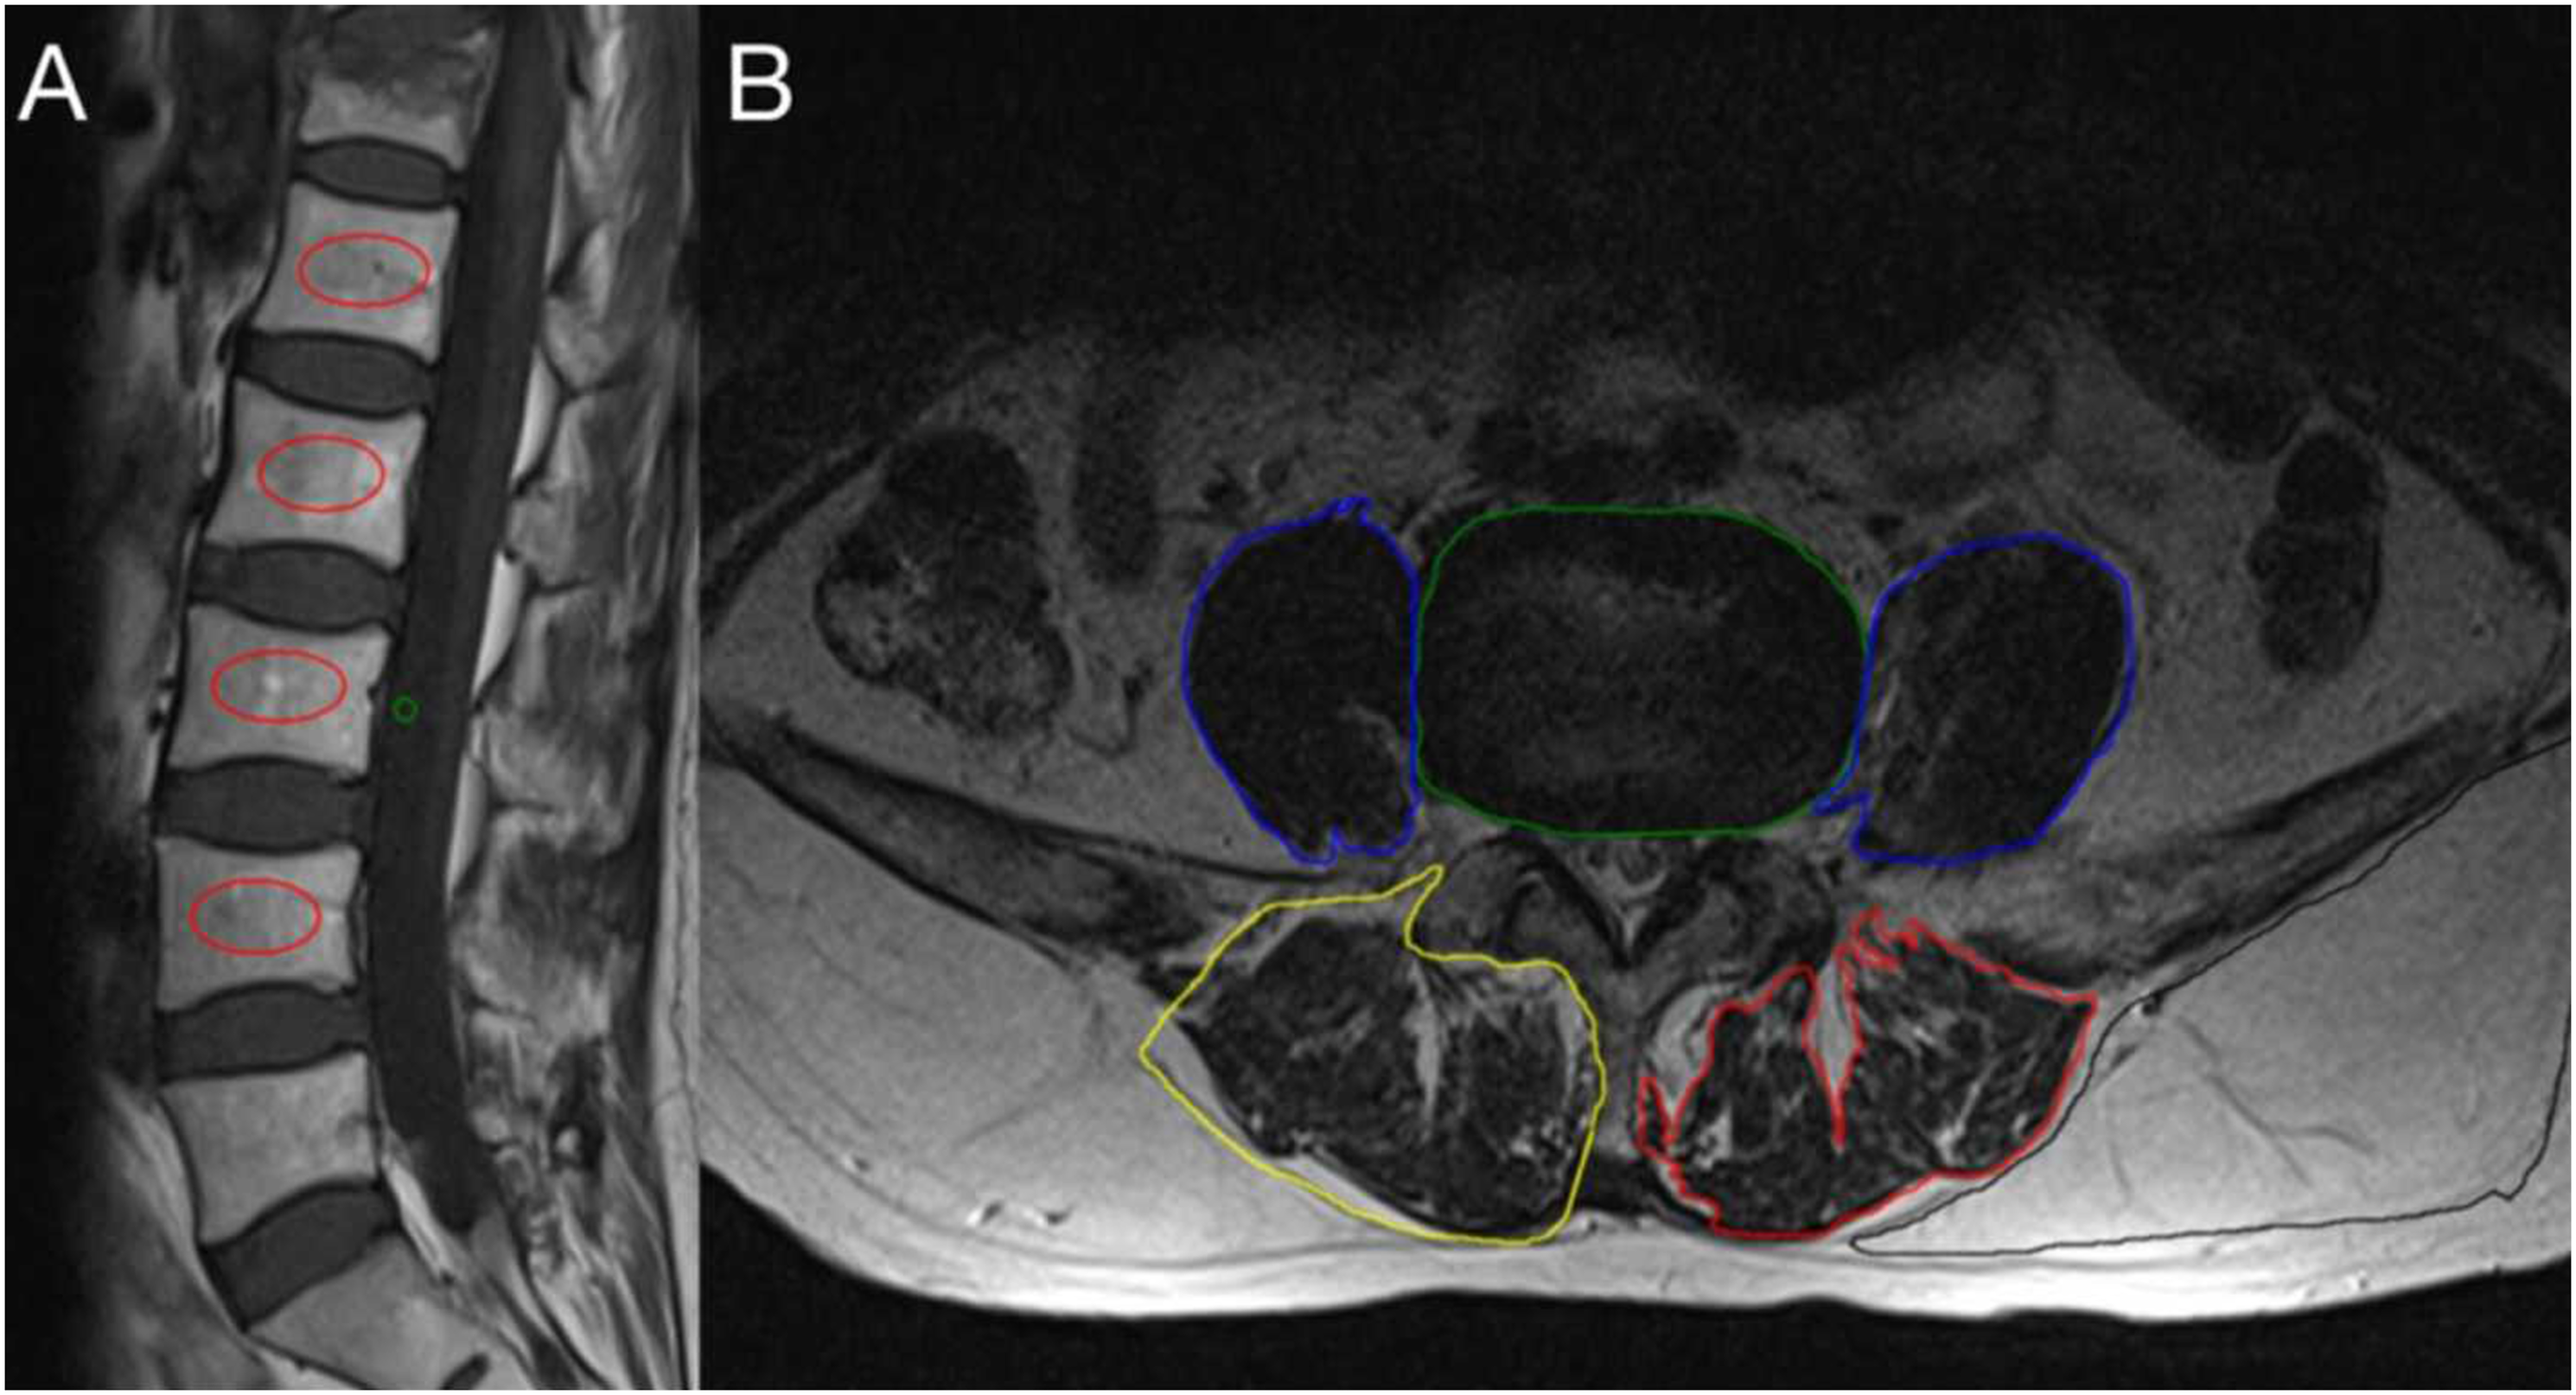
Analysis and Measurement Methods of Paraspinal Muscles
For the Analysis and Measurement Methods of Paraspinal Muscles, all lumbar MRI data in this study were obtained from our hospital’s Picture Archiving and Communication System (PACS). The paraspinal muscles analyzed included the psoas muscles (PS), erector spinae (ES), and multifidus (MF). Measurements and calculations were conducted on cross-sectional images of the L4-5 segments under T2-weighted signaling, ensuring each slice was parallel to its corresponding intervertebral disc. Adhering to the paraspinal muscle assessment methodology of Leng et al, 13 ROI were designated for the measurement of muscle parameters, which included collecting ROI-based cross-sectional area (CSA) and average T2 signal values. The parameters on each slice included the intervertebral disc (IVD), functional muscle(F), and gross muscle (G) of the PS, ES, and MF, as well as subcutaneous fat (SF). To minimize the impact of body habitus on muscle parameters, the ratio of the CSA of the muscle to that of the disc at the same level (rCSA) was introduced (Figure 1(b)).
The muscle-fat index (MFI), defined as the ratio of T2 signal intensity of muscle to that of fat at the same level, was also introduced, as described in the studies by Kim et al.14,15 The rCSA and MFI were measured as rGCSA, rFCSA, GMFI, and FMFI. The muscle ratio was calculated as rFCSA/rGCSA, representing the proportion of functional muscle.
Statistical Analysis
In this study, univariate and binary logistic regression analyses were conducted using SPSS software version 26.0 (IBM Corporation, USA). A P-value of less than 0.05 was deemed statistically significant. Quantitative data were presented as mean ± standard deviation (x ± s) and analyzed using the independent samples t-test for normally distributed data and the Mann-Whitney U test for non-normally distributed data. Variables demonstrating statistical significance in univariate analysis were subsequently included in the binary logistic regression analysis to determine odds ratios (OR) and 95% confidence intervals (CI). The Receiver Operating Characteristic (ROC) curves of independent risk factors were plotted using MedCalc software version 20.0.22, calculating the AUC. A nomogram was developed using R programming software version 4.2.2 to establish a predictive model. The model’s predictive performance, goodness-of-fit, and clinical utility for the training set, testing set, and validation population were statistically evaluated using the Concordance Index (C-index), Calibration Curve (CC), and Decision Curve Analysis (DCA). The Intraclass Correlation Coefficient (ICC) for the intra- and inter-reader reliability of measurement parameters was calculated using a two-way random model with absolute agreement and single measures.
Results
Demographic Characteristics of the Model Population and the Validation Population.
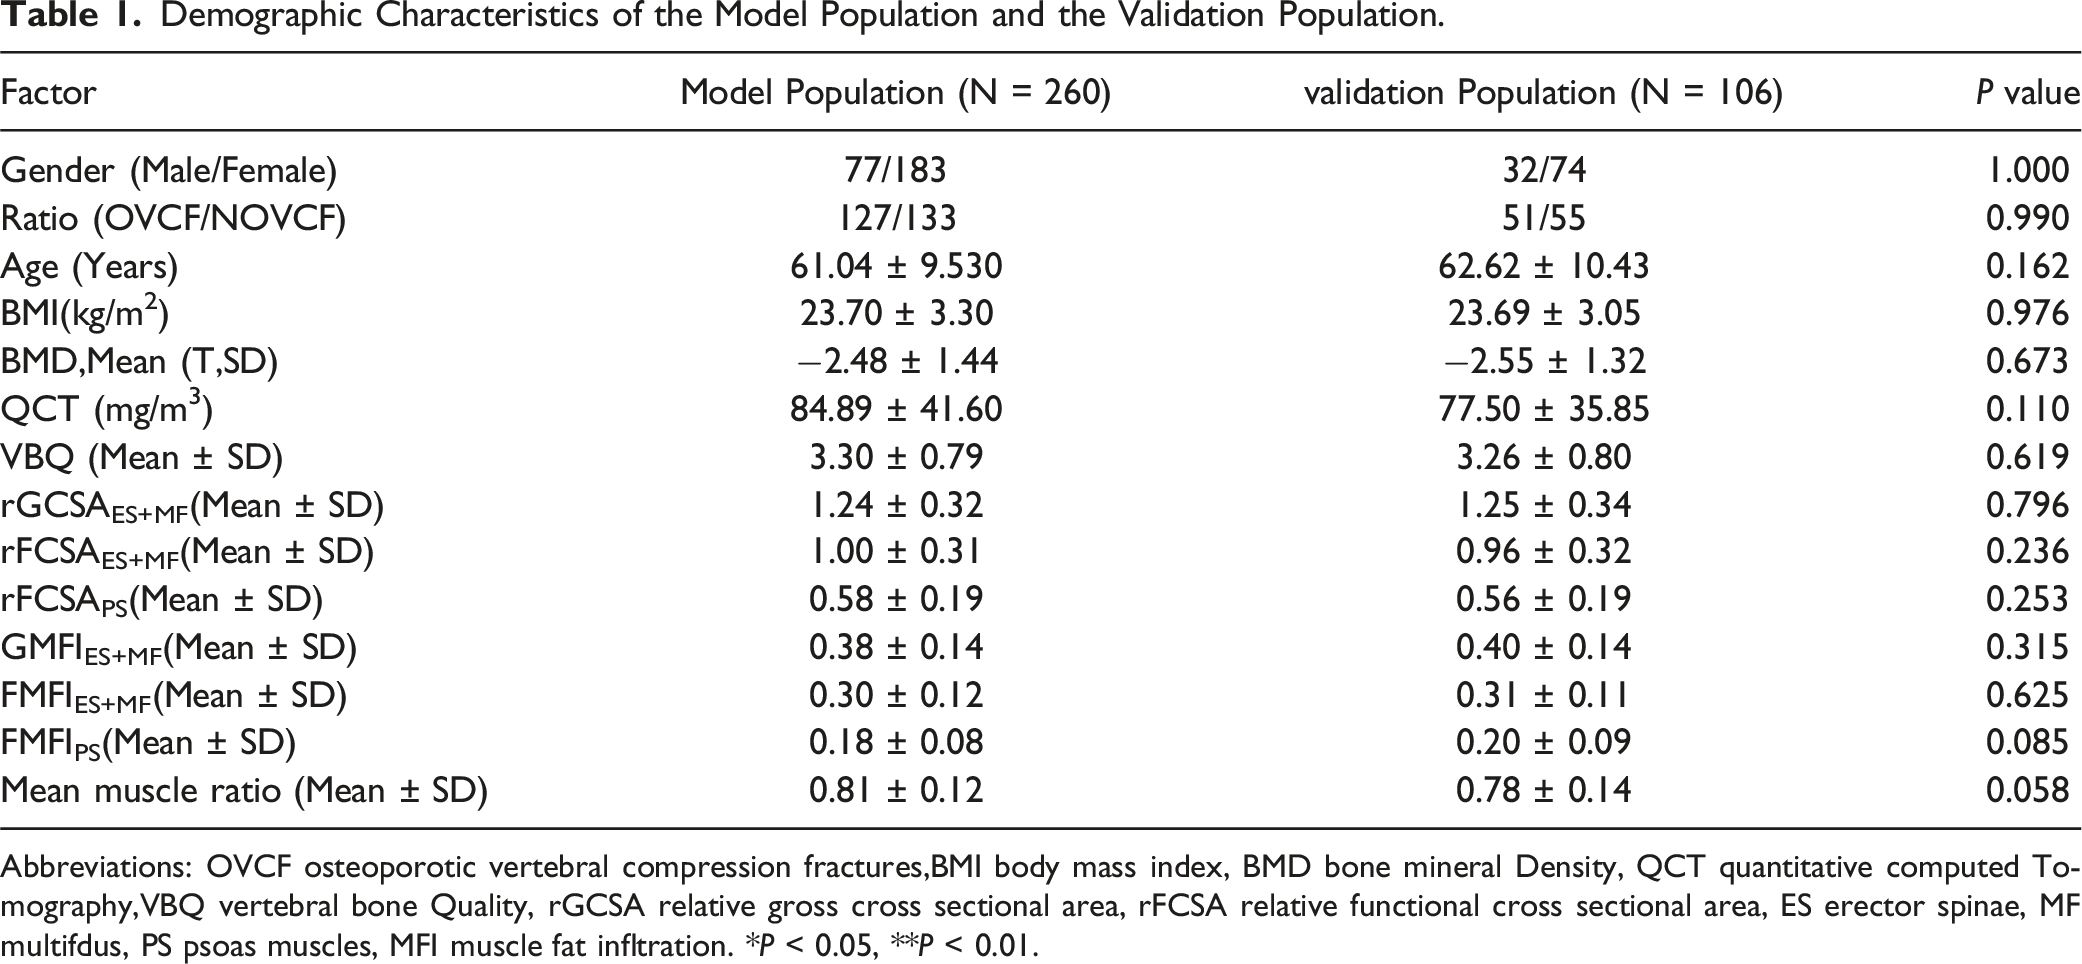
Abbreviations: OVCF osteoporotic vertebral compression fractures,BMI body mass index, BMD bone mineral Density, QCT quantitative computed Tomography,VBQ vertebral bone Quality, rGCSA relative gross cross sectional area, rFCSA relative functional cross sectional area, ES erector spinae, MF multifdus, PS psoas muscles, MFI muscle fat infltration. *P < 0.05, **P < 0.01.
Demographic Characteristics of the Training set and the Testing set.
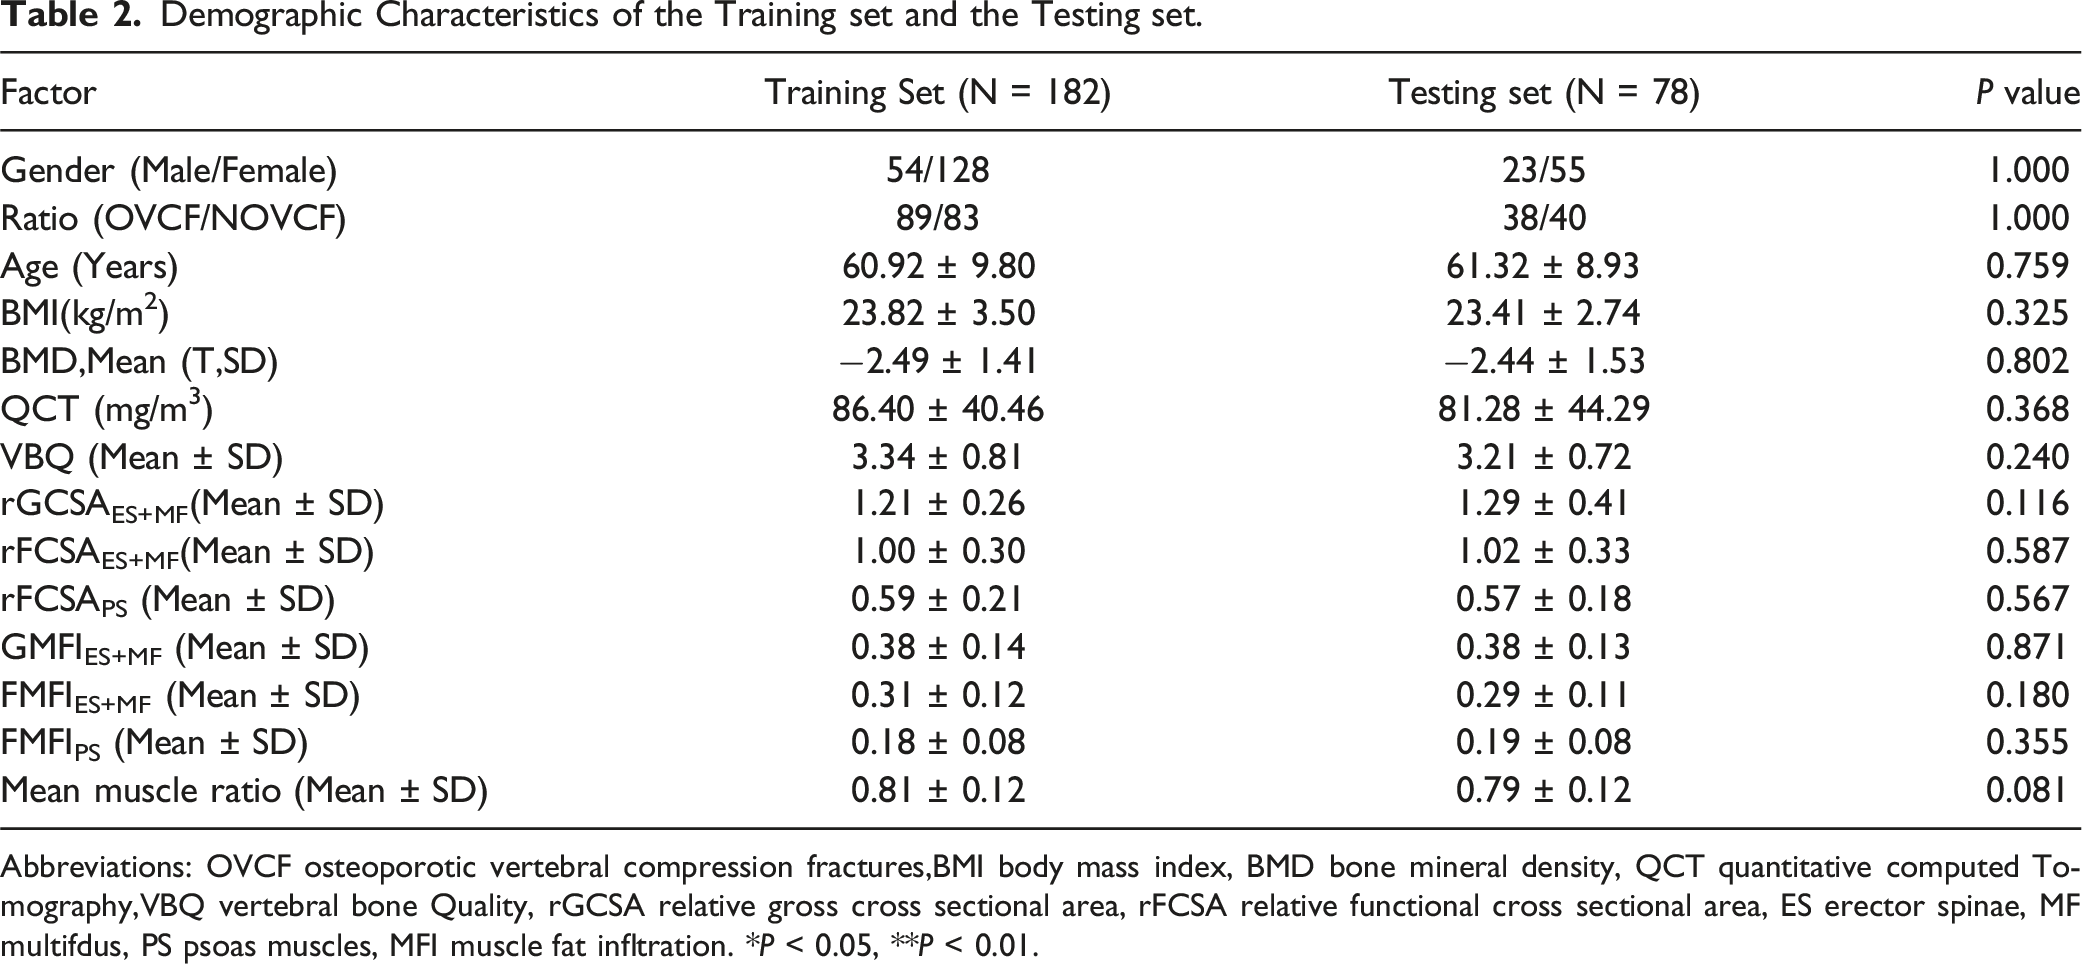
Abbreviations: OVCF osteoporotic vertebral compression fractures,BMI body mass index, BMD bone mineral density, QCT quantitative computed Tomography,VBQ vertebral bone Quality, rGCSA relative gross cross sectional area, rFCSA relative functional cross sectional area, ES erector spinae, MF multifdus, PS psoas muscles, MFI muscle fat infltration. *P < 0.05, **P < 0.01.
Demographic Characteristics in the Training Set.
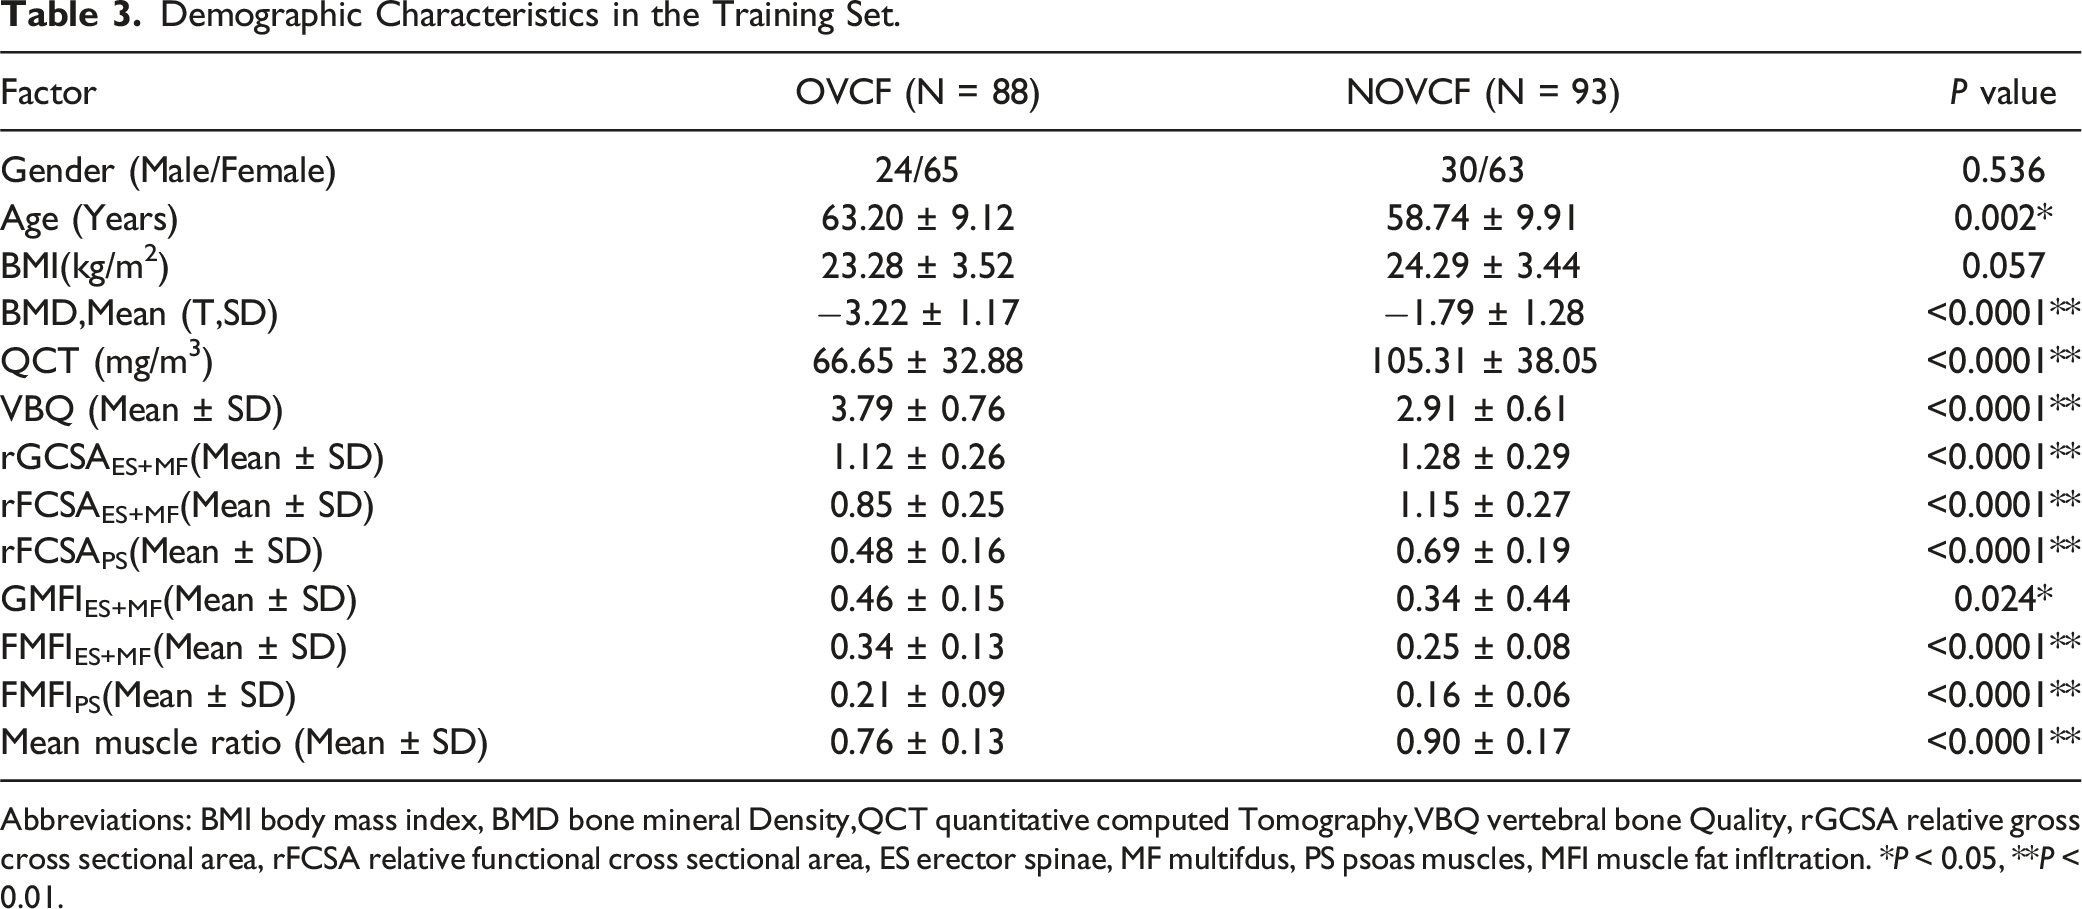
Abbreviations: BMI body mass index, BMD bone mineral Density,QCT quantitative computed Tomography,VBQ vertebral bone Quality, rGCSA relative gross cross sectional area, rFCSA relative functional cross sectional area, ES erector spinae, MF multifdus, PS psoas muscles, MFI muscle fat infltration. *P < 0.05, **P < 0.01.
Colinearity Diagnostic.
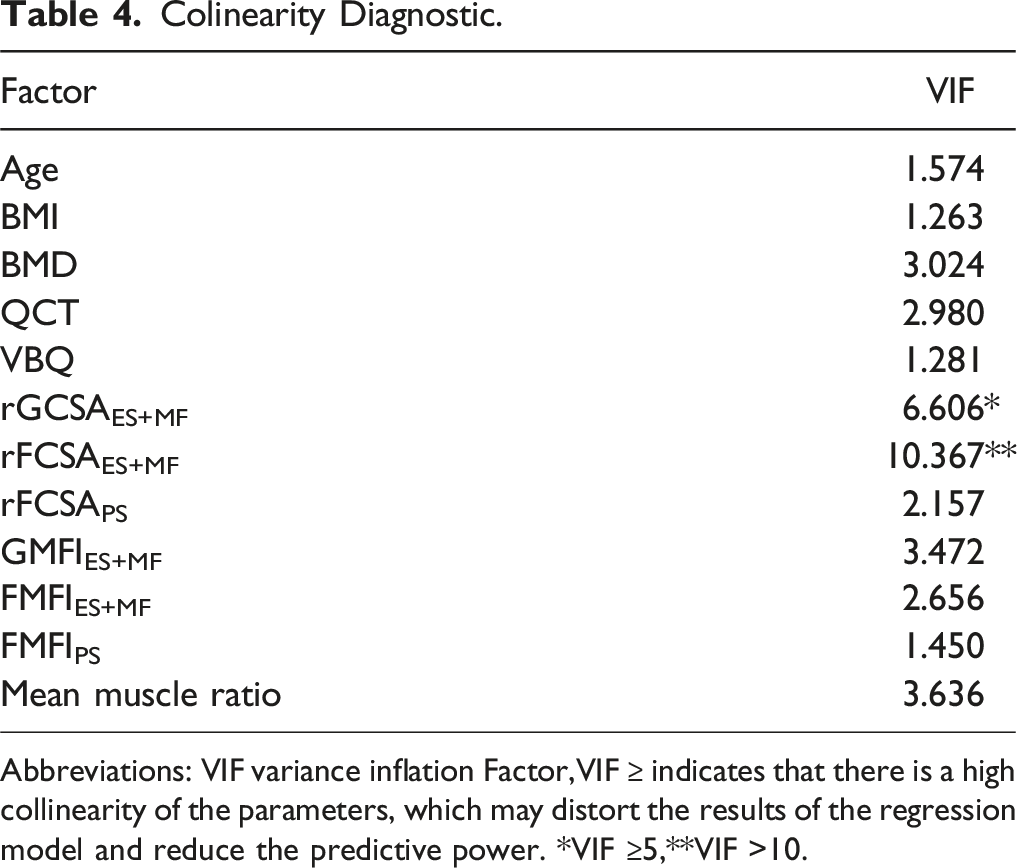
Abbreviations: VIF variance inflation Factor,VIF ≥ indicates that there is a high collinearity of the parameters, which may distort the results of the regression model and reduce the predictive power. *VIF ≥5,**VIF >10.
Binary Logistic Analysis of Risk Factors of OVCF.
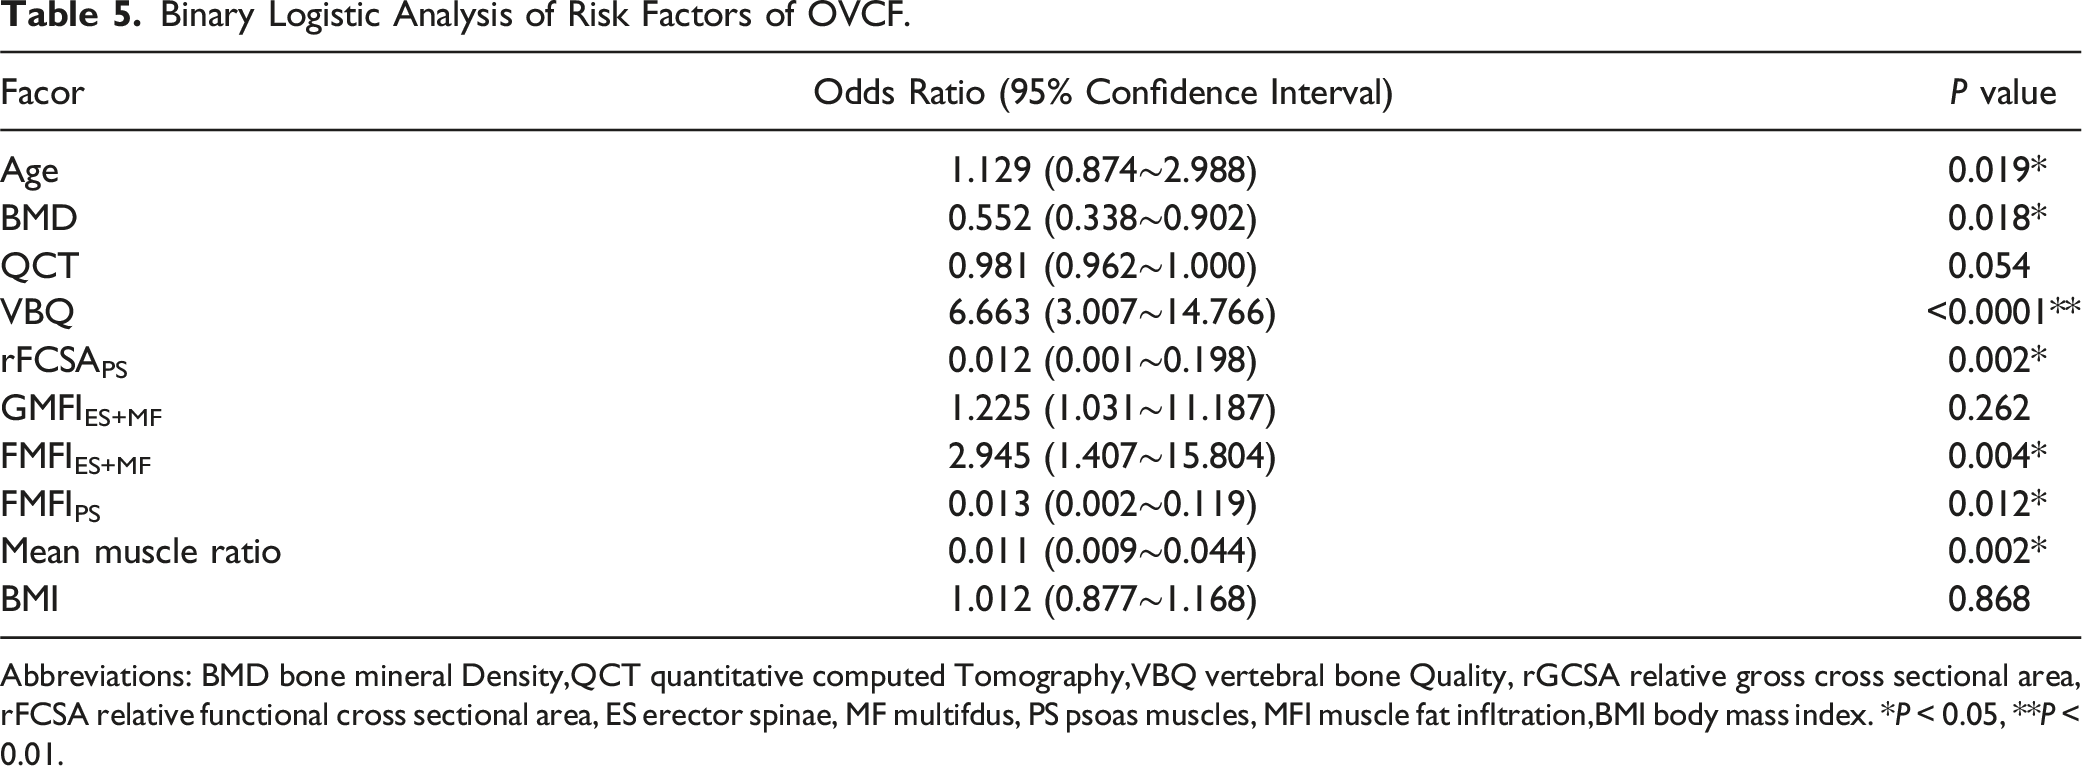
Abbreviations: BMD bone mineral Density,QCT quantitative computed Tomography,VBQ vertebral bone Quality, rGCSA relative gross cross sectional area, rFCSA relative functional cross sectional area, ES erector spinae, MF multifdus, PS psoas muscles, MFI muscle fat infltration,BMI body mass index. *P < 0.05, **P < 0.01.
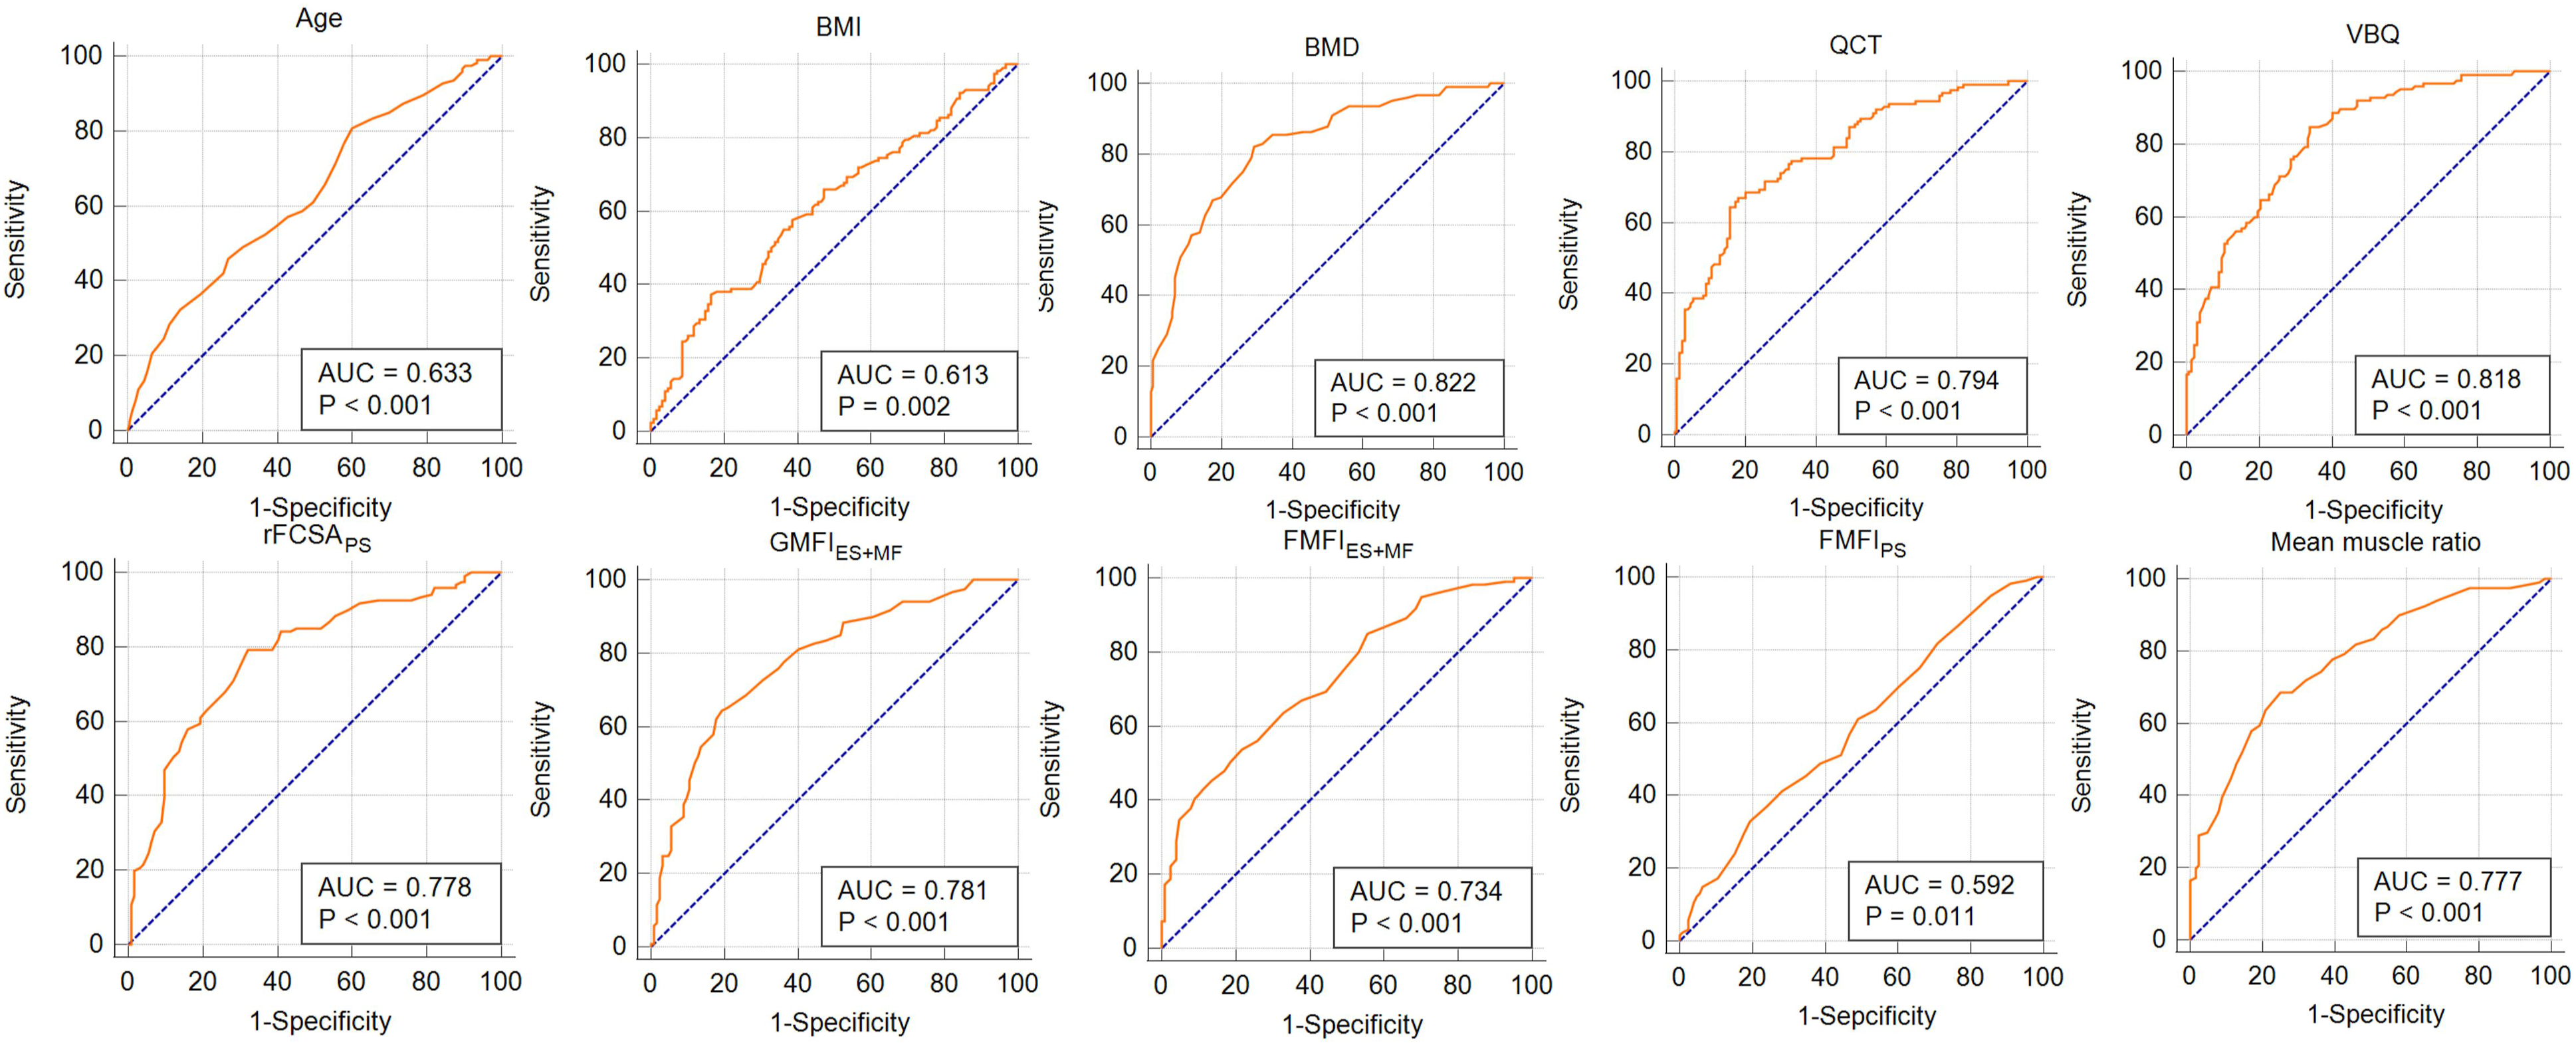
ROC curves for risk factors.
Intra-rater and Inter-rater Reliability of Intraclass Correlation Coefcient.
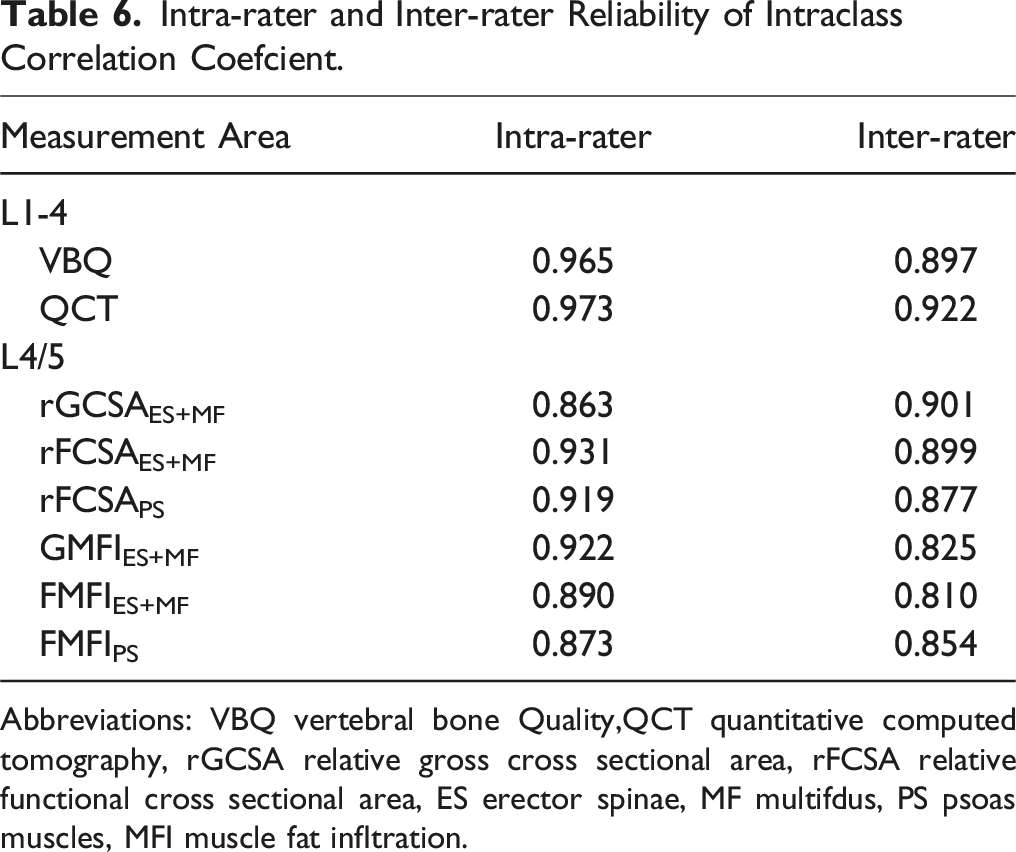
Abbreviations: VBQ vertebral bone Quality,QCT quantitative computed tomography, rGCSA relative gross cross sectional area, rFCSA relative functional cross sectional area, ES erector spinae, MF multifdus, PS psoas muscles, MFI muscle fat infltration.
Establishment and Validation of the Nomogram Prediction Model
The predictive model developed in this study, represented as a nomogram (Figure 3), was derived from the results of the binary logistic regression analysis. The nomogram incorporates parameters including age (20-80 years, scoring 0-47 points), BMD (1.5 to −6 SD, scoring 0-47 points), QCT (0-220 mg/m3, scoring 21-0 points), VBQ (0-6.5, scoring 0-100 points), rFCSAPS (0-1.2, scoring 44-0 points), GMFIES+MF (0.1-0.85, scoring 0-41 points), FMFIES+MF (0-0.9, scoring 0-32 points), FMFIPS (0.05-0.5, scoring 0-44 points), and mean muscle ratio (0.2-1, scoring 41-0 points), with total points ranging from 155 to 232 corresponding to a risk of 0.01 to 0.99. A nomogram for predicting the occurrence of osteoporotic vertebral compression fractures (OVCF) in middle-aged and elderly patients. Each independent risk factor is matched to its corresponding points range based on its value interval. The total points are calculated by summing the corresponding values of all independent risk factors, which then correspond to the risk probability indicated on the bottom row of the diagram.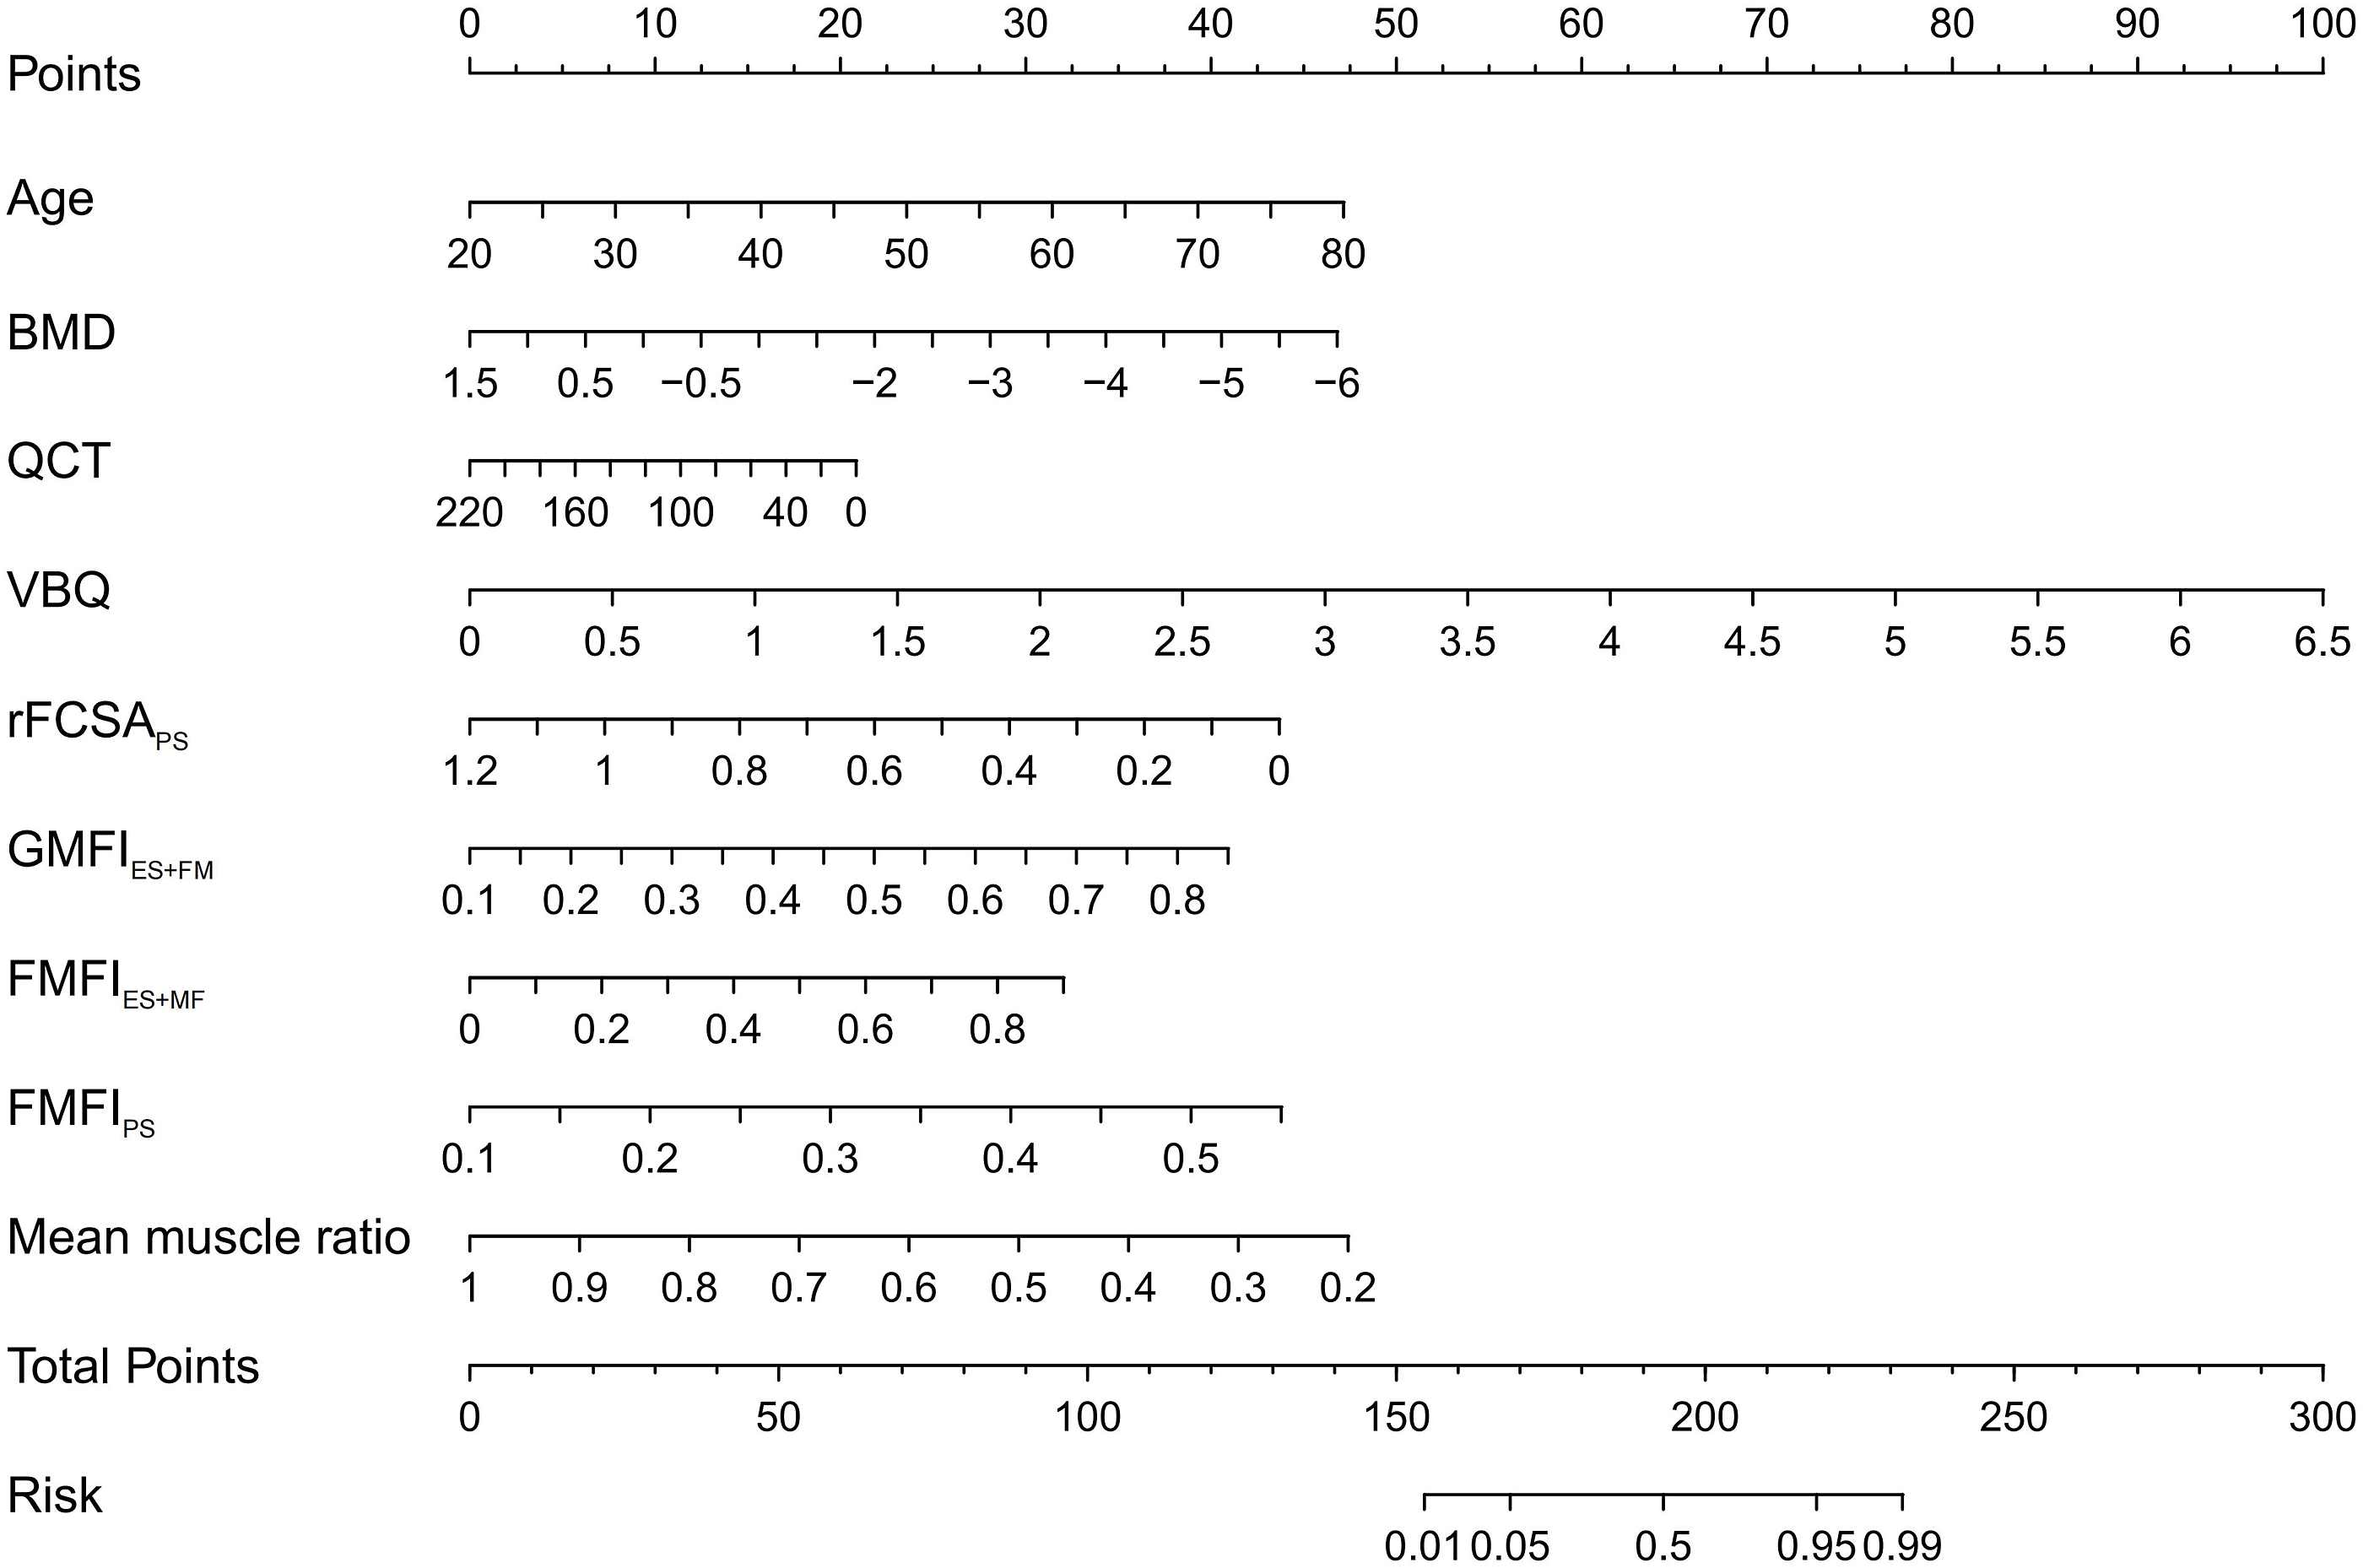
The validation of the model was comprehensively achieved through the C-index, calibration Curves, and DCA. The C-index, a measure of the model’s predictive accuracy, was notably high for the training set at 0.91, underscoring the model’s efficiency and precision. In the testing set and validation population, the C-index values were 0.90 and 0.92, respectively, as illustrated in Figure 4. These values indicate a robust predictive capability across different sample sets. Comparison of the C-index among the training set (a), testing set (b), and validation population (c).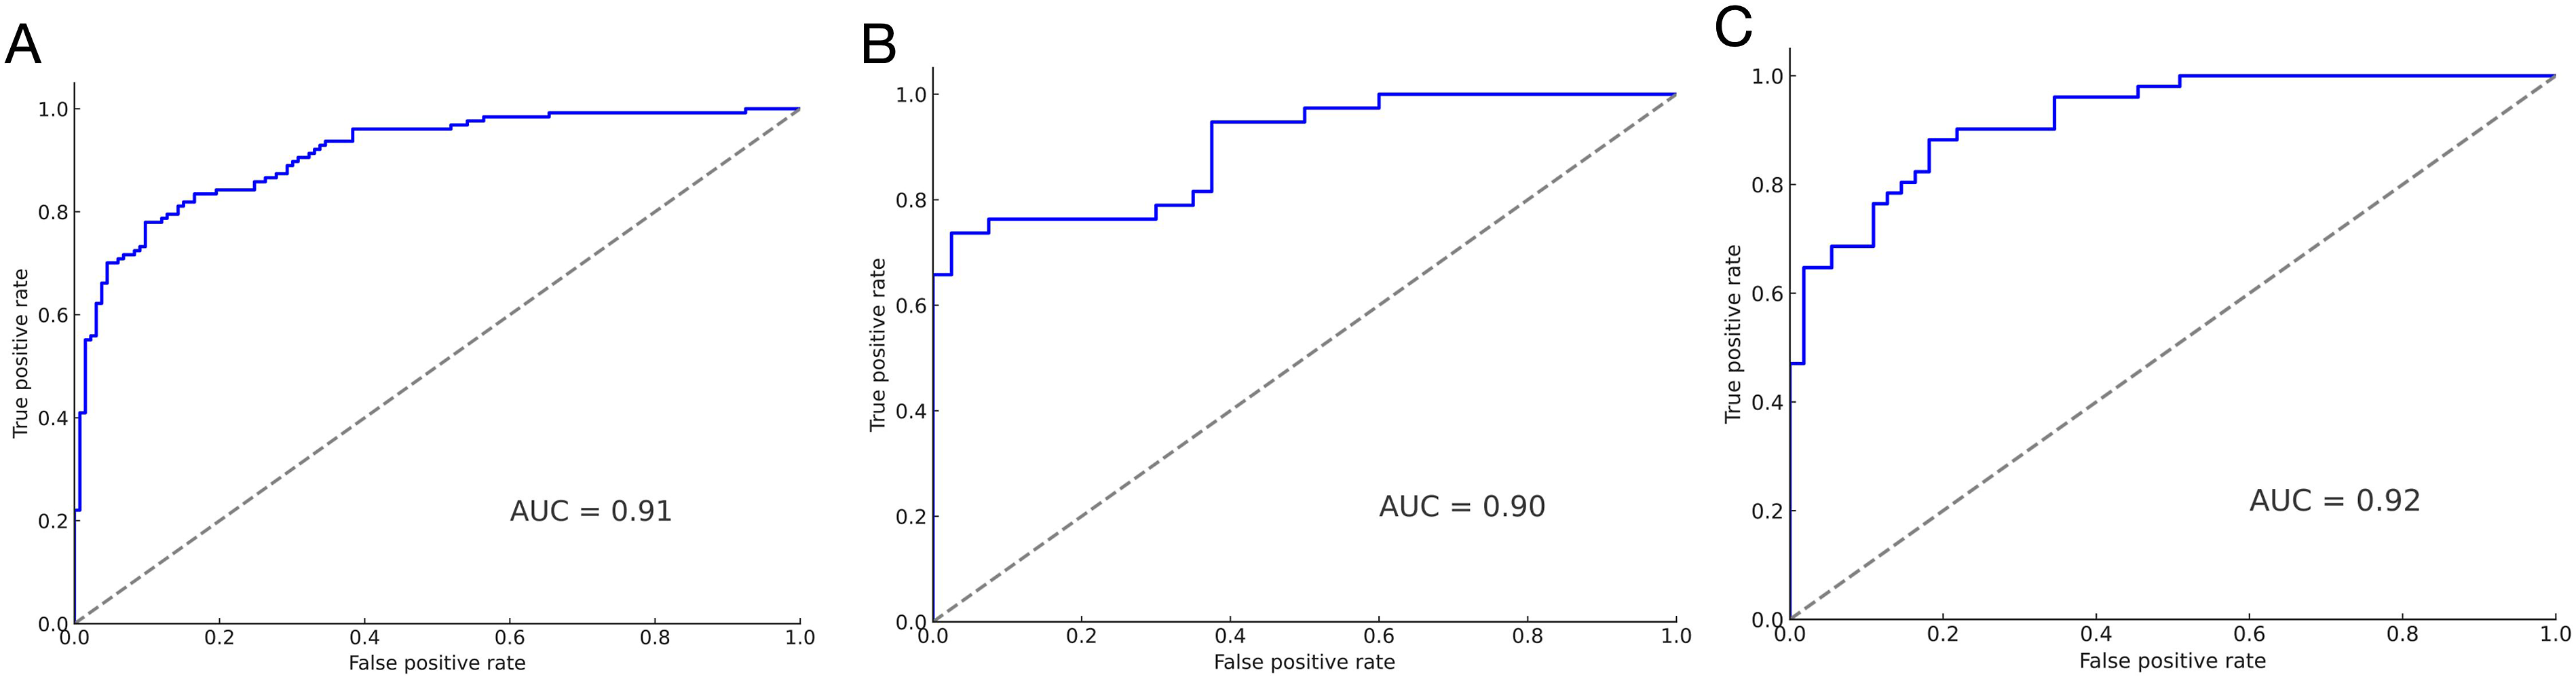
The calibration test results, depicted in Figure 5, demonstrated good agreement between the predicted and observed outcomes across all three datasets. This consistency highlights the model’s reliability in different application scenarios. Comparison of calibration curves among the training set (a), testing set (b), and validation population (c), demonstrating the consistency of the model across these groups.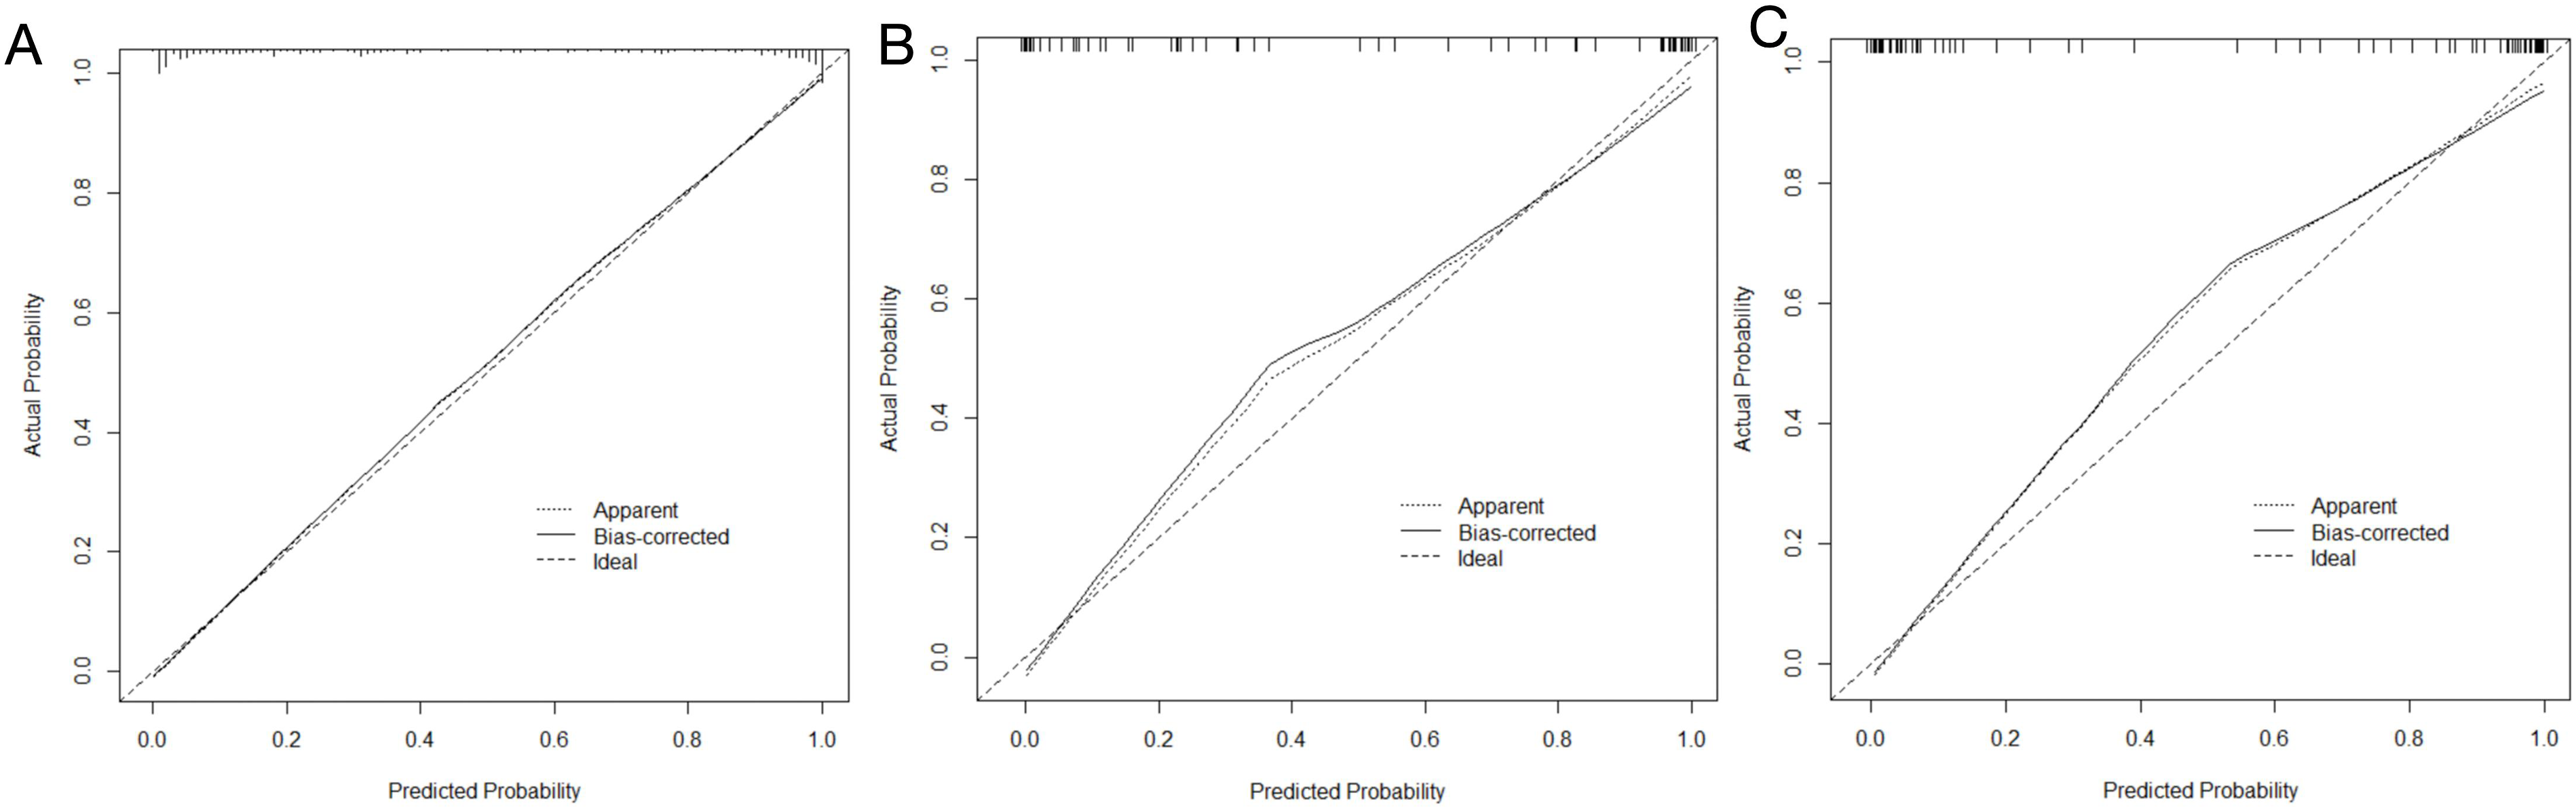
Most significantly, the DCA, shown in Figure 6, revealed that the nomogram serves as an effective clinical tool for predicting OVCF. Its utility is particularly pronounced when the threshold probability is set within the 0%-99% range. This range of applicability underscores the model’s versatility and practical utility in diverse clinical settings, facilitating decision-making processes in patient management and treatment strategies. presents a comparison of the DCA for the training set (a), testing set (b), and validation population (c).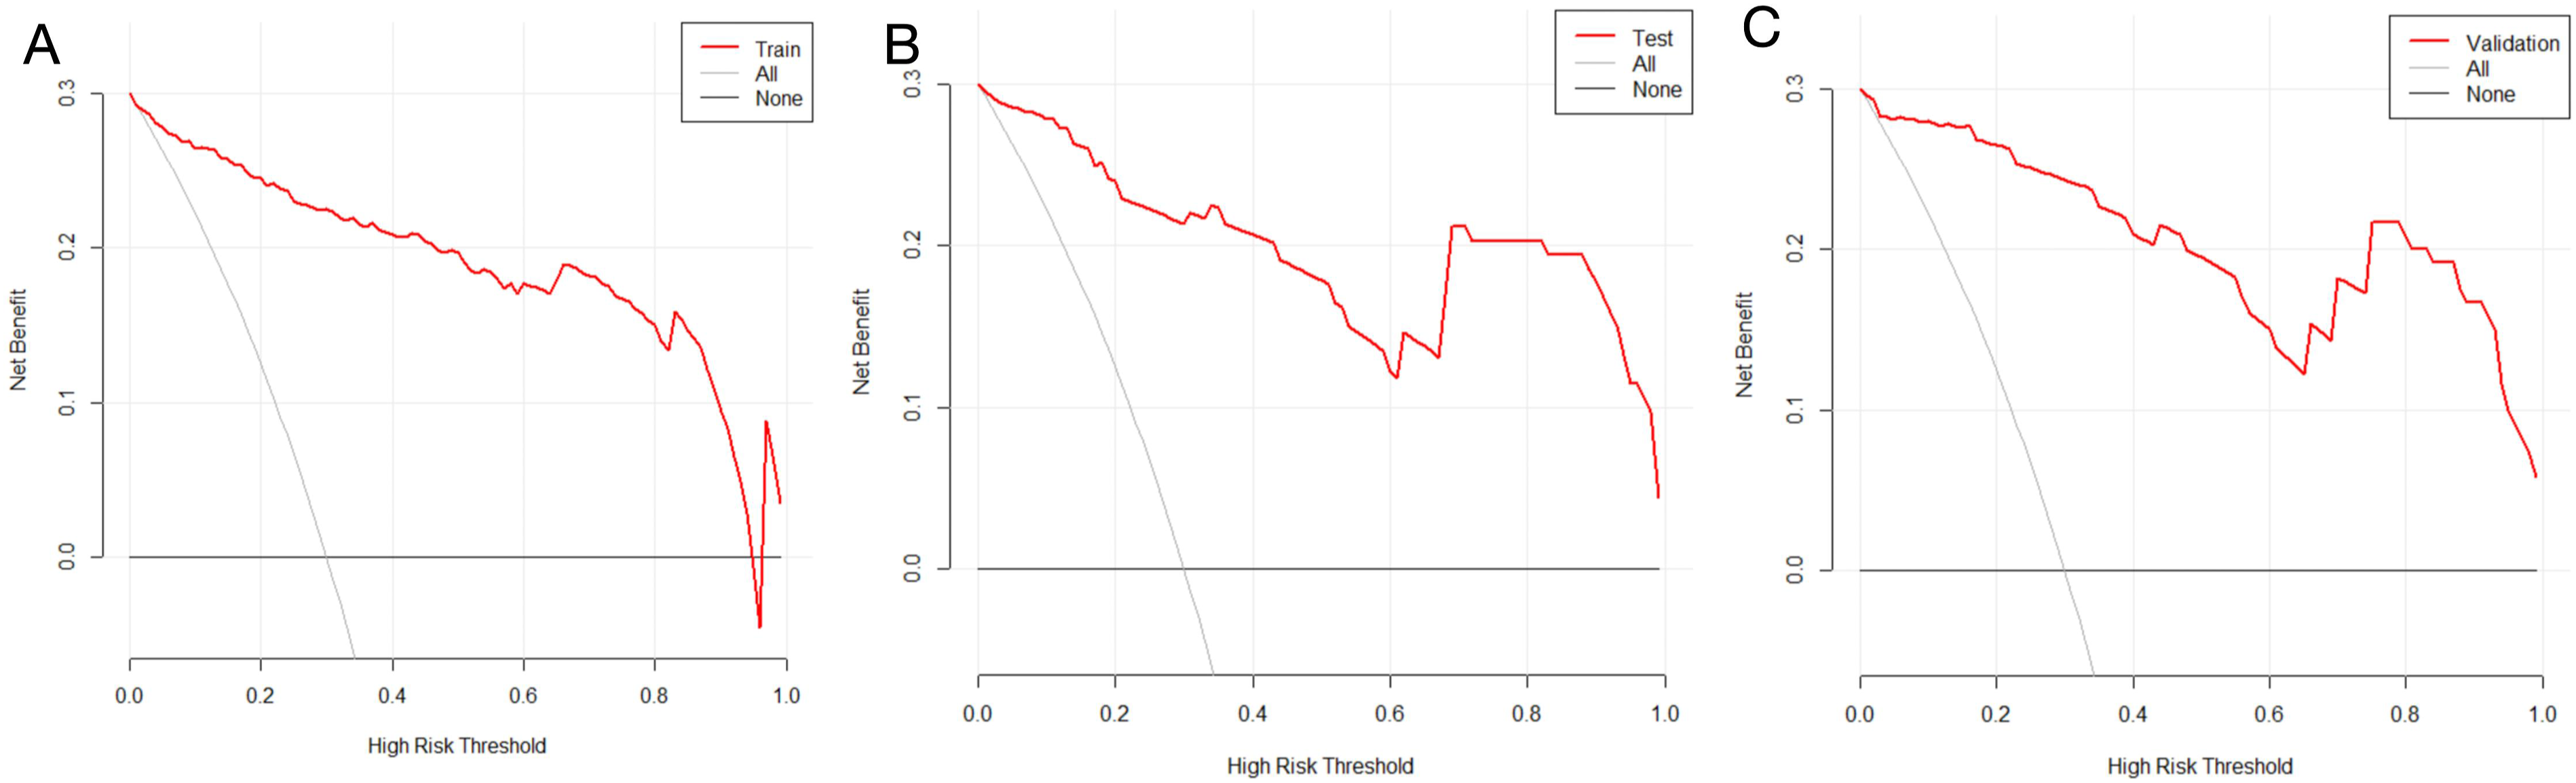
In summary, the high C-index values, consistent calibration test outcomes, and the practical utility demonstrated by the DCA collectively affirm the reliability, accuracy, and clinical relevance of the nomogram in predicting OVCF.
Discussion
The musculoskeletal system, crucial for spinal motion and postural maintenance, consists predominantly of vertebrae and paraspinal muscles. 16 Bone strength, pivotal for skeletal health, is commonly evaluated using areal bone mineral density (BMD), trabecular volumetric bone density (QCT), and vertebral bone quality (VBQ).17,18 Paraspinal muscle strength is vital for maintaining spinal alignment and mitigating stress on fragile bones. 19 We hypothesize that with advancing age, a decline in musculoskeletal system strength contributes to a higher incidence of OVCF. Building on prior research, our study adopts a comprehensive approach, integrating factors like age, BMD, QCT, VBQ, rFCSAPS, GMFIES+MF, FMFIES+MF, FMFIPS, and mean muscle ratio. We established a nomogram predictive model, particularly for the elderly population. Its predictive efficiency, consistency, and clinical utility were evaluated using the C-index, consistency Curves, and DCA. Results demonstrate the model’s high predictive efficiency (Testing set AUC = 0.91) and its good model fit and clinical utility.
Current evidence indicates that paraspinal muscle degeneration, marked by increased fat infiltration and diminished muscle cross-sectional area, is an independent risk factor for OVCF.20,21 Research by Zhao et al. found significant higher fat infiltration in ES, MF, and PS in osteoporotic patients compared to those with osteopenia or normal bone mass. 22 This could be attributed to the decline in muscle quality and function due to increased fat infiltration and reduced muscle size, resulting in decreased mechanical loading on bones. Our study also identified rGCSAPS, mean muscle ratio, GMFIES+MF, FMFIES+MF, and FMFIPS as independent risk factors for OVCF, prominently featured in the nomogram. While previous research suggests that BMI is a protective factor against OVCF.7,23 our study reveals elevated fat infiltration in paraspinal muscles as an independent risk factor. We propose that this increased rate of fat infiltration in paraspinal muscles not only reduces the overall strength of the musculoskeletal system but also significantly escalates the risk of falls, leading to a higher incidence of OVCF.
Clinically, the Fracture Risk Assessment Tool (FRAX) questionnaire, developed by the World Health Organization (WHO), is widely used for predicting osteoporotic fractures.7,24 FRAX, incorporating various risk factors like age, gender, personal and family fracture history, does not necessitate bone density measurements, offering the convenience of usage. 25 However, FRAX, developed based on specific population data, has limited applicability across diverse ethnicities and regions. Additionally, its simplistic composition of risk factors results in suboptimal predictive efficiency.26,27 Consequently, scholars have shifted focus towards developing specific predictive models for OVCF. For instance, Bian et al. constructed a nomogram model for post-percutaneous kyphoplasty (PKP) fractures in OVCF patients using parameters like age, CT HU, and cement leakage. 28 Si et al. developed a nomogram for predicting post-percutaneous vertebroplasty (PVP) fractures in OVCF patients, based on parameters like paraspinal muscle area and fat infiltration. 29 Our study, building on these foundations, integrates the most sensitive parameters for assessing vertebrae and paraspinal muscles to establish a predictive model with high efficiency, consistency, and practical clinical utility.
Currently, artificial intelligence (AI) technology is still emerging in the field of osteoporosis. 30 With the rapid advancement of AI and deep learning techniques, some scholars have begun combining AI with medical predictive modeling.31,32 Employing deep learning for extensive clinical data analysis, AI aids in disease diagnosis, reducing manual errors, and enhancing clinical diagnosis accuracy. 33 The primary AI deep learning types include Convolutional Neural Networks (CNNs) and Recurrent Neural Networks (RNNs). 34 AI, through deep neural network learning, can provide more accurate diagnostic conclusions, predicting incidence, severity of complications, disease progression, and outcomes. Research has shown that CNN-assisted clinical diagnoses surpass traditional manual methods and classic clinical approaches. 35 In the future, we plan to explore integrating AI with deep learning of spinal imaging data to develop a more robust musculoskeletal assessment system and predictive model.
Our study has several limitations. Being a single-center study with a relatively short follow-up period and limited case numbers, it underscores the need for larger, multi-center prospective randomized controlled clinical trials to establish a more efficient predictive model.
In summary, our study, leveraging the extensive research experience of numerous scholars, has integrated nine parameters—age, BMD, QCT, VBQ, rFCSAPS, GMFIES+MF, FMFIES+MF, FMFIPS, and mean muscle ratio—to construct a nomogram. This integration has culminated in the development of a novel OVCF predictive model. Characterized by its high predictive efficiency and substantial clinical utility, this model is particularly well-suited for the elderly population.
Footnotes
Author Contributions
SW designed the study. XZ and JYZ performed the measurements. XZ, JYZ and GLC performed the analysis. SW and JYZ wrote the manuscript, and GLJ, SLP revised it. All authors discussed the results and commented on the manuscript. The author(s) read and approved the final manuscript.
Declaration of conflicting interests
The author(s) declared no potential conflicts of interest with respect to the research, authorship, and/or publication of this article.
Funding
The authors disclosed receipt of the following financial support for the research, authorship, and/or publication of this article: This work was supported by National Nature Science Foundation of China (Grant number: 82272488) and Natural Science Foundation of Guangdong Province (2024A1515012790).