
Abstract
Study Design
Descriptive.
Objectives
Trabecular bone in the vertebrae is critical for the distribution of load and stress throughout the neuroaxis, as well as the intervertebral disk, ligamentous complex, and facet joints. The objective was to assess the stress and strain distribution of the L4-S1 spine segment by a finite element analysis.
Methods
A lumbosacral spine model was built based on a CT-Scan. Trabecular-to-cortical bone distribution, ligaments, intervertebral disk, and facet joints with cartilage were included. A perpendicular force was applied over the L4 upper terminal plate of 300 N, 460 N and 600 N in neutral, plus 5 Nm and 7.5 Nm for flexion and extension movements. Maximum principal stress and total deformation were the main studied variables.
Results
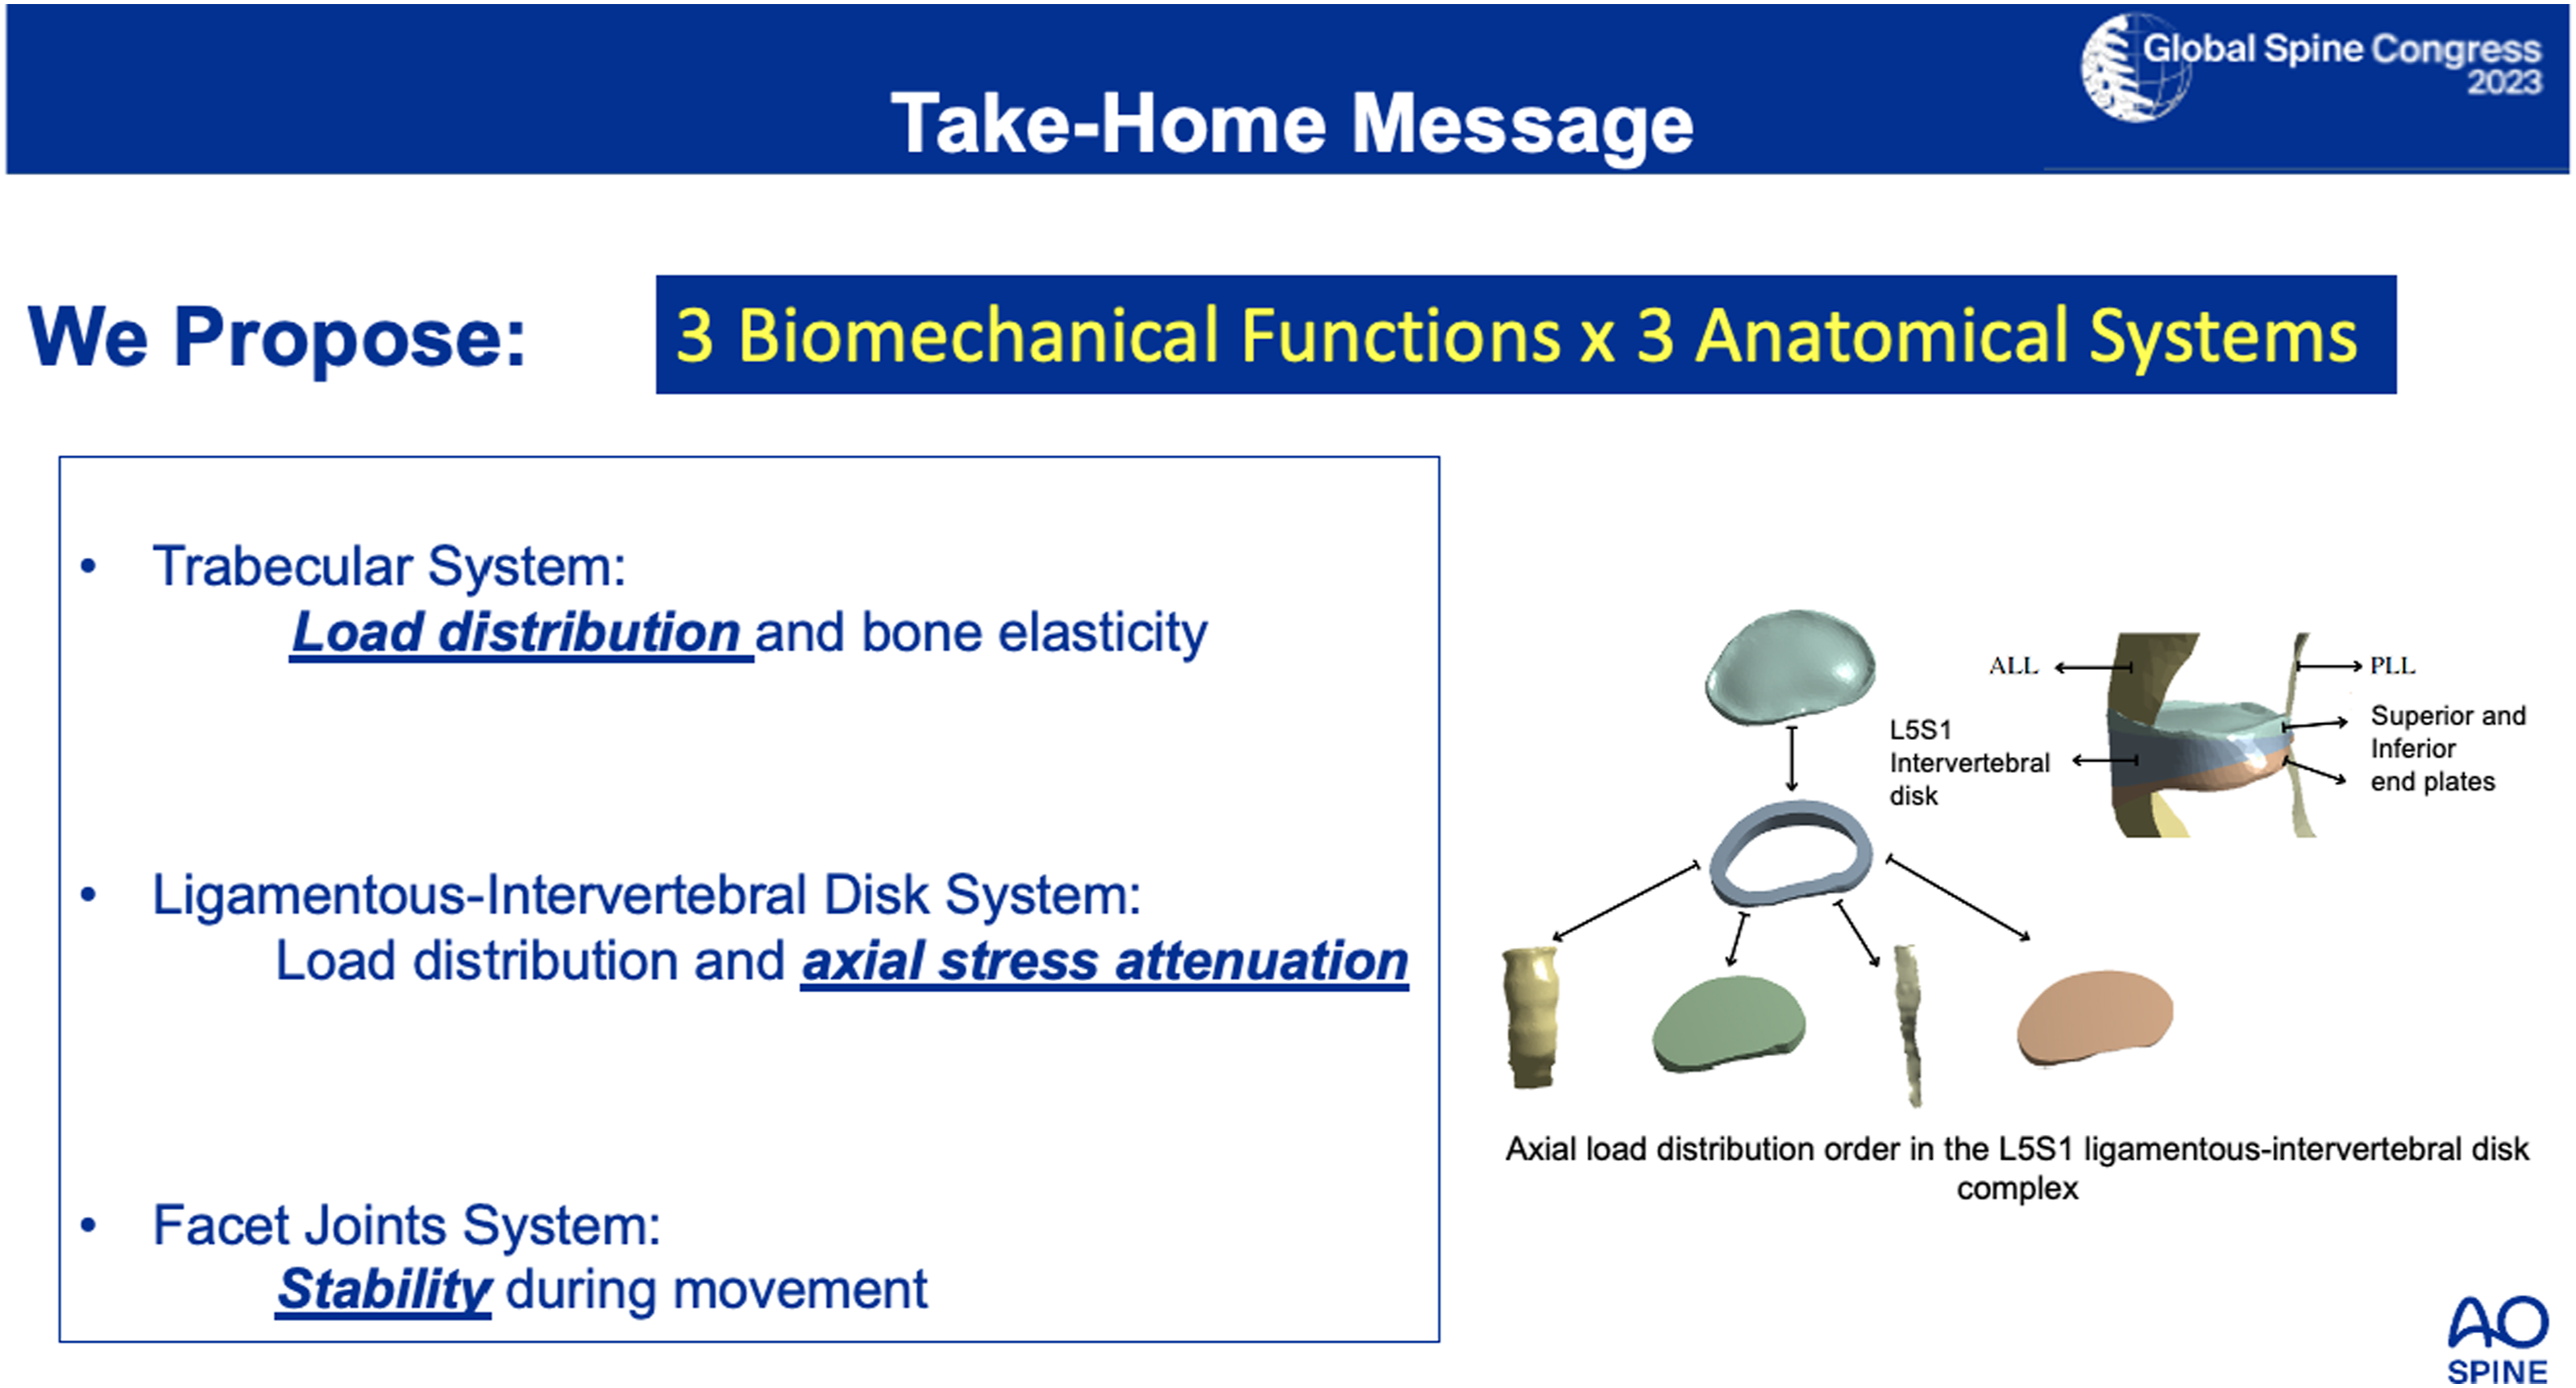
Trabecular bone confers resistance to axial loads on the vertebrae by elastic capacity and stress distribution. MPS and TD showed axial stress attenuation in the nucleus pulposus and longitudinal ligaments, as well as load distribution capacity. Facet joints and discontinuous ligaments showed greater TD values in flexion moments but greater MPS values in extension, conferring stability to the lumbosacral junction and axial load distribution.
Conclusion
We propose 3 anatomical systems for axial load distribution and stress attenuation in the lumbosacral junction. Trabecular bone distributes loads, while the ligamentous-intervertebral disk transmits and attenuate axial stress. Facet joints and discontinuous ligaments act as stabilizers for flexion and extension postures. Overall, the relationship between trabecular bone, ligamentous-intervertebral disk complex and facet joints is necessary for an efficient load distribution and segmental axial stress reduction.
This slide can be retrieved from the Global Spine Congress 2023.
Introduction
The spine is the anatomical structure responsible for bipedal standing posture and gait achieved by humans, providing support, stability, protection to the spinal cord and neurovascular structures, and flexibility to the body. 1 It consists of a series of interconnected vertebrae, with intervertebral disks, ligaments, facet joints and muscles that stabilizes the structure. 2
It can be divided into several regions with different biomechanical specific objectives, as the cervical spine provides flexibility for head movement, thoracic spine offers stability for rib cage attachment and load resistance while flexion, extension and rotation are the main lumbar spine movements. Finally, the sacrum and coccyx contribute to pelvic stability. 3
For these purposes, the functional unit of the spine composed by 2 adjacent vertebrae united by the intervertebral disk and facet joints, and stabilized by the ligamentous complex, must be preserved. The vertebrae are composed by trabecular bone encased by a cortical structure, in which the main biomechanical function is load transfer due to its ductile structure and framework for the highly cellular bone marrow inside, 4 as well as enough solid protection for neurovascular structures. 5 The intervertebral disk, composed by a stiff annulus fibrosus and a soft nucleus pulposus, serves as a shock-absorption structure while facilitating bending and rotation movements.6,7 The ligamentous complex comprises a series of longitudinal or continuous (ALL, PLL, SL) and interrupted (LF, ITL, ISL) structures, with a dense collagen arrangement that provides stabilization and load bearing capacity through each movement. 8 Finally, the facet joints are synovial structures composed by hyaline cartilage and a surrounding articular capsule intended for segmental stabilization, and their main biomechanical function is resistance to axial load and tensile stress during flexion, extension, and rotation movements. 9
As mentioned before, the anatomical basis and assembly for load distribution during neutral and dynamic posture is particularly complex. Because of this, biomechanical modeling allows the analysis of a mechanical system, that is, the mechanical response of tissues involved in the functioning of the spine during an applied force. A commonly used method, other than cadaveric models, to study the biomechanics of the human lumbar spine is the finite element analysis (FEA), 10 as it offers greater efficiency and lower cost compared to in vivo and in vitro tests.11,12 In the literature, reported models of the lumbar spine from L2 to L5 based on European, Asian, and North American populations can be found.13-15 The objective of these authors was to understand how bipedalism, flexion, and extension movements affect each of the tissues, focusing on variations in load distribution, intradiscal pressure, and other variables of interest in the lumbar region.14,16 Some studies have reported that the most important tissues when studying the lumbar spine are the nucleus pulposus and annulus, as pressures in these structures are associated with symptoms of low back pain and other spinal disorders.17,18 Other researchers have sought to develop a modeling methodology that is suitable for predicting the biomechanical behavior of the spine and how it can degenerate over time.11,19 There are also studies aiming to replicate the bone behavior in the lumbar region through computational models that consider the cortical and trabecular parts of the vertebrae, including the main ligaments activated during the studied movement.11,15
On the other hand, studies considering ligaments in the models have found 3 important findings: [1] these tissues maintain the elements of the spine in the correct position during movements, [2] ligaments help vertebral disks withstand the load to which the spine is subjected during movement, and [3] bipedalism has a greater effect on intradiscal elements, while in flexion and extension, ligaments help vertebral disks distribute the load more evenly throughout the tissues that make up the spine.15,16,18
The objective of this study was to assess the load and stress distribution of the L4-S1 vertebral segment by a finite element analysis in neutral, flexion, and extension positions, by describing and proposing the role of a novel trabecular, ligamentous-intervertebral disk and facet joints systems.
Materials and Methods
Obtaining Geometric Models
After research board approval by the Hospital Universitario de la Samaritana (meeting number 07-2020), CAD geometric model of a healthy lumbosacral junction (L4-S1) was obtained through the reconstruction of a computed tomography (CT) scan from an adult female volunteer without prior medical history. No informed consent was required due to the nature of the study (anonymous DICOM images) and with prior exempt from requirement by the research board. The medical images were previously reported as normal by an experienced radiologist. Materialise Mimics and Materialise 3-Matic software (Materialise, Leuven, Belgium) were used for the processing of the medical images.
The anatomic structures included in the model were the main components of the L4 and L5 vertebrae with trabecular-to-cortical bone distribution (the thickness of the cortical and trabecular bone was obtained through direct measurement on the CT scan – Figure 1), ligaments (anterior longitudinal, posterior longitudinal, supraspinous, interspinous, ligamentum flavum, and intertransverse), intervertebral disk with both nucleus pulposus and annulus fibrosus, and facet joints (FJ) with cartilage. As for the sacrum, it does not contain trabecular bone as this tissue was used as a fixed support. Spine muscle groups and lumbopelvic ligaments were not included in our model. The calculated values were corroborated with data reported in the literature.
20
Cortical and trabecular bone proportion based on L5 vertebra CT.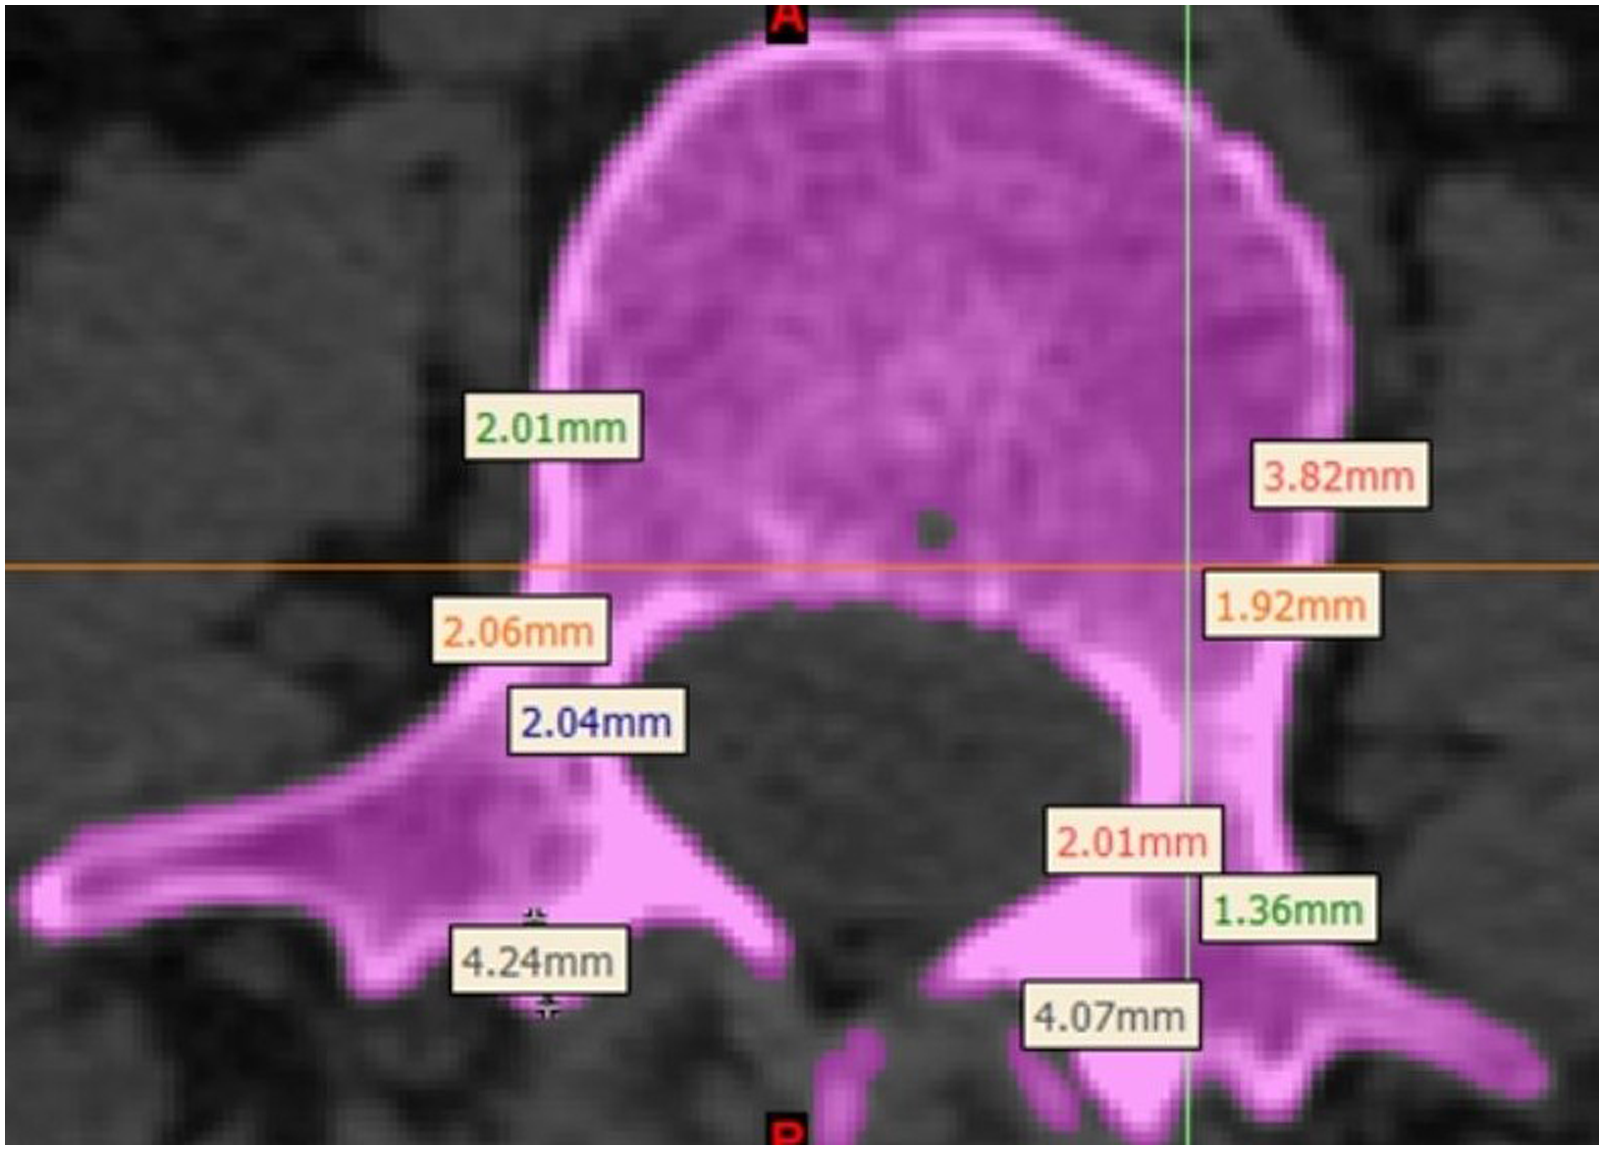
Subsequently, the reconstructed geometries were exported to Autodesk Inventor® software (Autodesk, California, USA), where disk segmentation was performed to obtain the nucleus pulposus, annulus, and endplates.
21
Figure 2 displays the assembly of the model from different views, illustrating its composition. All modeled vertebrae and vertebral rings are constituted of the same tissues, meaning that the vertebra has cortical and trabecular bone, and the vertebral rings are composed of the endplates, nucleus pulposus, and annulus. Lumbosacral spine model.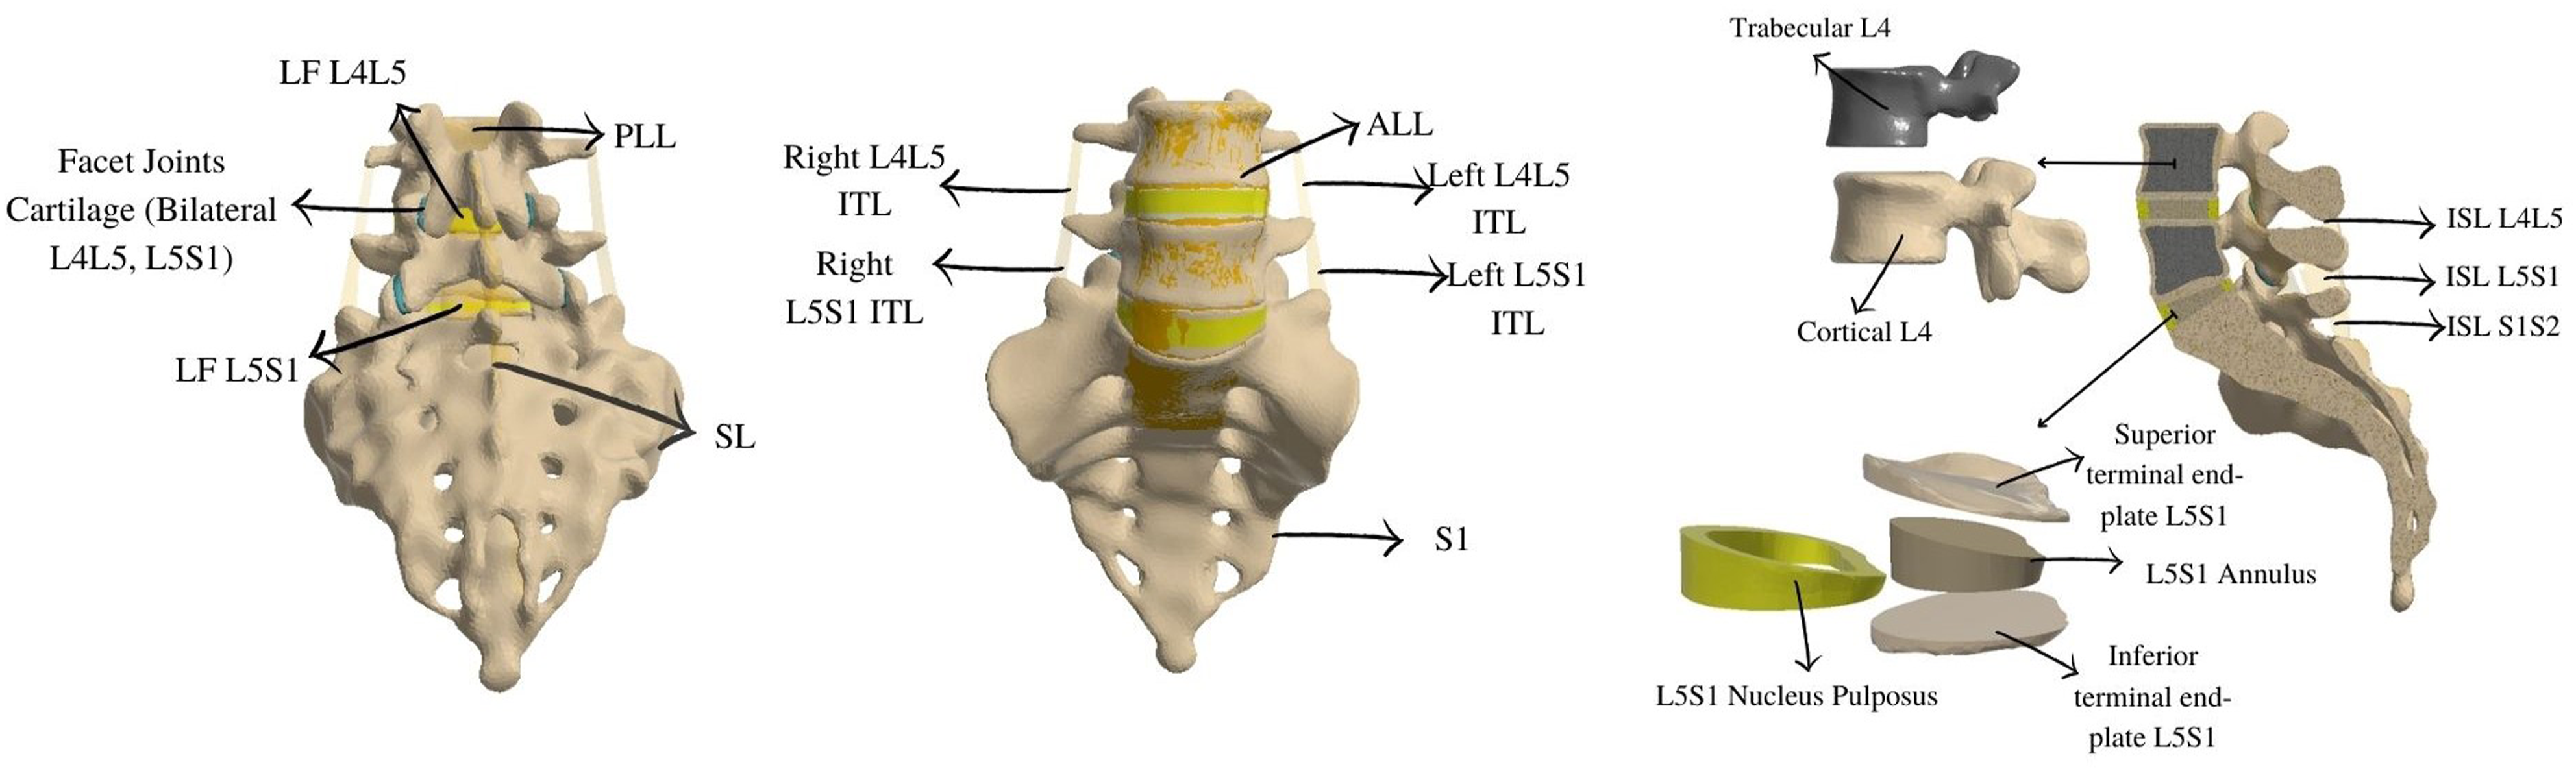
Finite Element Analysis
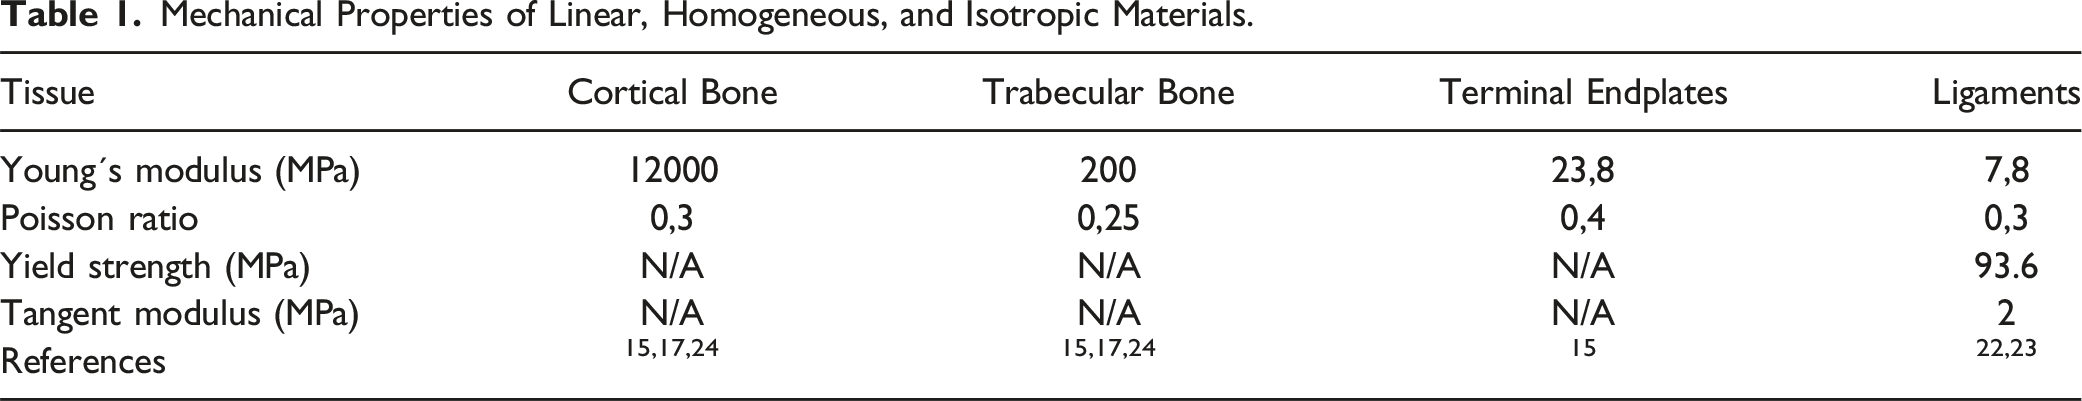
Mechanical Properties of Linear, Homogeneous, and Isotropic Materials.
Mechanical Properties of Non-linear and Hyperelastic Materials.
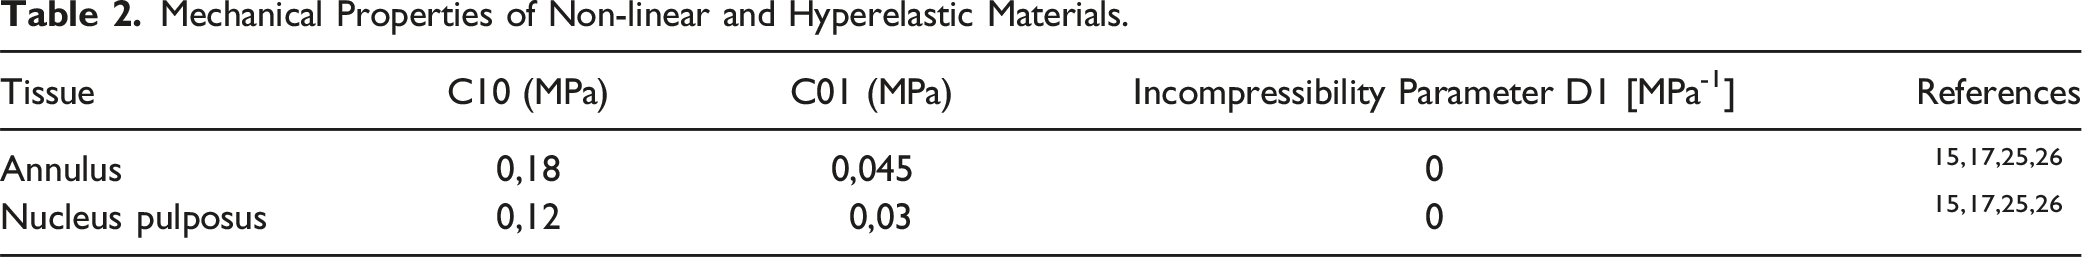
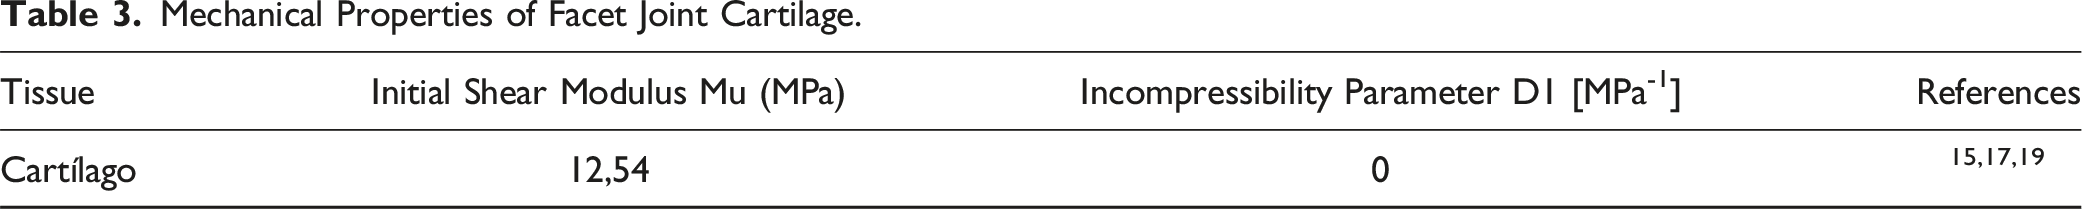
Mechanical Properties of Facet Joint Cartilage.
Once the geometry was imported and the material properties were established, the meshing process was carried out, ensuring that the element quality was above 75% according to the software’s criteria. A model with 864,357 nodes and 514,826 elements was obtained. Subsequently, boundary conditions were set. A fixed support located on the sacrum bone was used to restrict the movement of the model.
16
A perpendicular load was applied to the posterior-third upper surface of the L4 vertebral body with values of 300 N, 460 N, and 600 N
18
(Figure 3A). Flexion and extension were simulated using moments of 5 Nm and 7.5 Nm,
11
located in the same region where the weight was applied (Figure 3B and 3C). Boundary conditions. A Bipedestation, B Flexion, C Extension.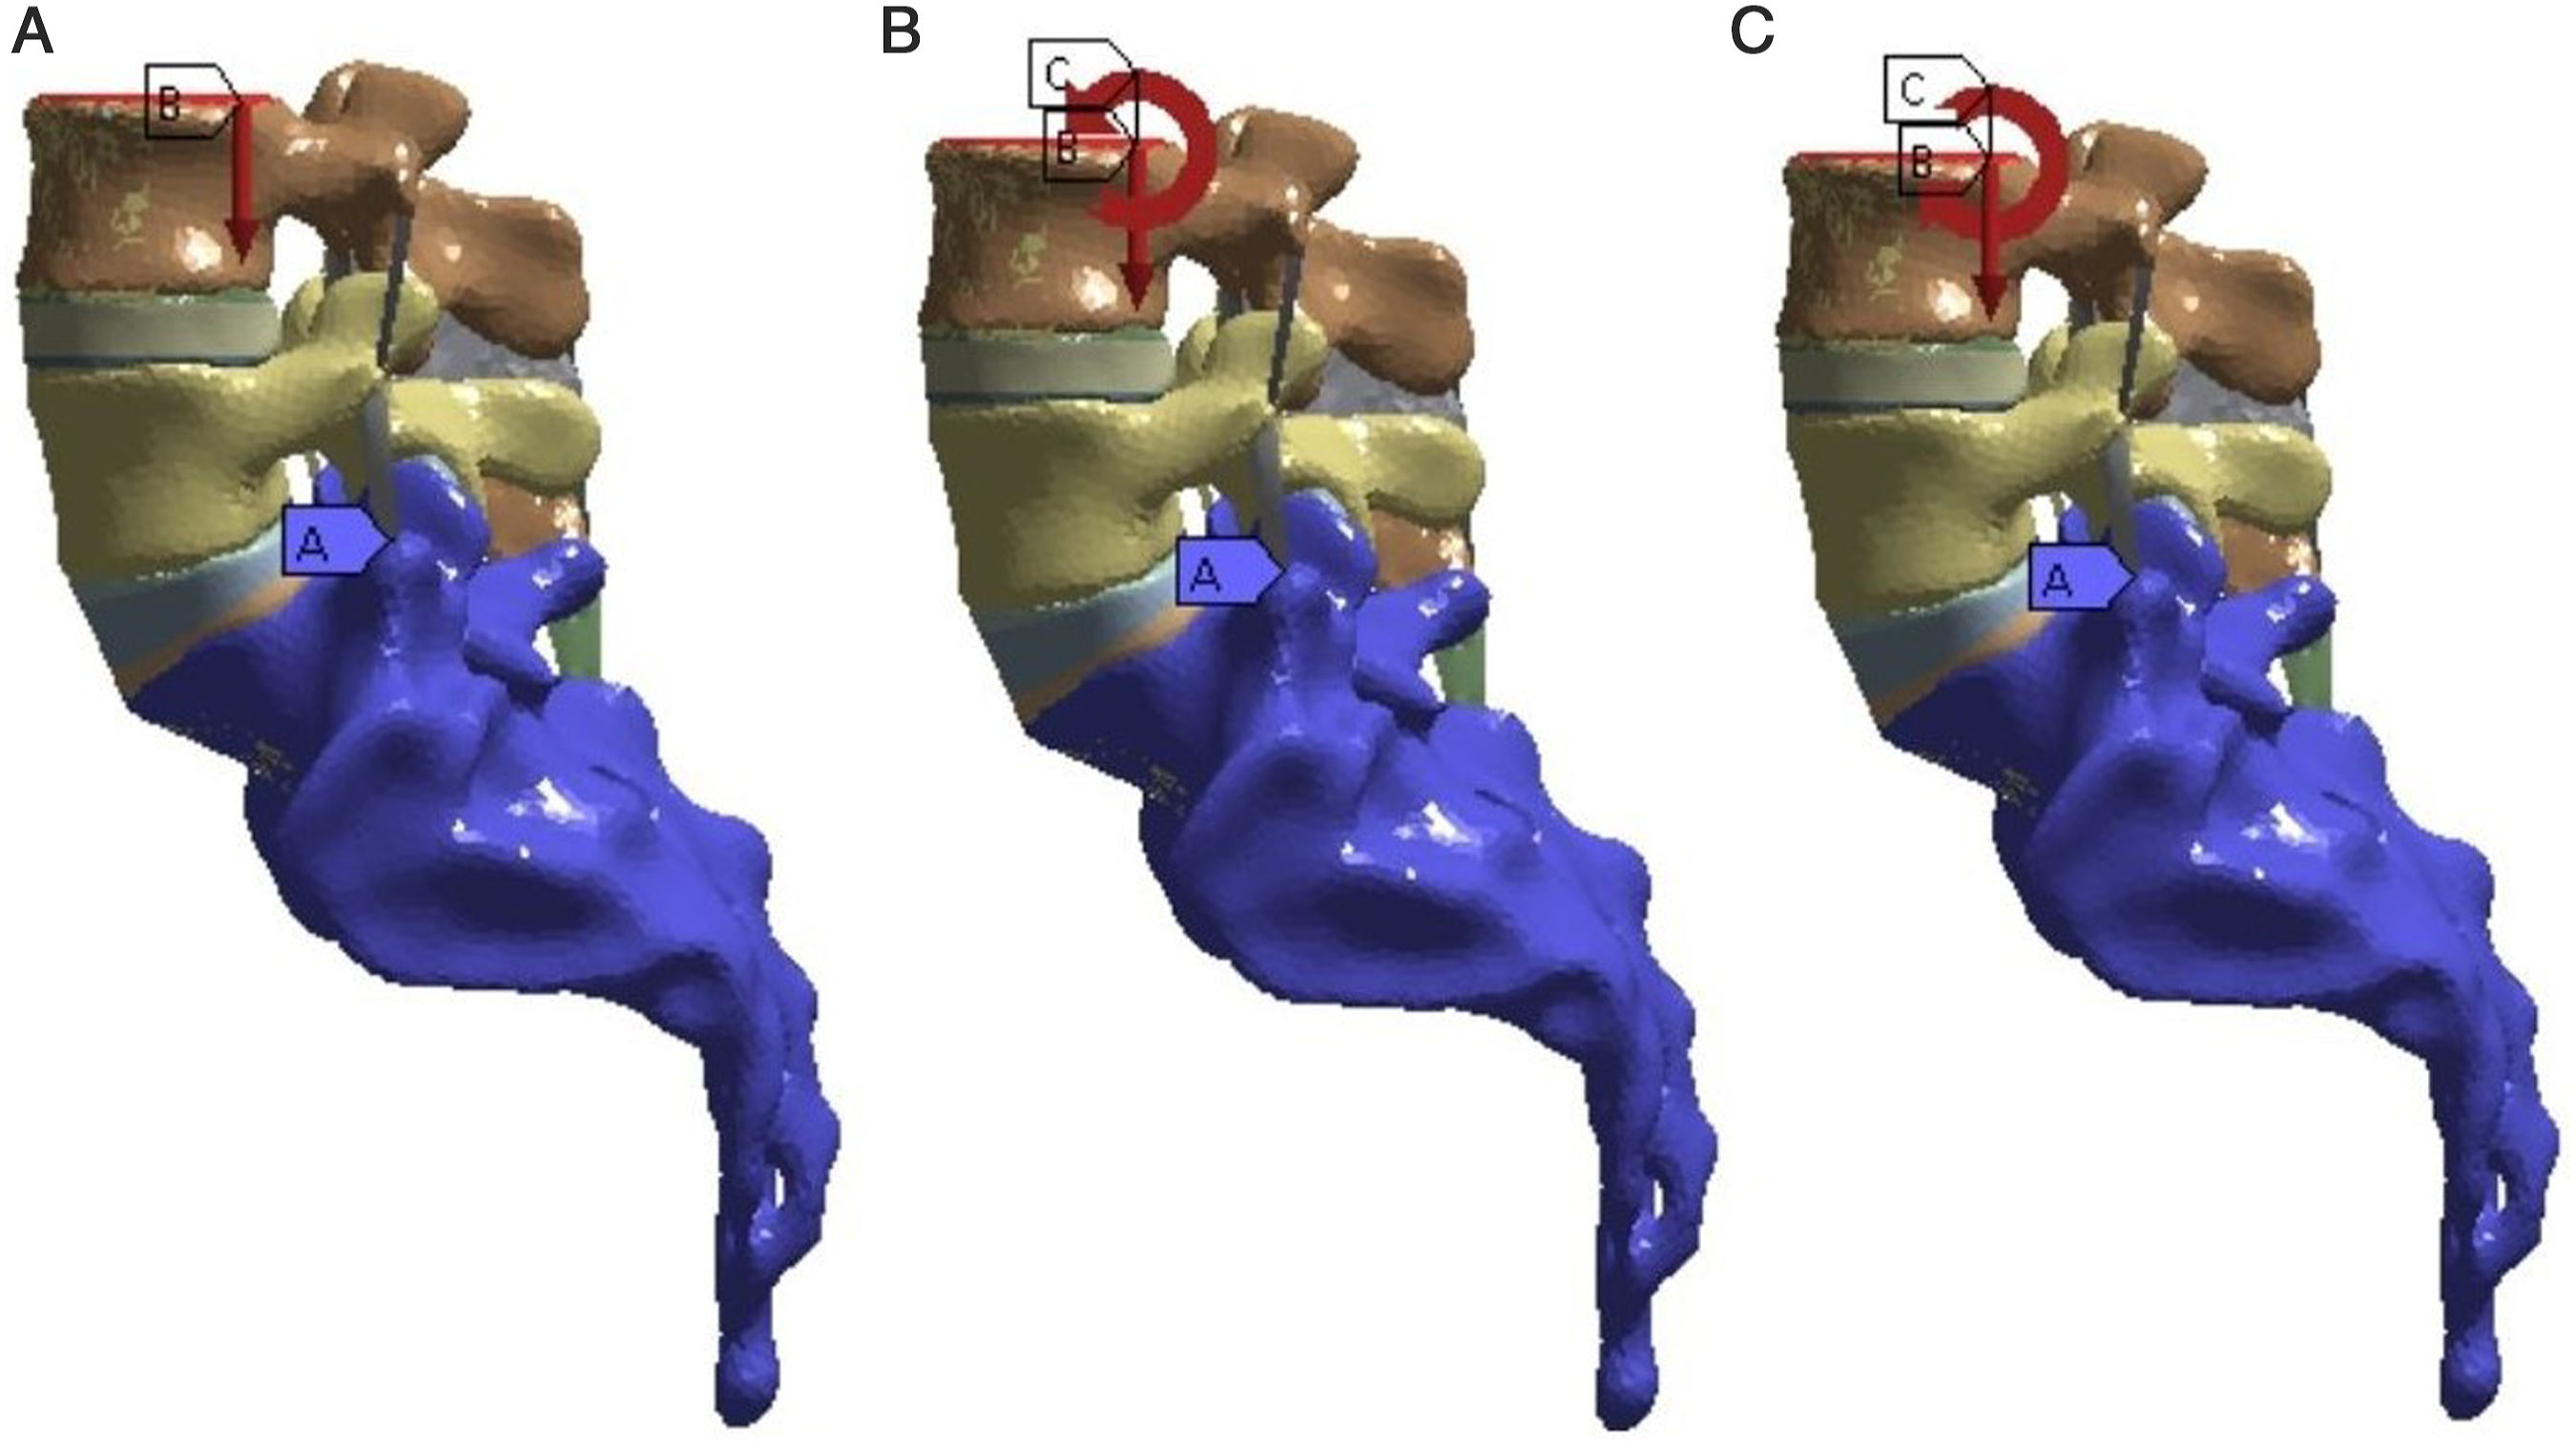
For each type of movement, total deformation, von Mises equivalent stress, von Mises strain, and maximum principal stress were analyzed.
Data Visualization
To analyze the biomechanical behavior of the lumbosacral region, the maximum, minimum, and critical values of the variables studied were obtained for each movement and for each of the involved tissues, both in the posterior and anterior regions. Regions of interest were located in areas where the measured variables showed transitions or differences in magnitude. As an example, Figure 4 presents the selected regions of interest for the left L5-S1 facet joint cartilage. Furthermore, relevant anatomical points were used for the vertebrae. Regions of interest for the left L5-S1 facet joint cartilage.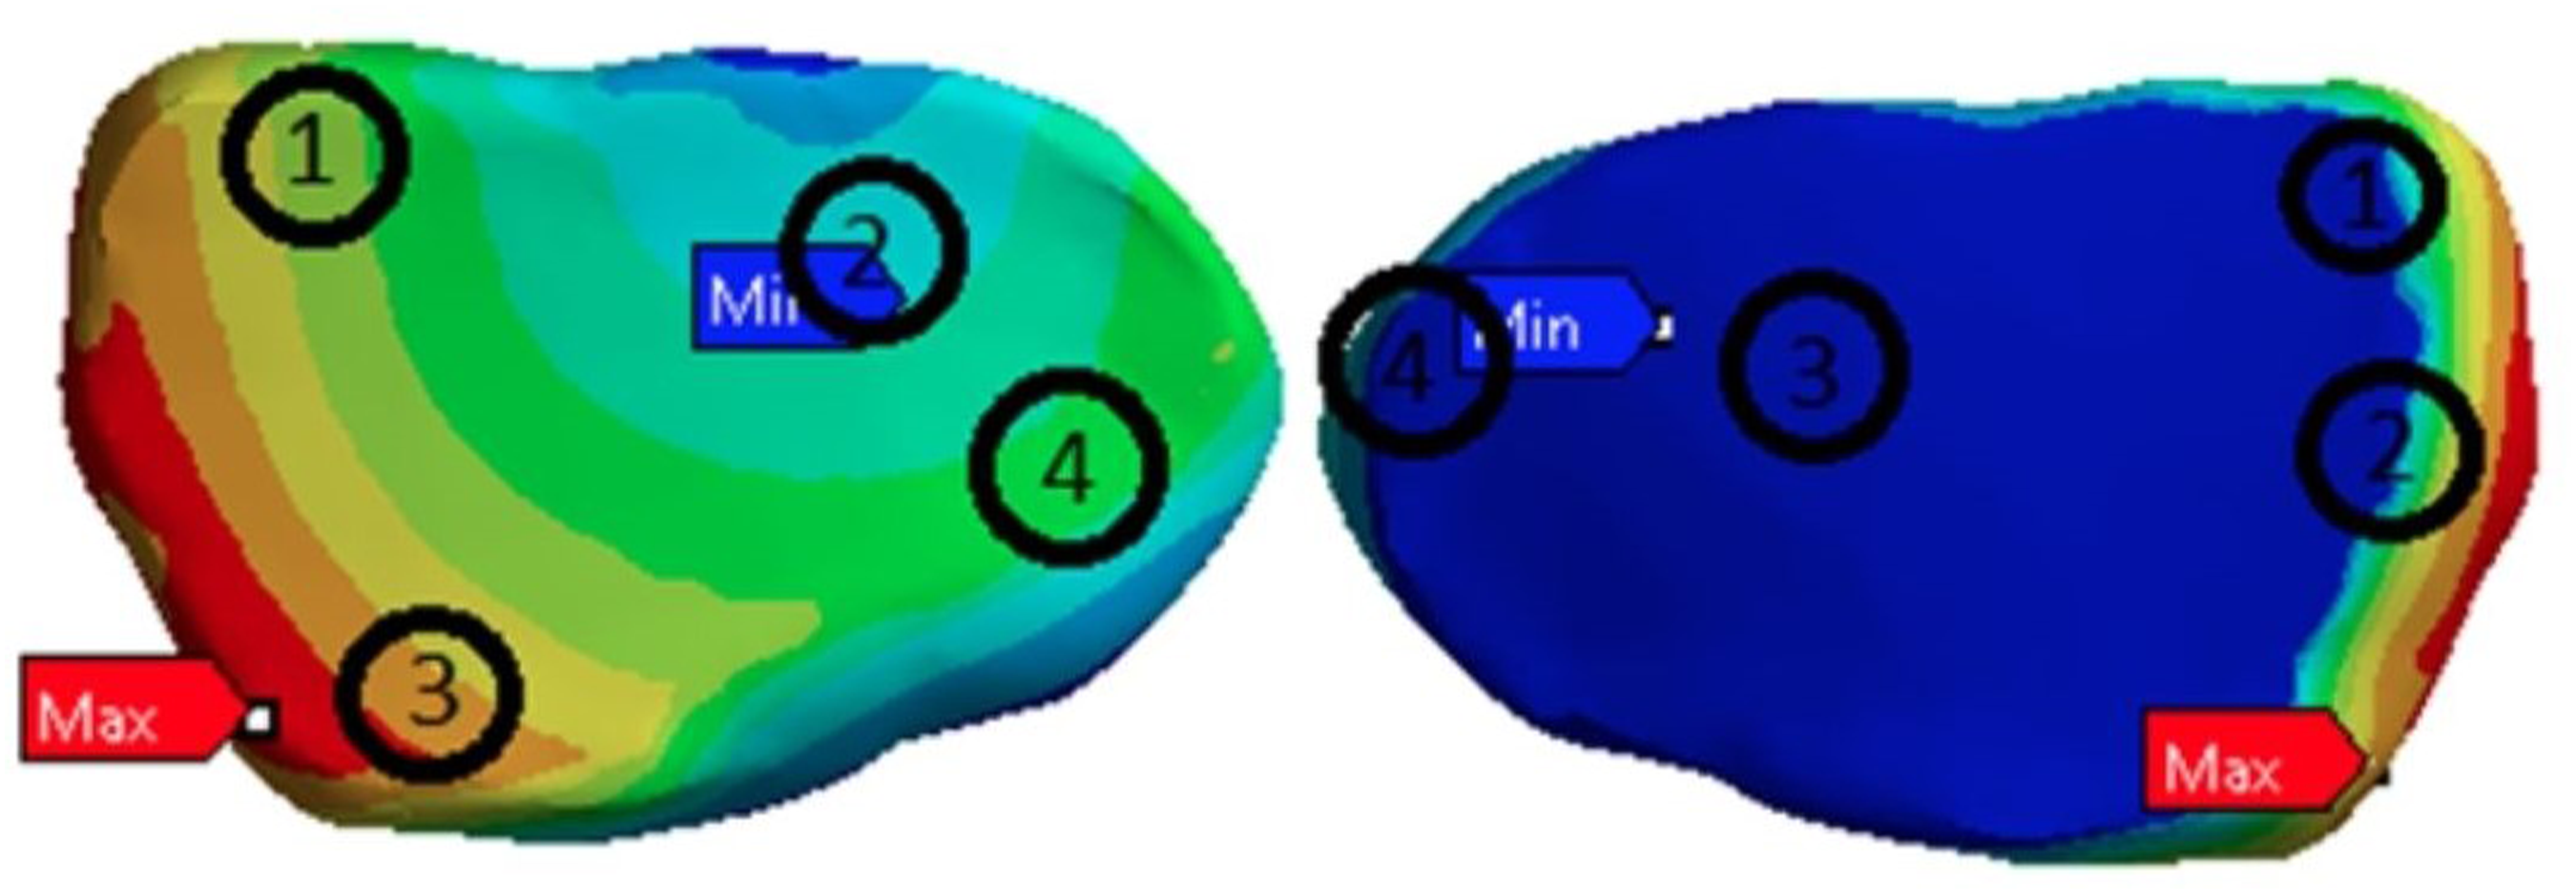
By tabulating the critical and anatomical points for each tissue, graphs of the variables were generated to understand their trends and facilitate the comparison of the lumbosacral junction behavior when subjected to different loads and movements. All data was validated against in-vivo and finite element analysis prior models.
Results
To facilitate visualization and exemplify trends in the behavior of the different anatomical structures, the most representative results from the mathematical model are presented which correspond to L5 spine segment under an axial load of 600 N, plus flexion and extension moments of 7.5 Nm; the remaining results can be found in attached documents to this article.
For the ligaments, the results of the strain will be shown. In the other tissues, both the strain and the maximum principal stress will be presented. In the following graphs, the nomenclature Bipe, Flex, and Ext will refer to the studied movements of bipedestation, flexion and extension, respectively.
L5 Vertebrae
Cortical Bone
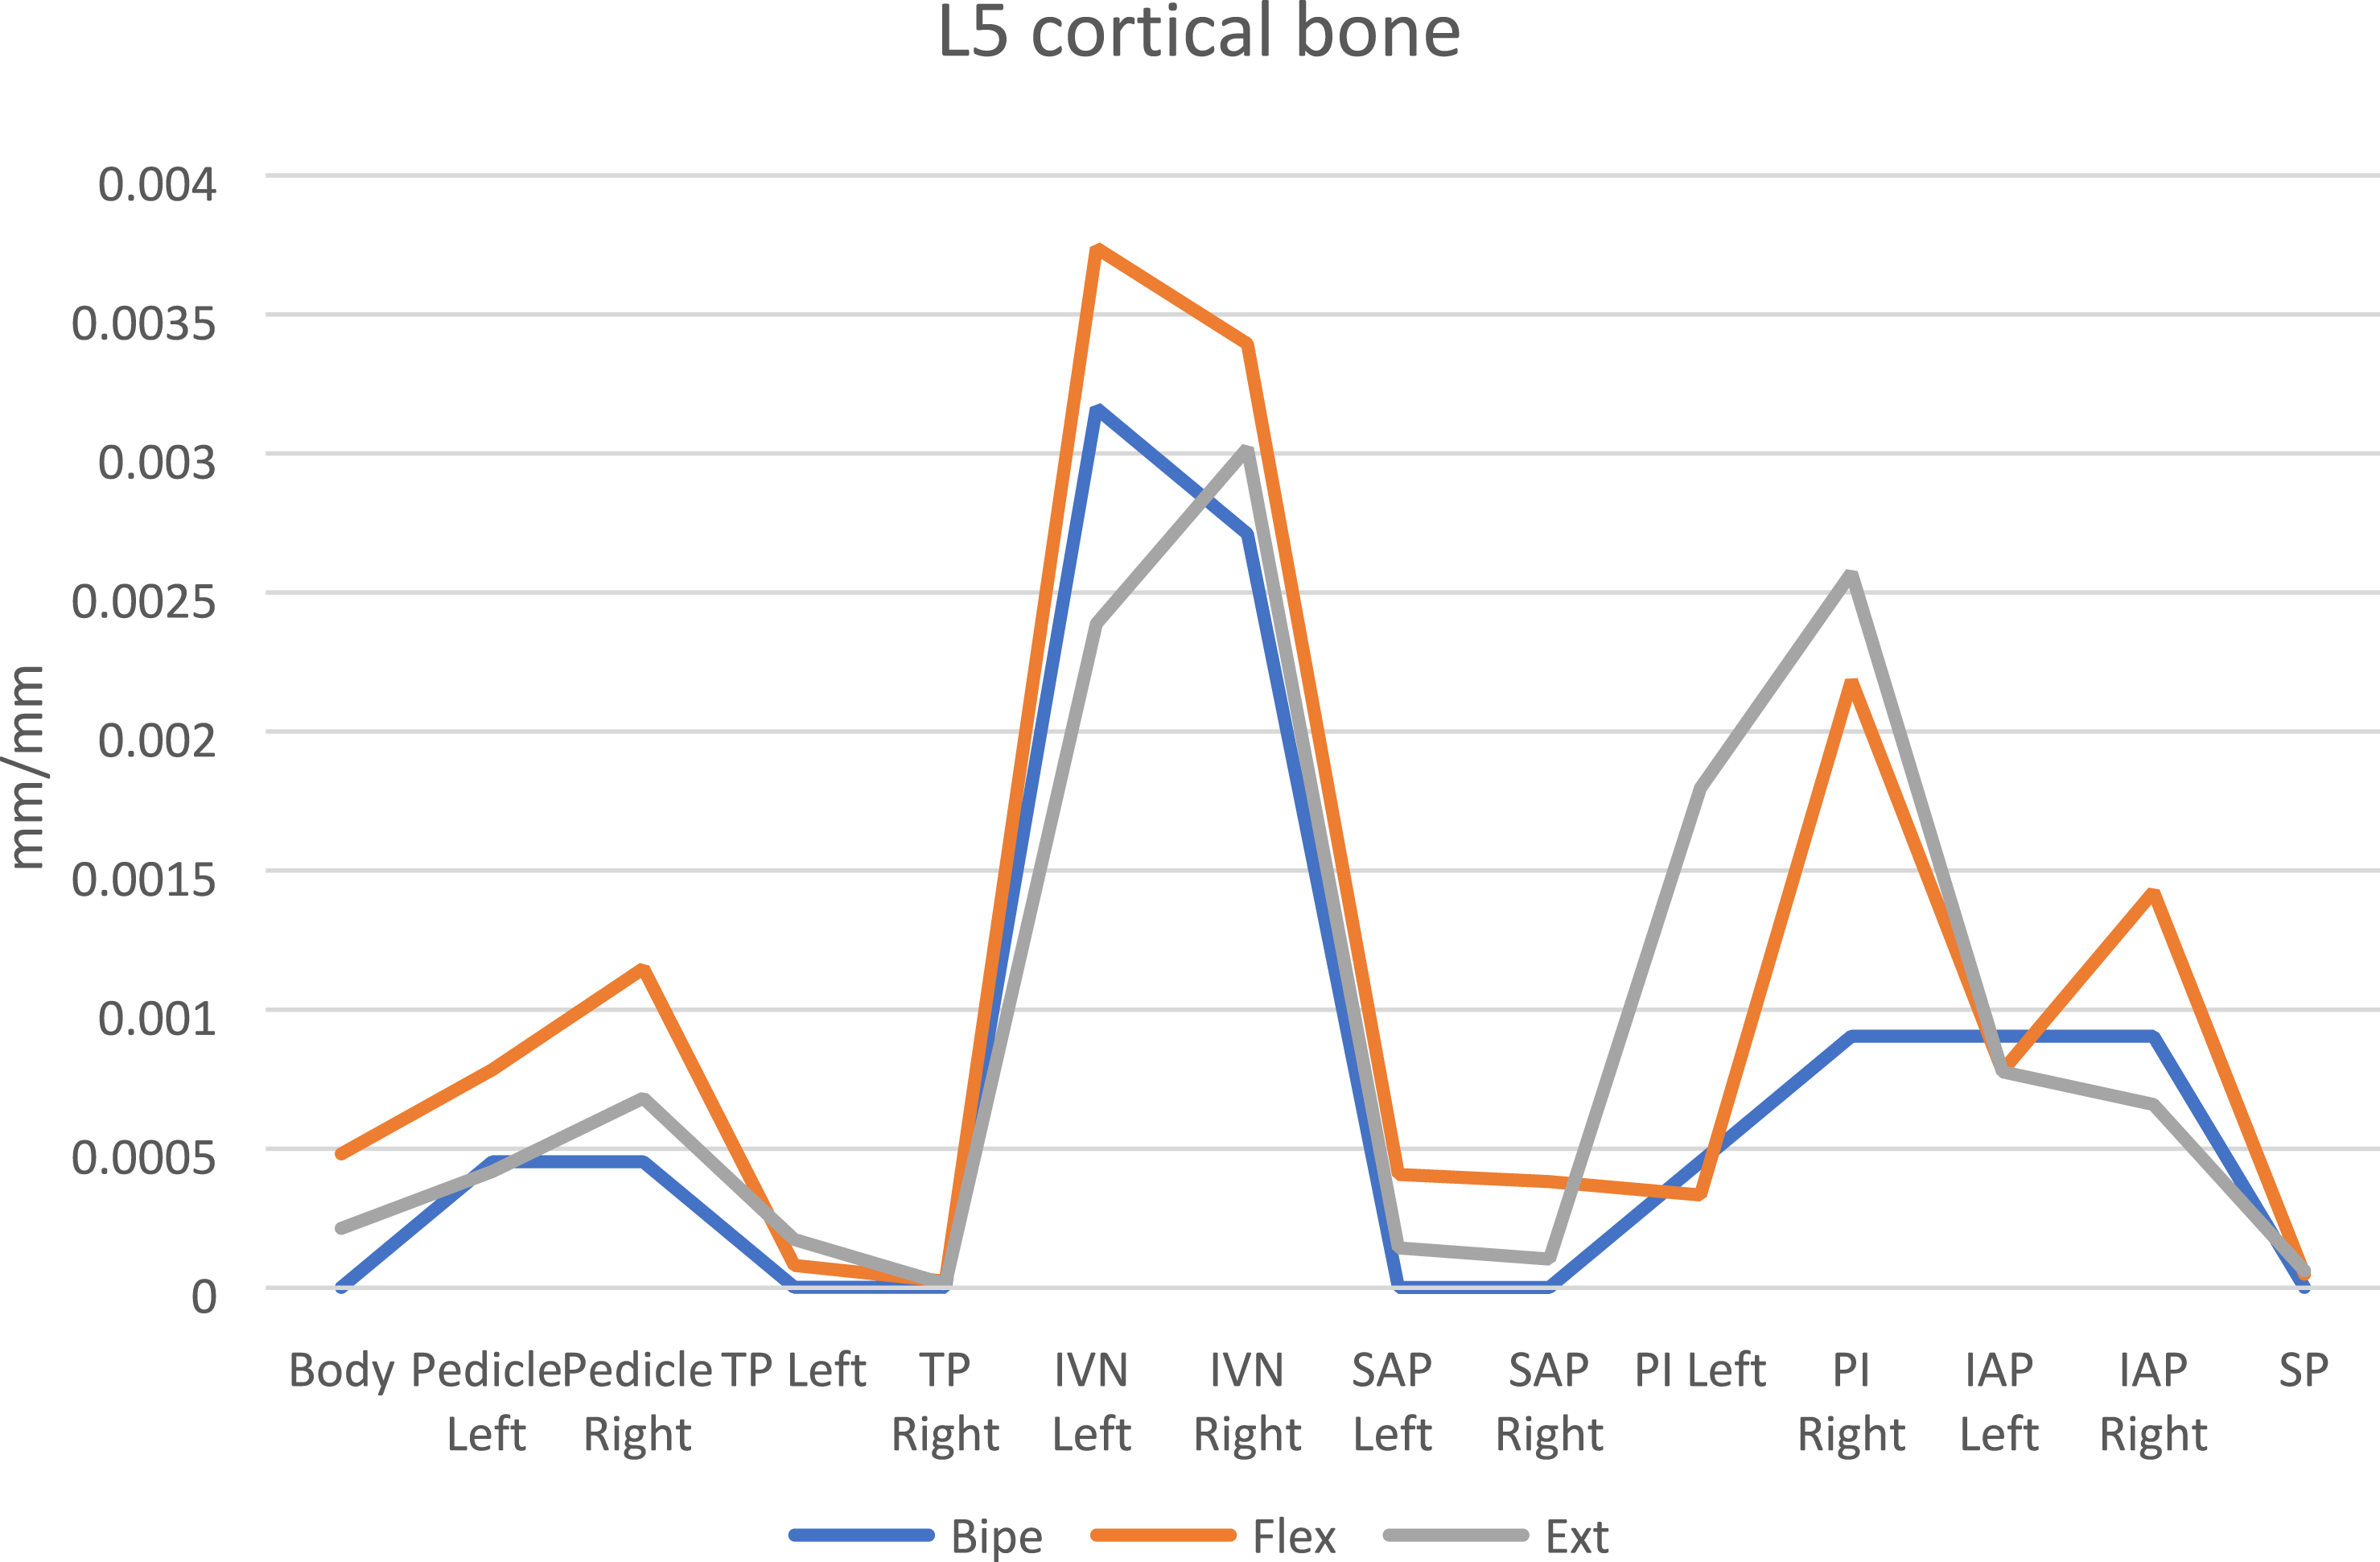
Graph 1. shows the maximum principal stress values of the anatomical structures of the L5 vertebra cortical bone. The highest value was obtained in both the right and left Inferior Vertebral Notch (IVN) in all 3 movements studied (37.759 MPa in neutral standing posture, 52.976 MPa and 46.73 MPa in flexion, 33.824 MPa and 41.426 MPa in extension). Additionally, negative values indicating compressive stress are only found in the bipedestation with a minimum value of −4.5447 MPa, observed in all anatomical points of the vertebra except in the right IVN, Superior articular process (SAP), and pars interarticularis (PI). Similarly, Graph 2 shows the strain of the anatomical structures of the cortical vertebra. In this graph, the right and left IVN have magnitudes of .0031 and .0027 in bipedestation, and .0037 and .0033 in flexion, respectively. In extension, the highest strain values were found in the right IVN and PI, with values of .0030 and .0025, respectively. Maximum principal stress in L5 cortical bone. Strain in L5 cortical bone.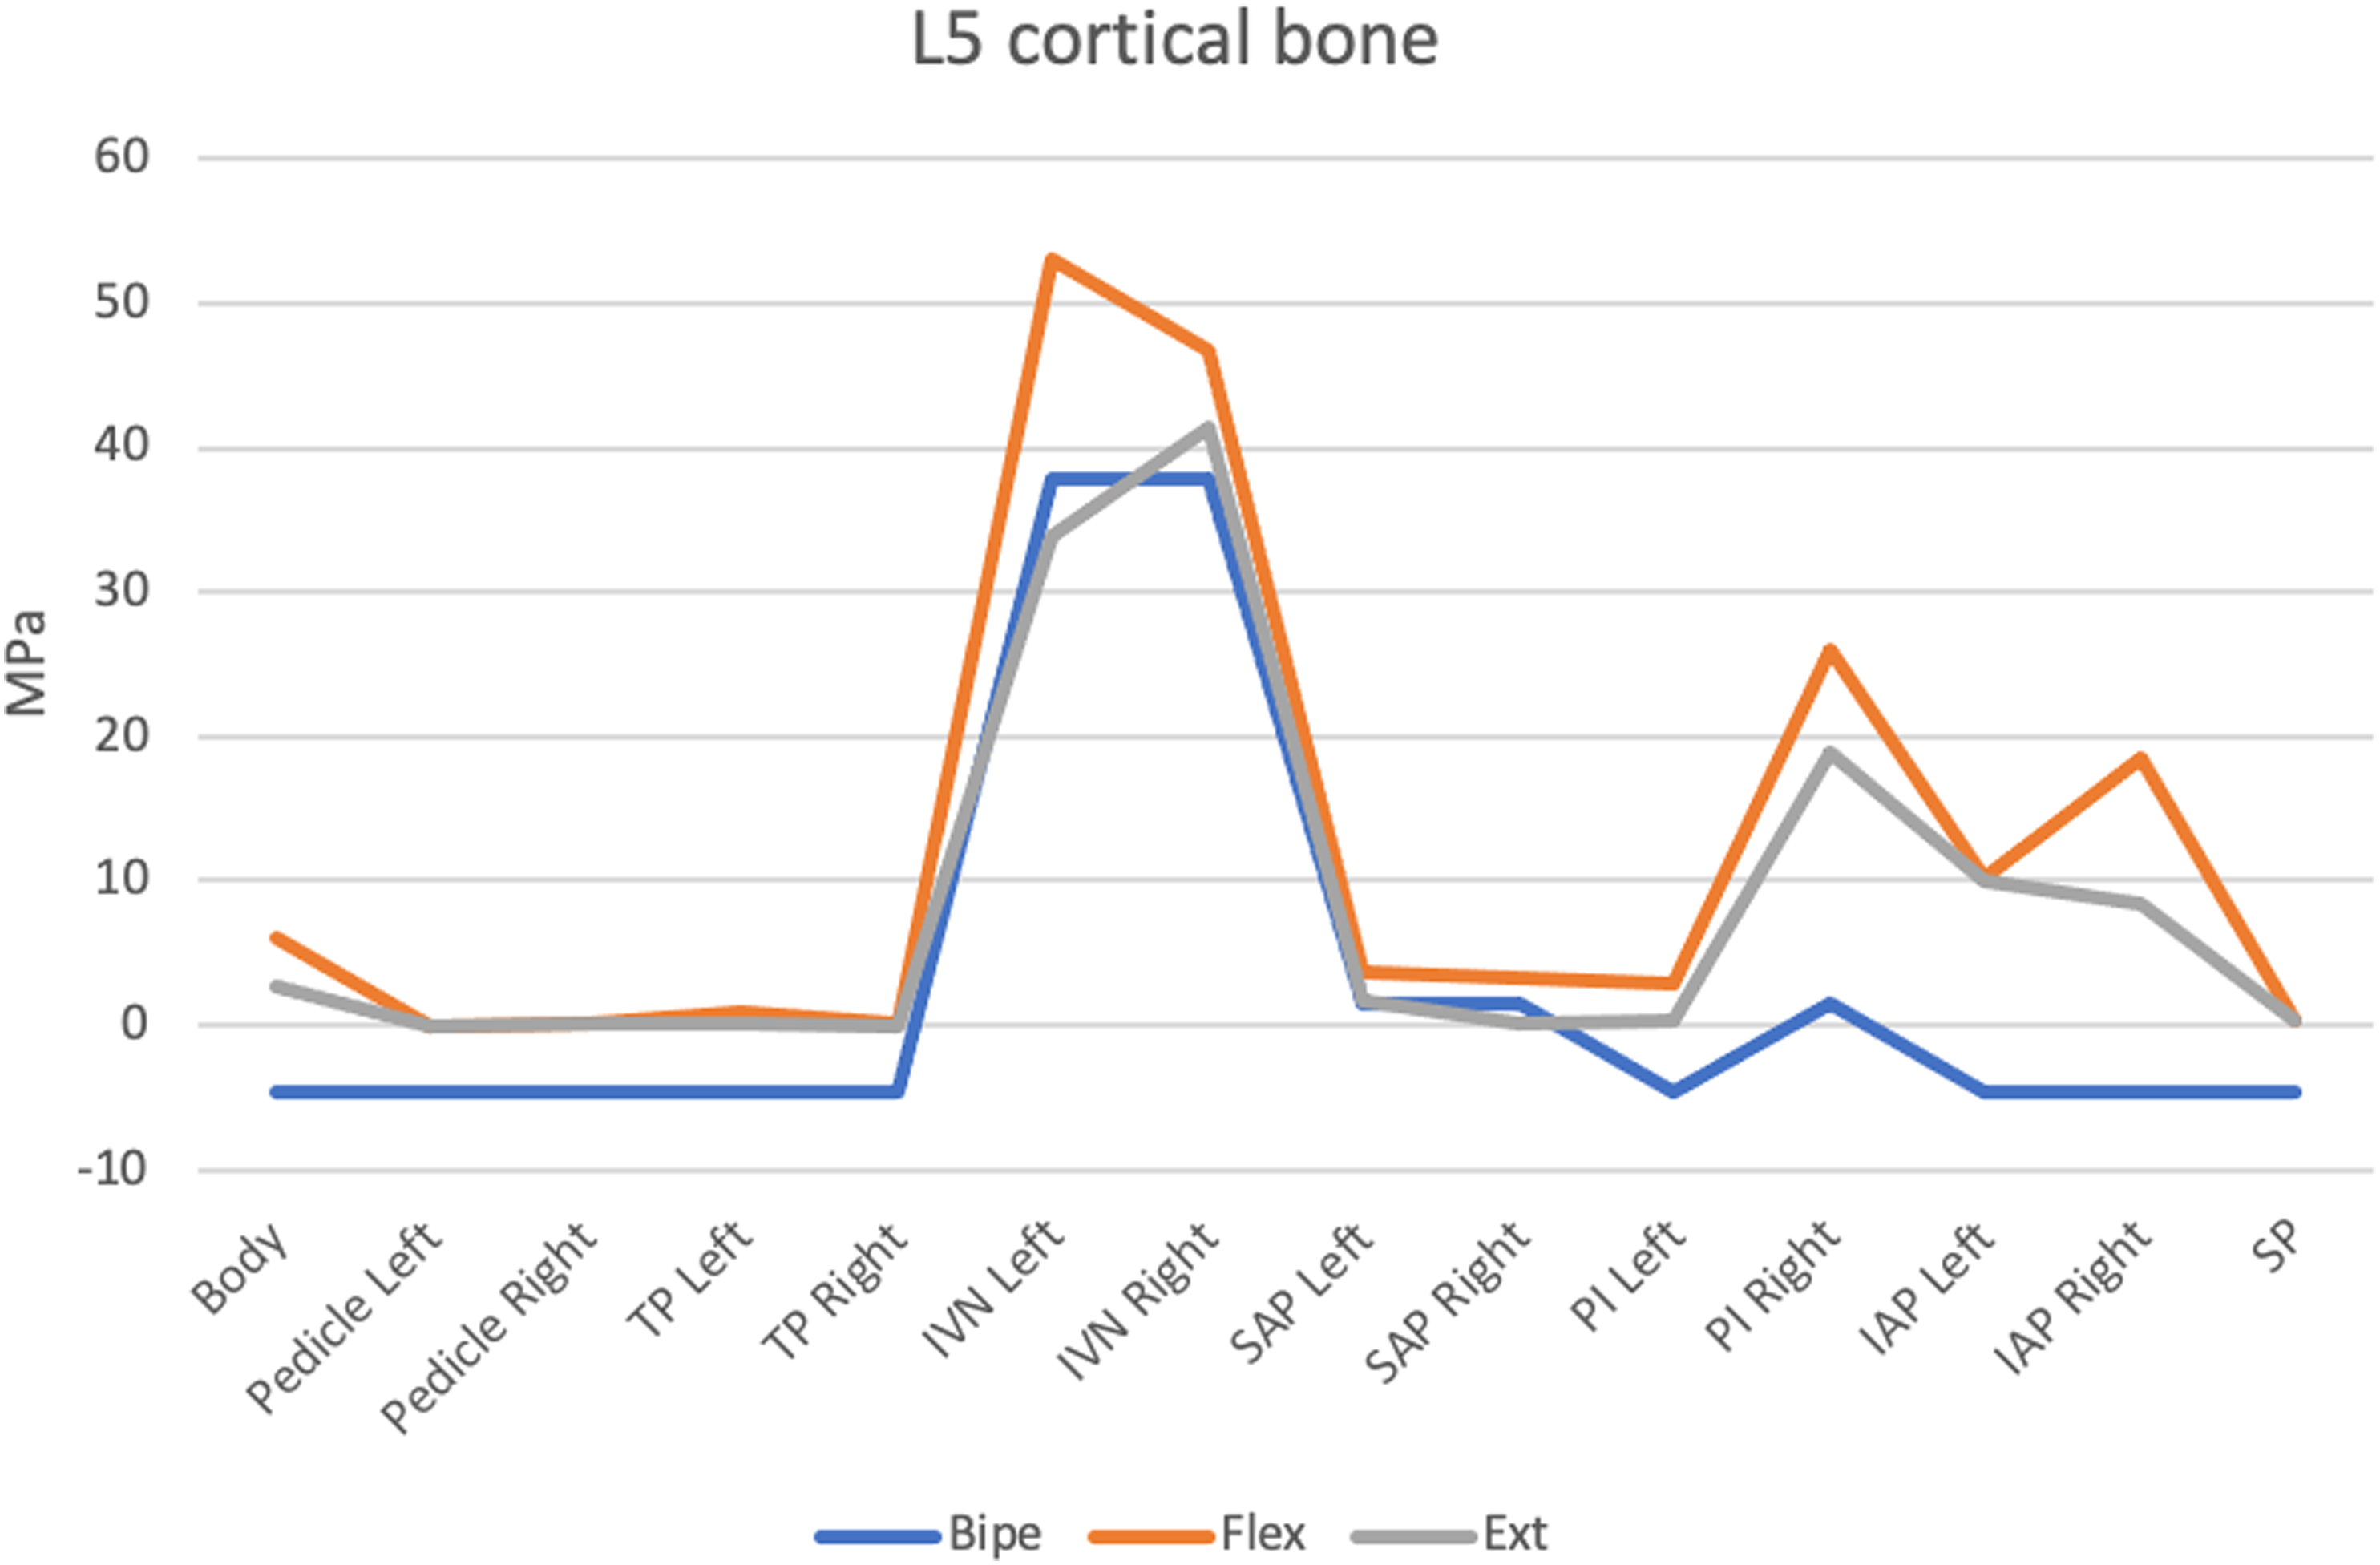
Trabecular Bone
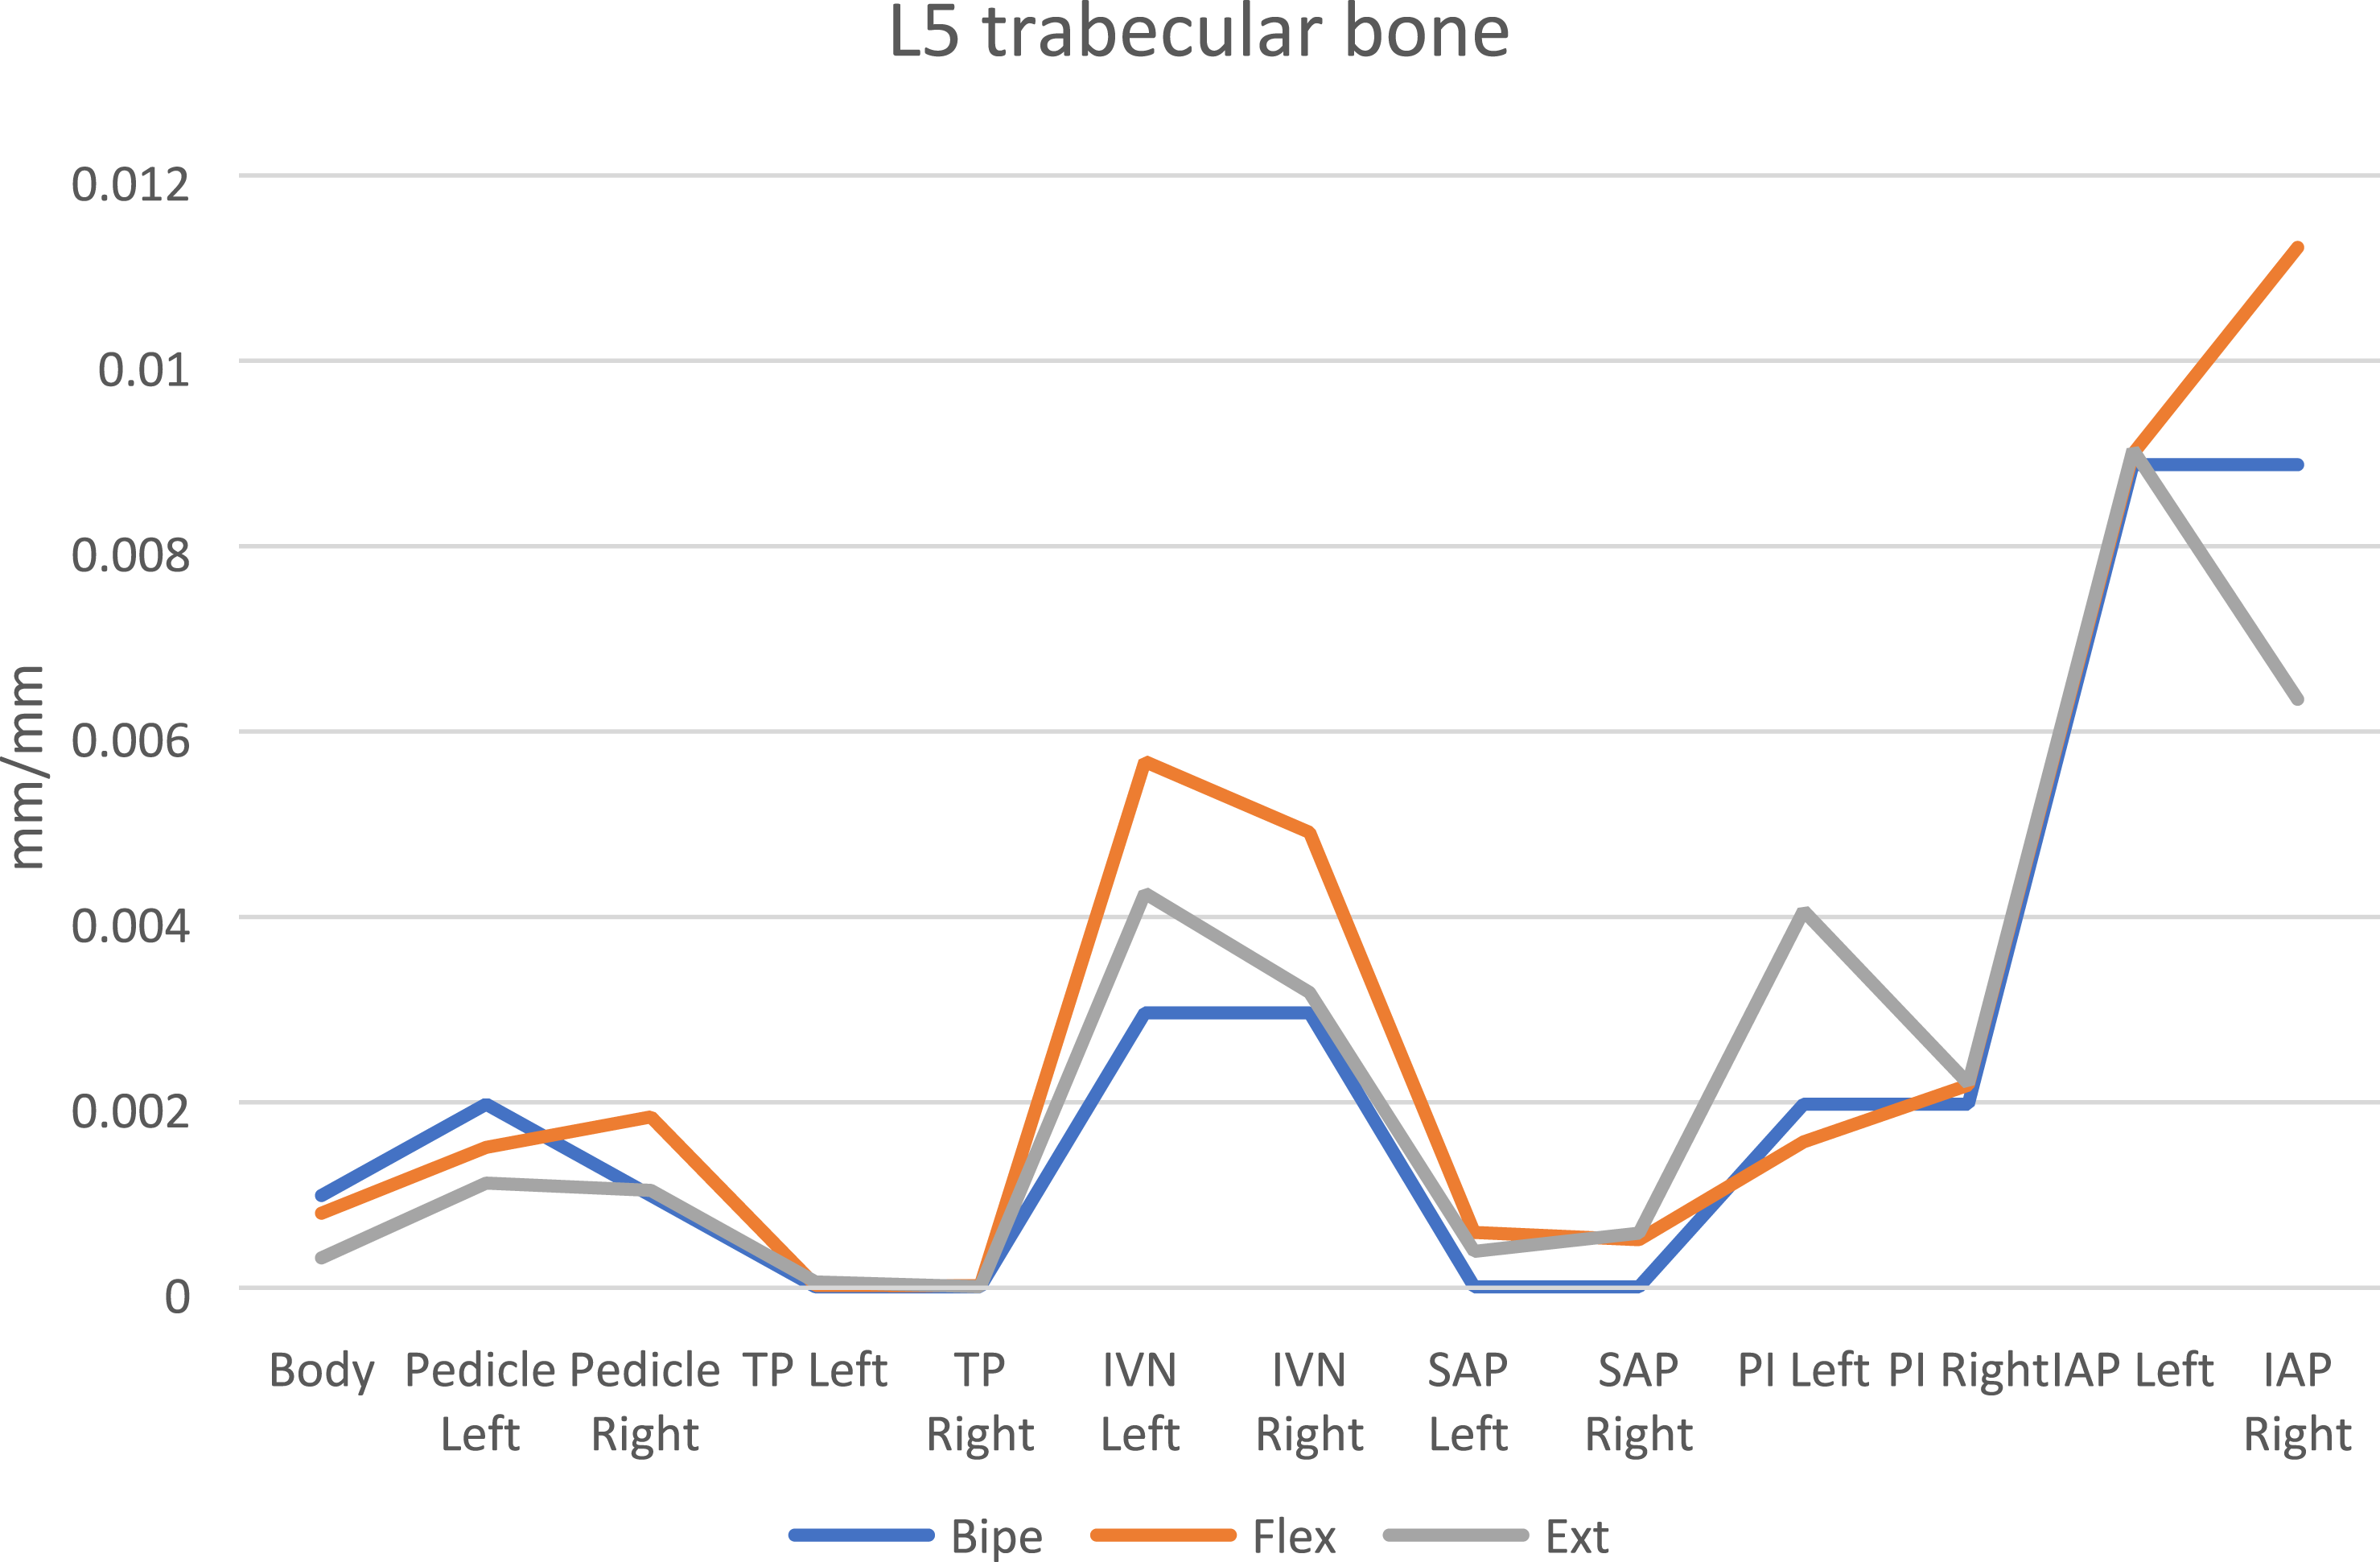
Graph 3 shows the maximum principal stress of the anatomical structures of the L5 trabecular bone. The highest values are observed in the right and left IVN, with values of 1.2161 MPa in bipedestation, 1.3638 MPa and 1.337 MPa in flexion, and 1.0032 MPa and .8599 MPa in extension, respectively. Negative values indicating compressive stress are observed in the right and left inferior articular process (IAP), with magnitudes of −.6975 MPa in both structures in bipedestation, −.2594 MPa and −.5333 MPa in flexion, and −.4417 MPa and −.4272 MPa in extension, respectively. Similarly, Graph 4 shows the results of the strain with the highest values found in the right and left IAP, with magnitudes of .0088 in bipedestation, .0089 and .0112 in flexion, and .0090 and .0063 in extension, respectively. Maximum principal stress in L5 trabecular bone. Strain in L5 trabecular bone.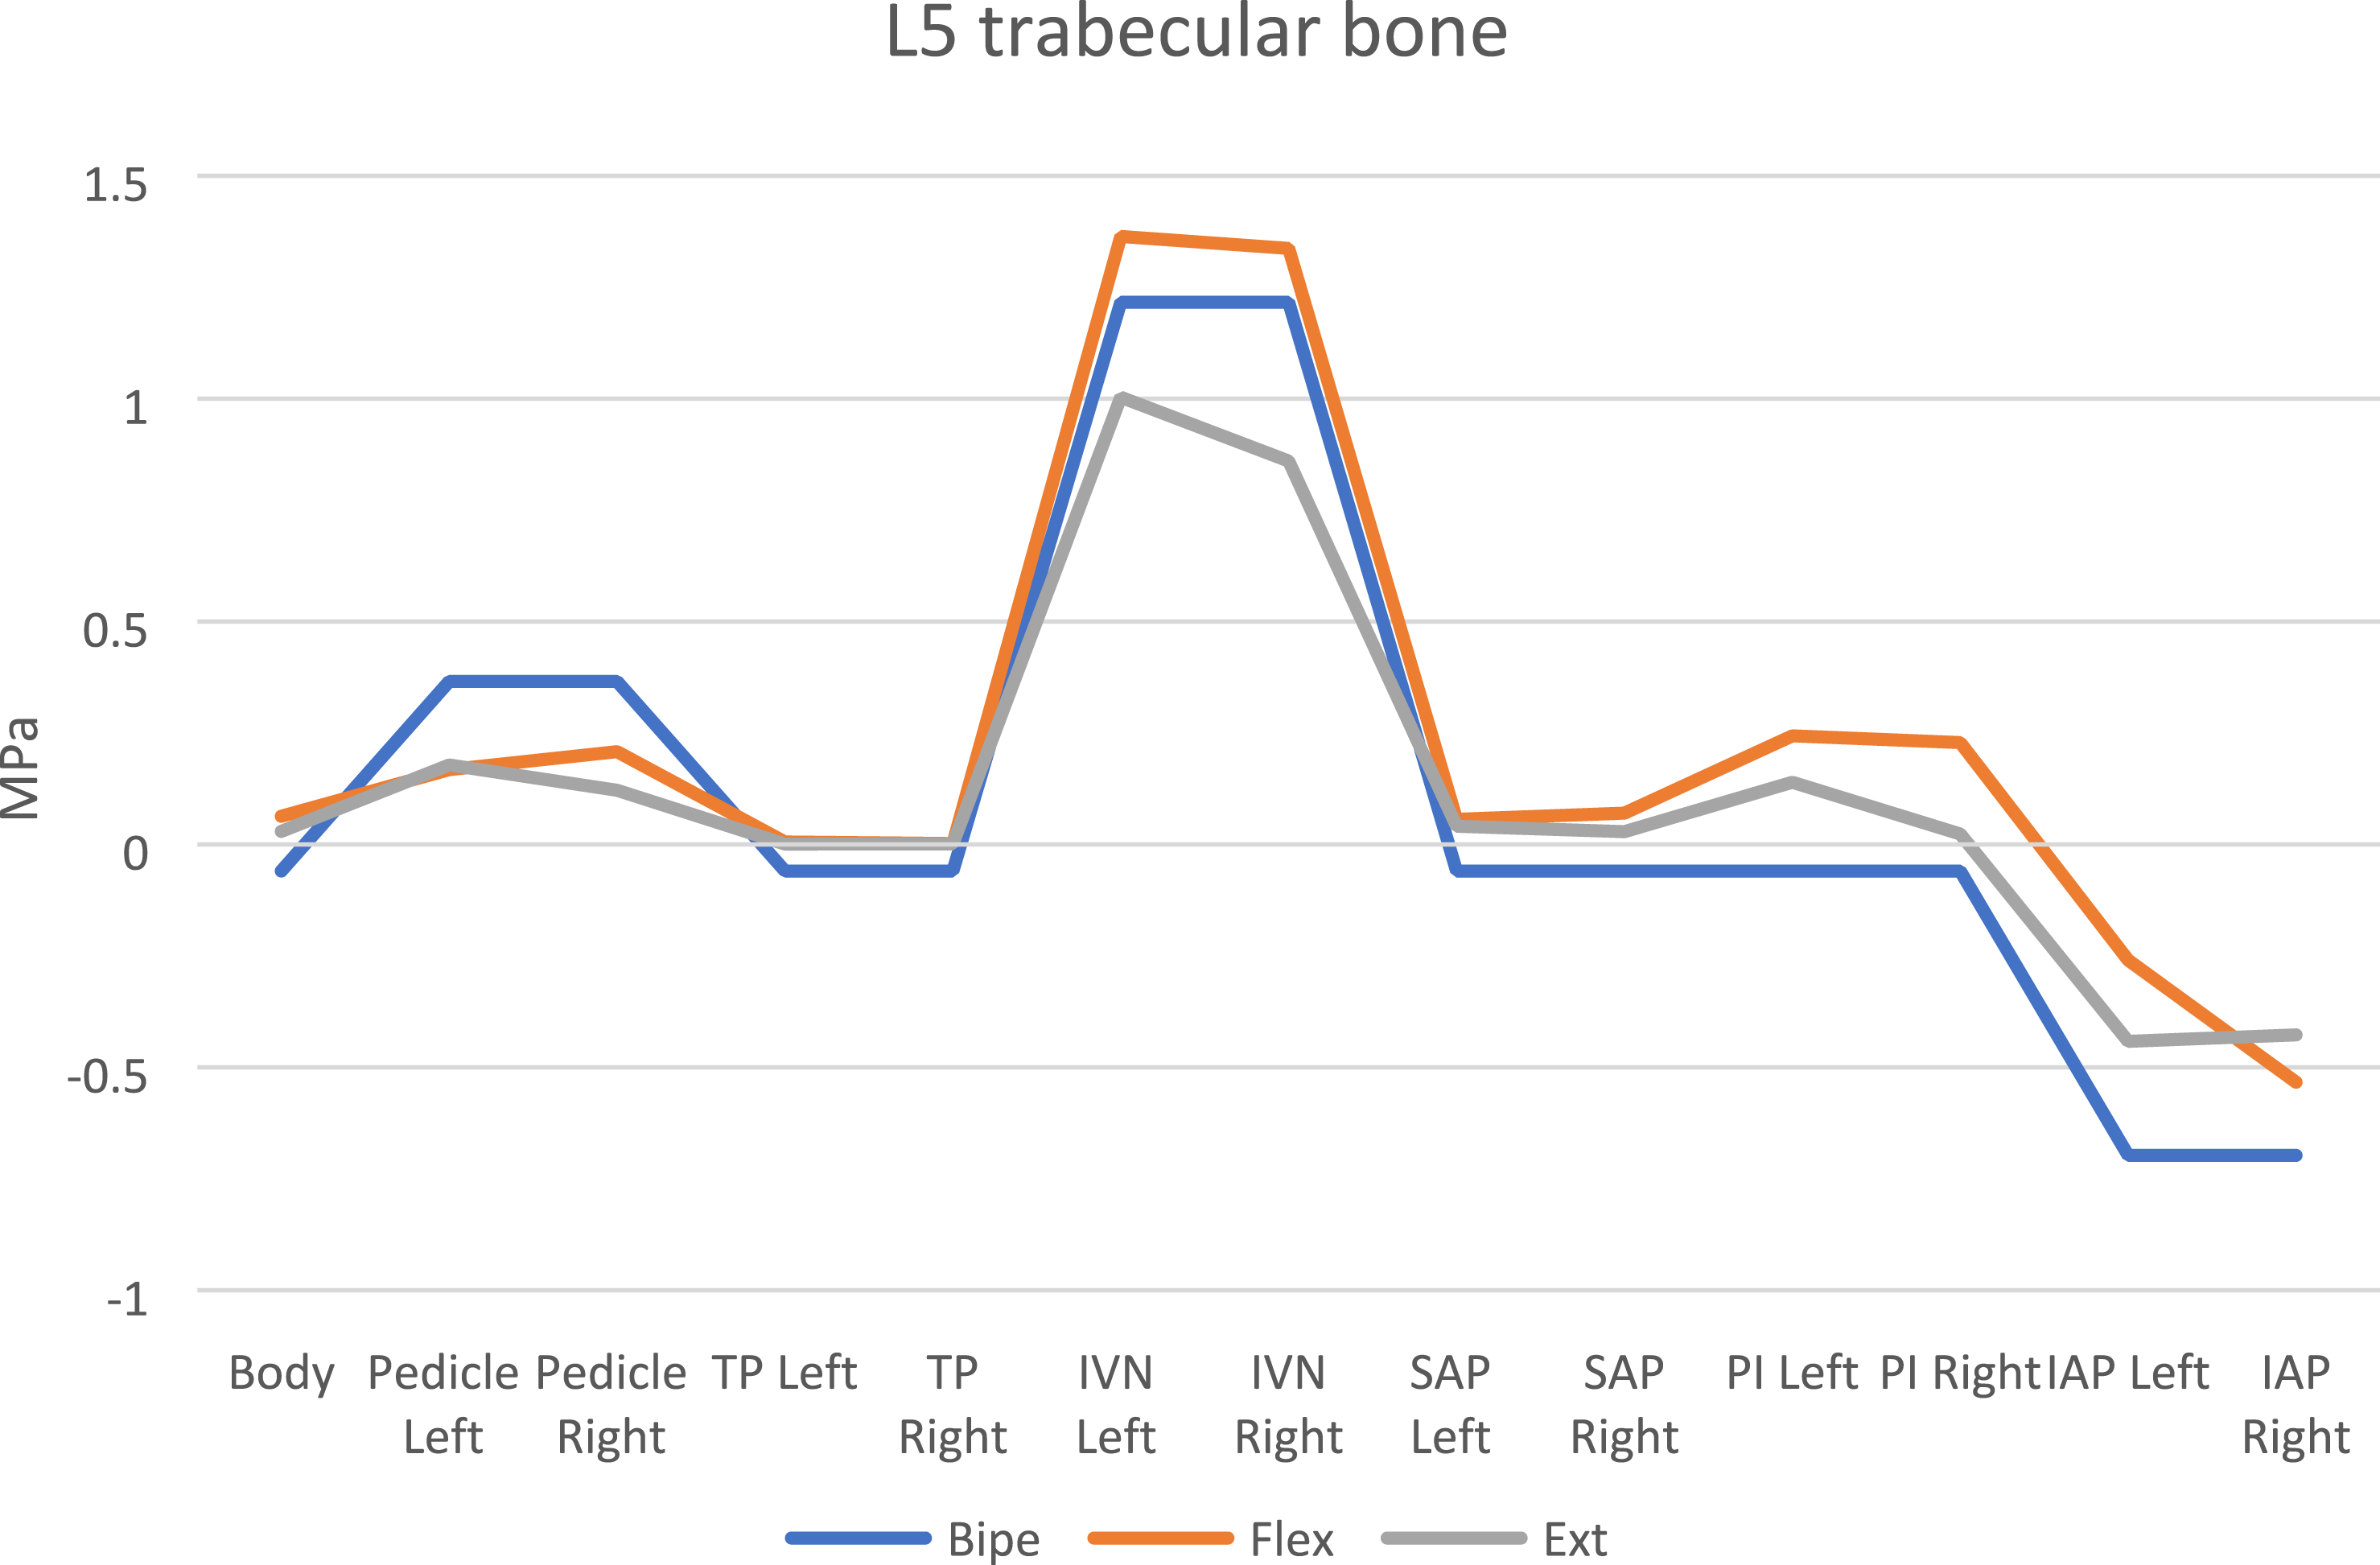
Intervertebral Disk
Graph 5 shows the maximum and minimum values of the maximum principal stress in the superior and inferior endplates, nucleus pulposus, and annulus fibrosus of L5S1 intervertebral disk. Additionally, Graph 6 shows the maximum strain of these same anatomical compounds. The following nomenclature is used in the graphs to refer to each anatomical part: superior endplate (SEP), inferior endplate (IEP), nucleus pulposus (nucleus). Maximum and minimum values of the Maximum principal stress in the L5 superior and inferior endplates and L5S1 intervertebral disk. Strain in the L5 superior and inferior endplates and L5S1 intervertebral disk.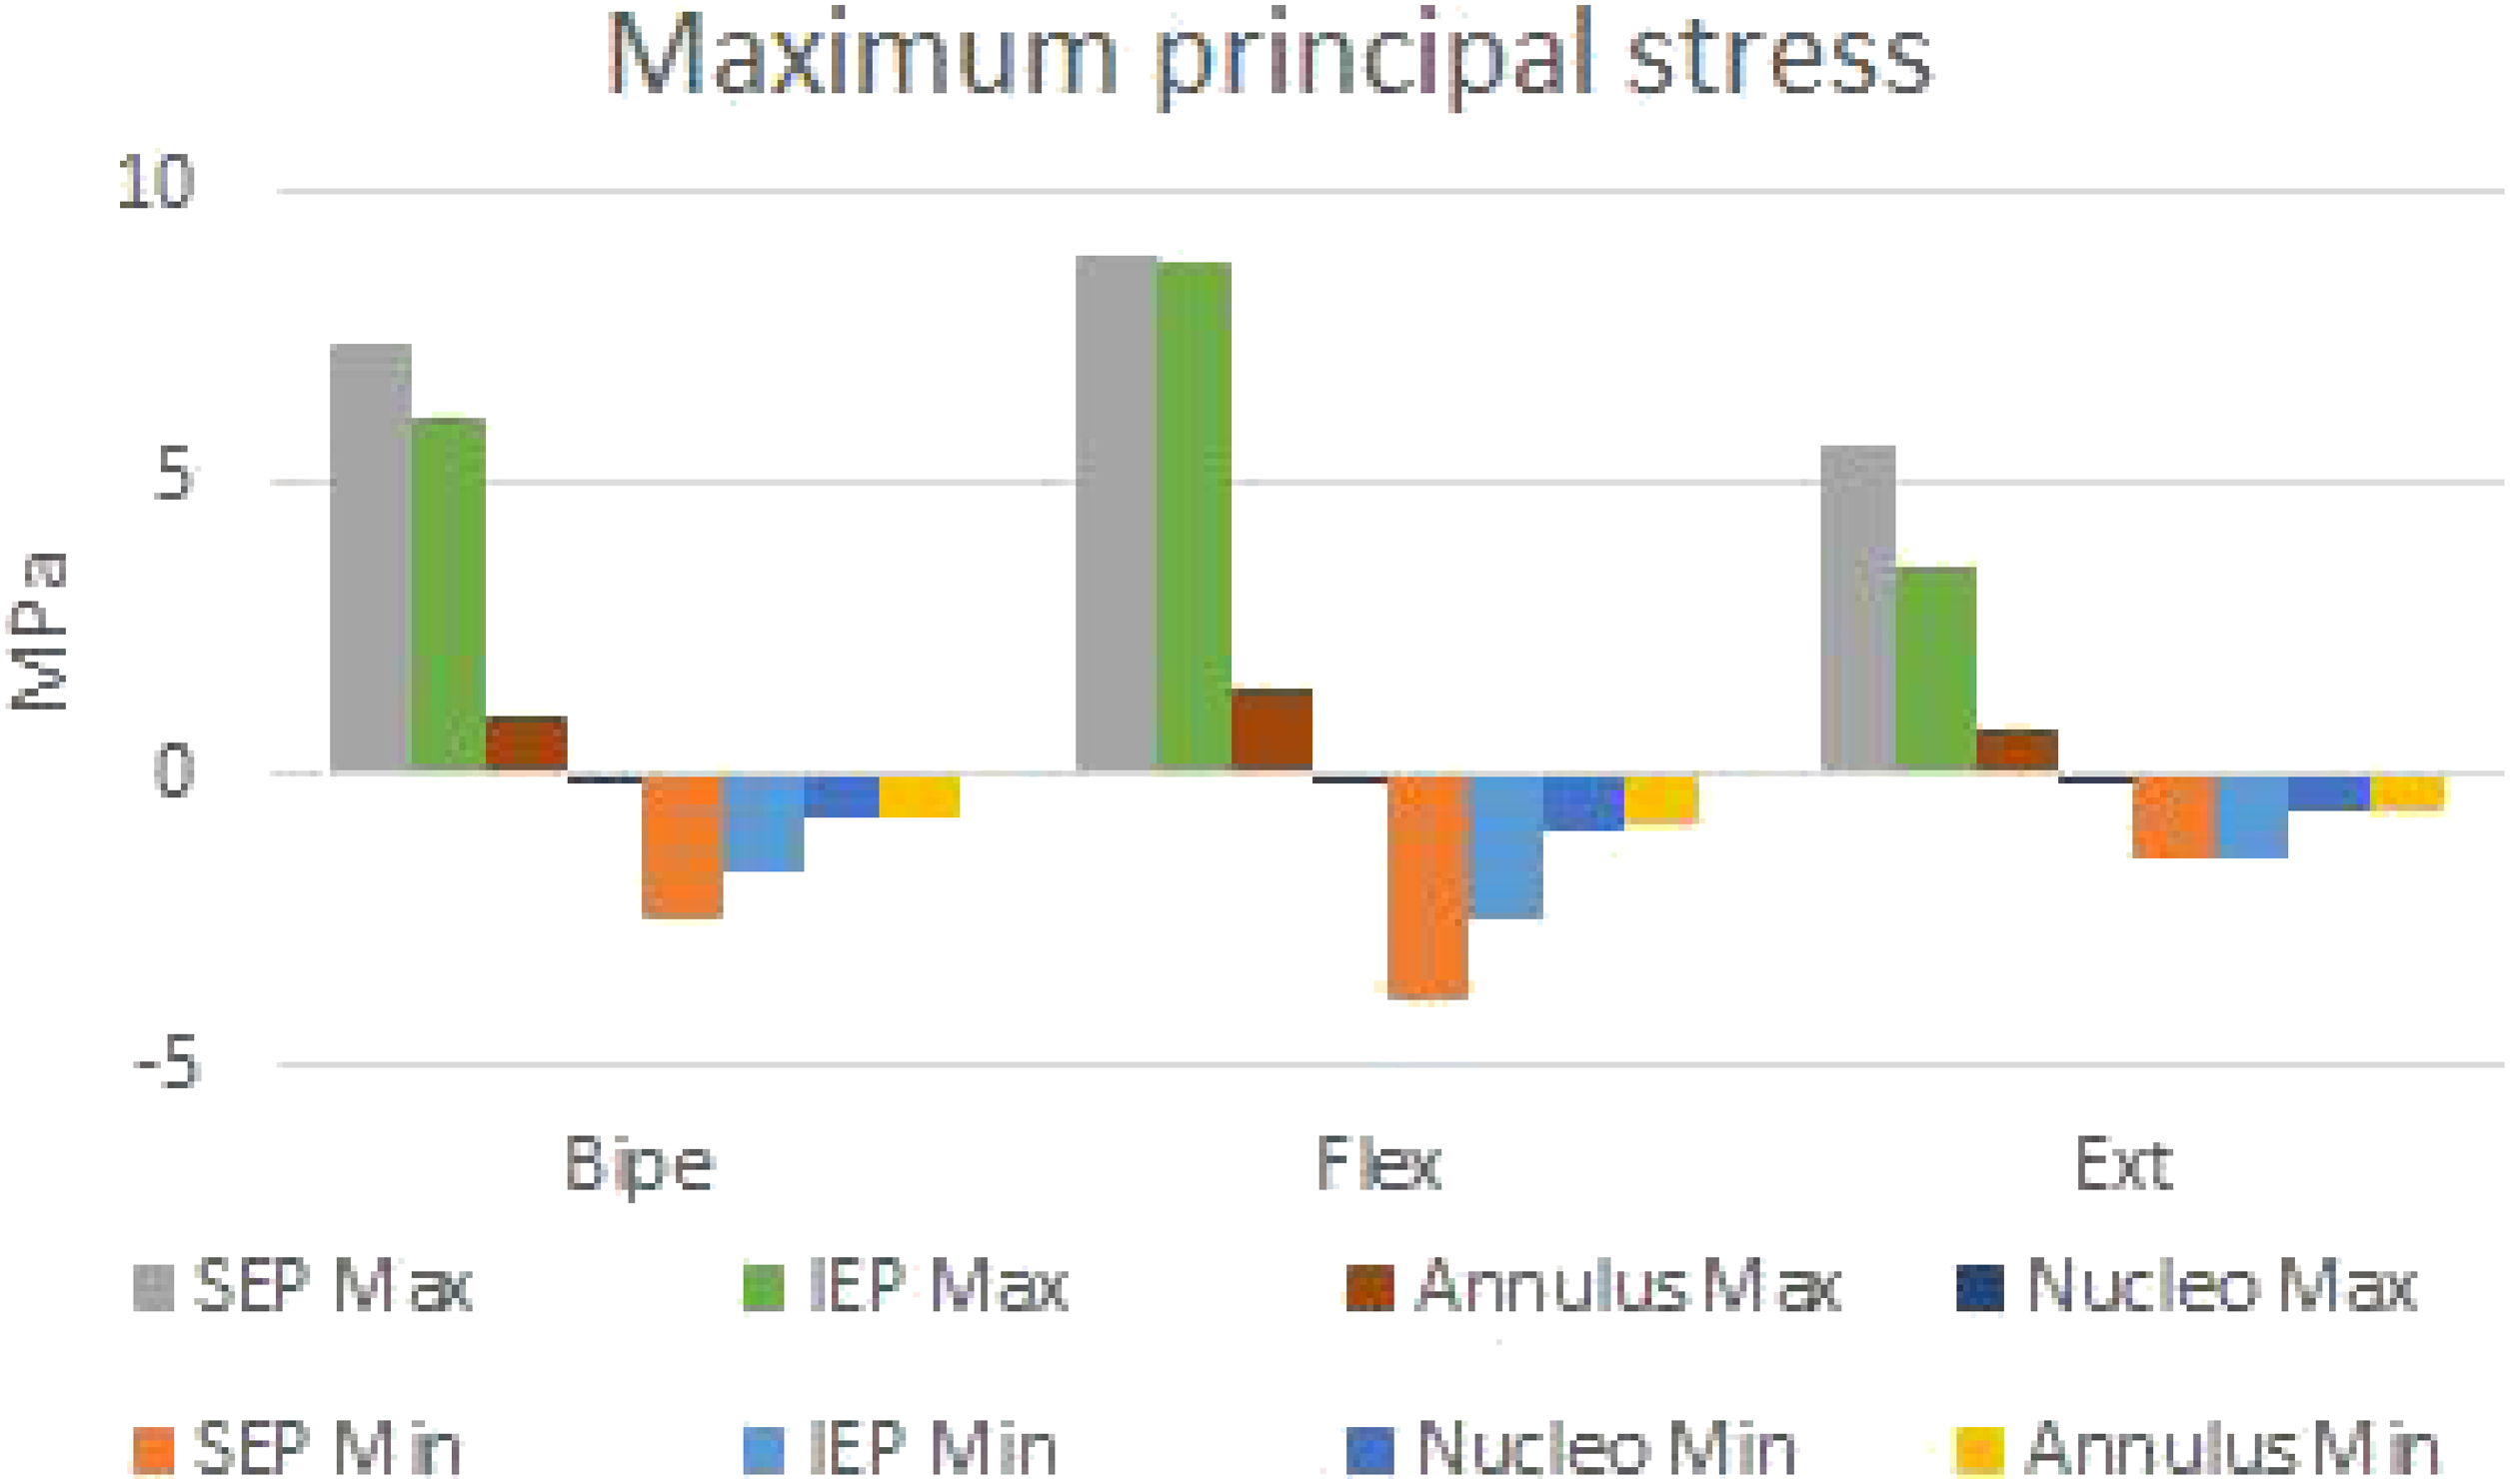
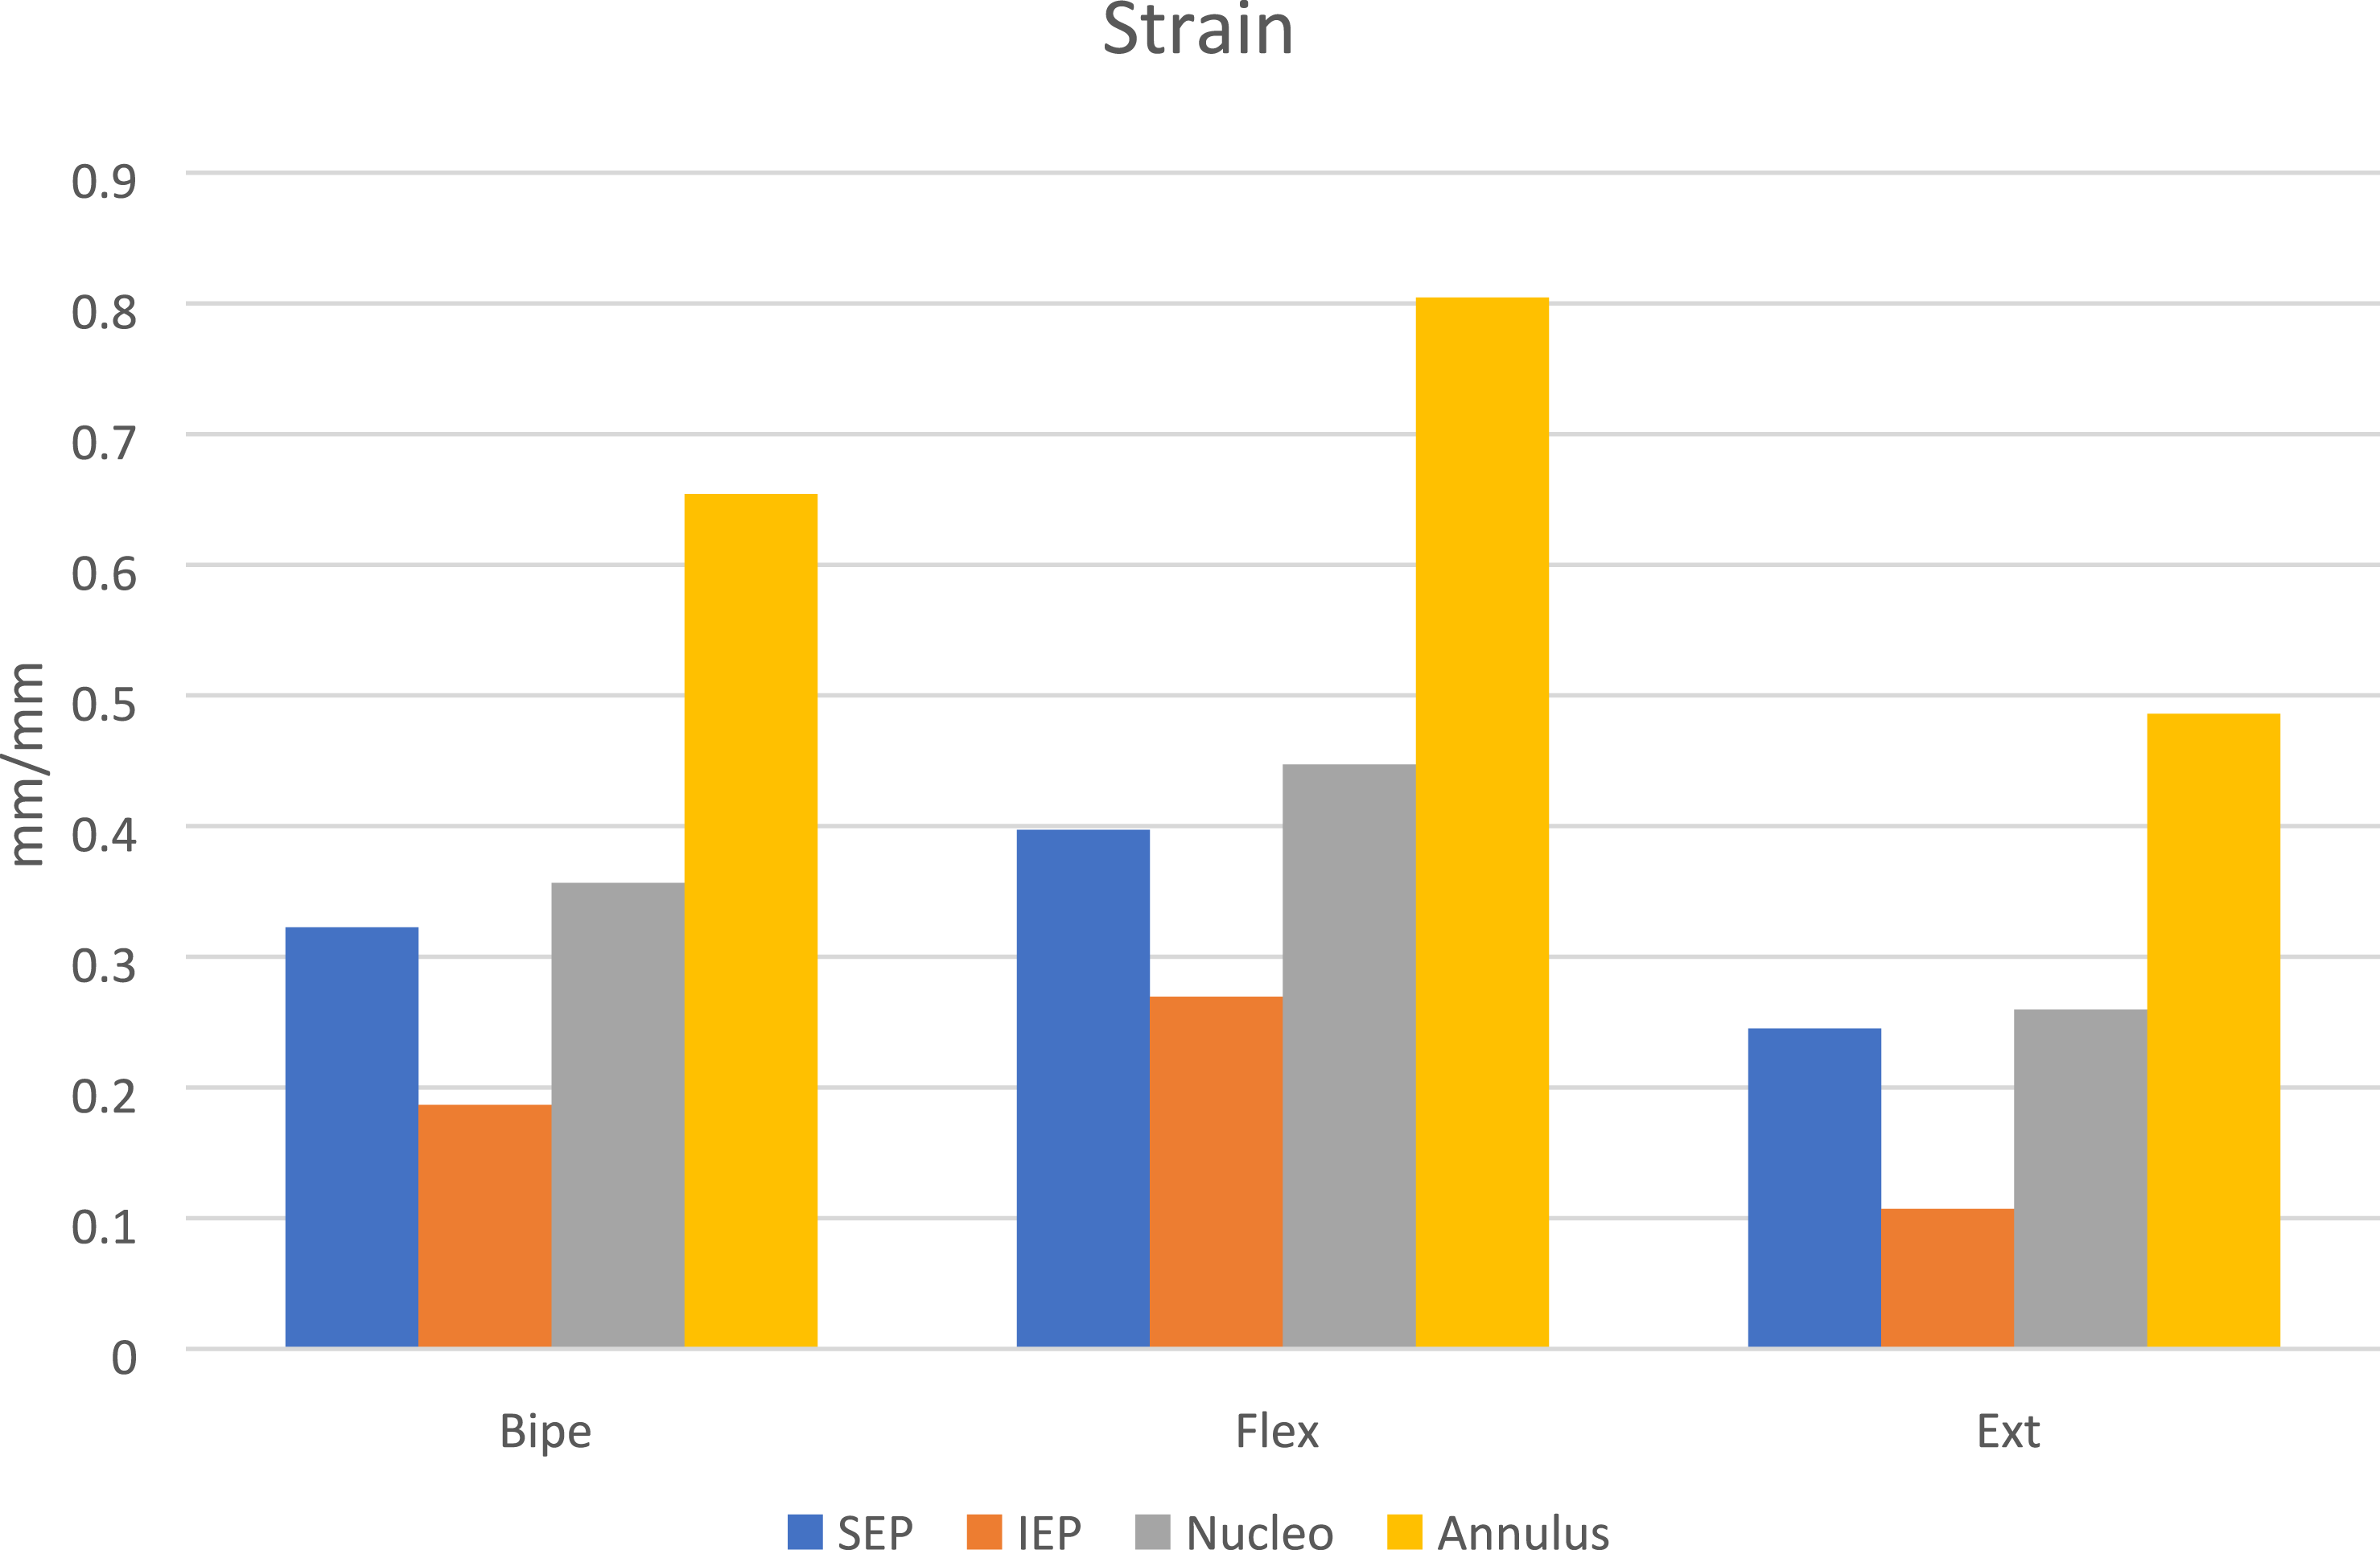
The highest and lowest maximum principal stress values in the L5S1 superior endplate for the 3 movements studied were 7.3253 MPa and −2.4703 MPa in bipedestation, 8.9309 MPa and −3.9156 MPa in flexion, and 5.6492 MPa and −1.3863 MPa in extension, respectively. Similarly, the maximum strain showed magnitudes of .3226 in bipedestation, .3971 in flexion, and .2451 in extension. On the other hand, the maximum principal stress in the L5S1 inferior endplate had maximum and minimum values of 6.0535 MPa and −1.7179 MPa in bipedestation, 8.7387 MPa and −2.4768 MPa in flexion, and 3.492 MPa and −1.4932 MPa in extension, respectively. Likewise, the maximum strain of this tissue was .1867 in bipedestation, .2695 in flexion, and .1071 in extension. The maximum principal stress of the L5S1 nucleus pulposus, in the 3 models, had maximum and minimum values of −.0180 MPa and −.7796 MPa in bipedestation, −.0278 MPa and −.9888 MPa in flexion, and −.0029 MPa and −.5909 MPa in extension, respectively. Similarly, the maximum strain of the tissue is .2596 in bipedestal position, .3566 in flexion, and .4472 in extension. On the other hand, the maximum principal stress of the L5S1 annulus fibrosus had maximum and minimum values of 1.0387 MPa and −.7355 MPa in bipedestation, 1.4033 MPa and −.8848 MPa in flexion, and .7099 MPa and −.579 MPa in extension, respectively. Similarly, the maximum strain had magnitudes of .6542 in bipedestal position, .8045 in flexion, and .4860 in extension.
Ligaments
The strain in the ligament complexes of L4-L5 and L5-S1 is evident, as shown in Graphs 7 and 8. In the L4-L5 complex, the Supraspinous Ligament (SL) showed the greatest strain in the movements of bipedestation and flexion, with values of .0543 and .1005, respectively. On the other hand, for extension, the Interspinous Ligament (ISL) undergoes the most deformation, with a value of .0502. Conversely, the Right TL-L4-L5 has the least deformation in all 3 movements, with values of .0016 in bipedestation, .0024 in flexion, and .0044 in extension. Strain in the L4L5 ligamentous complex. Strain in the L5S1 ligamentous complex.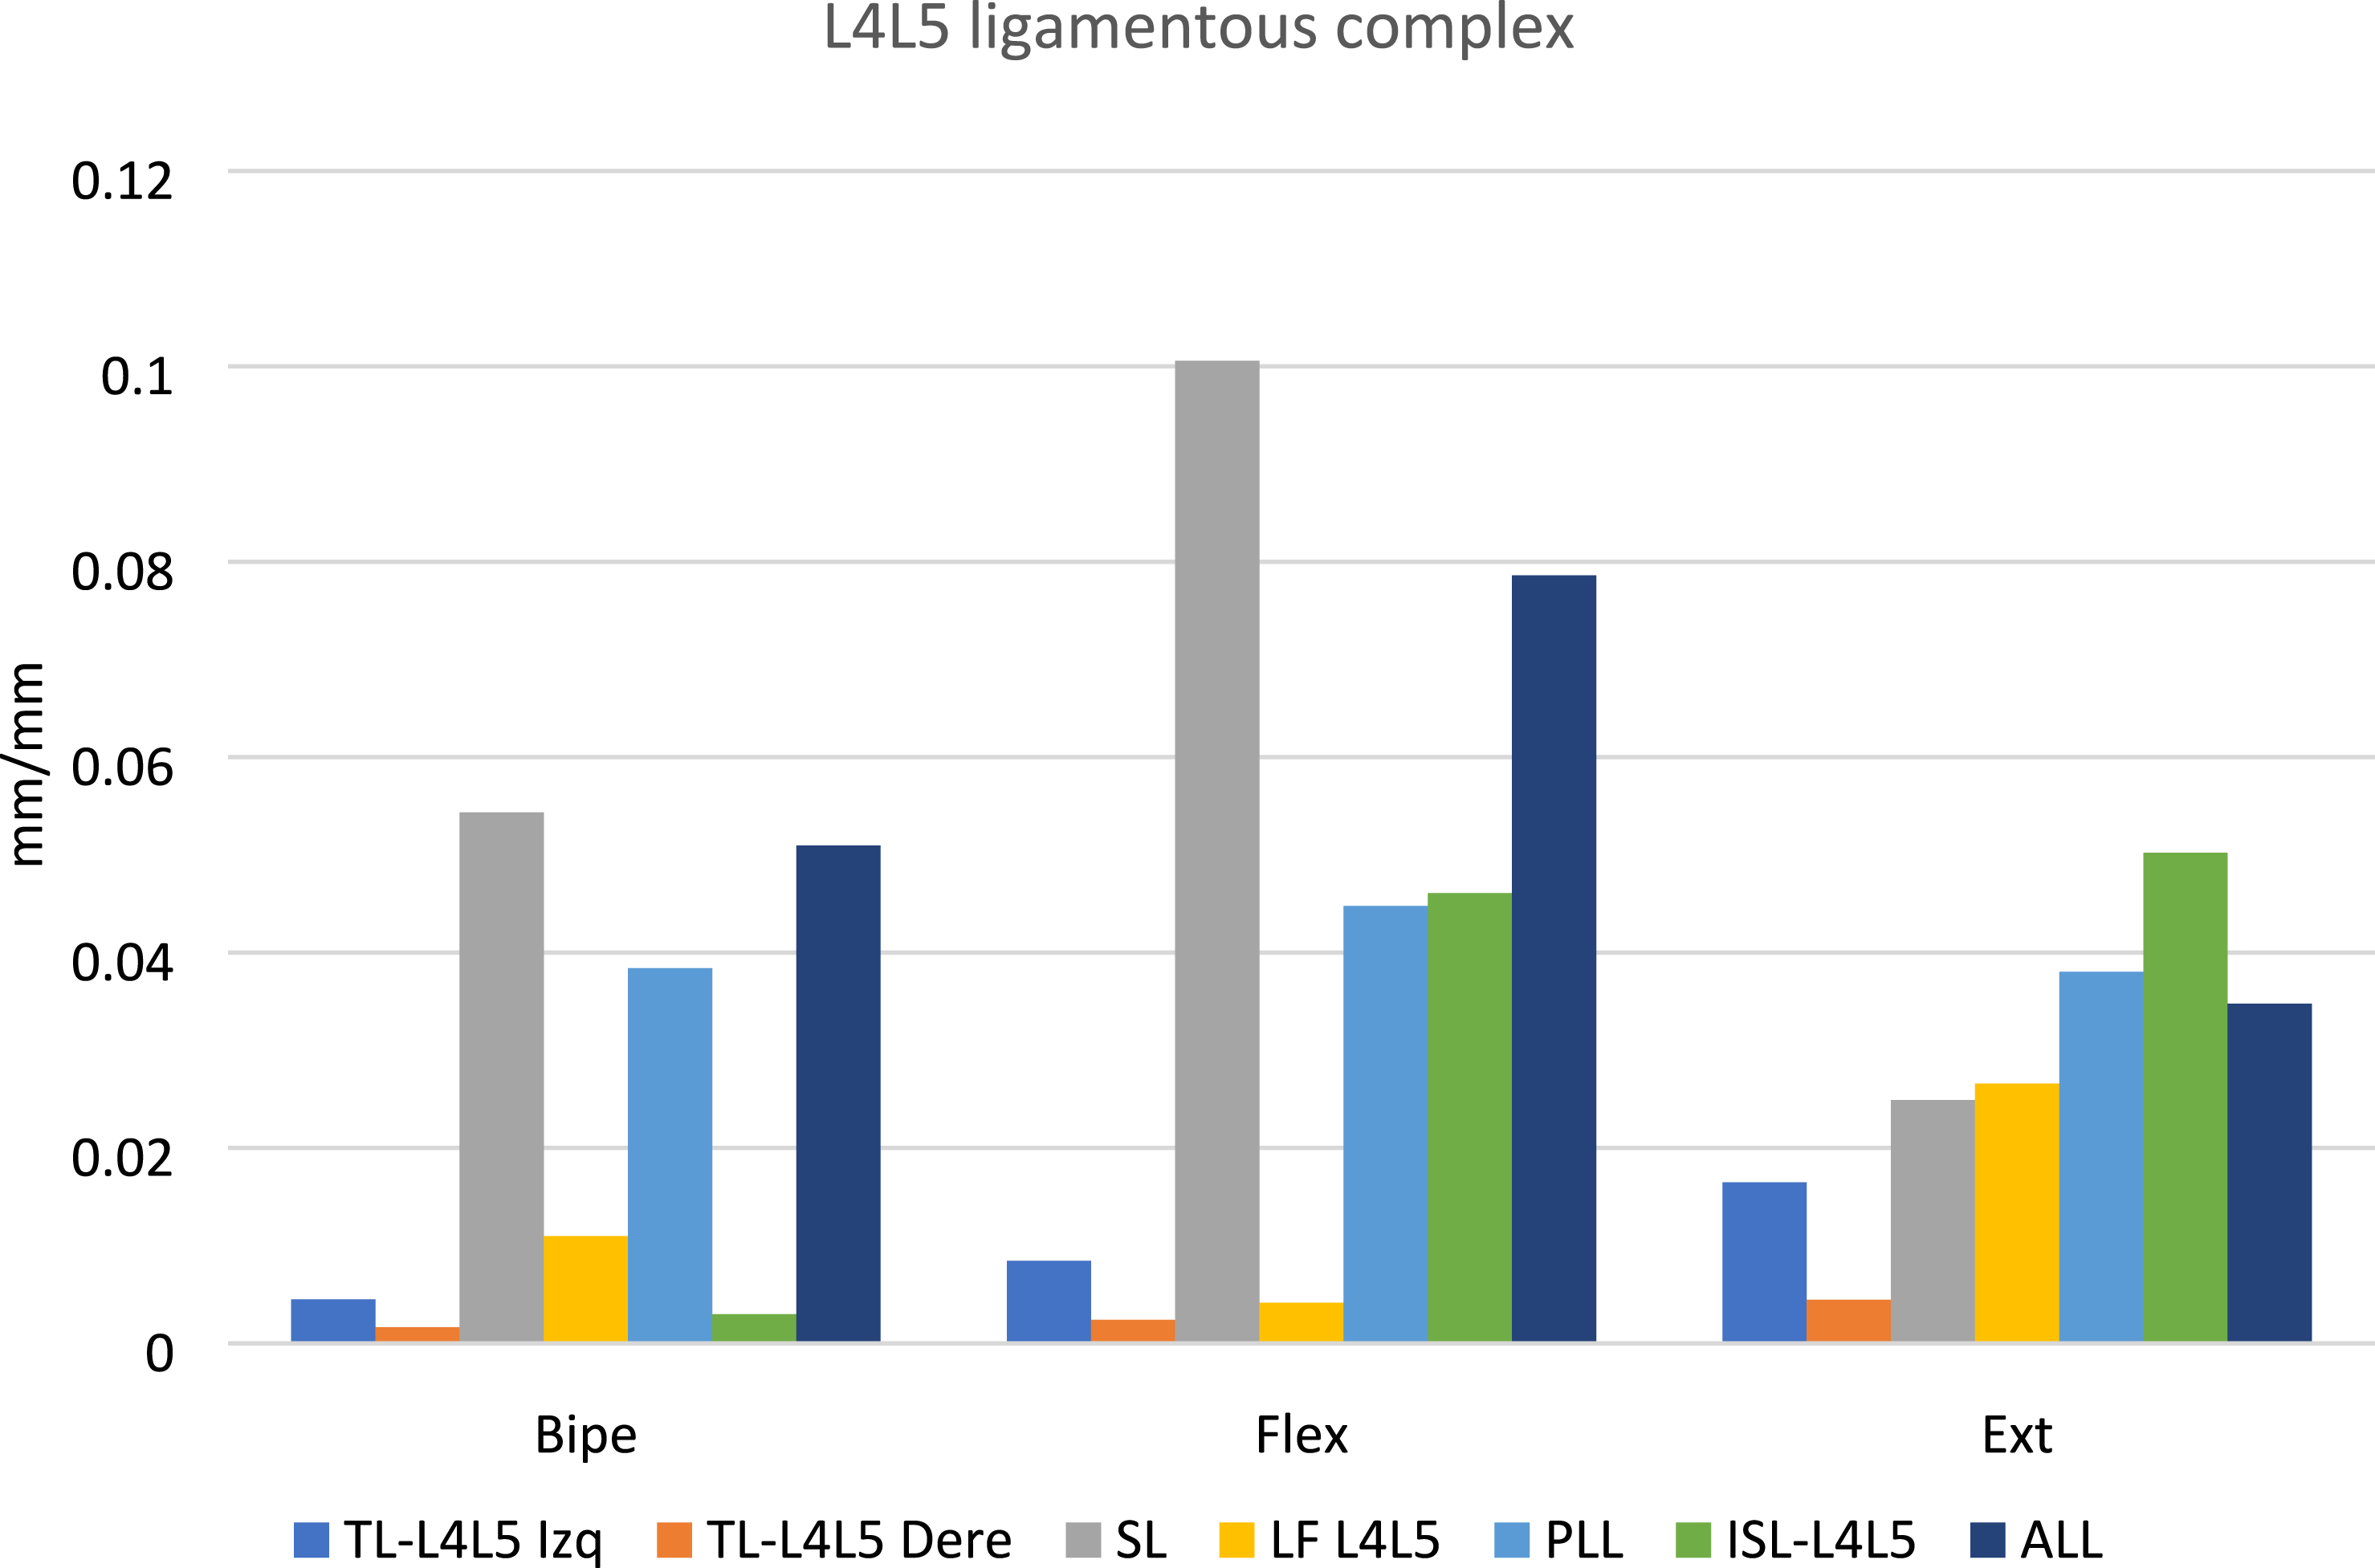
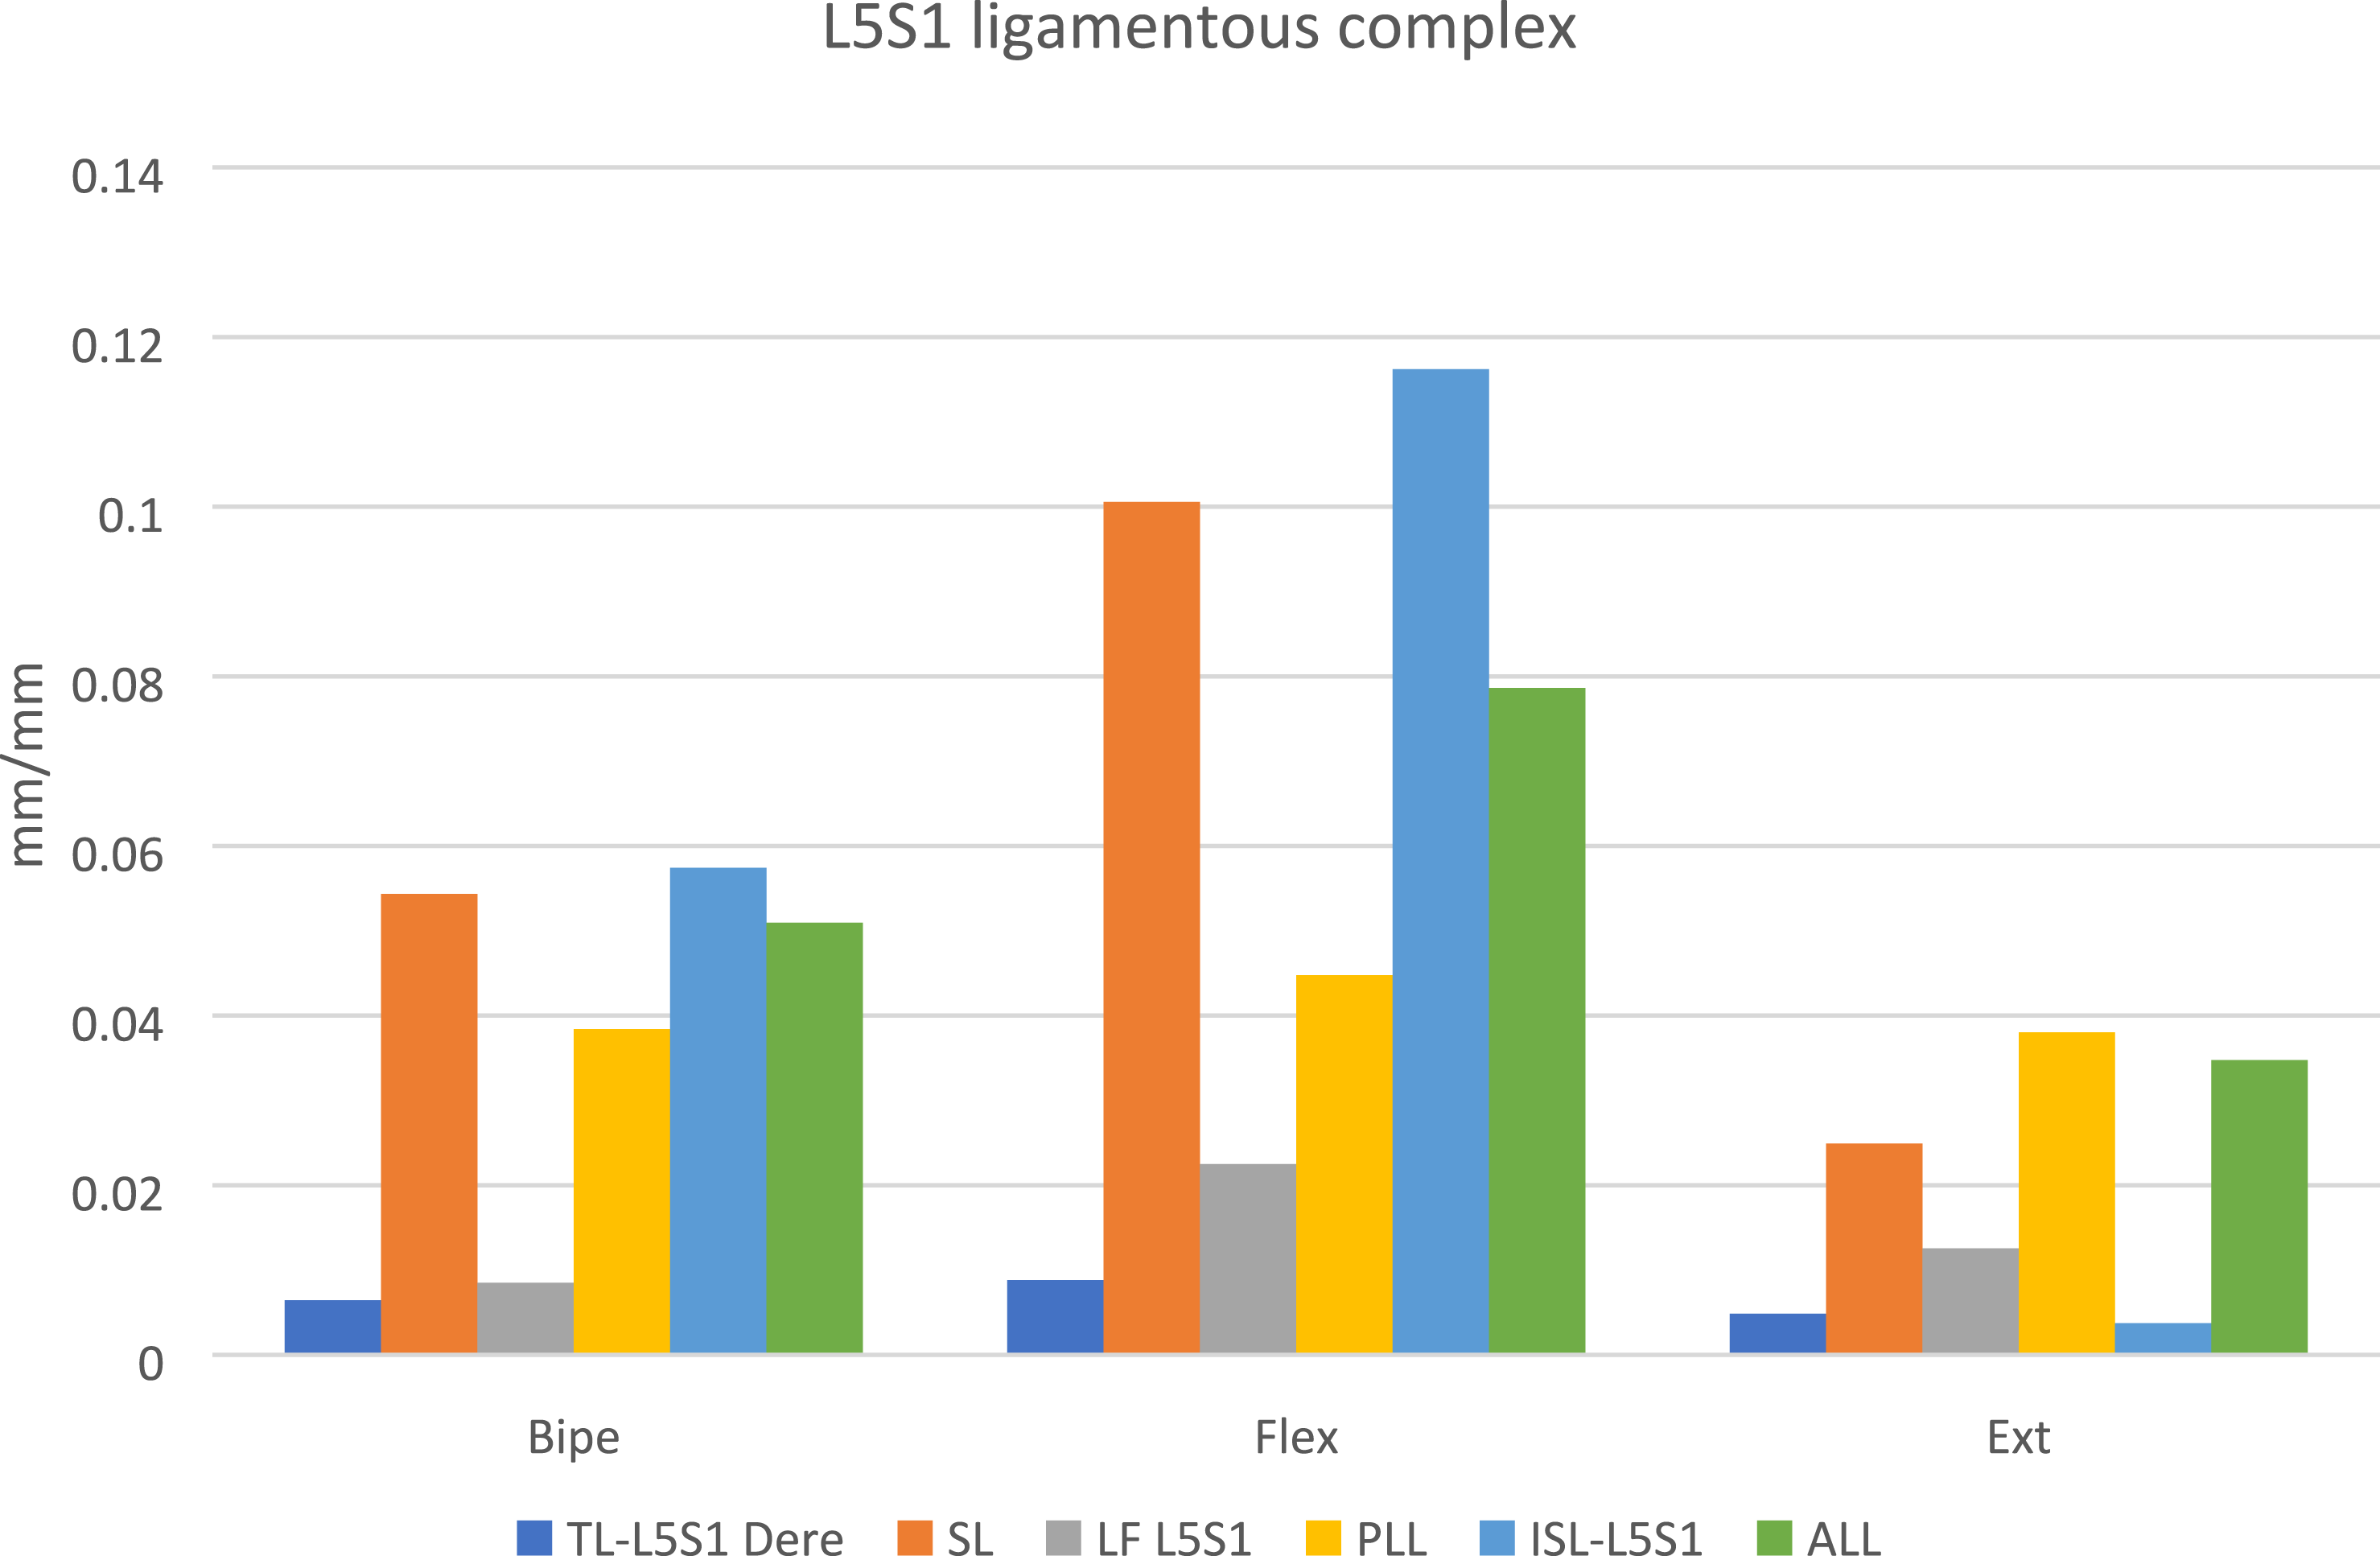
Regarding the strain in the ligament complex of L5-S1, it is observed that the ISL is the structure with greatest deformation values in the movements of bipedestation and flexion, obtaining values of .0574 and .1162, respectively. Likewise, for extension, the Posterior Longitudinal Ligament (PLL) presented the greatest deformation, with a value of .038036. On the other hand, the ligament with the least deformation value was the Right TL-L5-S1 with values of .0064 and .0088, respectively for flexion and extension movements, as well as the ISL for extension, demonstrating the least deformation value of .0037.
Facet Joint Systems
During bipedestation in both facet L4-L5 and L5-S1 joints, load concentration is evident in the posterior and inferior aspect of the medial facet surface.
For flexion movement in both L4-L5 and L5-S1 facet joints, the region of highest total deformation was found at the posterior and inferior edge. The strain distribution showed traction load and distraction-induced deformation (rather than compression) during flexion. The region of highest strain and consequently the region of lower maximum principal stress values were located at the anterosuperior margin of the cartilage. On the other hand, on the lateral margin of the facet joints, the facet cartilage demonstrates homogeneous total deformation.
In extension movement, the region of highest total deformation is at the posterior edge of the facet joints, followed by the inferior edge, secondary to axial load distribution and compression-induced deformation. However, the behavior of total deformation and consequently maximum principal stress is nearly linear across the entire extent of the facet cartilage. This indicates a load distribution mechanism across its surface despite a point of load concentration at its posterior margin.
Discussion
The biomechanical behavior of the lumbar spine from L4 to S1 was studied in bipedestation, flexion, and extension movements. The model included differentiation from cortical and trabecular bone in L4 and L5 vertebra, ligaments (anterior longitudinal, posterior longitudinal, supraspinous, interspinous, flavum, and intertransverse), annulus fibrosus, nucleus pulposus, terminal endplates, and facet joints with cartilages. Biomechanical analysis was performed considering 300 N, 460 N, and 600 N axial loads and moments of 5 Nm and 7.5 Nm for flexion and extension movements. The measured variables used to analyze and compare the model were total deformation, strain, Von Mises stress, and maximum principal stress. Both total and strain appear in different papers27-29 to determine the biomechanical response of the analyzed anatomical region of interest as well as the Von Mises stress variable.11,17,18 The maximum principal stress served as a parameter to analyze the mechanical response in fragile materials to external forces, and therefore, it was used to analyze the behavior of L4 and L5 vertebrae. All data was validated against prior in-vivo and finite element models.
With this biomechanical analysis, we propose 3 biomechanical functions (axial load distribution, axial stress attenuation and stability capacity), through 3 anatomical systems in the lumbosacral junction.
Trabecular Bone
Is a highly porous tissue composed of trabecular struts and plates that form a three-dimensional lattice structure, giving long bones and vertebral bodies a spongy appearance and solid framework for the filling bone marrow, also this type of tissue is characterized be an anisotropic ductile material that at microstructural scale, withstands tension and compression forces, and finally optimize load transfer.30,31 Based on the results obtained in the trabecular bone of the L5 vertebra, the maximum principal stress showed that the anatomical structure that bears the highest stress is the inferior vertebral notch (IVN), as shown in Graphs 1 and 3. The distribution demonstrates that this anatomical region transfers load energy along its section and through vertebral pedicles, as shown in Figure 5. This can be explained due to the trabecular bone lattice 3D arrangement, from the superior and inferior vertebral endplates, passing throughout the vertebral body and finally connecting to the posterior elements through the vertebral pedicles. On the other hand, when comparing the values of the maximum stress in the L5 vertebra in the 3 movements, flexion movement generates the highest tensile stress the vertebral segments overall analyzed. Likewise, bipedestation generates the highest compressive loads on the vertebra. The results in Graphs 3 suggest that the anatomical structure that supports the highest compressive stress is the inferior articular process (IAP), in all 3 movements studied. Maximum principal stress in L5 vertebrae (trabecular bone) during flexion movement.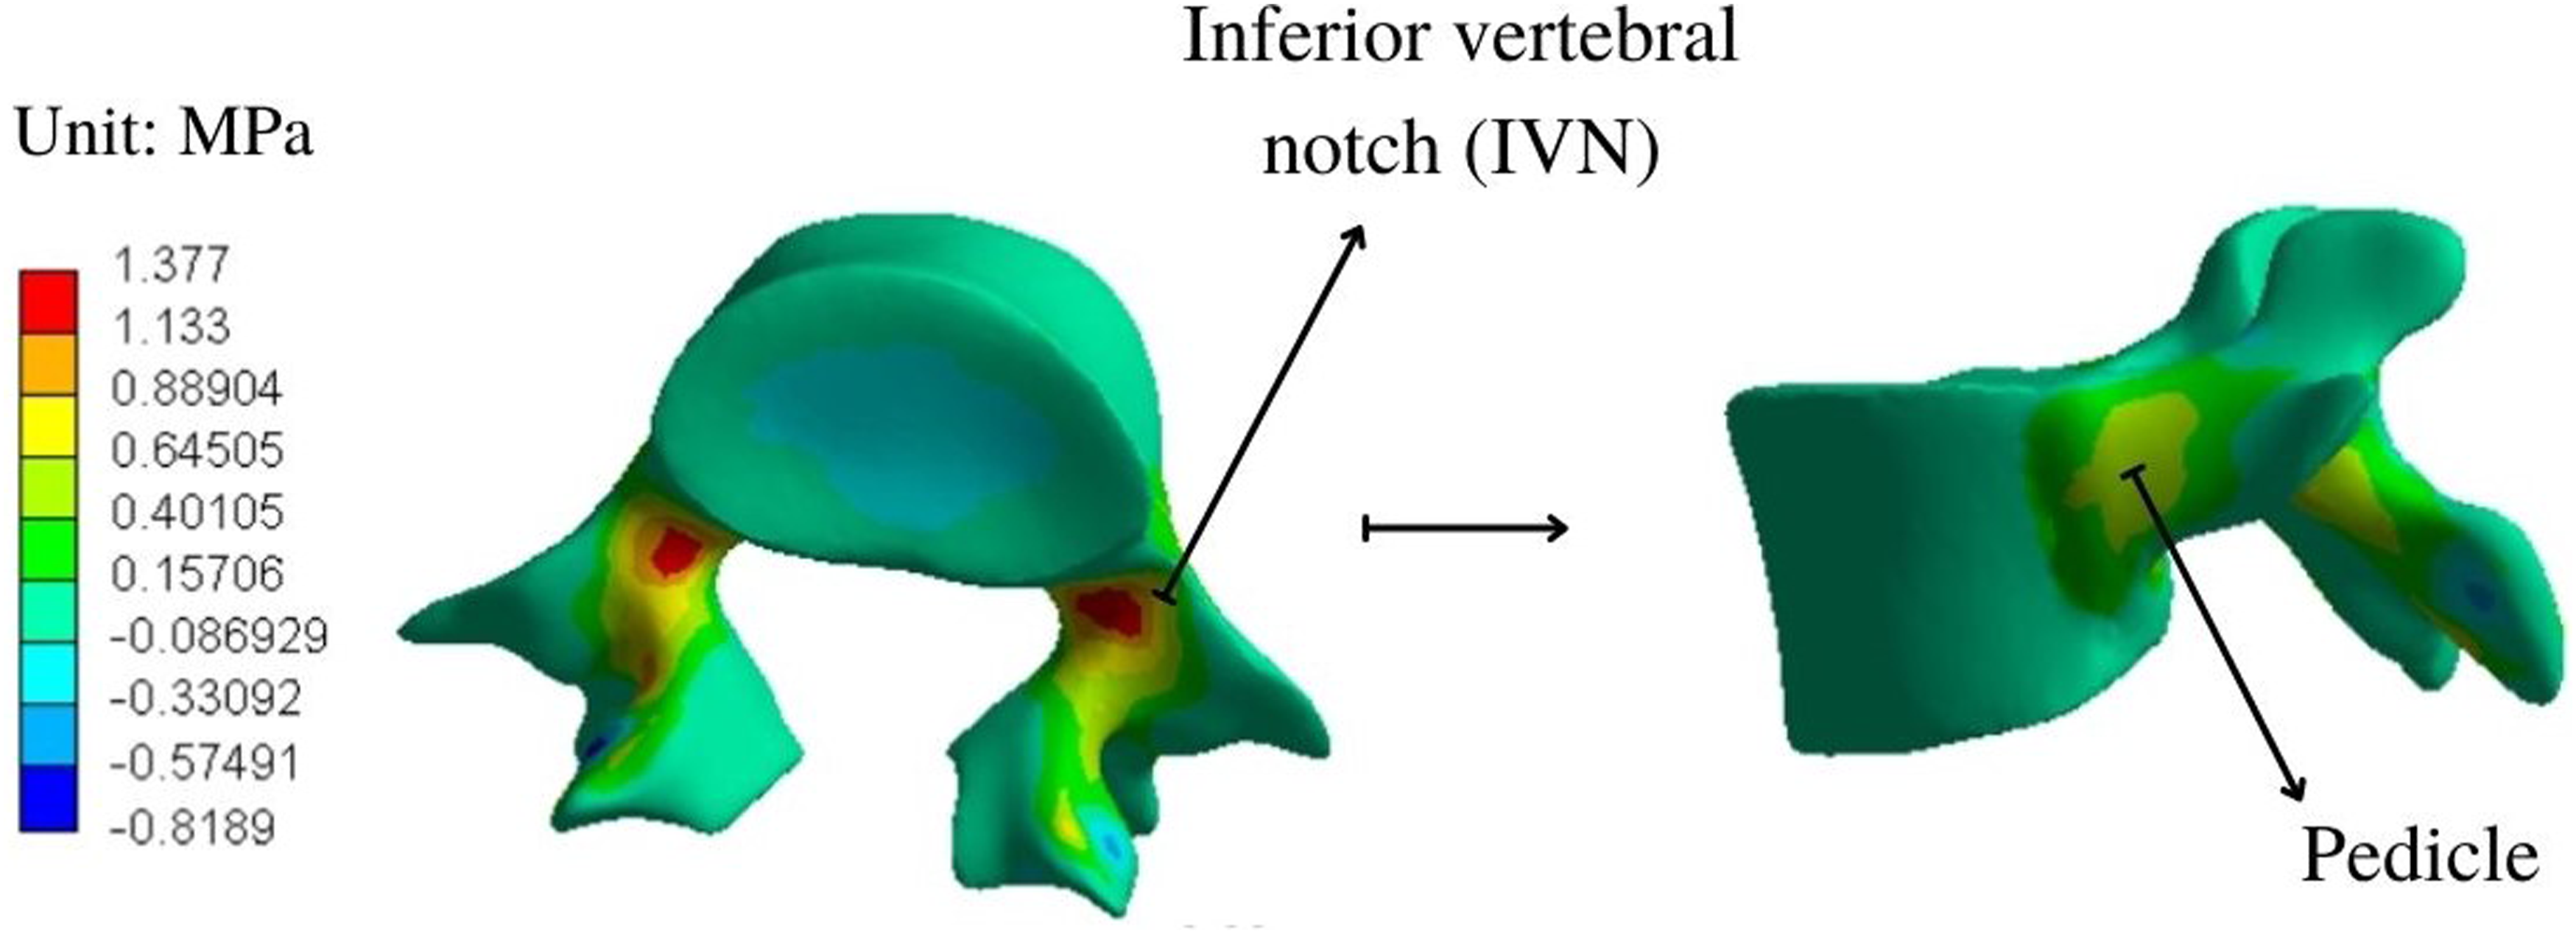
For strain, it is observed that the trabecular IAP is the anatomical structure with the highest values when the model is subjected to loads of bipedestation, flexion, and extension, as shown in Graphs 4 and 9. These graphs also demonstrate that flexion is the movement that causes the most deformation in the lumbar spine tissues. Analyzing the strain and maximum principal stress, it is evident that the IAP is the anatomical structure that bears the highest compressive stress and is the structure that undergoes the most deformation in all the movements studied. This indicates that if the load capacity for the subject is exceeded, this anatomical point is the most prone to failure, being the most critical anatomical structure in the trabecular bone model. Strain in L5 trabecular bone vs cortical bone.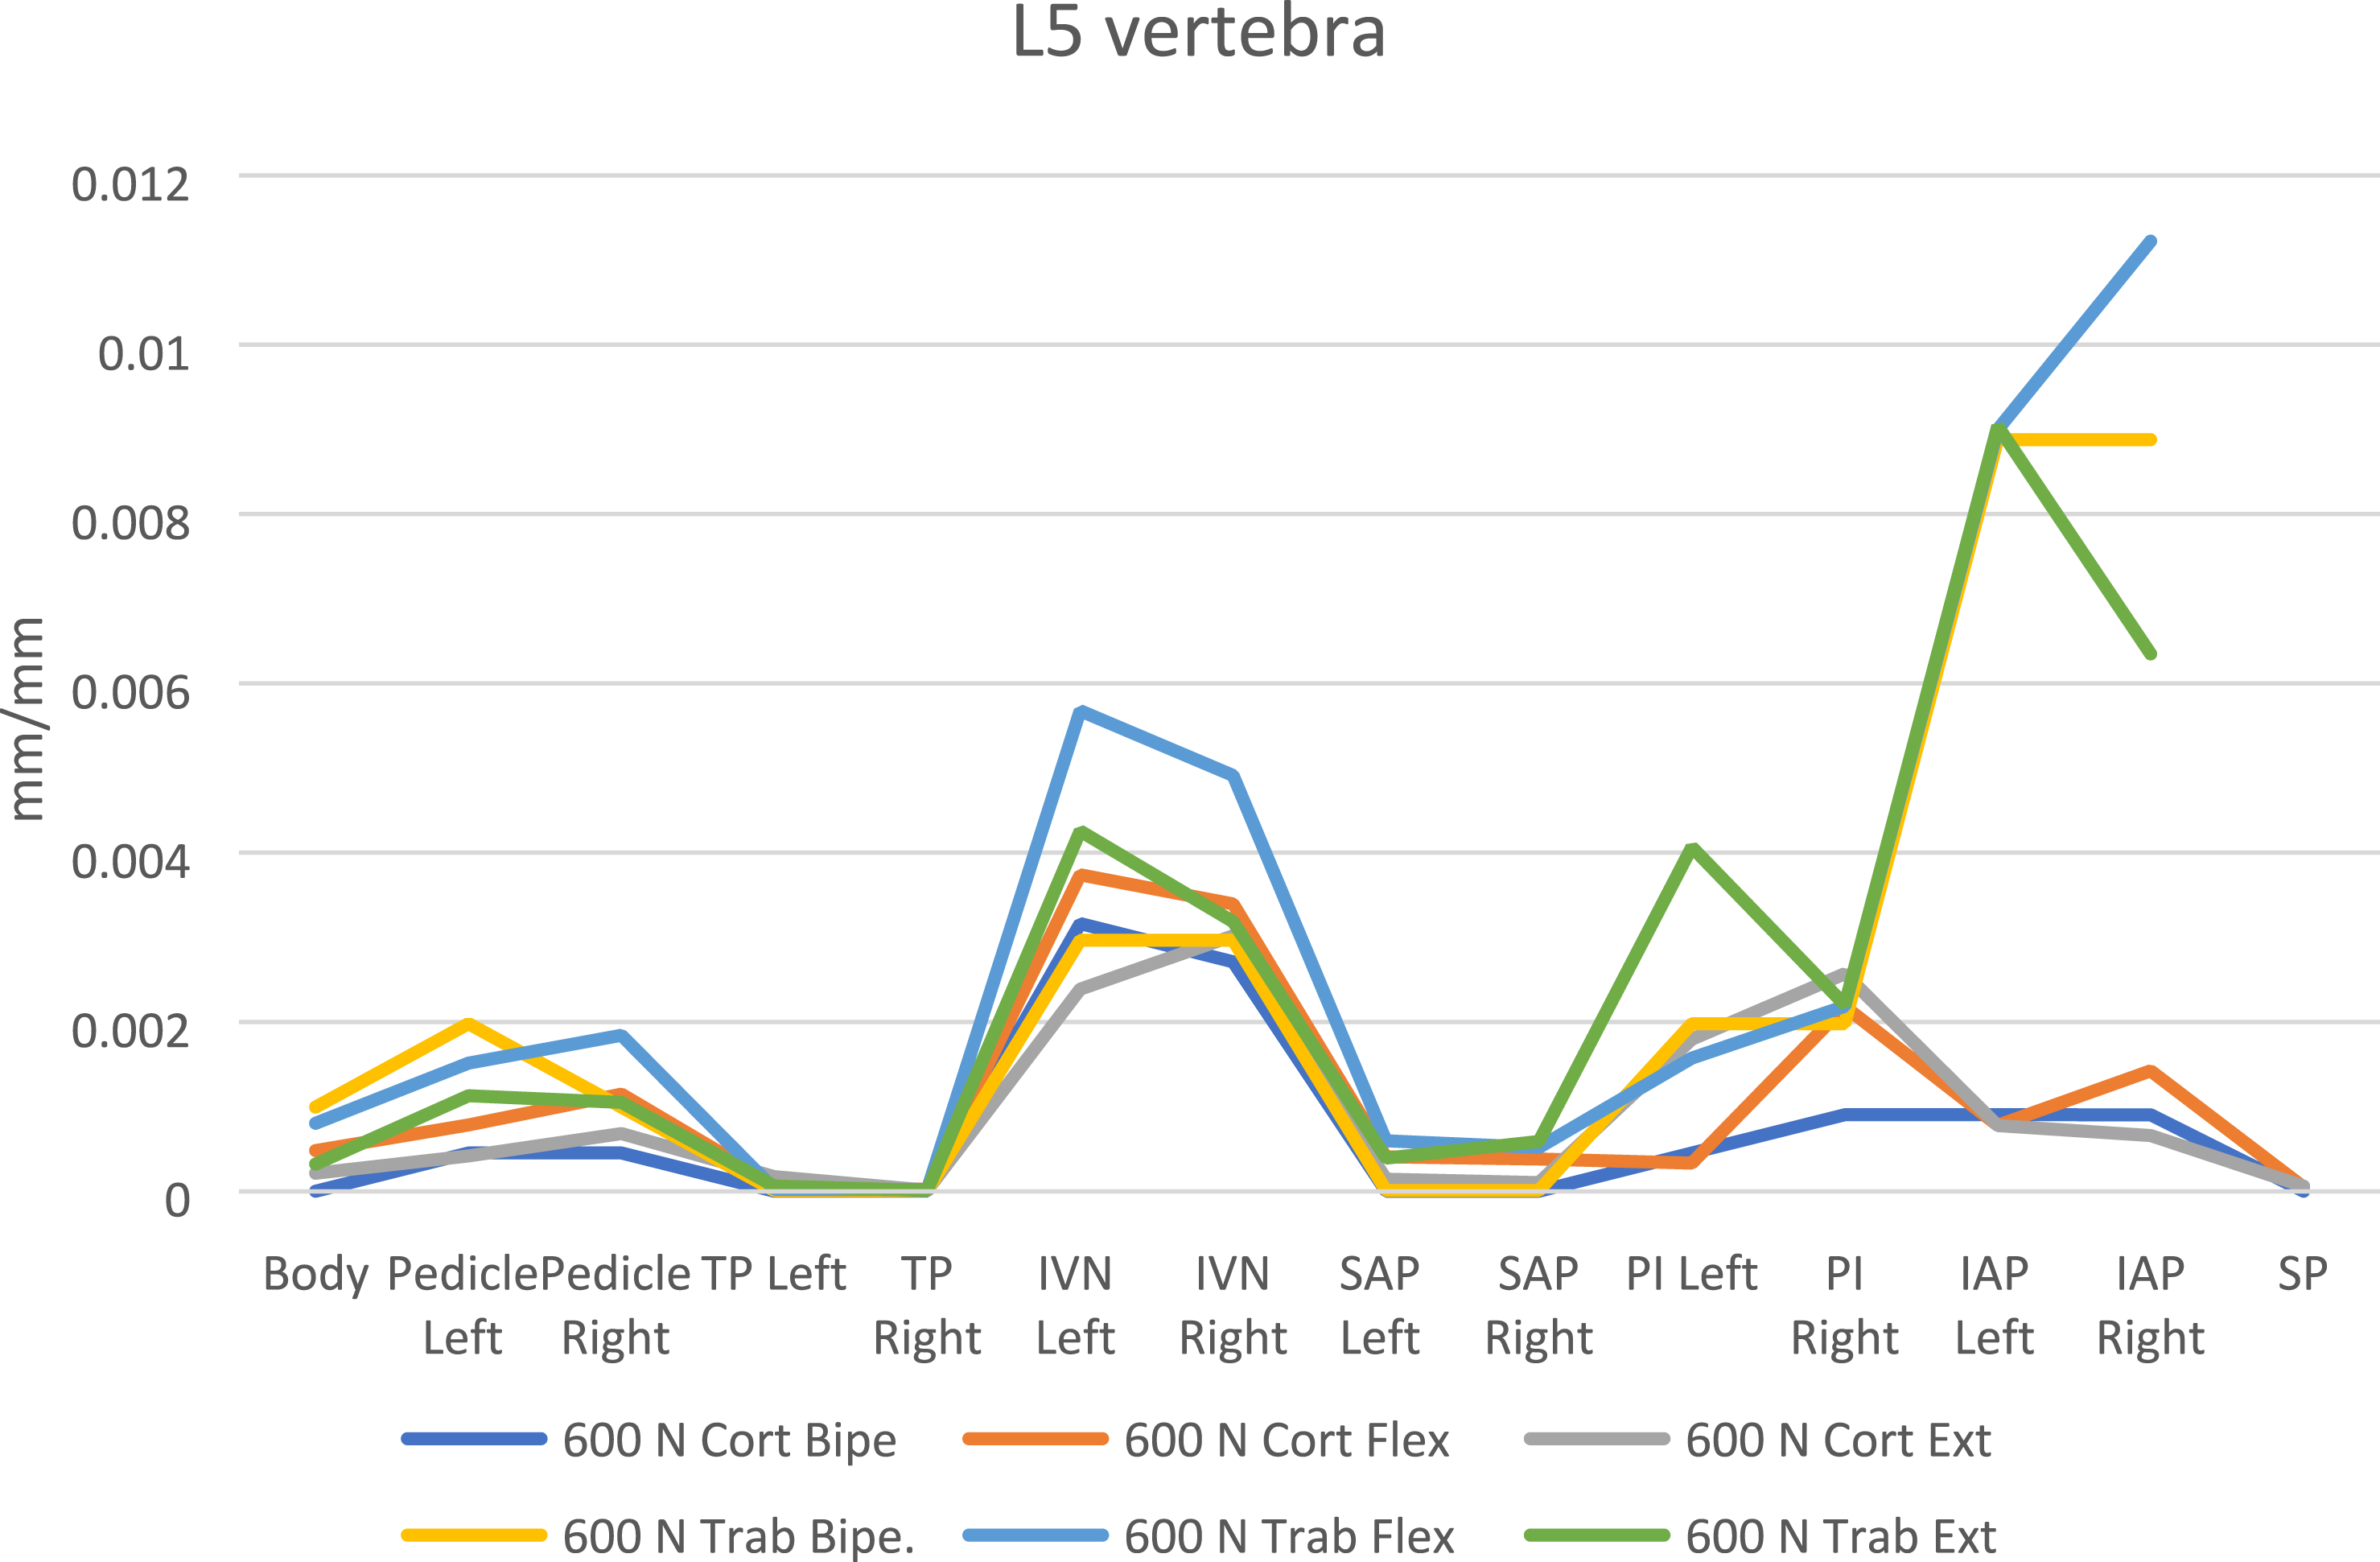
As seen in Figure 6, for the movements of bipedestation and flexion, the equivalent stress had a more uniform distribution in the vertebral body and higher values in the pedicles. On the other hand, the results for the extension movement showed that stress is concentrated asymmetrically in the vertebral body and pedicles. Equivalent stress distribution in L5 vertebrae.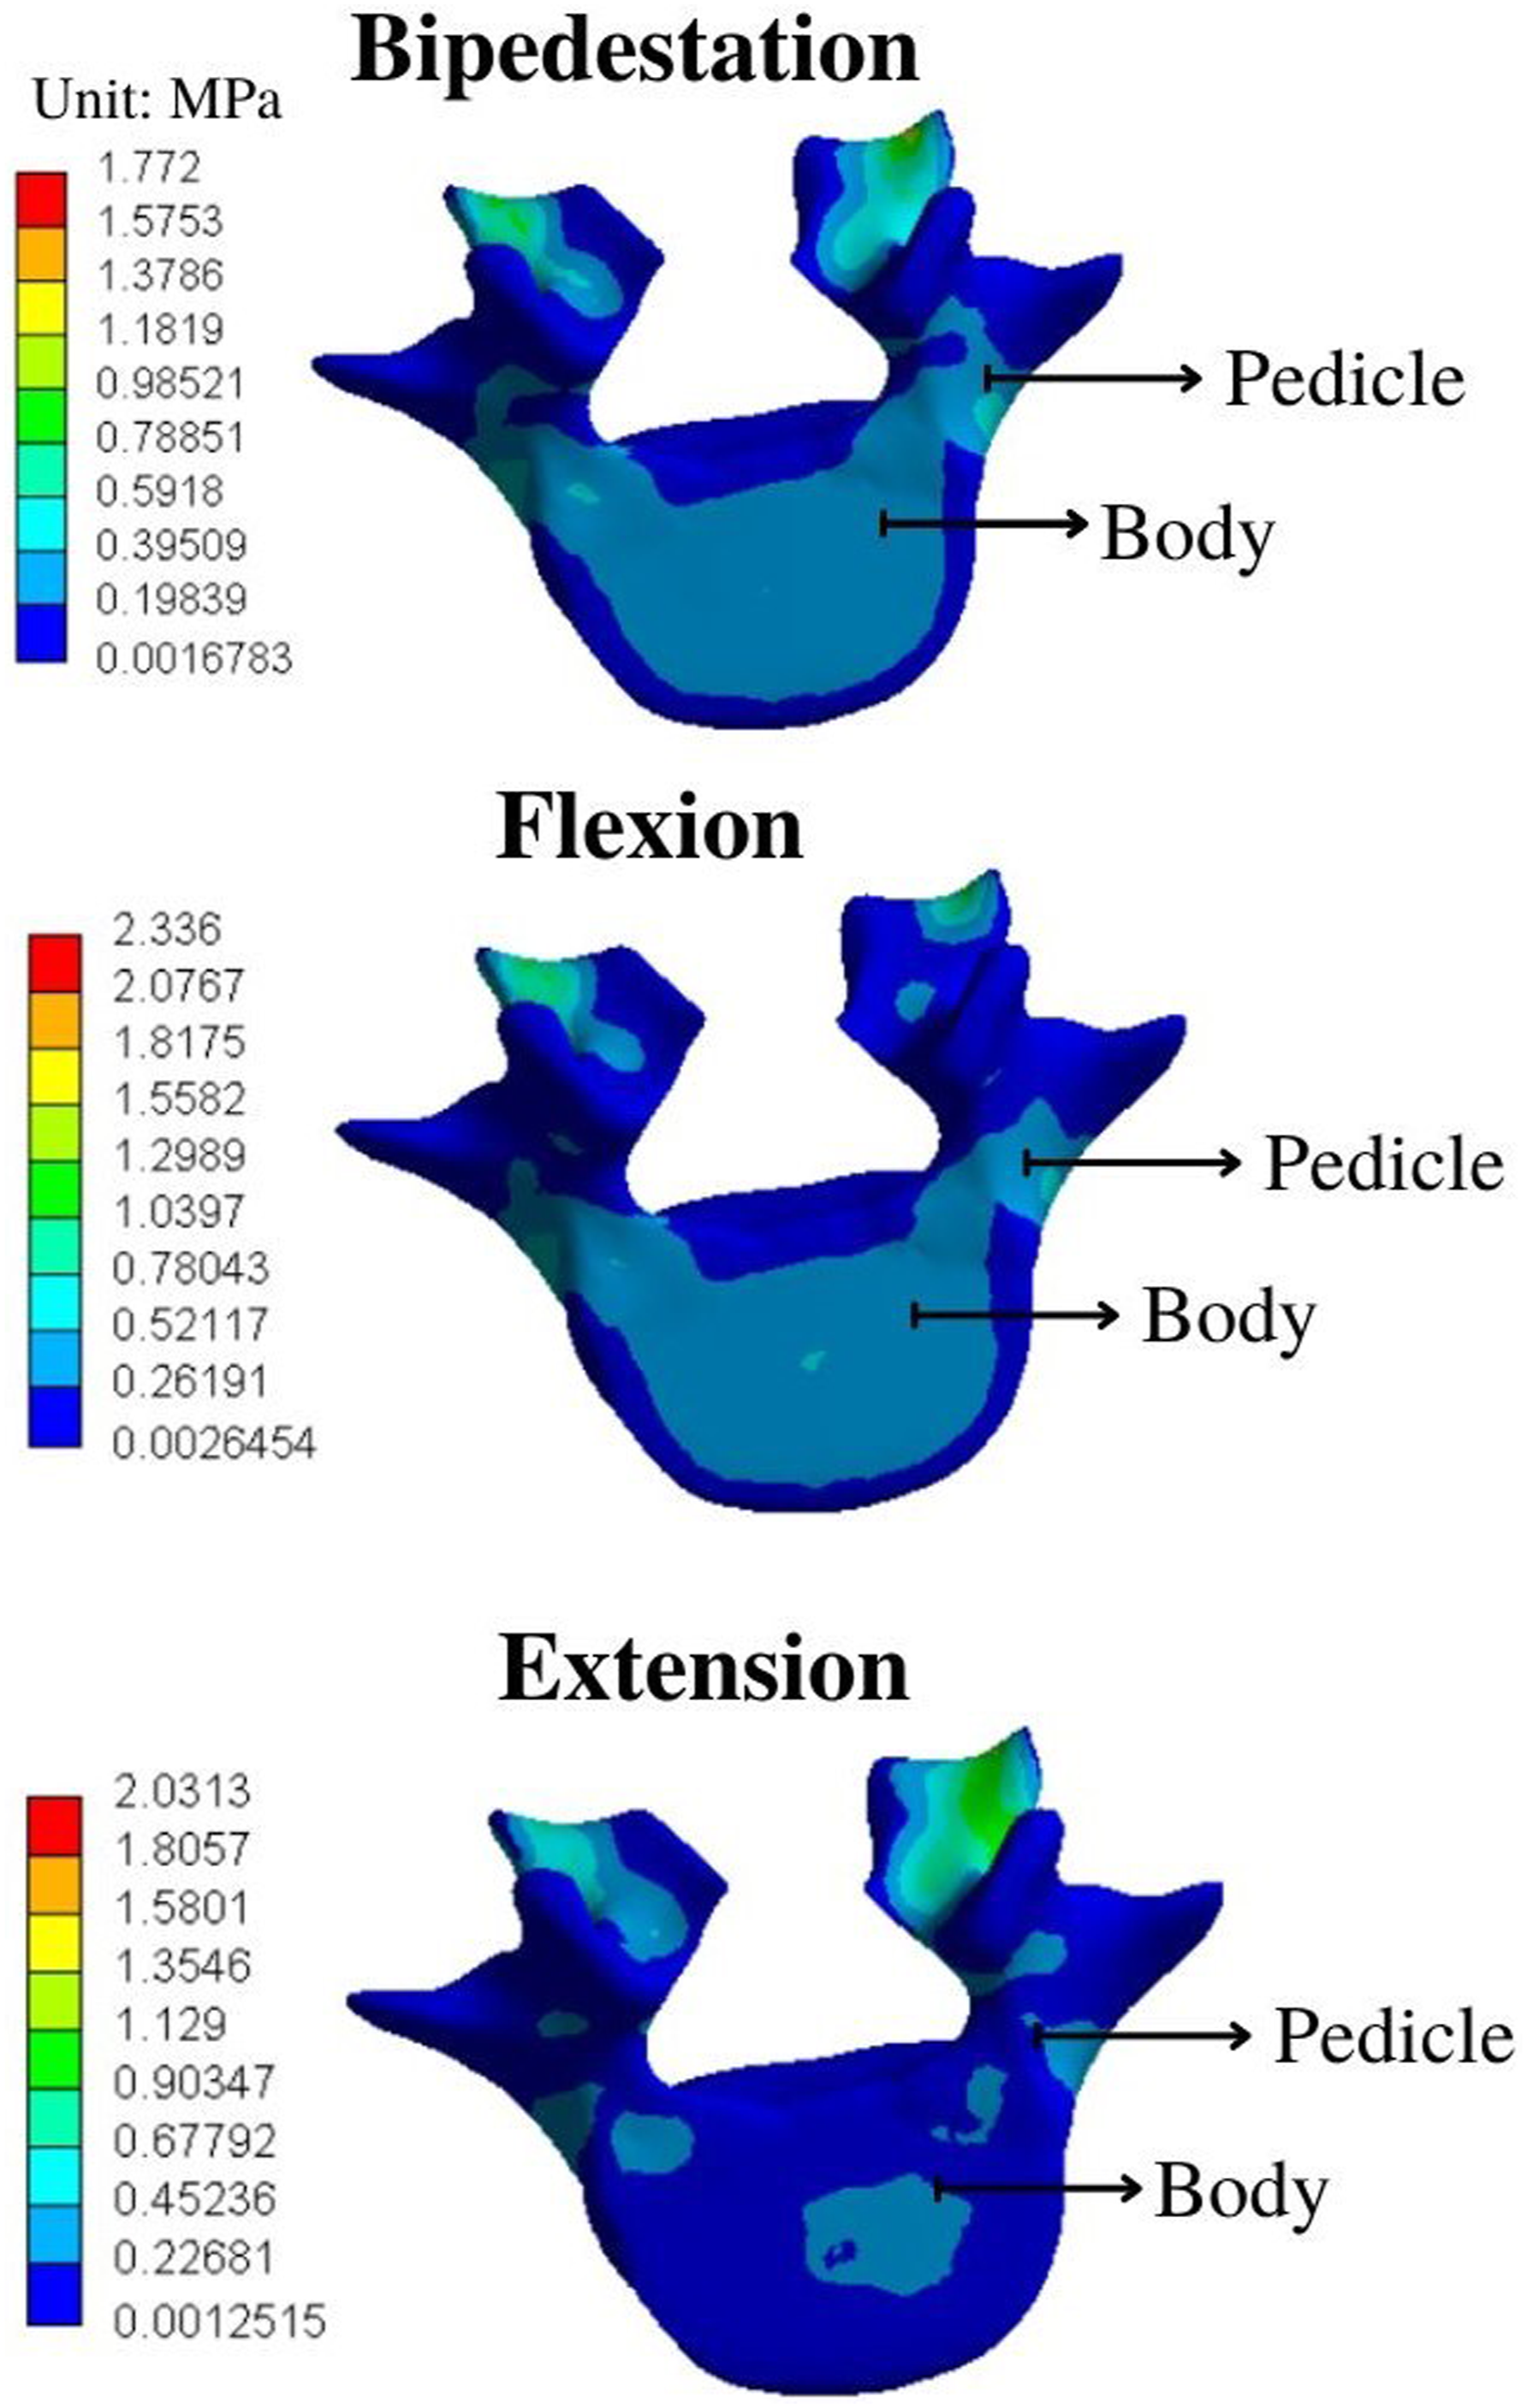
Figure 7 shows the load distribution from the L5 vertebra, passing through the vertebral body, superior and inferior endplates, nucleus pulposus, and annulus fibrosus, into the L5S1 inferior endplate, in the 3 movements analyzed. Overall, the results show how the cortical-trabecular ratio confers capacity of resistance to axial loads on the vertebrae by optimizing elastic capacity and stress distribution throughout the vertebral segment, without producing an early breaking point. Additionally, the model showed uniform load distribution capacity in the 3 postures throughout the vertebrae (passing through the superior and inferior end plates, nucleus pulposus, and ligaments until the next vertebrae), avoiding stress concentration. Maximum principal stress distribution in L5 vertebrae, from trabecular bone to terminal endplates.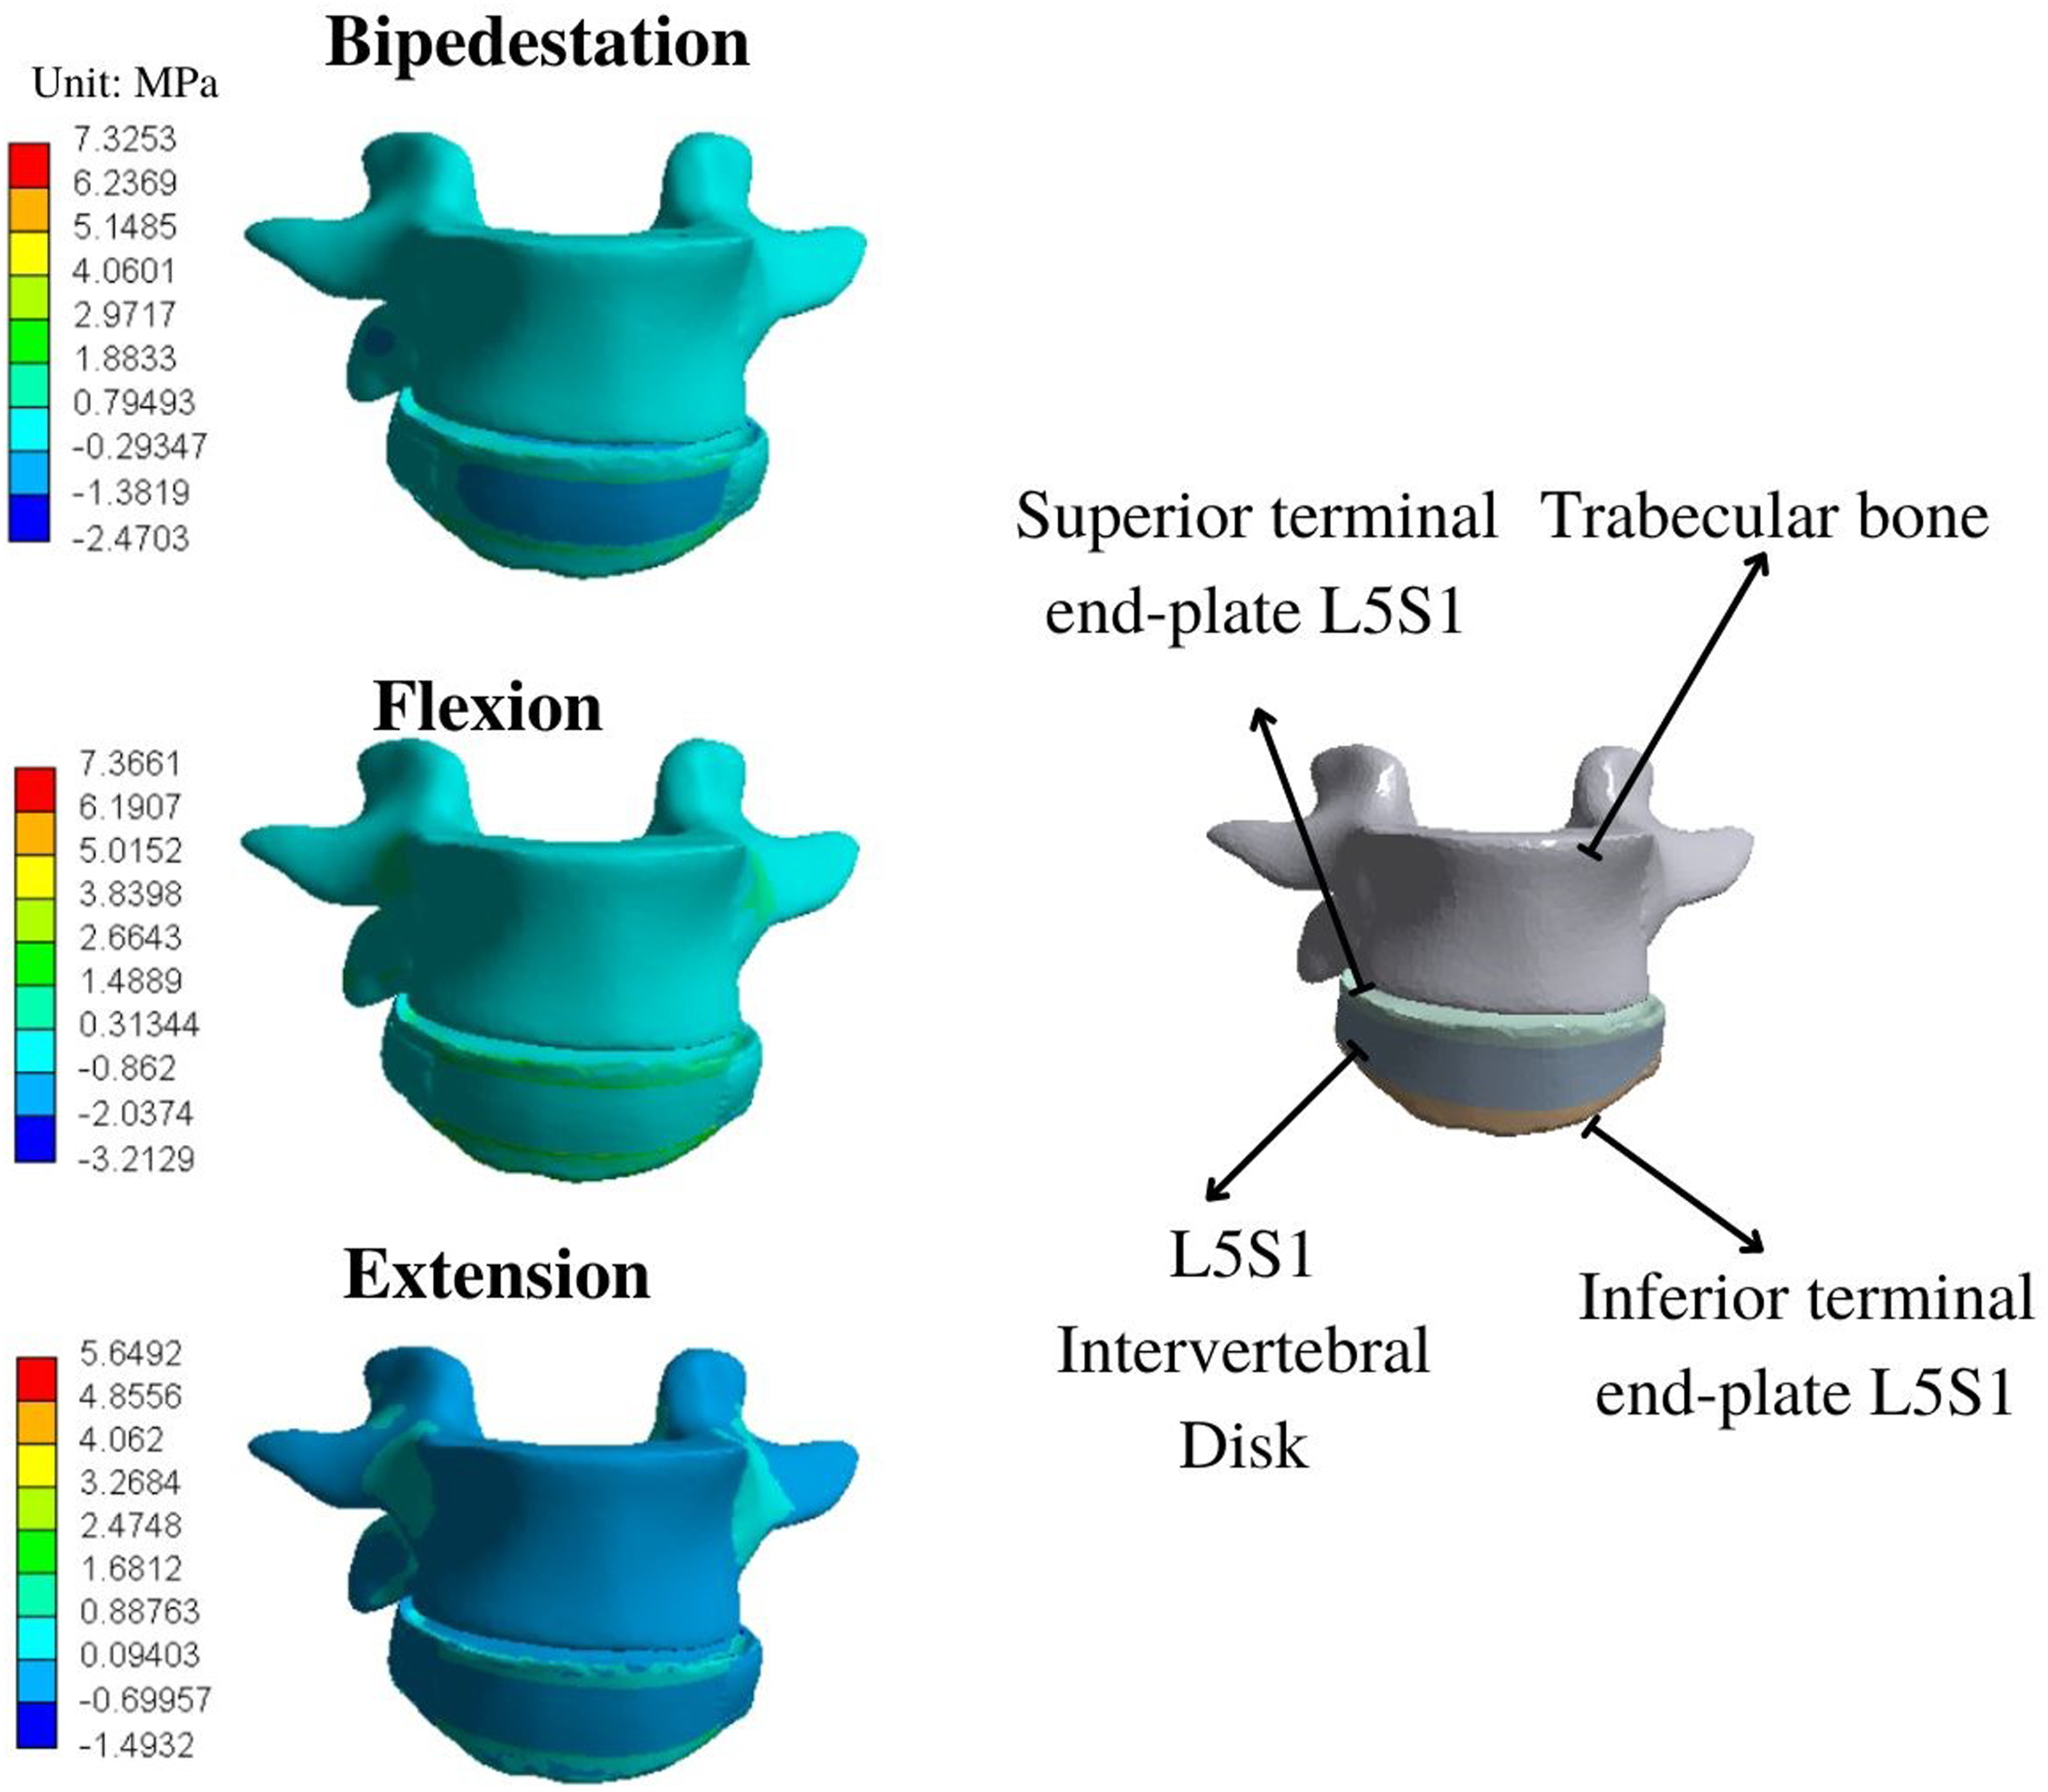
Figure 5 shows that stress dissipates from the IVN to the vertebral pedicles and subsequently, to the vertebral endplates, culminating in the sacrum, as seen in Figure 7. This indicates that the trabecular bone, together with the endplate acts as load conductor, were the end-plate is the anchoring anatomical region for the trabecular lattice, and likewise, the trabecular bone act as a solid structure for load-bearing capacity in the vertebral end-plates. This was investigated by Wang and Hu,
32
who studied the biomechanical behavior of the upper plate after a surgical procedure using finite element analysis with a 1200 N axial load to simulate vertical compression, and 15 Nm for flexion and extension movements. The authors concluded that the endplate in a system with absent trabecular bone is not efficient for axial load conduction; these results are similar with the ones obtained in this study (Figure 7). Besides, when we compare the stress distribution on the inferior terminal plate, it is possible to see a similar distribution than presented by Rohlmann et al,
33
where the maximum stress is concentrated in the anterior part region during flexion and extension movements. Because of this, we propose calling the trabecular bone and terminal endplates (see Figure 8) as a trabecular system, aiding conduction for axial load distribution (distribution system) and bone elasticity. Terminal endplate von-Mises distribution at 600 N and 7.5 Nm.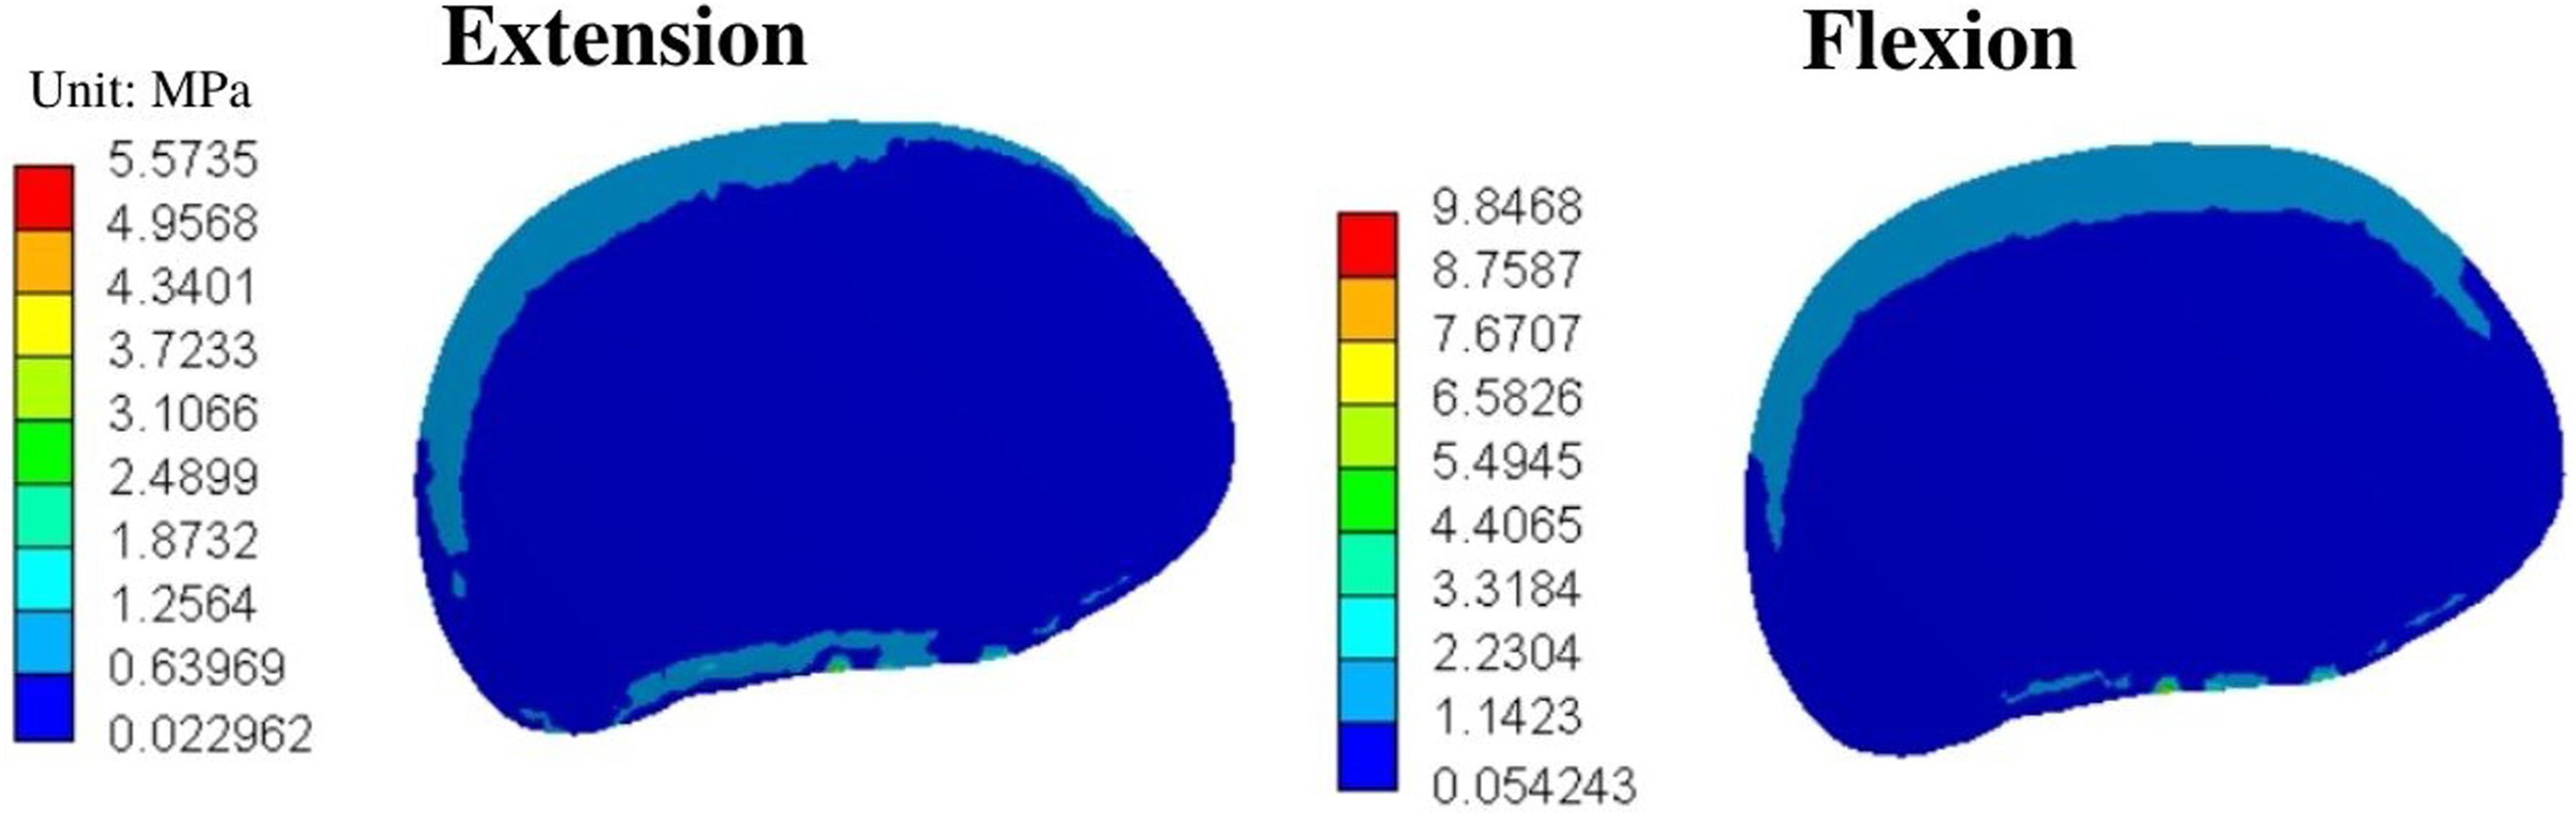
Ligamentous-Intervertebral Disk Complex
This complex is responsible for allowing movement under normal physiological loads and provides significant support to the spine against deforming forces.
34
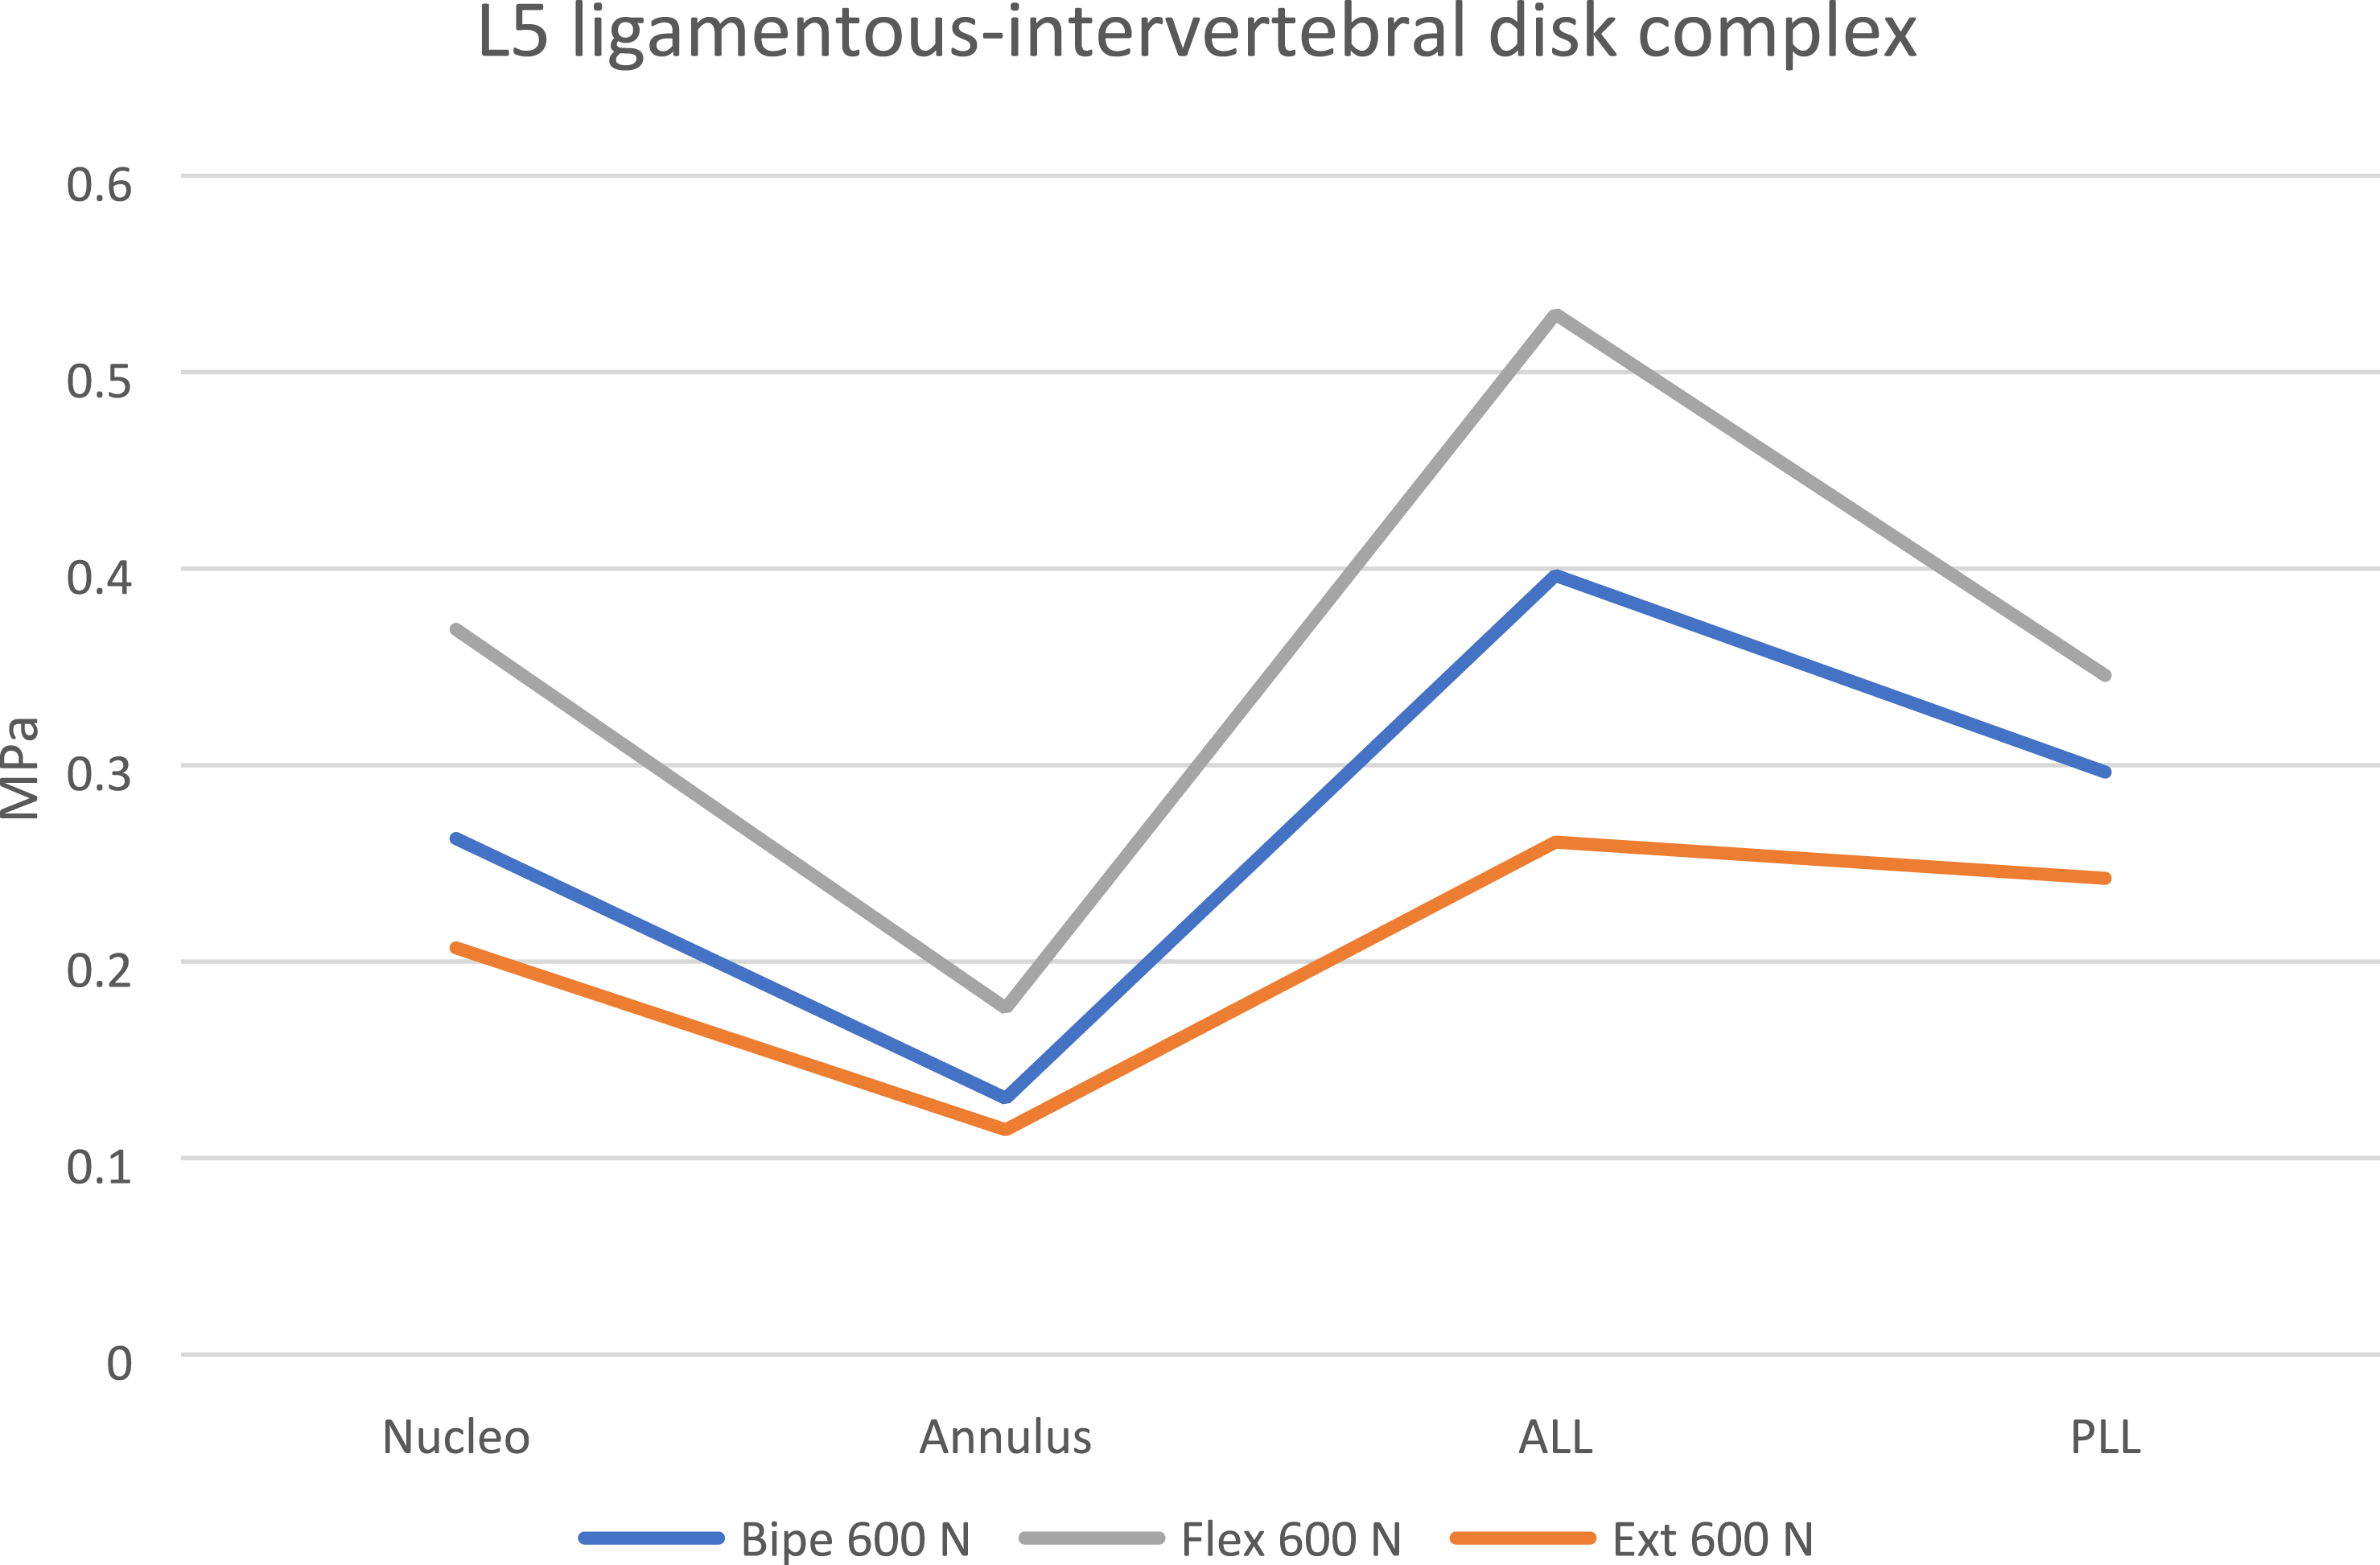
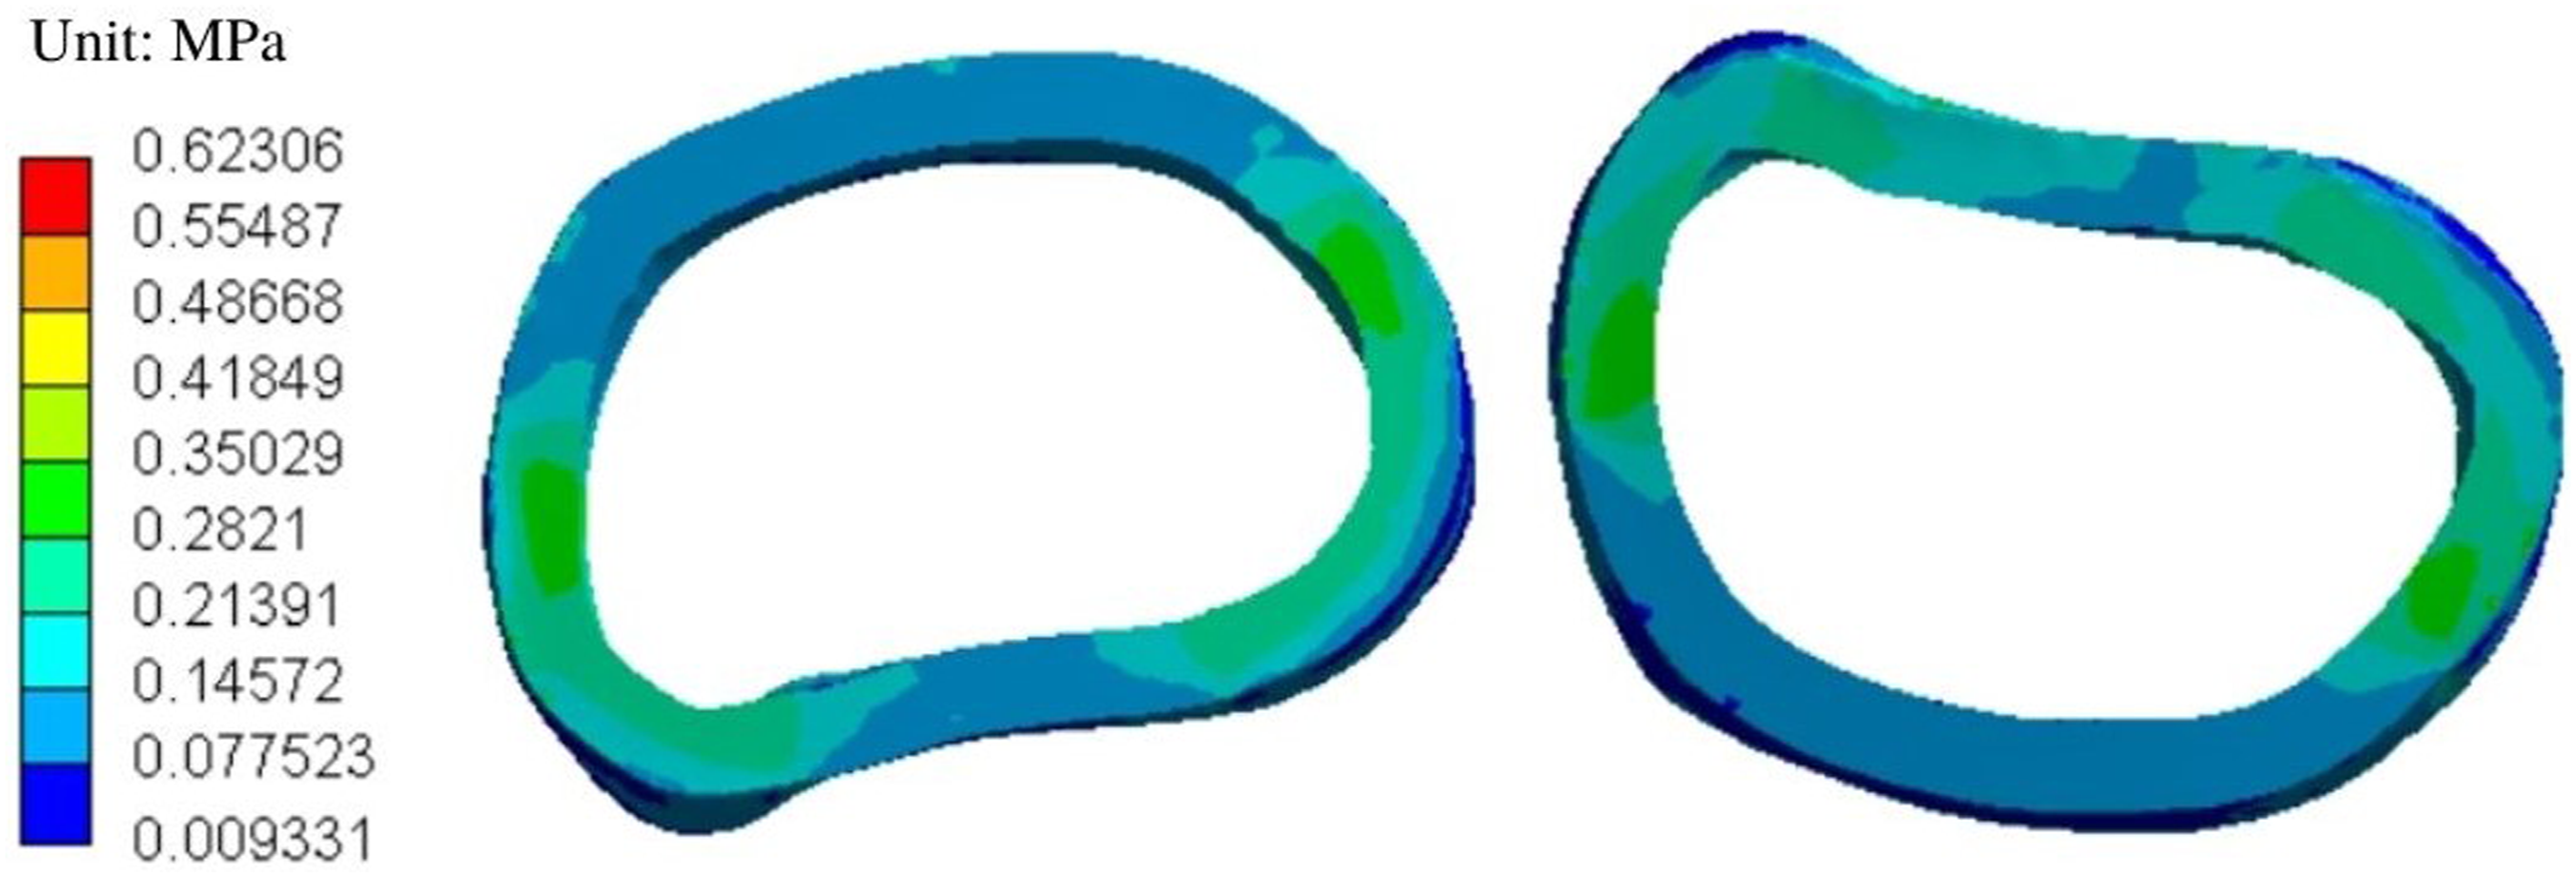
Figure 9 shows the stress distribution in the ligamentous-intervertebral disk complex during bipedestation, flexion, and extension movements. The results obtained through finite element analysis, both in terms of values and stress distribution, suggest that the main task of this complex is axial load attenuation, and a secondary function responsible for load distribution in a radial horizontal form, as explained below and observed in Figure 9. Stress distribution begins when the annulus fibrosus receives axial load from the adjacent inferior terminal endplate from the superior vertebra, which is immediately distributed to the nucleus pulposus, the ALL and PLL ligaments. This complex, together with the trabecular system (distribution system), distributes axial load throughout the axis of the spine, but exerting a slight load concentration on the posterior margin of the annulus, demonstrating a faster material failure in this portion of the annulus for the 3 postures analyzed. Is interesting how global values of stress and strain being lower in the nucleus pulposus, suggesting an attenuation effect for axial load and stress. Graph 10, shows that the anatomical region of greatest stress concentration is located in the intersection between the annulus fibrosus and ALL/PLL ligaments, suggesting a triple biomechanical role: distribution of axial load through the annulus fibrosus (following an antero-posterior and centrifugal direction) and ligaments (acting as longitudinal, continuous tension bands), stiffness to the intervertebral disk by the aforementioned ligaments (acting as a container system), as well as axial stress attenuation solely by the nucleus pulposus (see Figure 10). L5S1 Intervertebral disk von-Mises load distribution. Von-mises equivalent stress distribution in L5 ligamentous-intervertebral disk complex. L4L5 Intervertebral disk von-Mises load distribution.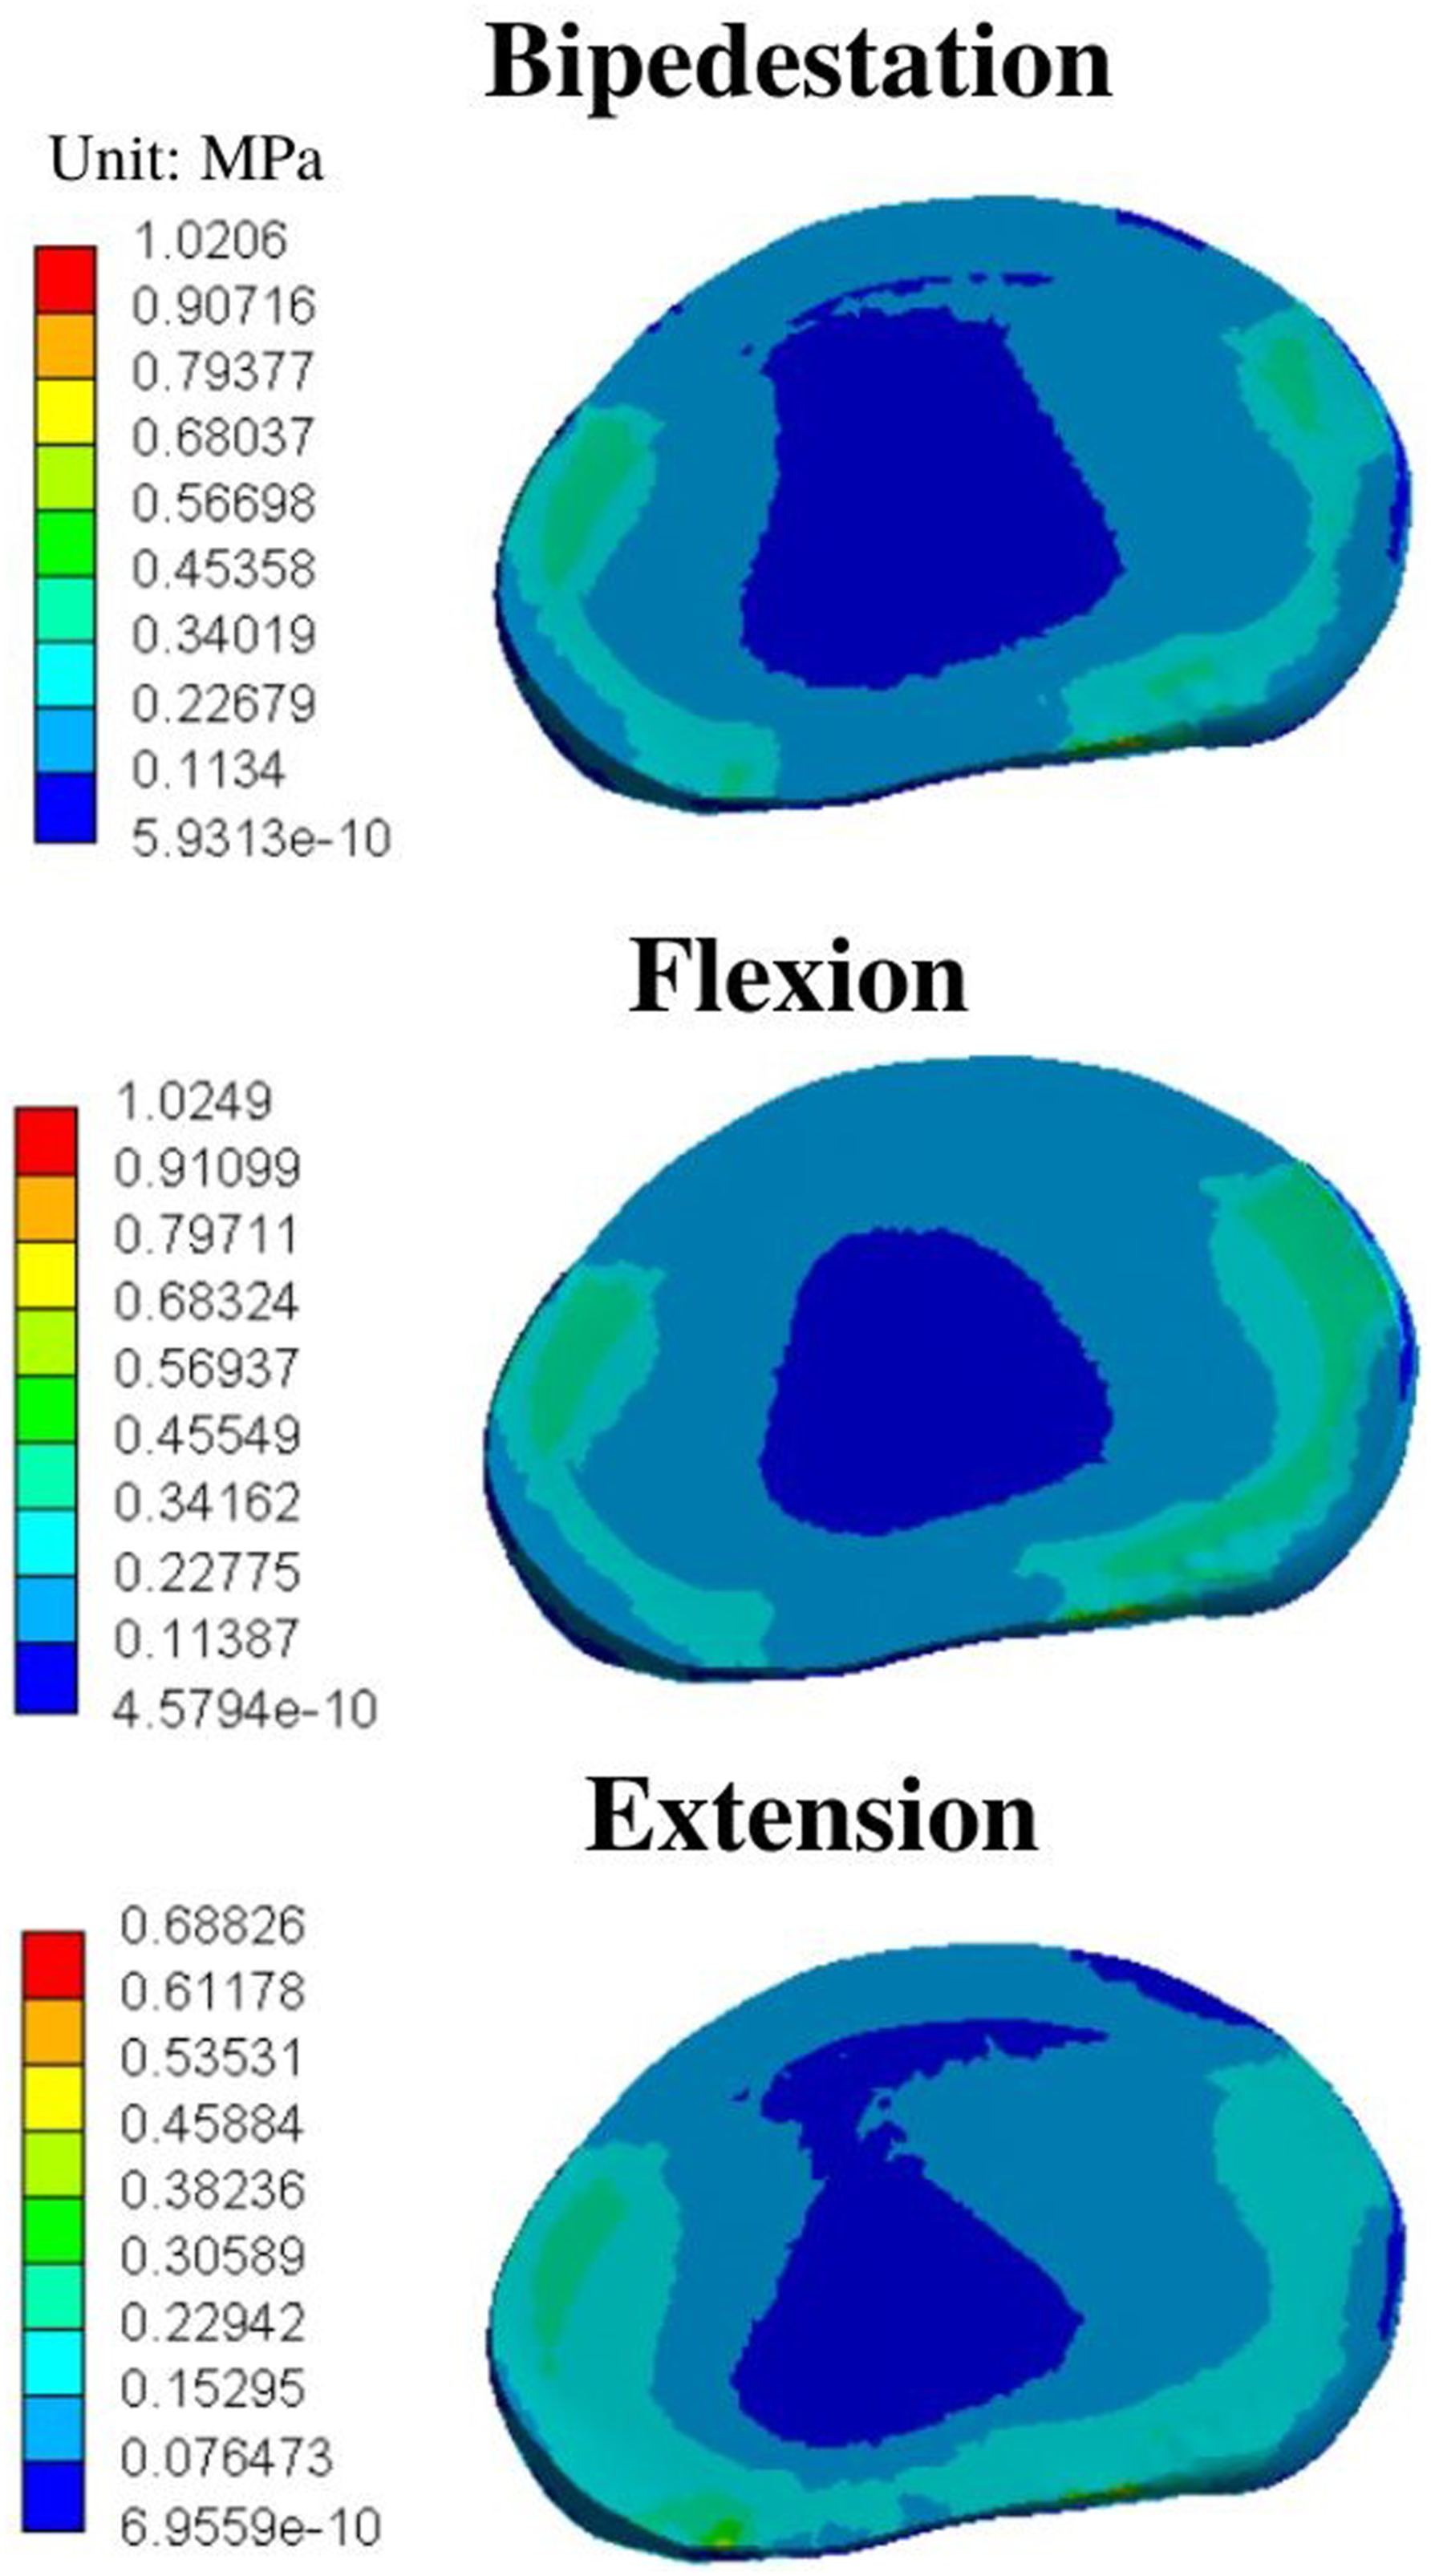
Our results suggest that longitudinal ligaments as the ALL and PLL serve for axial load distribution, while discontinuous ligaments, such as LF, ITL, ISL and SL serve for spinal stabilization. The axial load transmission is received by the superior terminal endplate from the inferior vertebrae, repeating the axial load transfer process involving the trabecular bone from the adjacent vertebra (Figure 11). Interestingly, Shahmohammadi et al
35
analyzed an artificial intervertebral disk using finite element analysis with 400 N axial loads to simulate compression and 5 Nm for torsion, describing that stress is concentrated at the lateral sides of the terminal plates, and the load distribution in the intervertebral disk starts from the inner fibers and ends at the outer fibers. On the other hand, Zahari et al
17
described that stress is concentrated on the anterior margin of the L4L5 intervertebral disk during flexion and on the posterior margin during extension using an axial load of 500 N, 800 N and 1200 N model with a 7.5 Nm torsion. Our results differ from those obtained by Zahari et al,
17
possibly due to the boundary conditions since they applied a misaligned load vector to simulate the flexion and extension movements while we applied a torsion vector in the complete upper surface of the vertebra. Cephalo-caudad direction of stress distribution in L5S1 segment.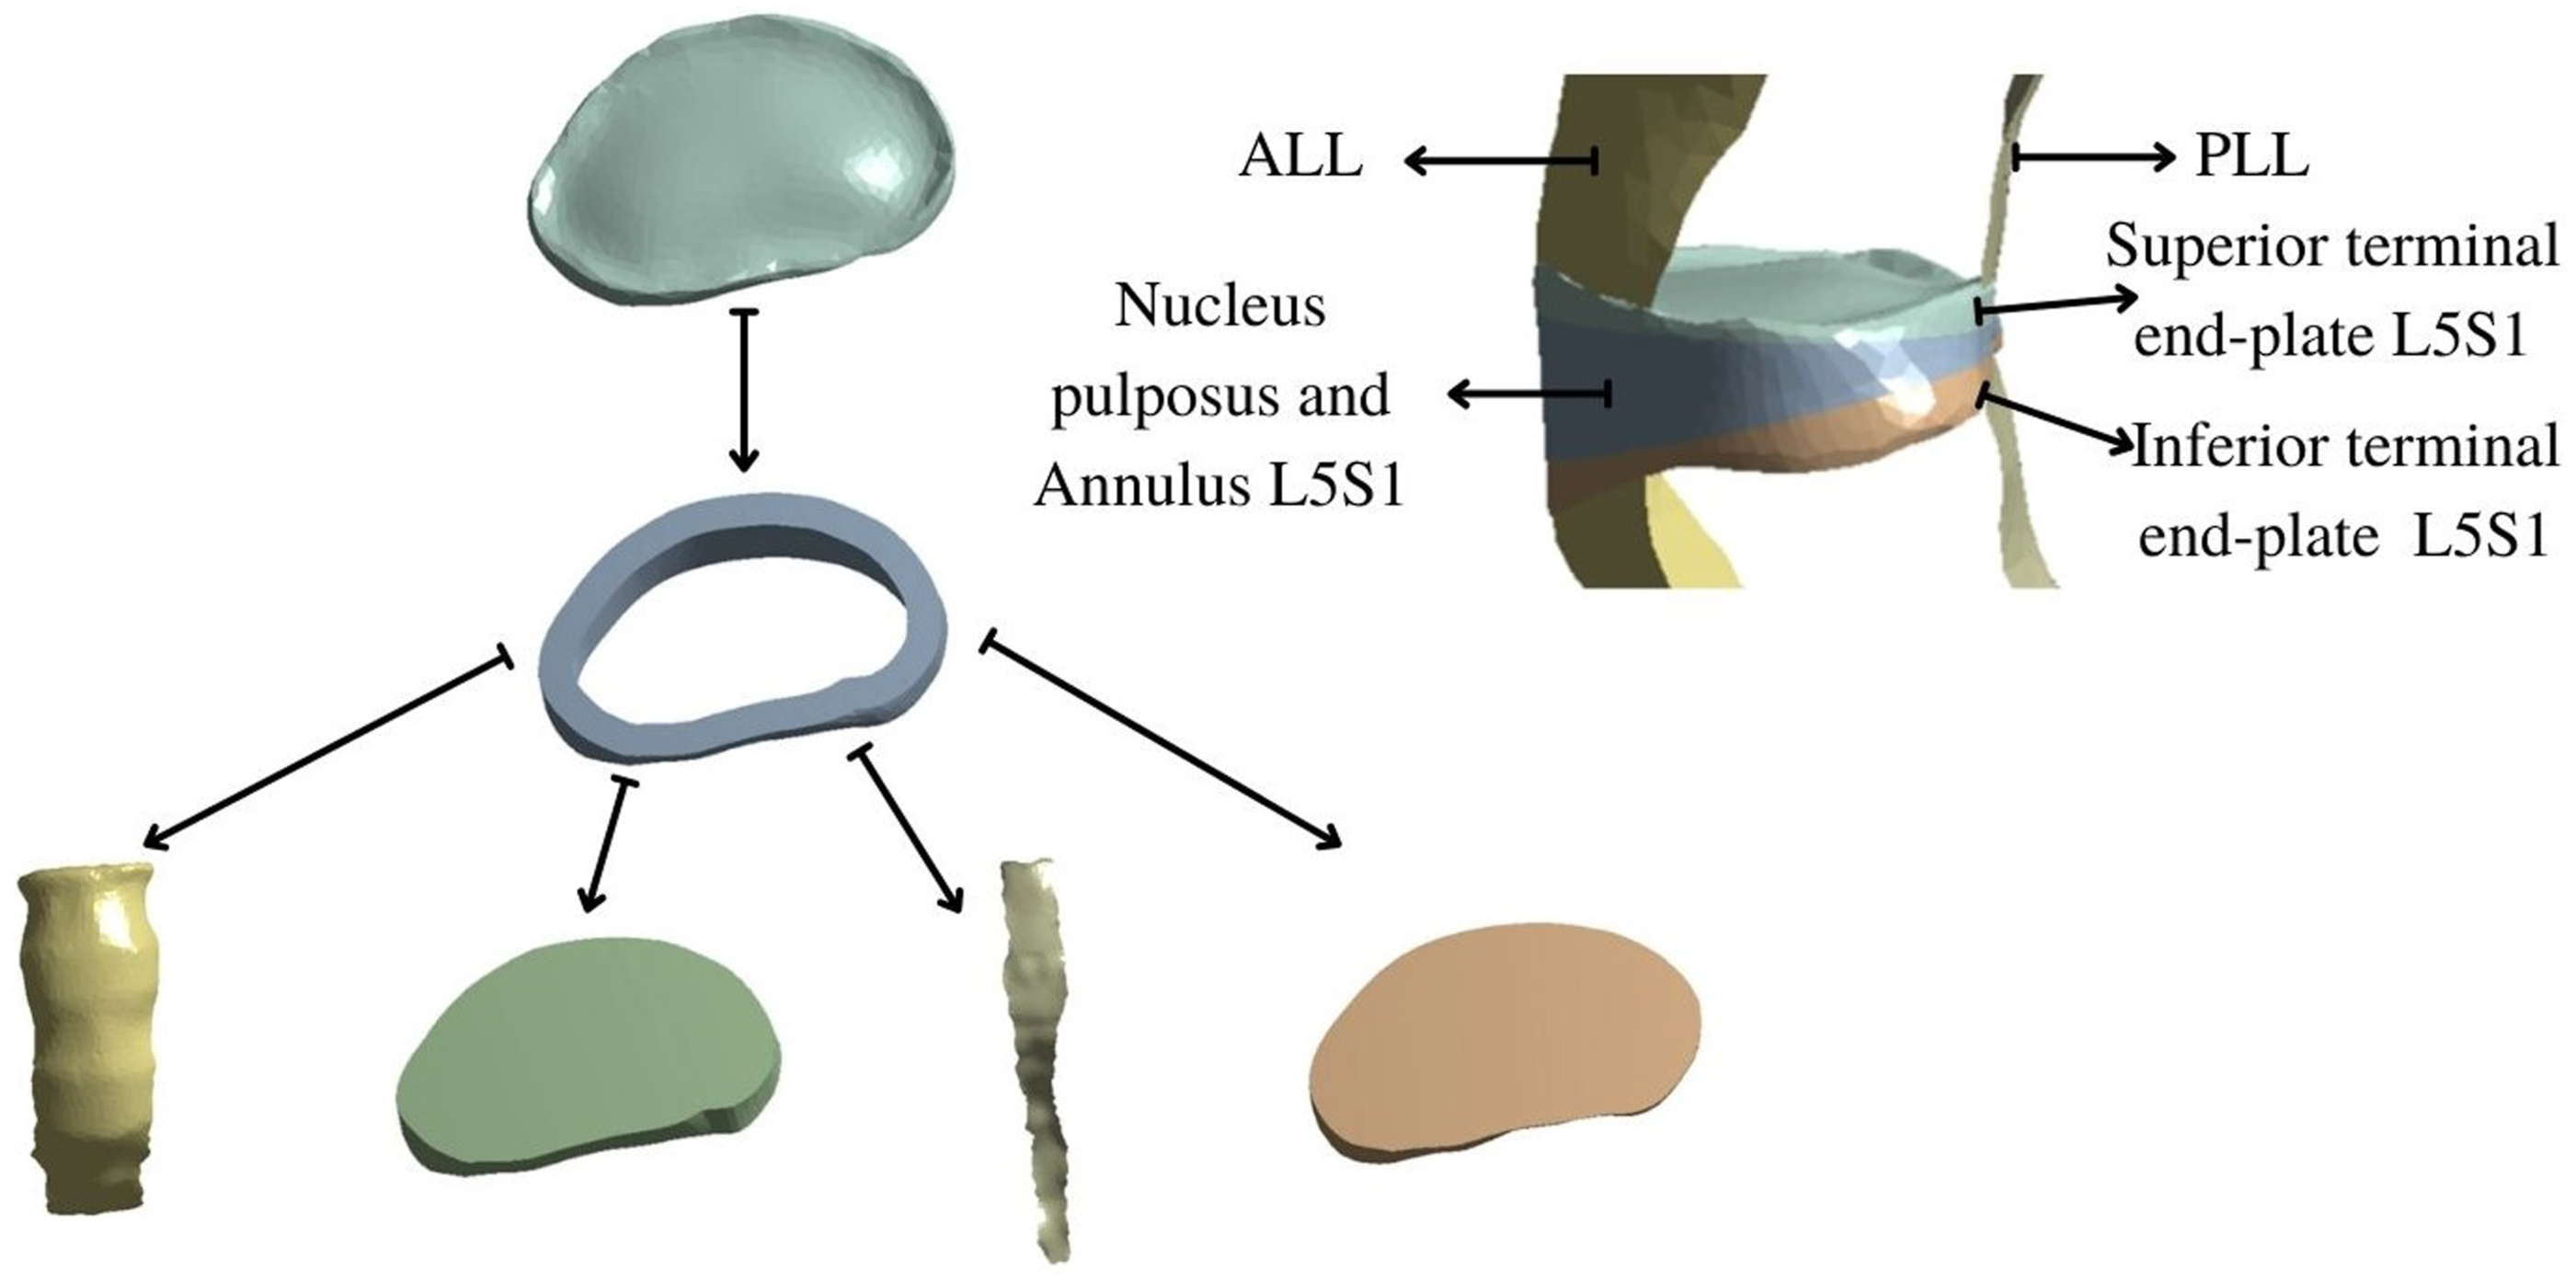
There are several reports that mention similar biomechanical properties for the ligamentous-intervertebral disk complex, where Haba et al
36
concluded that the PLC is the structure that provides stability to the thoracic and lumbar vertebrae during spine lesions. Analyzing the annulus fibrosus L4L5 alone, our results are similar to those reported by Sharabi et al,
23
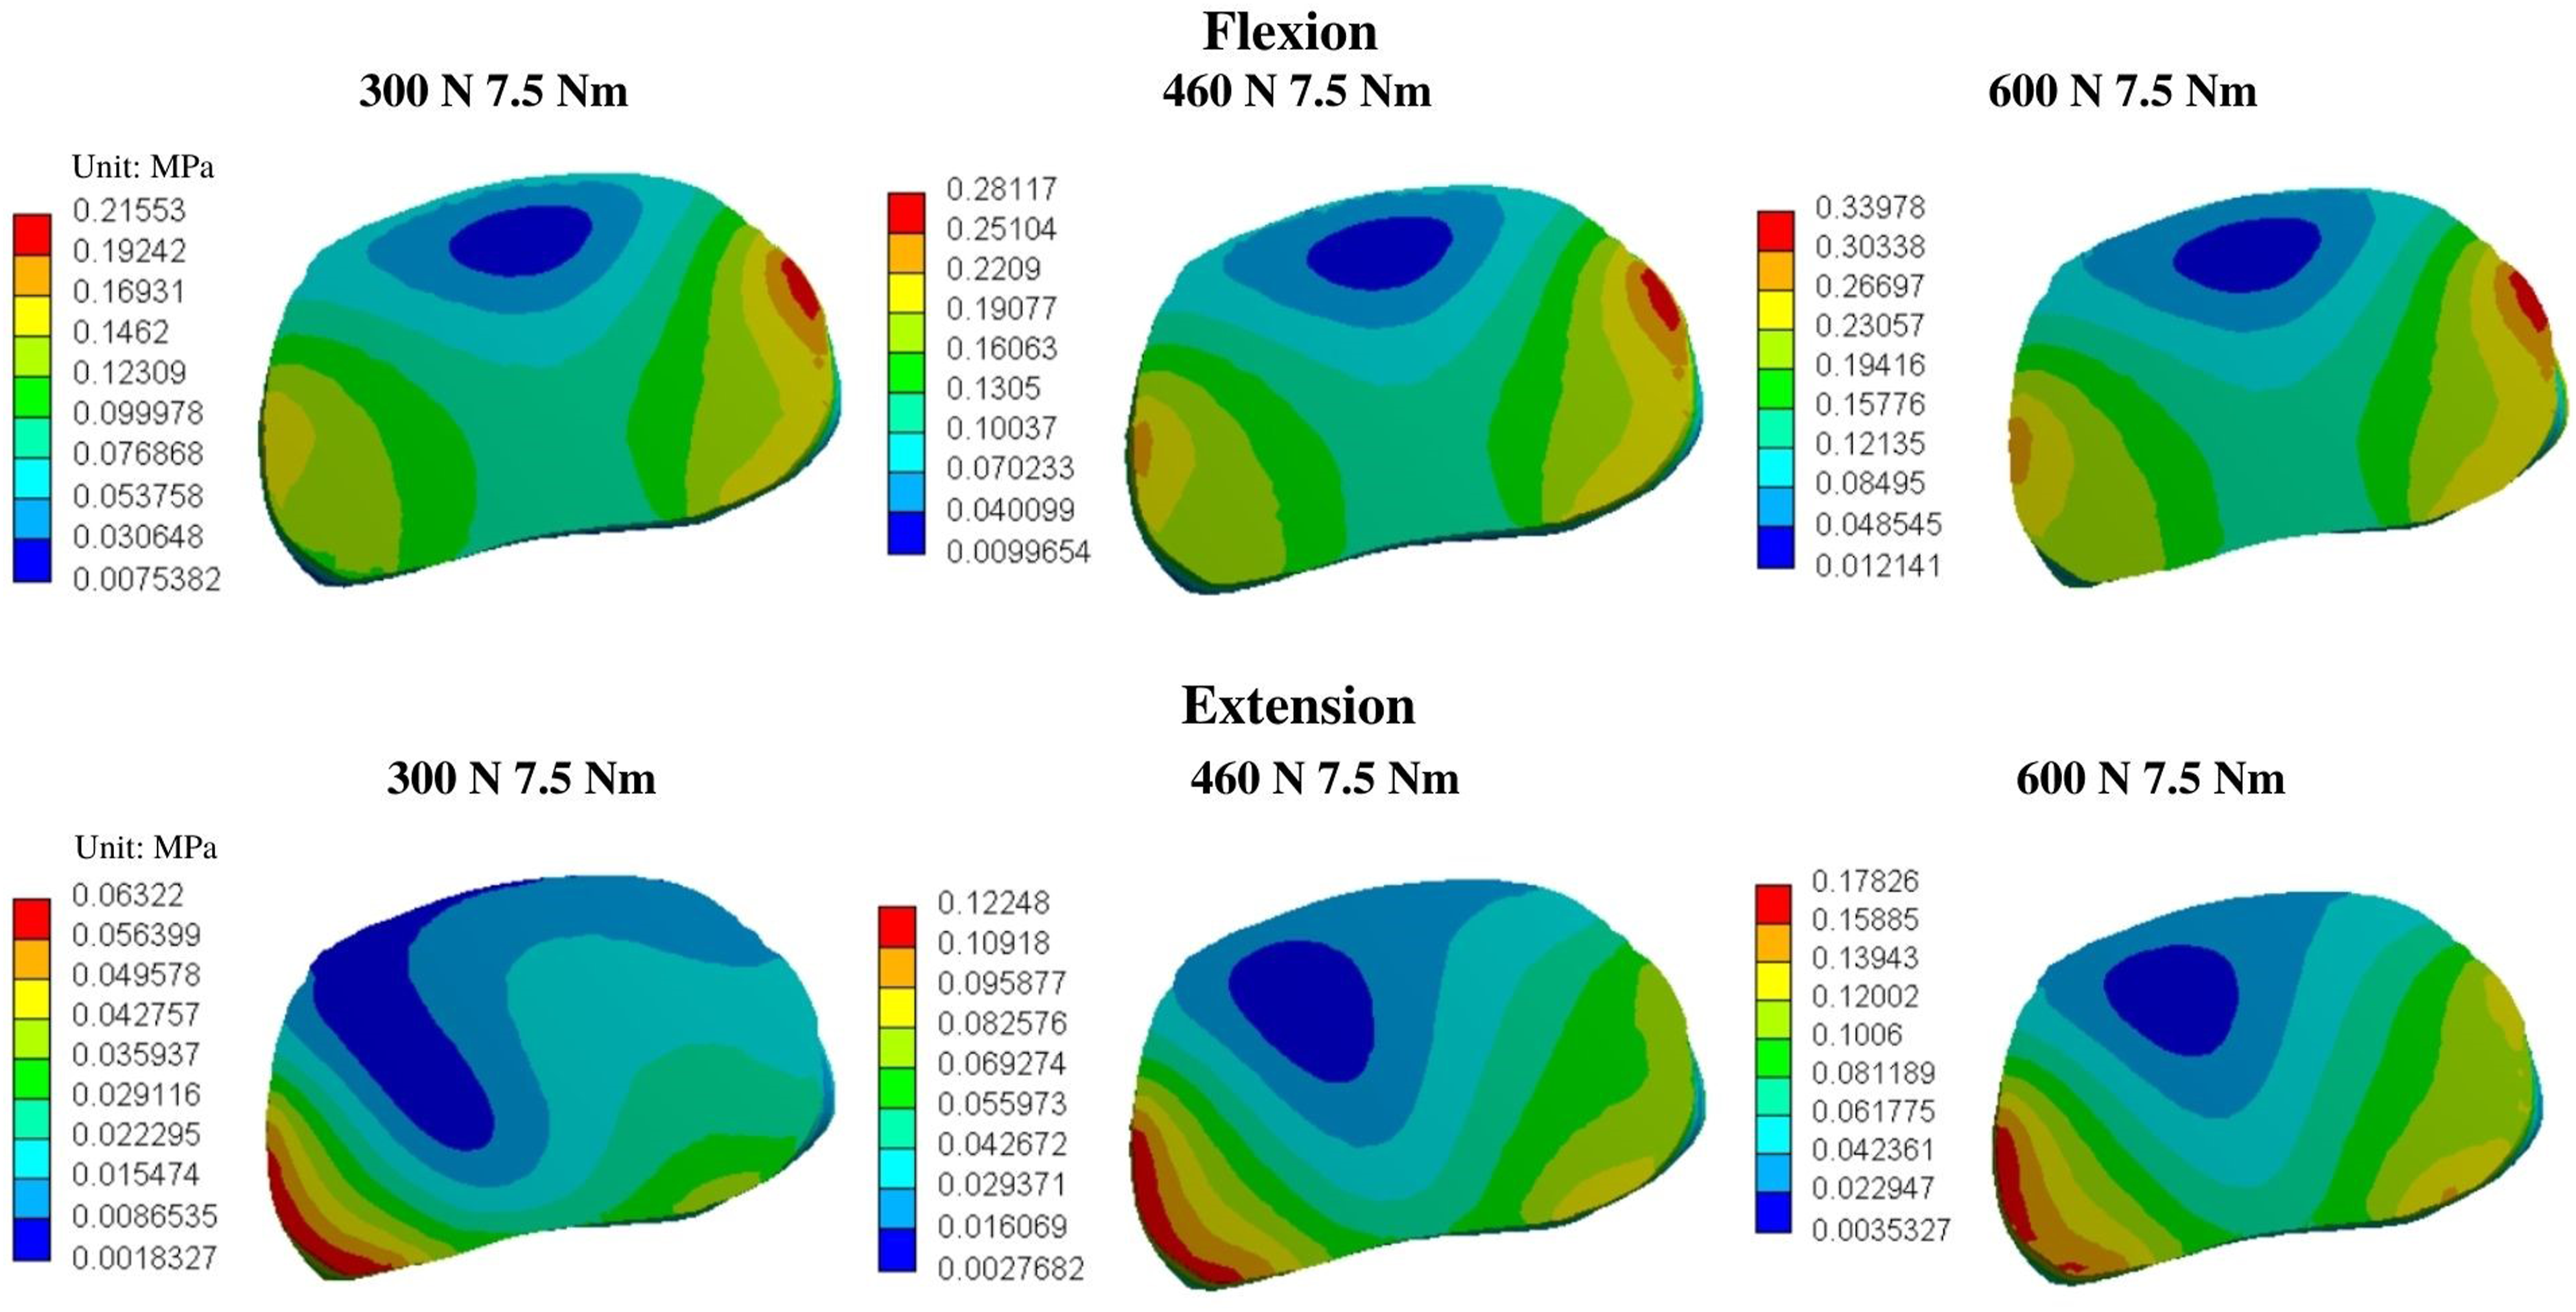
where the maximum tensile and compressive stress during flexion movement is located in the anterior region of this structure, but differing on pure extension movement where the maximum tensile stress is located in the anterior zone of the annulus while our results showed compressive stress in the same anatomical region (see Figure 12 and 13). Annulus fibrosus maximum principal stress distribution at 600 N and 7.5 Nm. Annulus fibrosus von-Mises distribution at 600 N.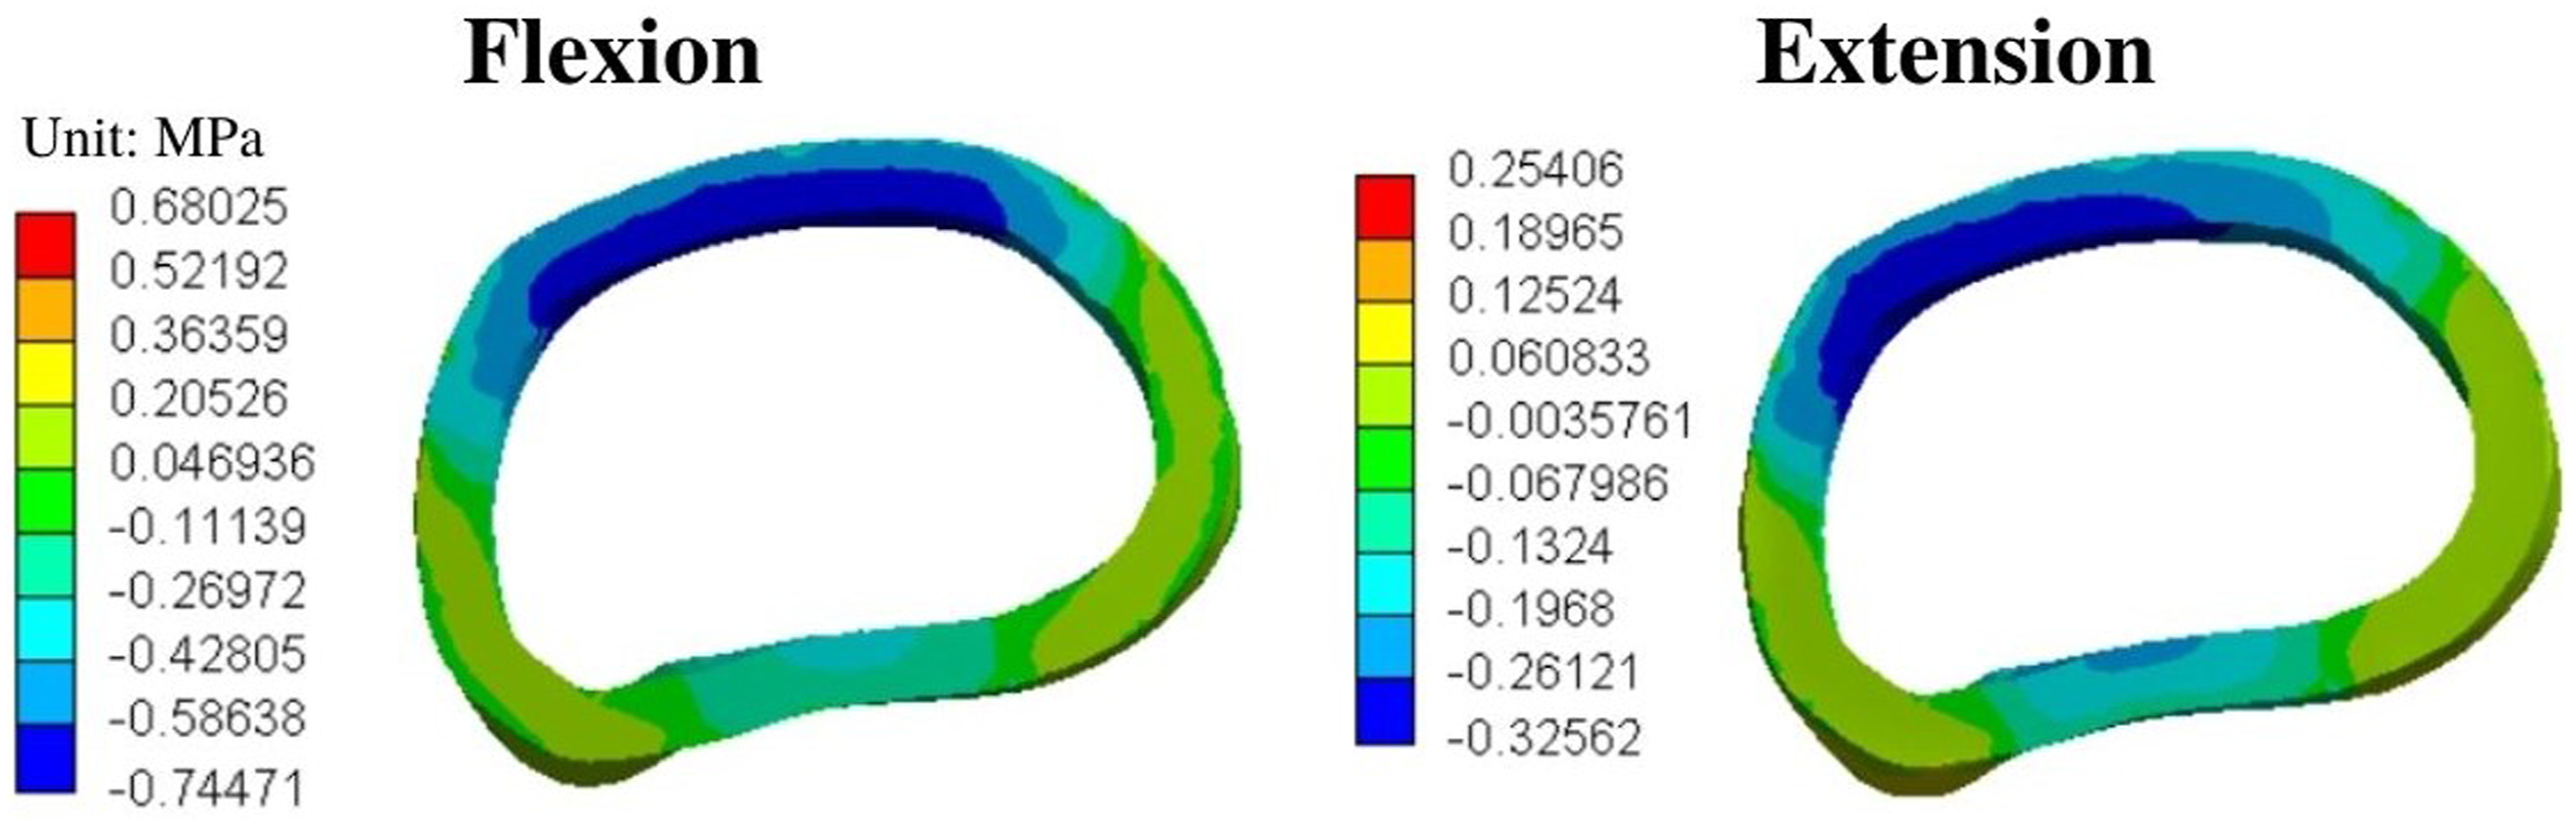
The results obtained in our study demonstrates that both the intervertebral disk and the ligaments are necessary for transmission and attenuation of axial stress. Because of this, we propose calling both structures as a ligamentous-intervertebral disk system.
Facet Joints Systems
As it is possible to see in Figure 14, the facet cartilage acts as an axial load distribution element, transmitting load from the inferior articular facet of the superior vertebra to the superior facet of the inferior vertebra. Due to its anatomical S-shape, it achieves a centrifugal load distribution, much akin to what occurs in the nucleus pulposus of the intervertebral disk. L5 cortical bone MPS distribution at 600 N.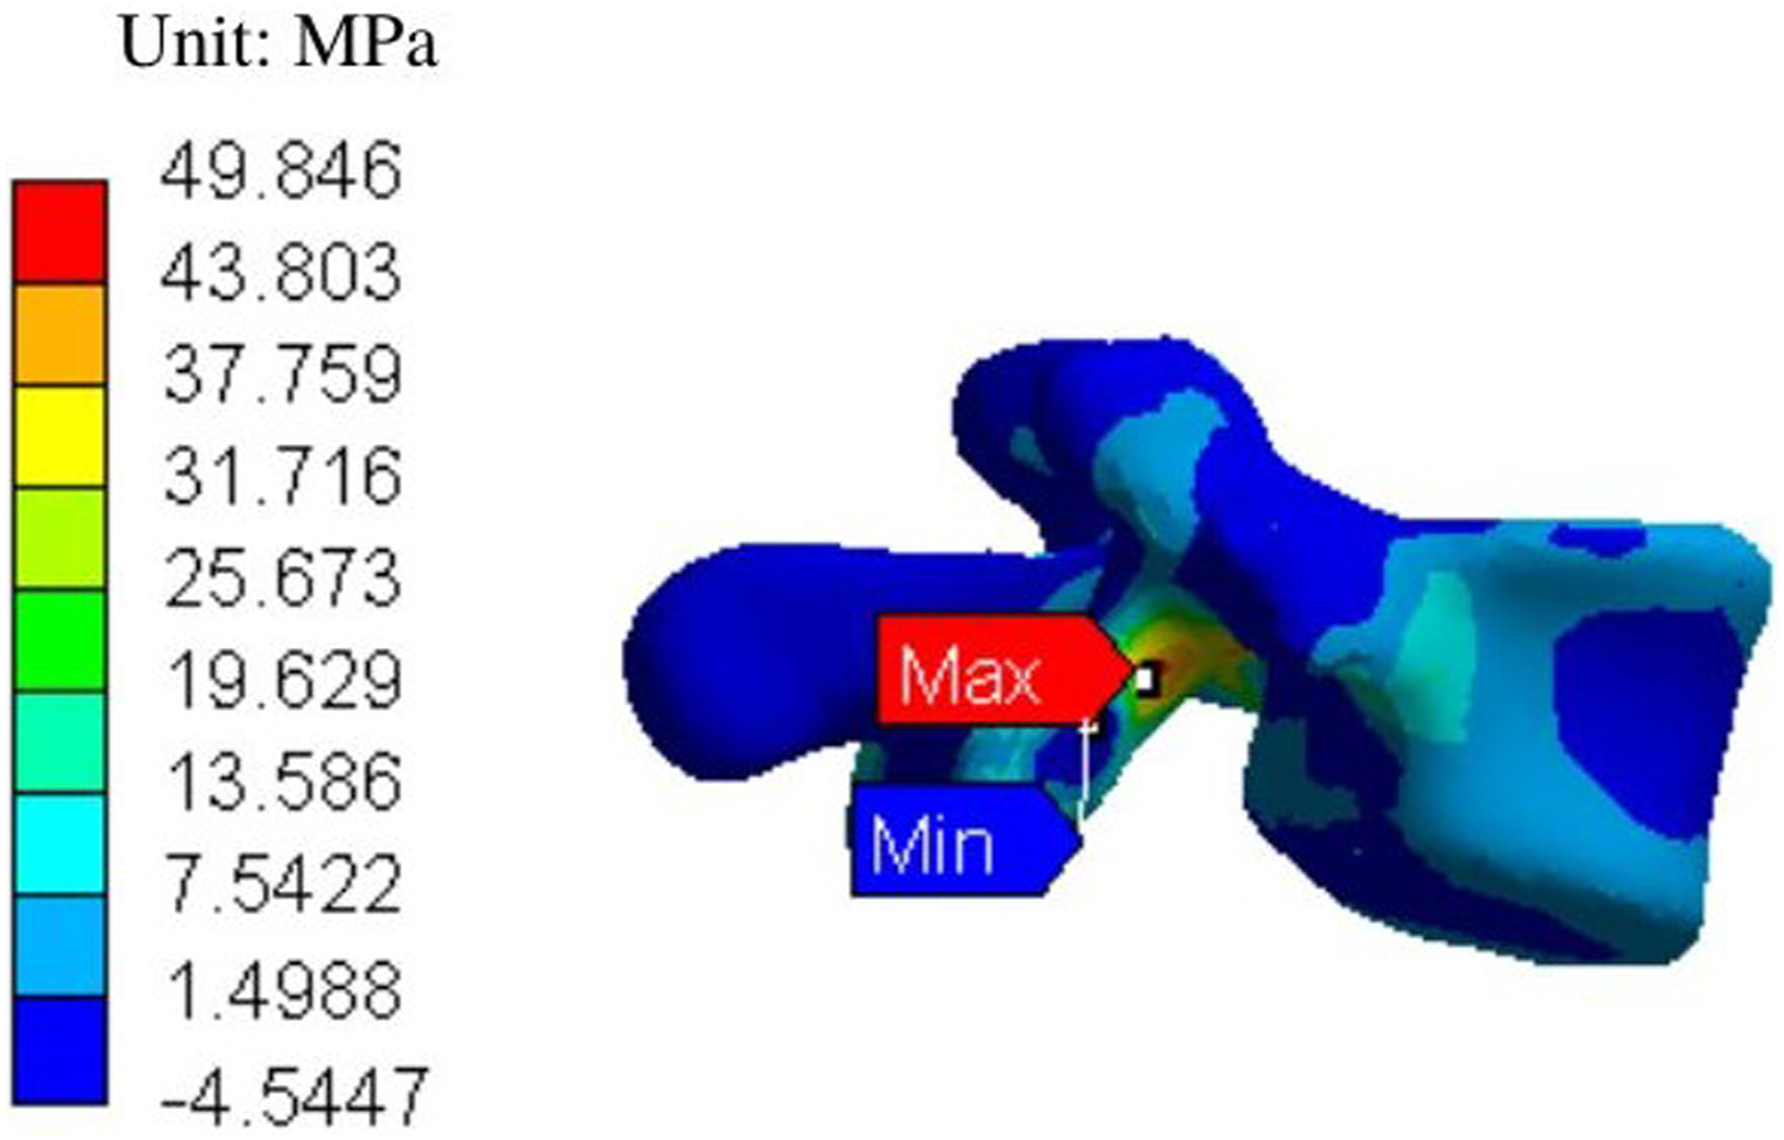
All of this explains that the facet joint is a system for load distribution and containment that can be exerted from a superior element (upper vertebra) to an inferior 1. The facet, as a whole, functions as a load transmitter, similar to the role of vertebral endplates, and in junction with ligament complex, act as a stabilizer for flexion and extension postures (Graph 2).
Conclusions
This is the first time in which different biomechanical systems are described at the lumbosacral junction. We propose 3 anatomical systems for axial load distribution and stress attenuation in the lumbosacral junction. Trabecular bone distributes loads in a sequential manner through the vertebrae, while the ligamentous-intervertebral disk is necessary for transmission and attenuation of axial stress. Facet joints and discontinuous ligaments act as stabilizers for flexion and extension postures. Overall, the relationship between trabecular bone, ligamentous-intervertebral disk complex and facet joints is necessary for an efficient load distribution and segmental axial stress reduction during neutral, flexion and extension moments.
Limitations
Our finite element method analysis was used to understand the biomechanical behavior of the lumbosacral spine, limited to the analysis of a single asymptomatic volunteer. During the model construction, the sacrum was designed as a fixed structure without trabecular bone and the facet joints without capsule, as well as absent rotational force simulation. Additionally, we are aware about the importance of the muscular system and lumbopelvic ligaments for spine stability, not included in our model. Further investigation is required to understand biomechanical changes during gait.
Footnotes
Declaration of Conflicting Interests
The author(s) declared the following potential conflicts of interest with respect to the research, authorship, and/or publication of this article: Brayan Felipe Pinzón received a 16-month contract with monthly paid salary by the ECCI University, as a Young researcher. Every autor listed was provided with access to software licenses and hardware acquisition for data processing by the Hospital Universitario de la Samaritana, used in this manuscript.
Funding
The author(s) received no financial support for the research, authorship, and/or publication of this article.