
Abstract
Study Design
Systematic review and meta-analysis.
Objectives
In an effort to prevent intraoperative neurological injury during spine surgery, the use of intraoperative neurophysiological monitoring (IONM) has increased significantly in recent years. Using IONM, spinal cord function can be evaluated intraoperatively by recording signals from specific nerve roots, motor tracts, and sensory tracts. We performed a systematic review and meta-analysis of diagnostic test accuracy (DTA) studies to evaluate the efficacy of IONM among patients undergoing spine surgery for any indication.
Methods
The current systematic review and meta-analysis was performed using the Preferred Reporting Items for a Systematic Review and Meta-analysis statement for Diagnostic Test Accuracy Studies (PRISMA-DTA) and was registered on PROSPERO. A comprehensive search was performed using MEDLINE, EMBASE and SCOPUS for all studies assessing the diagnostic accuracy of neuromonitoring, including somatosensory evoked potential (SSEP), motor evoked potential (MEP) and electromyography (EMG), either on their own or in combination (multimodal). Studies were included if they reported raw numbers for True Positives (TP), False Negatives (FN), False Positives (FP) and True Negative (TN) either in a 2 × 2 contingency table or in text, and if they used postoperative neurologic exam as a reference standard. Pooled sensitivity and specificity were calculated to evaluate the overall efficacy of each modality type using a bivariate model adapted by Reitsma et al, for all spine surgeries and for individual disease groups and regions of spine. The risk of bias (ROB) of included studies was assessed using the quality assessment tool for diagnostic accuracy studies (QUADAS-2).
Results
A total of 163 studies were included; 52 of these studies with 16,310 patients reported data for SSEP, 68 studies with 71,144 patients reported data for MEP, 16 studies with 7888 patients reported data for EMG and 69 studies with 17,968 patients reported data for multimodal monitoring. The overall sensitivity, specificity, DOR and AUC for SSEP were 71.4% (95% CI 54.8-83.7), 97.1% (95% CI 95.3-98.3), 41.9 (95% CI 24.1-73.1) and .899, respectively; for MEP, these were 90.2% (95% CI 86.2-93.1), 96% (95% CI 94.3-97.2), 103.25 (95% CI 69.98-152.34) and .927; for EMG, these were 48.3% (95% CI 31.4-65.6), 92.9% (95% CI 84.4-96.9), 11.2 (95% CI 4.84-25.97) and .773; for multimodal, these were found to be 83.5% (95% CI 81-85.7), 93.8% (95% CI 90.6-95.9), 60 (95% CI 35.6-101.3) and .895, respectively. Using the QUADAS-2 ROB analysis, of the 52 studies reporting on SSEP, 13 (25%) were high-risk, 10 (19.2%) had some concerns and 29 (55.8%) were low-risk; for MEP, 8 (11.7%) were high-risk, 21 had some concerns and 39 (57.3%) were low-risk; for EMG, 4 (25%) were high-risk, 3 (18.75%) had some concerns and 9 (56.25%) were low-risk; for multimodal, 14 (20.3%) were high-risk, 13 (18.8%) had some concerns and 42 (60.7%) were low-risk.
Conclusions
These results indicate that all neuromonitoring modalities have diagnostic utility in successfully detecting impending or incident intraoperative neurologic injuries among patients undergoing spine surgery for any condition, although it is clear that the accuracy of each modality differs.
PROSPERO Registration Number: CRD42023384158
Introduction
Intraoperative neurological injury is a feared complication in surgical spinal procedures, with significant medical, social and economic consequences. 1 The use of intraoperative neurophysiologic monitoring (IONM) has thus been employed to prevent neurological deficits and identify intraoperative maneuvers that can lead to neurological injury, such as in deformity correction or during intramedullary spinal tumor resections.2,3 IONM in current practice refers to various techniques used to assess neural system integrity intraoperatively, including somatosensory evoked potentials (SSEP), motor evoked potentials (MEP), D-waves, and electromyography (EMG).2–4 The purpose of using IONM is to detect neurophysiological changes during a surgical procedure that could result in neurological deficits.4,5 While the value of using IONM is becoming increasingly recognized, a quantitative assessment of the diagnostic accuracy of various IONM modalities is lacking. Moreover, there is no clear consensus on the use of IONM for spinal surgery.
There have been previous systematic reviews with and without meta-analyses, which have attempted to summarize the role of neurophysiologic monitoring for intraoperative spinal cord injury (ISCI).4,6–16 However, these reviews have focused on a specific question or have only included studies comparing one modality to another. A comprehensive assessment of diagnostic test accuracy (DTA) of neuromonitoring following the PRISMA-DTA guidelines and GRADE guidelines has yet to be performed.
Key Question: What is the accuracy of neurophysiological monitoring for diagnosis of intraoperative spinal cord injury (ISCI) compared with immediate postoperative clinical assessment?
Methods
This systematic review and meta-analysis was performed using the Preferred Reporting Items for Systematic Review and Meta-analysis of Diagnostic Test Accuracy Studies (PRISMA-DTA). 17 The abstract was drafted using the Preferred Reporting Items for a Systematic Review and Meta-analysis of Diagnostic Test Accuracy Studies (PRISMA-DTA) abstract. A comprehensive search was performed using MEDLINE, EMBASE and SCOPUS for all studies assessing the diagnostic accuracy of neuromonitoring, including SSEP, MEP and EMG, either on their own (unimodal) or in combination (multimodal).
Criteria for Inclusion/Exclusion of Studies in the Review
Inclusion and Exclusion Criteria: Population, Interventions, Comparators, Outcomes, Timing, and Study Designs.
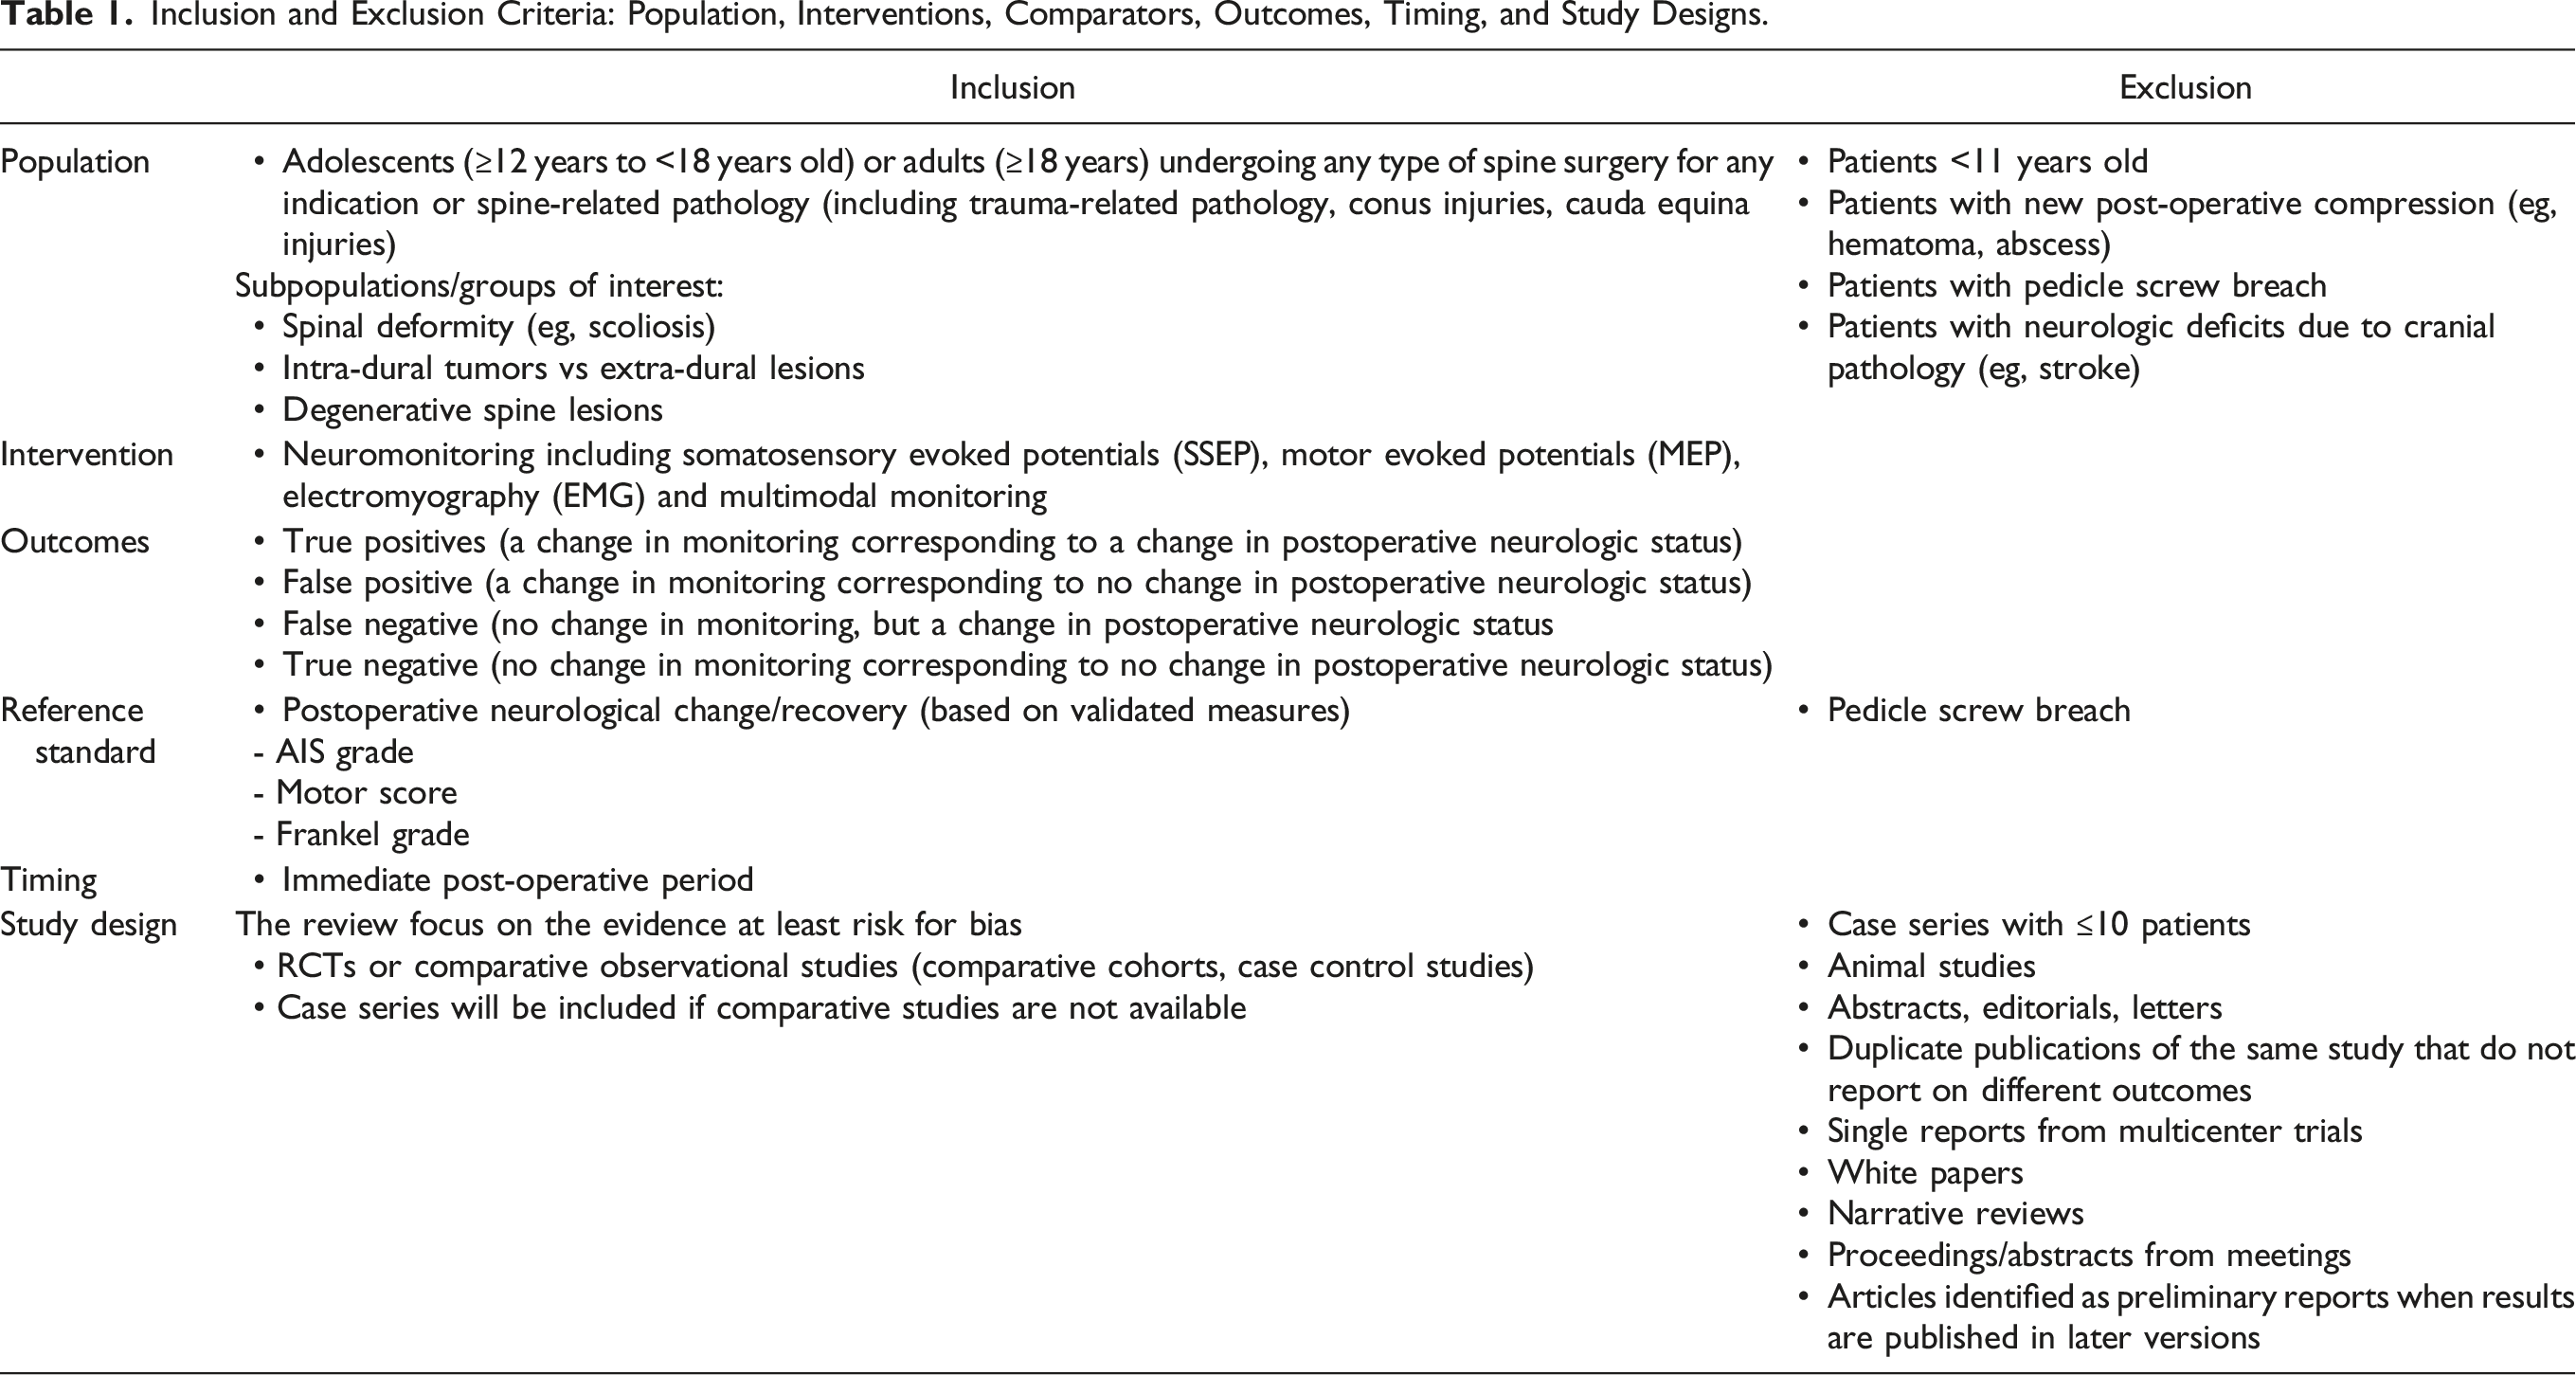
Study Design
Randomized control trials (RCTs) and high-quality prospective comparative cohort studies that control for confounding and met inclusion criteria were included as the primary evidence source. In the absence of high-quality studies, lower quality studies (eg retrospective observational studies) were considered.
Literature Search Strategies
Literature Databases
Search Strategy.
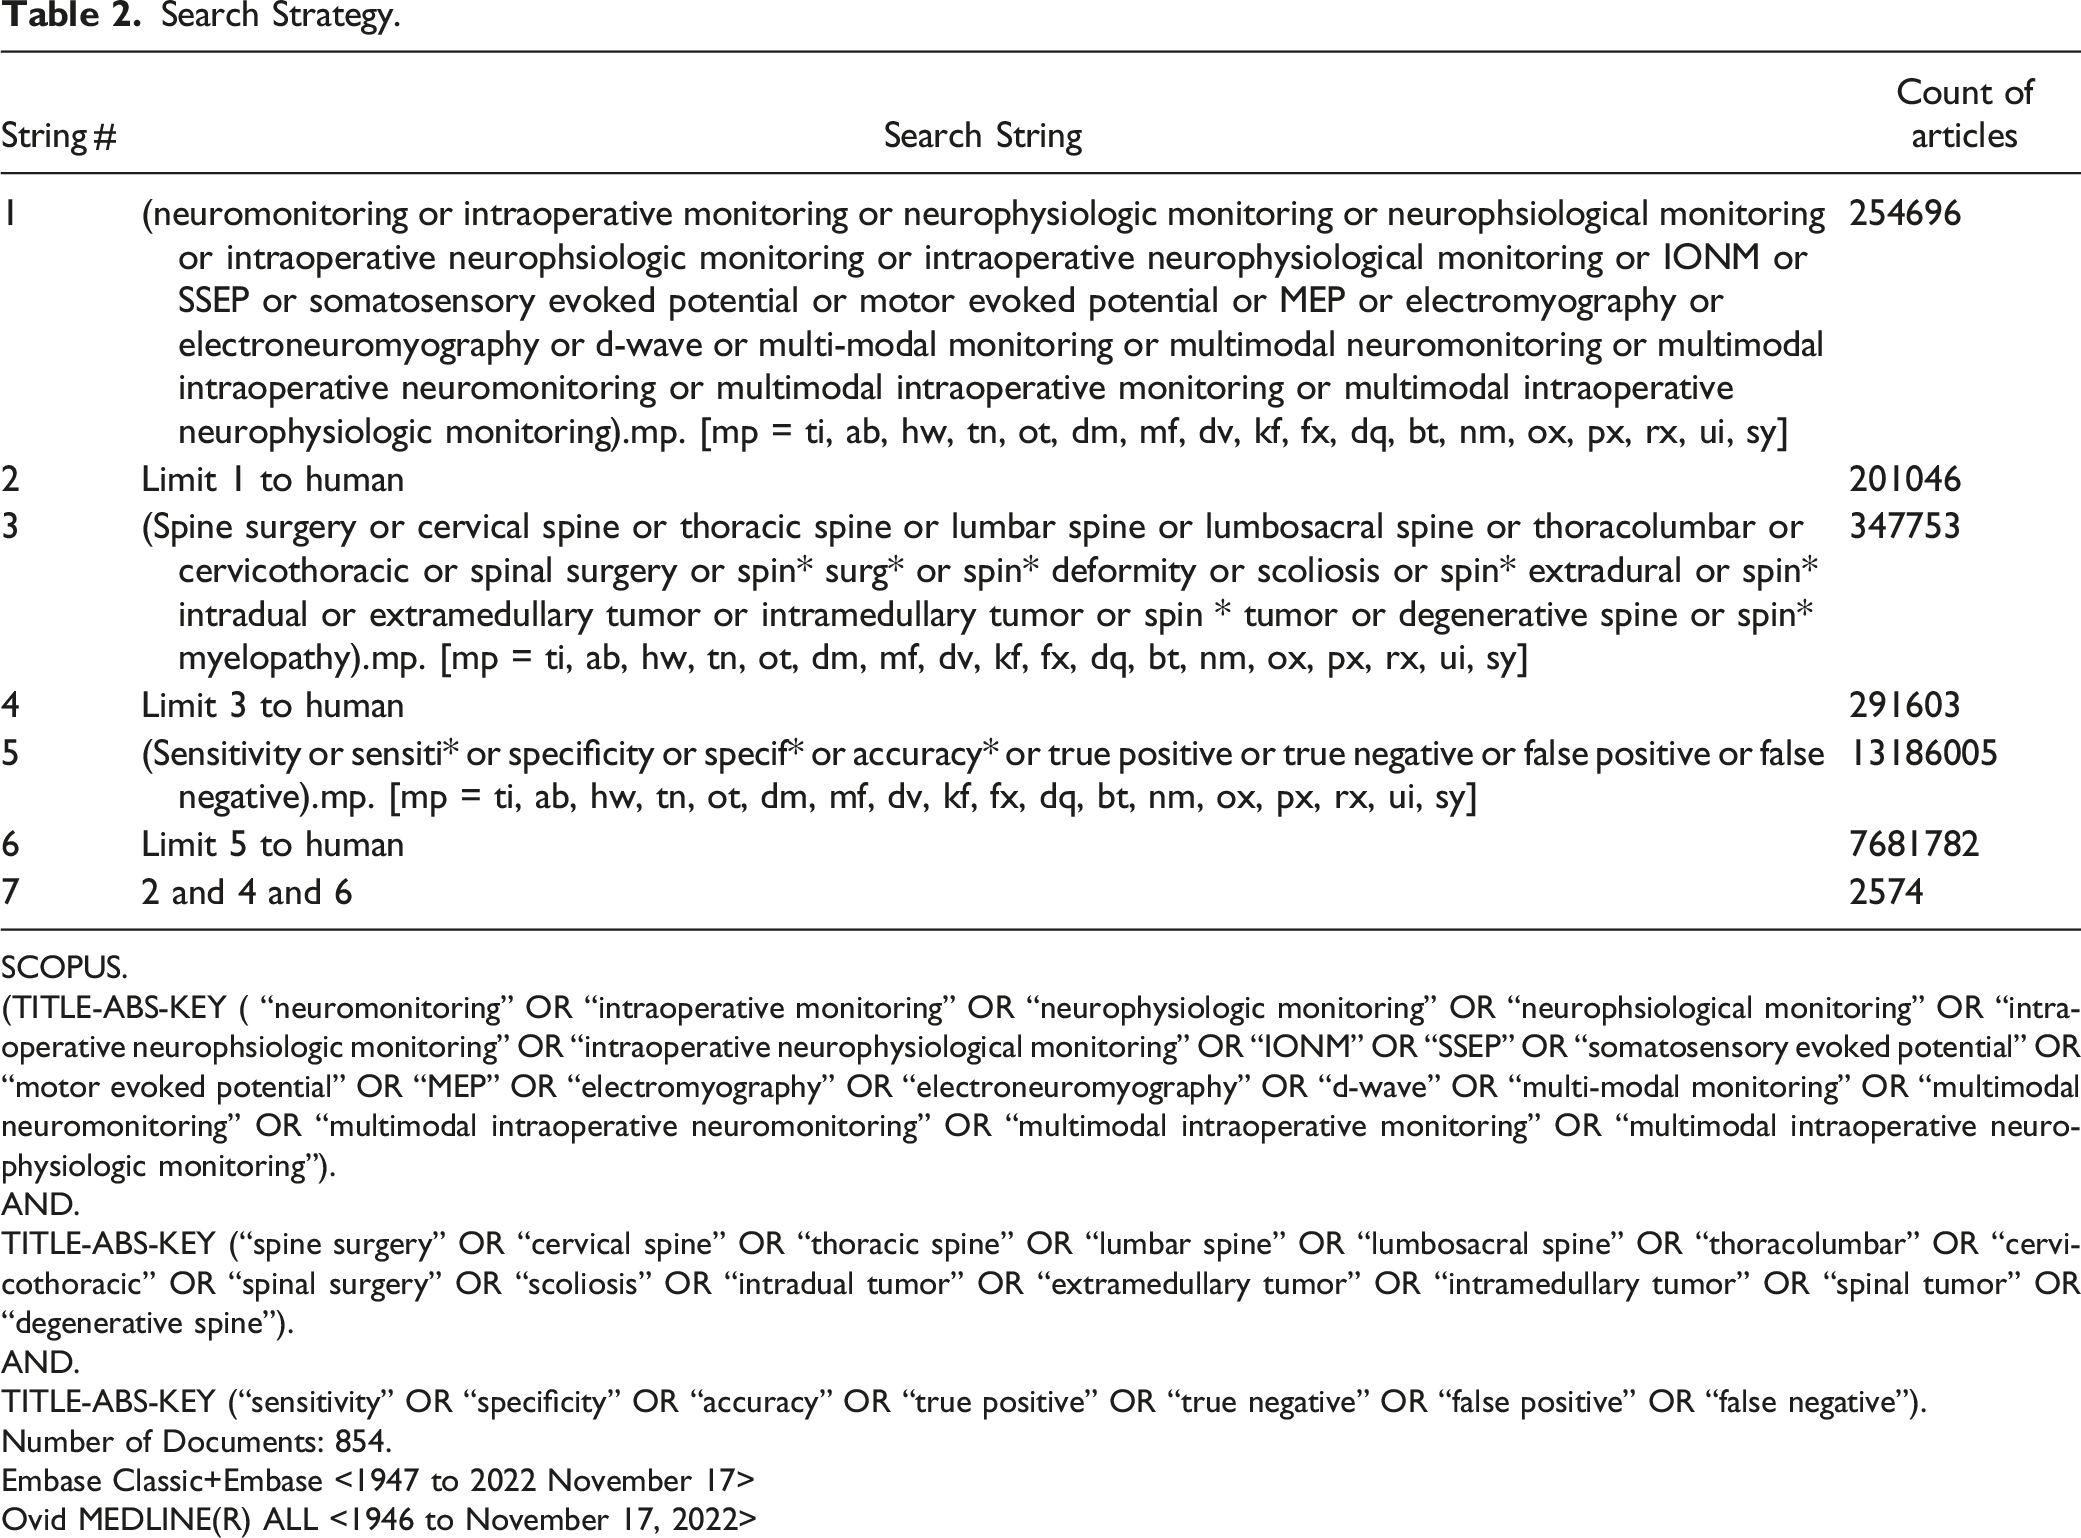
SCOPUS.
(TITLE-ABS-KEY ( “neuromonitoring” OR “intraoperative monitoring” OR “neurophysiologic monitoring” OR “neurophsiological monitoring” OR “intraoperative neurophsiologic monitoring” OR “intraoperative neurophysiological monitoring” OR “IONM” OR “SSEP” OR “somatosensory evoked potential” OR “motor evoked potential” OR “MEP” OR “electromyography” OR “electroneuromyography” OR “d-wave” OR “multi-modal monitoring” OR “multimodal neuromonitoring” OR “multimodal intraoperative neuromonitoring” OR “multimodal intraoperative monitoring” OR “multimodal intraoperative neurophysiologic monitoring”).
AND.
TITLE-ABS-KEY (“spine surgery” OR “cervical spine” OR “thoracic spine” OR “lumbar spine” OR “lumbosacral spine” OR “thoracolumbar” OR “cervicothoracic” OR “spinal surgery” OR “scoliosis” OR “intradual tumor” OR “extramedullary tumor” OR “intramedullary tumor” OR “spinal tumor” OR “degenerative spine”).
AND.
TITLE-ABS-KEY (“sensitivity” OR “specificity” OR “accuracy” OR “true positive” OR “true negative” OR “false positive” OR “false negative”).
Number of Documents: 854.
Embase Classic+Embase <1947 to 2022 November 17>
Ovid MEDLINE(R) ALL <1946 to November 17, 2022>
Publication Date Range
The search included citations from database inception to September 2022.
Hand Searching
Reference lists of included studies, relevant systematic reviews, and pertinent gray literature were also evaluated for eligible studies.
Process for Selecting Studies
All studies retrieved through the search strategy were uploaded to Covidence. 18 The pre-established criteria above were used by 2 reviewers to screen the titles and abstracts of the citations identified through our searches (MAA and AQ). Any citation deemed not relevant for full-text review was reviewed by a second researcher to assure accuracy and completeness. Each full-text article was independently reviewed for eligibility by 2 team members (MAA and NH). Any disagreements were resolved by consensus. A record of studies excluded at the full-text level with reasons for exclusion was maintained (supplemental material).
Some of the included studies presented data for more than one type of IONM modality. For example, a study utilizing multimodal neuromonitoring presented data for SSEP, MEP and EMG separately, and all of these were included in their respective groups. Moreover, some studies reported data using different thresholds to define neurologic injury. For example, a study presented data for MEP using both a 75% and 50% threshold and both were included.
Data Abstraction and Data Management
Abstraction of information related to the key question was limited to information needed to answer the questions. General patient characteristics, relevant surgical information, characteristics of neurophysiological monitoring (including any thresholds) as well as metrics of diagnostic accuracy were abstracted.
After studies were selected for inclusion for the key question, standardized data abstraction included the following (at minimum): patient characteristics (age, sex, comorbidities), completeness (AIS) and level of spinal cord injury (SCI), indication for spine surgery (eg, scoliosis, tumor), clinical/pathology characteristics (eg, myelopathy), surgical procedure characteristics (eg approach, levels, instrumentation), adjunctive treatments (eg, steroids, vasopressors), study-related characteristics (eg, sample size, design, control of confounding, timing of follow-up), intervention characteristics (eg, type, such as MEP, SEPP, timing, thresholds) and outcomes with a focus on the primary outcomes related to neurological recovery and adverse events listed in Table 1.
Assessment of Methodological Risk of Bias of Individual Studies
The risk of bias (ROB) and applicability of included studies was assessed using the quality assessment tool for diagnostic accuracy studies (QUADAS-2).
19
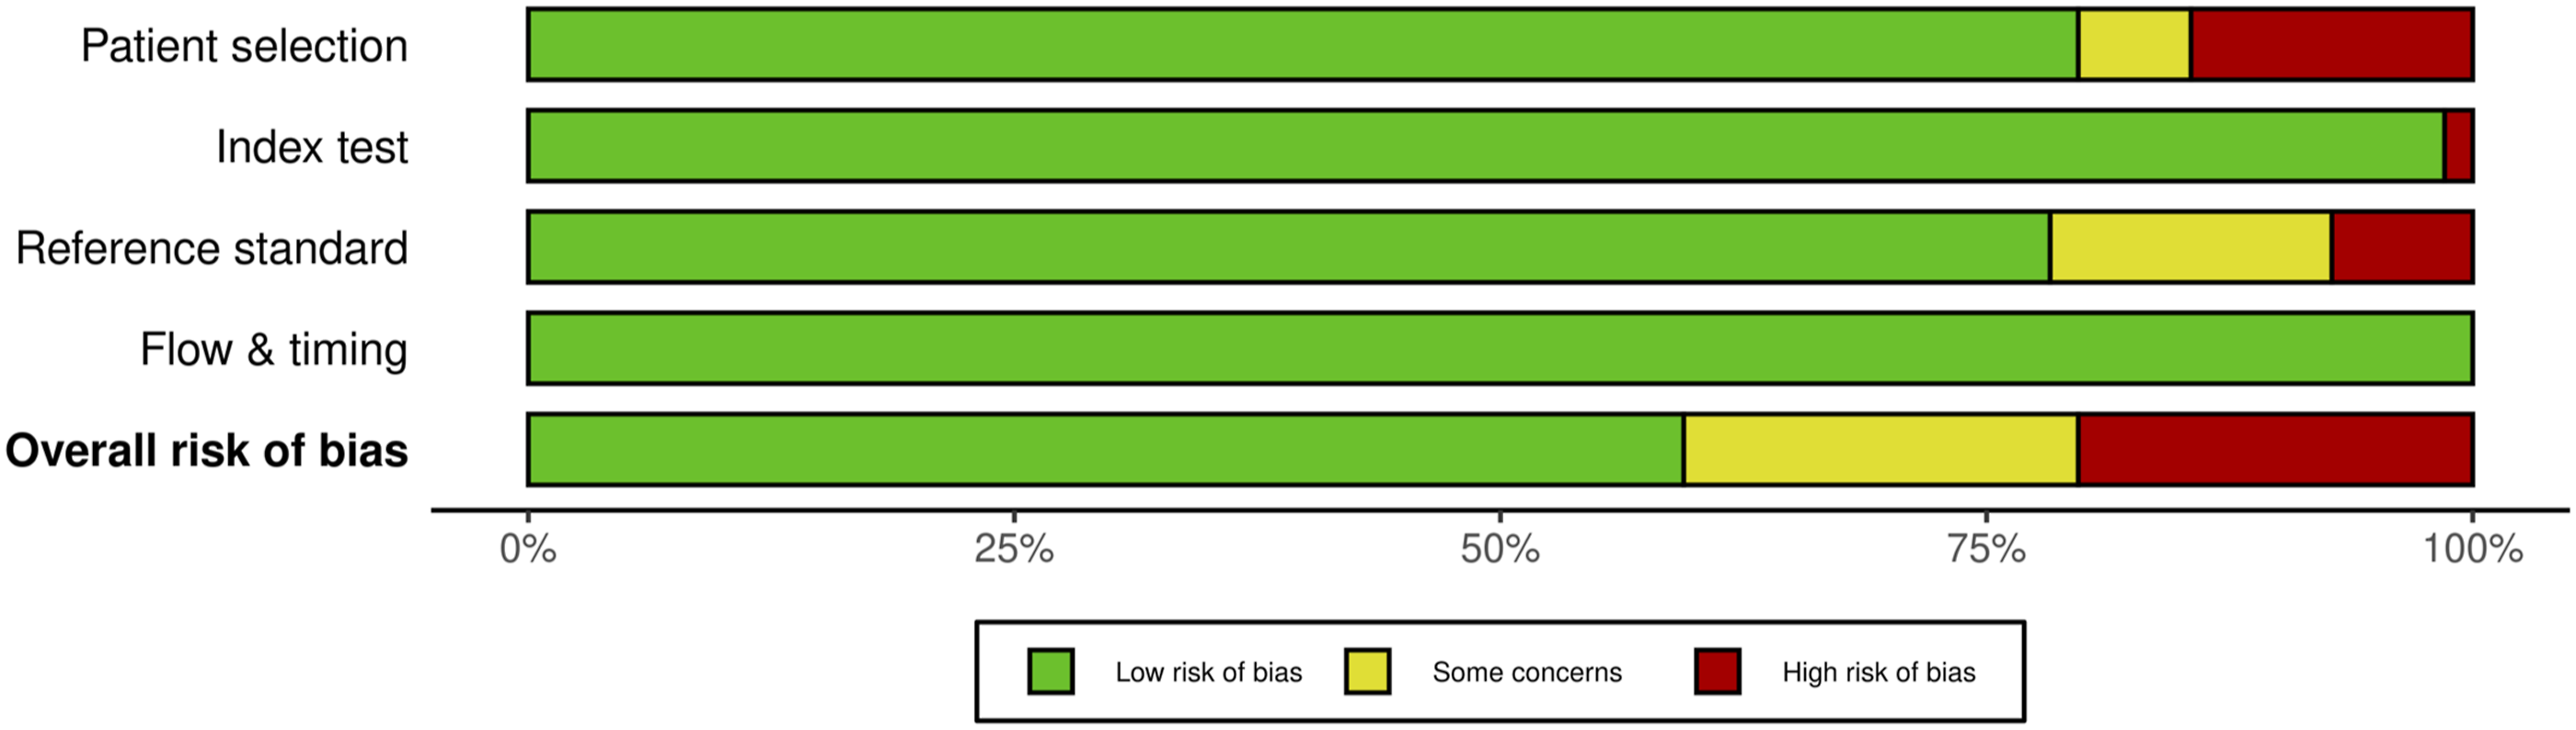
Four primary domains make up QUADAS-2: • Patient Selection • Index Test • Reference Standard • Flow and Time
Each domain is evaluated for risk of bias, and the first 3 are evaluated for issues about application. Signaling questions are offered to help with the assessment of bias risk. We also created traffic light and summary plots to illustrate risk of bias for each study using the robvis tool.20,21 Each study was classified as either “low risk, some concerns, or high risk.”
Data Synthesis and Statistical Analysis
The summary statistics and summary line from 4 sets of fundamental data—TP, FP, FN and TN—were used to describe the DTA. Sensitivity, specificity, diagnostic odds ratio (DOR), forest plot, and summary receiver operating characteristic (SROC) curve are examples of representative summary statistics and summary curves, respectively. Sensitivity is calculated using the formula (TP/(TP+FN)), while specificity is calculated using the formula (TN/(TN+FP)). Logit-transformed data are more frequently used than raw data for such proportion-type data. The logit transformation is a technique for modifying the distribution of data in accordance with statistical hypotheses. The lowest and upper bounds of the proportion-type data are 0 and 1, respectively. Their upper and lower limits should be freed by conducting multiplication and log transformations, respectively, to make the data suitable for the assumptions of statistics.
As with pairwise meta-analysis, a suitable model should be chosen in order to determine the DTA's summary statistics. The Moses-Littenberg SROC model,22,23 the bivariate model, 24 and the hierarchical SROC (HSROC) model 25 are examples of models that take both sensitivity and specificity into account. The Moses-Littenberg model, a relatively straightforward approach developed early on to compute DTA, uses simple linear regression to estimate the SROC. This is comparable to the fixed-effect model used in pairwise meta-analysis and is unable to evaluate study heterogeneity. Additionally, because this model just offers the SORC curve without providing parameter estimates, standard deviation, or confidence intervals, it can only perform restricted analysis and cannot discriminate between within-study and between-study variations in any variations (CIs). The bivariate model and HSROC model were created based on the hierarchical model to address the shortcomings of the Moses-Littenberg model. 26 When there is no covariate, these 2 models mathematically provide the same value.27,28 This is comparable to the pairwise meta-analysis random-effect model. Both models are capable of estimating the heterogeneity, or the variation of studies both within and between studies. In the bivariate model, the sensitivity and specificity for within-study variations are directly modeled by a binominal distribution, while the sensitivity and specificity for between-study variations are assumed by a bivariate normal distribution. Therefore, we followed a bivariate model for performing pooled DTA analysis. Analyses were performed on R-Studio using the “mada”, 29 “mvtnorm”, 30 “ellipse”, 31 “mvtmeta”, 32 “meta”, 33 “metafor”, 34 “rmeta” 35 packages.
Publication Bias Assessment
DTA meta-analyses differ from conventional intervention meta-analysis in a number of ways, making it more difficult to estimate the likelihood of publication bias. The Egger test is a statistical method for identifying funnel plot asymmetry in conventional meta-analysis. 36 In order to test the global null hypothesis that “all of the univariate funnel plots for multiple outcomes are symmetric,” Hong et al (2020) first proposed an expanded version of this test for multivariate meta-analysis. 37 In comparison to the common univariate publication bias test, this overall test contains various outcome information, and the statistical power is often increased. The Hong's test (also known as MSSET) avoids correlation data among various outcomes that are occasionally absent under some circumstances of multivariate meta-analysis. However, for DTA meta-analysis, the Reitsma's bivariate meta-analysis model has all of the correlation data, and since MSSET does not make use of this data, its statistical power may be wasteful. 24 For the same global null hypothesis, Noma (2020) created alternative generalized Egger tests that successfully take into account the correlation data (called as MSSET2 and MSSET3). Because Noma's tests make use of correlation data, it is anticipated that they will have greater statistical power than the MSSET when applied to DTA meta-analysis. 38 Using this information, we used the “MVPBT” package in R to compute funnel plots and perform statistical tests for asymmetry. 39
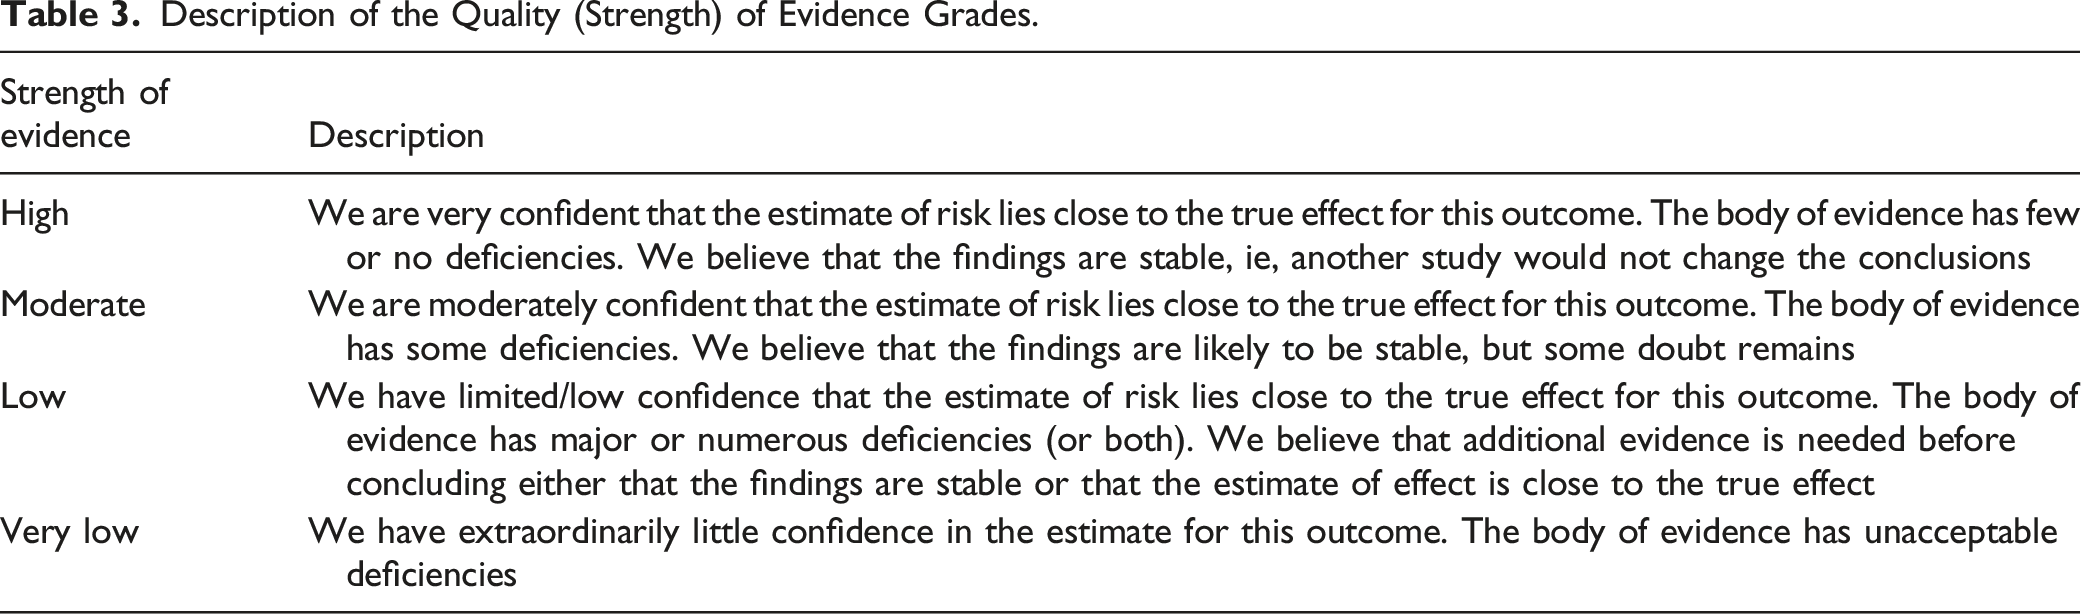
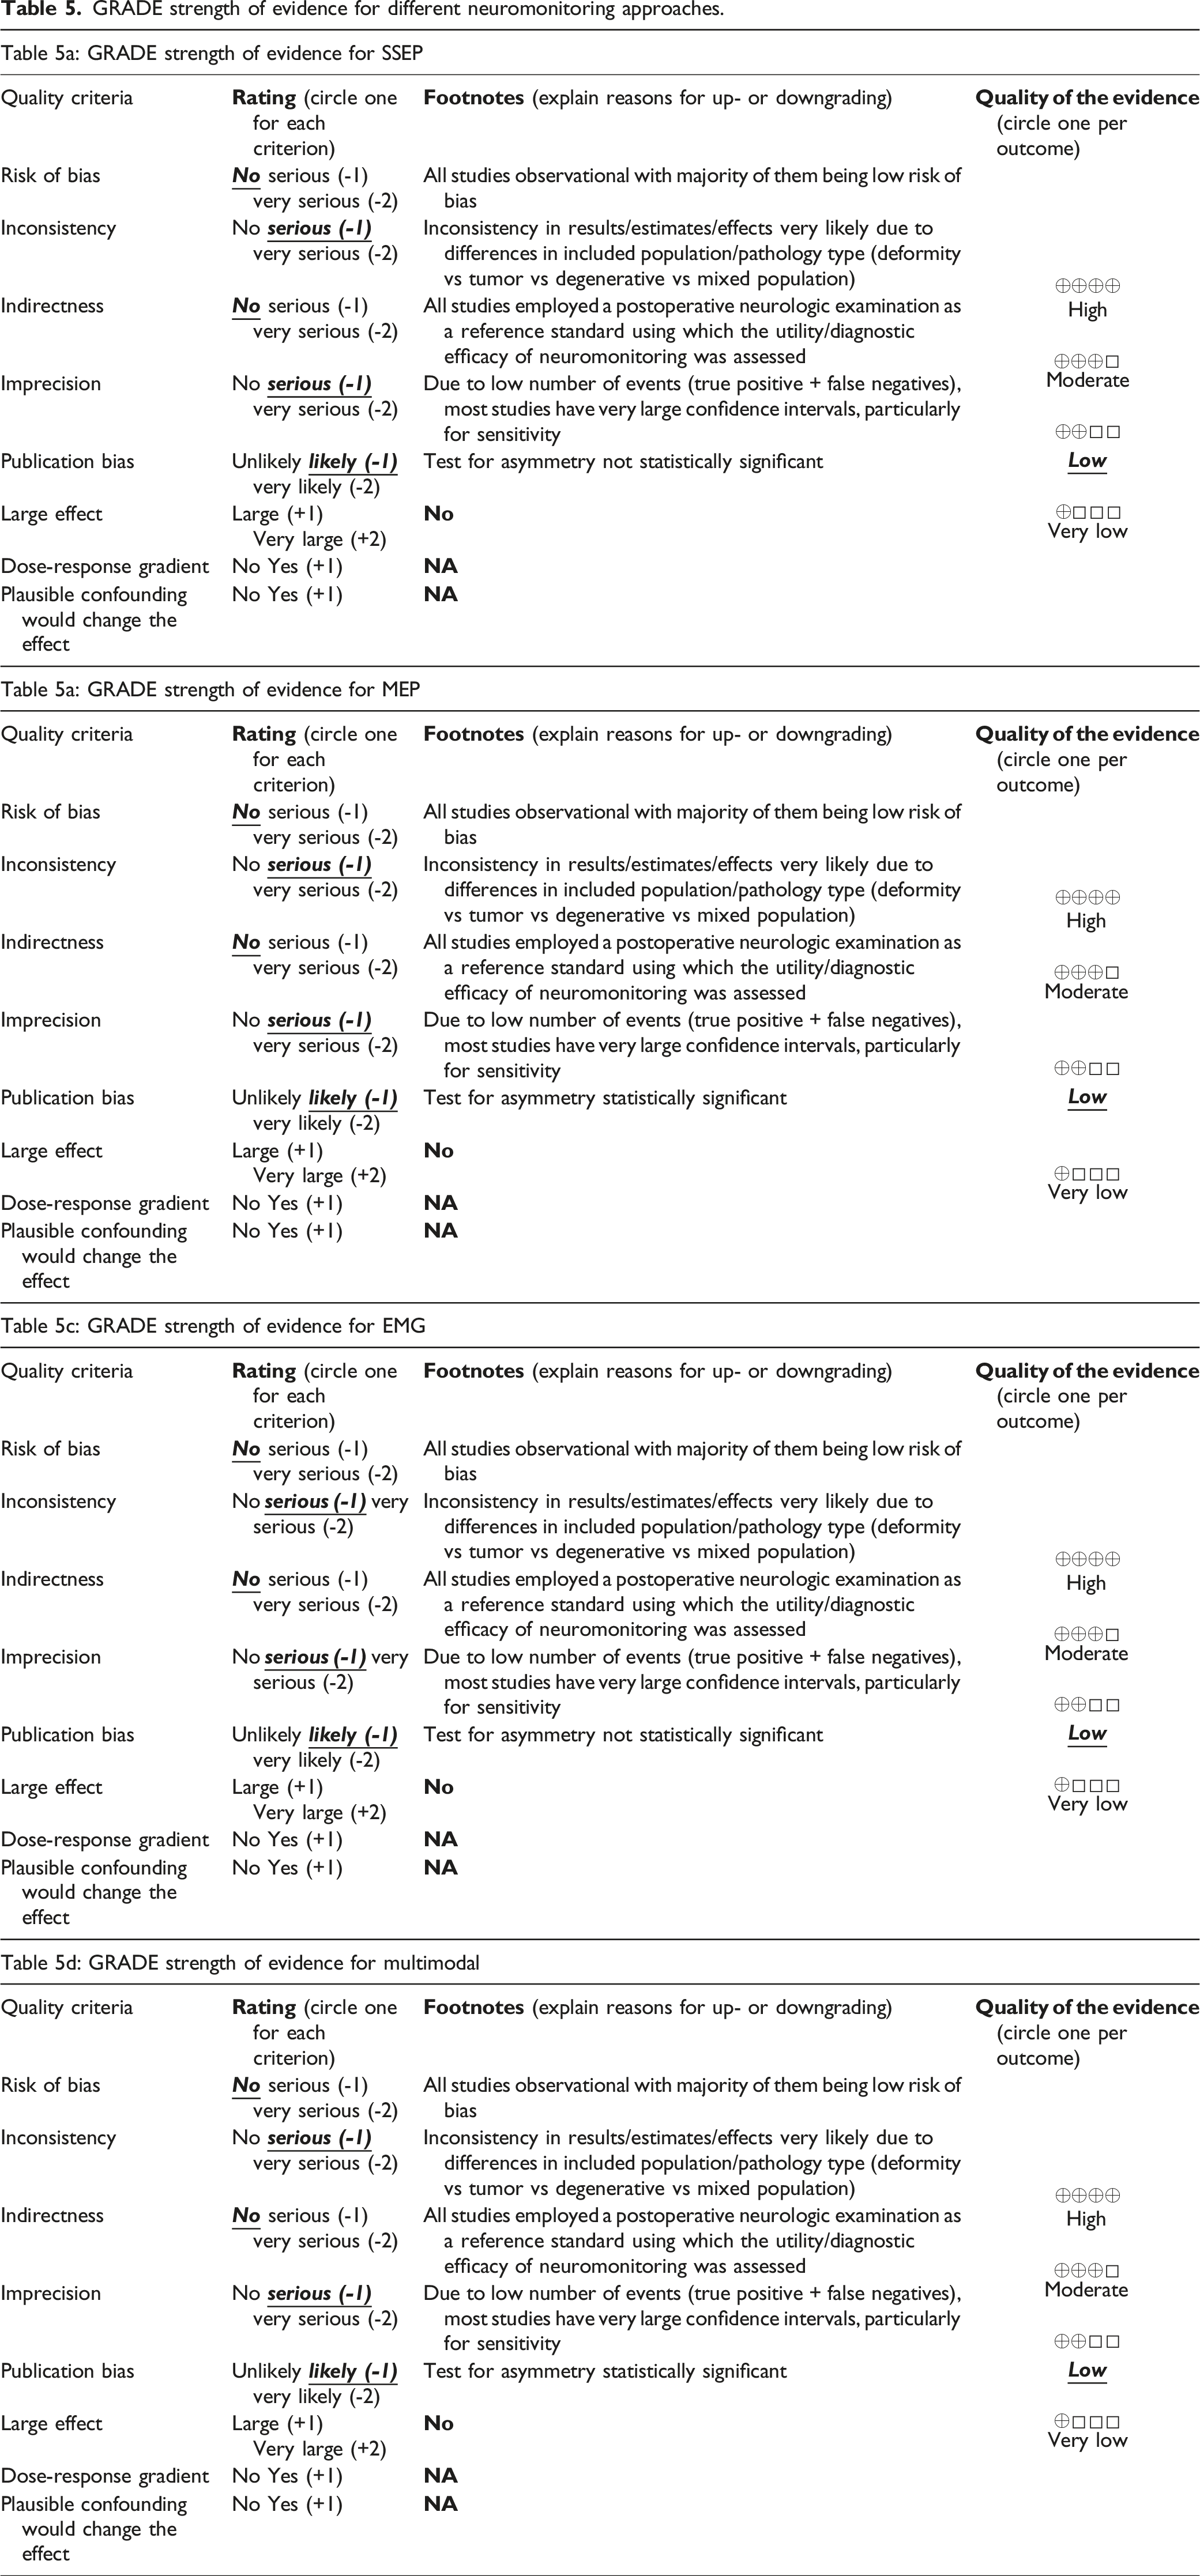
Grading the Strength of Evidence for Major Comparisons and Outcomes
The overall quality (strength) of evidence (SOE) for the primary (critical) outcomes of neurological recovery and adverse events was assessed based on the application of GRADE, particularly for DTA. 40 TSOE was initially evaluated by one methodologist and reviewed independently by a second for consistency and validity before the final assessment. Disagreements were resolved by consensus. For a DTA evidence synthesis, RCT and observational prospective/retrospective studies were initially considered to be high quality of evidence; however, the evidence was downgraded based on the aggregate assessment of risk of bias across studies reporting on the outcome, consistency, imprecision, directness, and publication bias. Comparative observational studies begin as low quality of evidence. There are also situations where the observational evidence may be upgraded (eg, large magnitude of effect, presence of dose-response relationship or existence of plausible unmeasured confounders) as described in the AHRQ Methods Guide. 41
Description of the Quality (Strength) of Evidence Grades.
Results
Study Selection
The search strategy using EMBASE, MEDLINE and SCOPUS yielded a total of 2270 articles after removing 305 duplicates. Of these, 1915 abstracts were considered irrelevant. The full texts of the remaining 355 articles were reviewed. Of these, 189 were excluded. A flowchart summarzing the selection of studies is provided in Figure 1. Details related to excluded studies, including reasons for exclusion, are presented in Supplementary Table 1. A total of 164 studies2,5,42–52, 52–62, 62–72, 72–82, 82–92, 92–102, 102–112, 112–122, 122–132, 132–142, 142–152, 152–162, 162–172, 172–182, 182–192, 192–203 consisting of 99937 patients were included. Of the 164 studies, 16 (9.75%) were prospective while 148 (90.25%) were retrospective. In terms of disease group, most studies included patients with mixed pathology (29.87%, n = 49), followed by deformity (26.83%, n = 44), degenerative disease (21.95%, n = 36), tumors (17.68%, n = 29), trauma (1.83%, n = 3), congenital diseases (1.2%, n = 2) and AVM (.6%, n = 1). Most studies featured centers/hospitals from the United States (35.36%, n = 58), followed by Japan (15.85%, n = 26), China (9.1%, n = 15), Korea, UK (5.5% each, n = 9), Canada, Switzerland (4.9% each, n = 8), and others. Several studies consisted of only adult patients (50%, n = 82), while others included both adolescent and adult patients (34.7%, n = 57) or only adolescent patients (9.1%, n = 15). Ten studies (6%) did not specify patient age. Of the 164 studies, 52 studies (31.7%) presented data for SSEP, 75 studies (45.7%) presented data for MEP, 16 studies (9.75%) presented data for EMG, and 69 studies (42.07%) presented data for multimodal neuromonitoring. These study characteristics are summarized in Table 4. PRISMA-DTA Flowchart for selection of studies. Characteristics of included studies.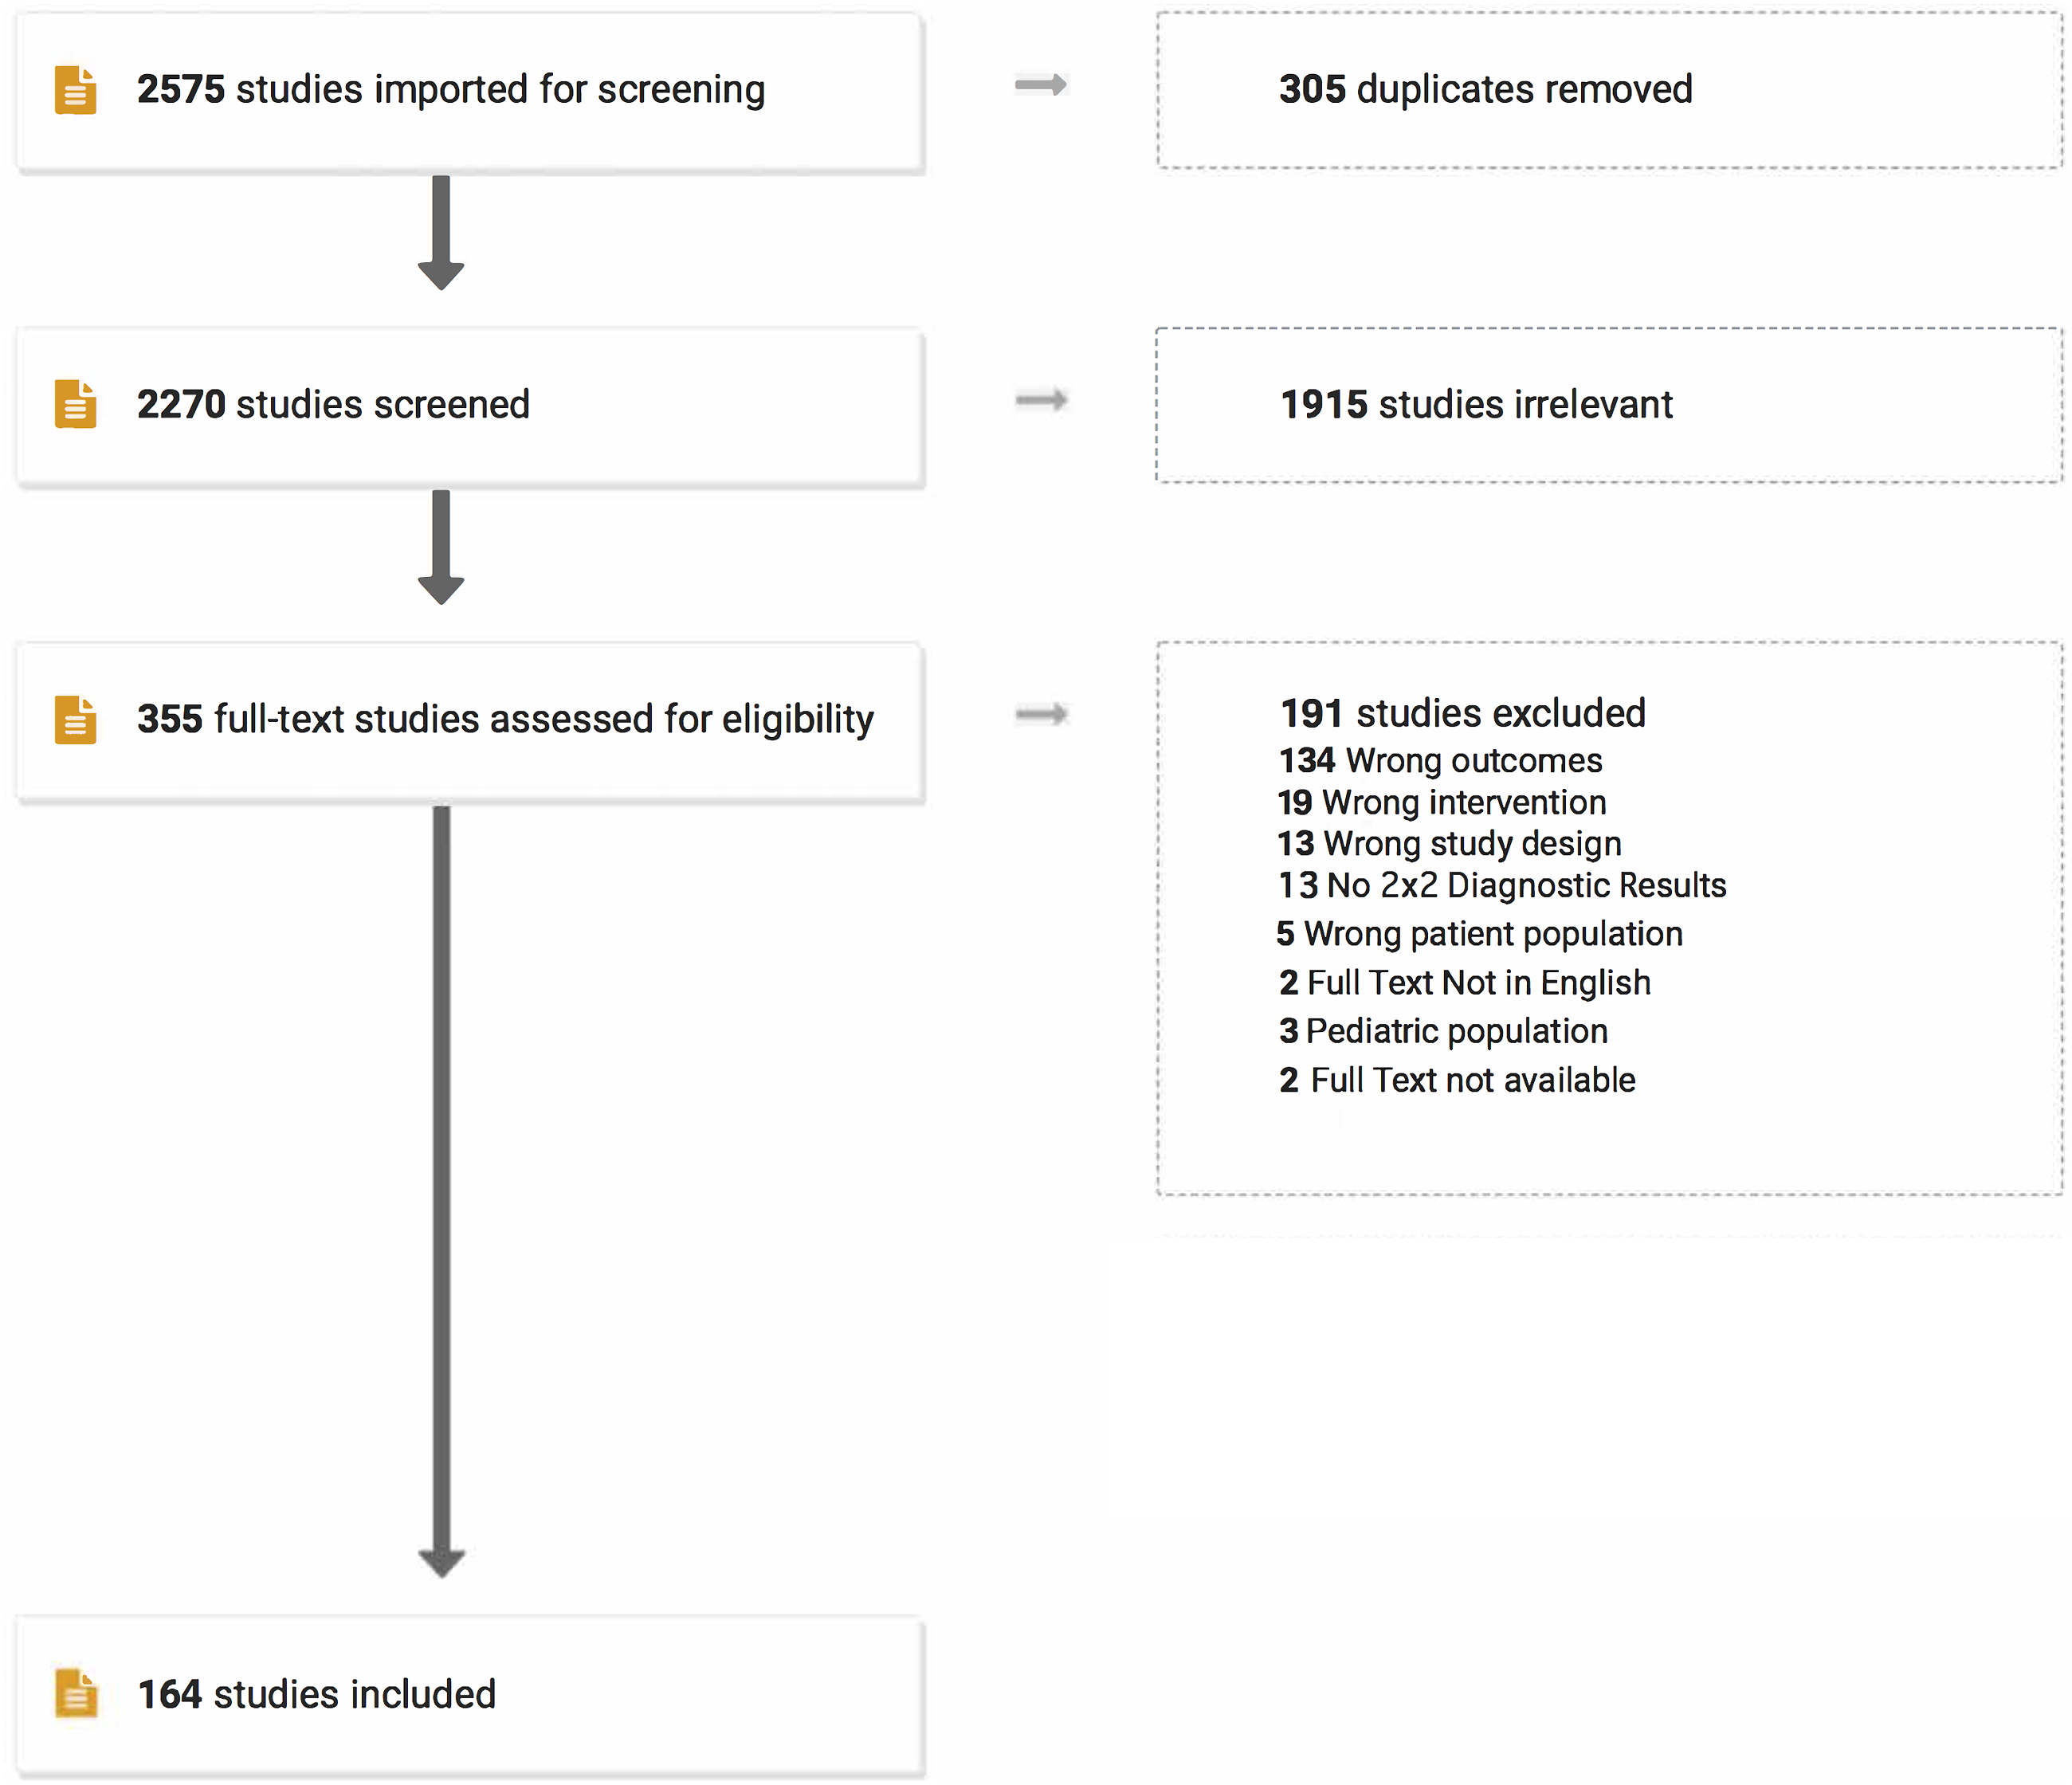
SSEP
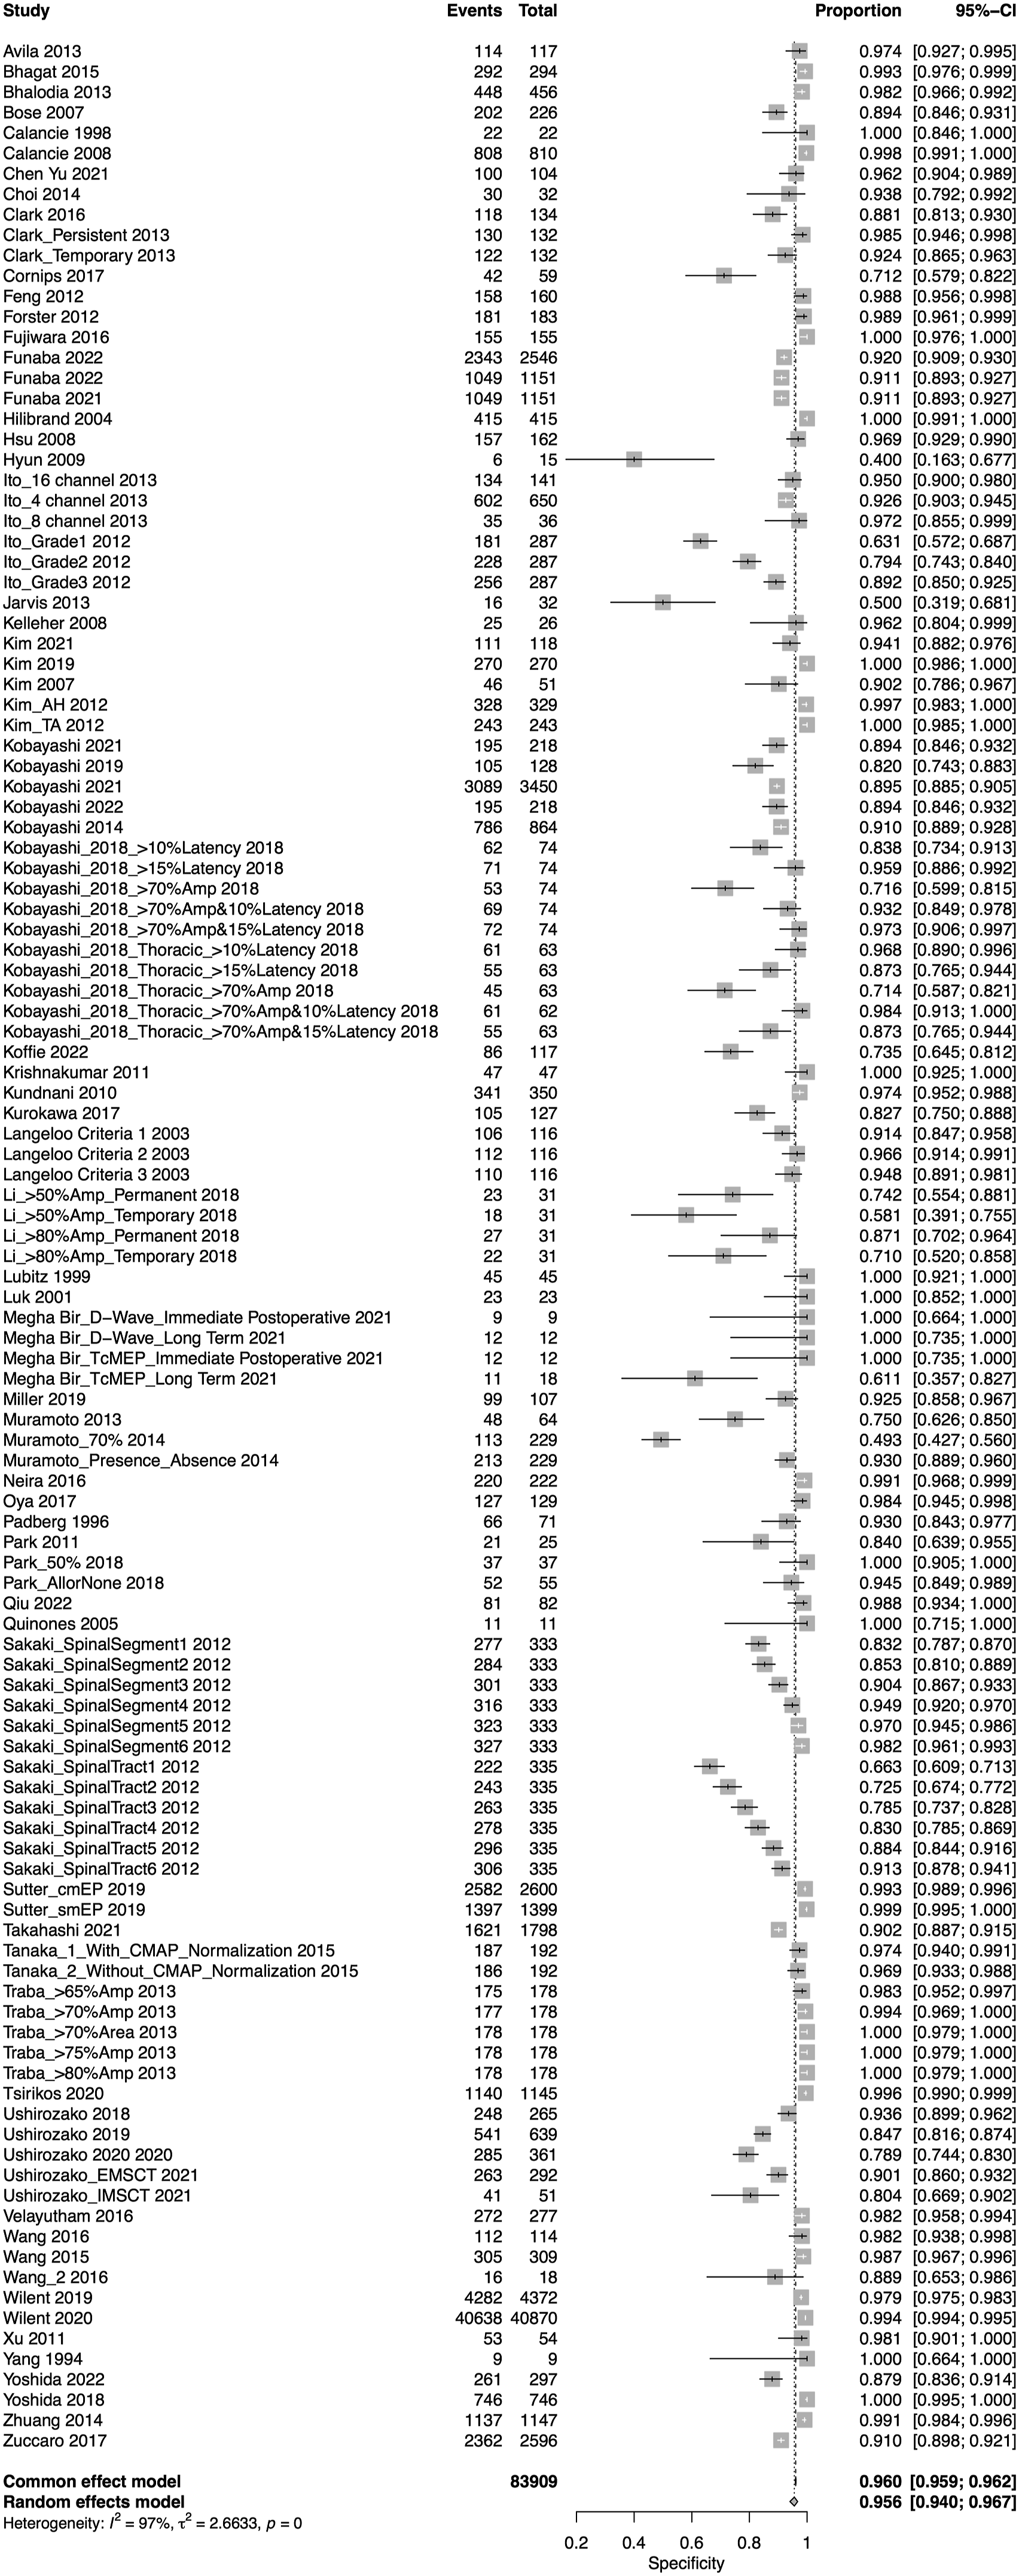
A total of 52 studies presented data for SSEP on a total of 18,076 patients. Overall, the sensitivity of SSEP was 67.5% (95% CI 50.9-80.6, Heterogeneity: I2 = 62%, τ2 = 5.9269, P < .01) (Figure 2), while the specificity was 96.8% (95% CI 94.8-98.1, Heterogeneity: I2 = 95%, τ2 = 3.8246, P < .01) (Figure 3). Overall, the AUC value was .899, while the DOR was 41.9 (95% CI 24.1-73.1) (Figure 4). Forest plot for sensitivity of SSEP. Forest plot for specificity of SSEP. Overall sROC plot for SSEP.
We also performed subgroup analysis for various thresholds for IONM alerts, different reported disease groups, and different regions.
Subgroup Analyses: 1. Thresholds:
The most commonly reported threshold for alert was 50% (n = 43 studies), followed by 60% (n = 4 studies), 25%, 75% (n = 2 studies each) and “all or none” (n = 1 study). Seven studies either reported a different threshold/alert criterion or did not report the actual alert criterion in explicit details; these were classified under “other”. The pooled sensitivities for the 25% threshold, 50% threshold, 60% threshold, 75% threshold, “all or none” alert and other threshold were 90% (95% CI 76.2-96.2, Heterogeneity: I2 = 38%, τ2 = 0, P = .20), 71.6% (95% CI 49.5-86.6 Heterogeneity: I2 = 62%, τ2 = 8.4139, P < .01, Heterogeneity: I2 = 0%, τ2 = 2.5549, P = .99), 62.9% (95% CI 12.9-95.1, Heterogeneity: I2 = 0%, τ2 = 2.55, P = .99), 71.2% (95% CI 59.2-80.8, Heterogeneity: I2 = 45%, τ2 = 0, P = .18), 24.3% (95% CI 11.8-41.2, Heterogeneity: I2 = 45%, τ2 = 0, P = .1) and 41.2% (95% CI 28.6-55, Heterogeneity: I2 = 0%, τ2 = 0, P = .93), respectively (Supplemental Figure 1(a)). The pooled specificities for the 25% threshold, 50% threshold, 60% threshold, 75% threshold, “all or none” alert and other threshold were 27.3% (95% CI 20.3-35.7, Heterogeneity: I2 = 0%, τ2 = 0, P = .65), 97.5% (95% CI 95.6-98.6, Heterogeneity: I2 = 94%, τ2 = 3.5177, P < .01), 98.5% (90.5-99.8, Heterogeneity: I2 = 48%, τ2 = 3.1291, P = .12), 78.4% (95% CI 11.5-88.4, Heterogeneity: I2 = 96%, τ2 = 1.4229, P < .01), 97.1% (95% CI 85.1-99.9) and 95.3% (95% CI 92.3-97.2, Heterogeneity: I2 = 73%, τ2 = .2627, P < .01), respectively (Supplemental Figure 1(b)). 2. Disease Group:
In terms of disease group, most studies presenting data for SSEP consisted of patients with mixed diseases (n = 15), followed by deformity (n = 14), degenerative diseases (n = 13), tumors (n = 5), trauma (n = 3), and others (n = 2). The pooled sensitivity for studies consisting of patients with mixed diseases was 52% (95% CI 26.5-76.5, Heterogeneity: I2 = 78%, τ2 = 3.9806, P < .01), for deformity it was 94% (95% CI 77.6-98.6, Heterogeneity: I2 = 3%, τ2 = 5.2433, P = .42), for degenerative it was 49.9% (95% CI 11.5-88.4 Heterogeneity: I2 = 0%, τ2 = 10.9146, P = .99), for tumor it was 33.2% (95% CI 9.2-70.9, Heterogeneity: I2 = 67%, τ2 = 2.7226, P = .01), for trauma it was 69.4% (95% CI 42.8-87.3, Heterogeneity: I2 = 11%, τ2 = .4518, P = .35), and for other diseases group, it was 35.3% (95% CI 16.8-59.6, Heterogeneity: I2 = 0%, τ2 = 0, P = .52) (Supplemental Figure 2(a)).
The pooled specificity for studies consisting of patients with mixed diseases was 97.6% (95% CI 94.2-99, Heterogeneity: I2 = 93%, τ2 = 2.8975, P < .01), for deformity it was 96% (95% CI 89.7-98.5, Heterogeneity: I2 = 95%, τ2 = 4.698, P < .01), for degenerative it was 99.1% (95% CI 97.6-99.7, Heterogeneity: I2 = 91%, τ2 = 2.1, P < .01), for tumor it was 93.5% (95% CI 83.4-97.6, Heterogeneity: I2 = 81%, τ2 = 1.16, P < .01), for trauma it was 83.4% (95% CI 42.8-87.3, Heterogeneity: I2 = 11%, τ2 = .4518, P = .35), and for other diseases group, it was 35.3% (95% CI 16.8-59.6, Heterogeneity: I2 = 0%, τ2 = .68, P = 1.00) (Supplemental Figure 2(b)).
The AUC for mixed pathology group, deformity, degenerative, tumor and trauma were .911, .908, .948, .791 and .744, respectively (Supplemental Figure 2(c)). 3. Regions
In terms of region of surgery, most studies presenting data for SSEP consisted of patients undergoing surgery for any region (n = 20), followed by surgery in the cervical spine (n = 11), lumbosacral (n = 9), thoracolumbar and cervicothoracic (n = 6 each) segments. The pooled sensitivity for studies consisting of patients with all regions was 77.2% (95% CI 60.4-88.3, Heterogeneity: I2 = 49%, τ2 = 3.27, P < .01), for cervical spine surgery it was 46.6% (95% CI 24.3-70.4, Heterogeneity: I2 = 59%, τ2 = 1.91, P < .01), for thoracolumbar spine surgery it was 99.1% (95% CI 29.1-100. Heterogeneity: I2 = 0%, τ2 = 16.9, P = .99), for lumbosacral it was 49.7% (95% CI 3.5-96.4, Heterogeneity: I2 = 0%, τ2 = 20.5, P = .68) and for cervicothoracic spine it was 24% (95% CI 17.8-31.5, Heterogeneity: I2 = 0%, τ2 = 0, P = .56) (Supplemental Figure 3(a)).
The pooled specificity for studies consisting of patients with surgery for any region was 95.5% (95% CI 90.5-97.9, Heterogeneity: I2 = 95%, τ2 = 4.57, P < .01), for cervical spine it was 98.5% (95% CI 95.2-99.6, Heterogeneity: I2 = 88%, τ2 = 3.3, P < .01), for thoracolumbar surgery it was 88.6% (95% CI 74.1-95.4, Heterogeneity: I2 = 91%, τ2 = 1.7, P < .01), for lumbosacral it was 99% (95% CI 3.5-96.4, Heterogeneity: I2 = 0%, τ2 = 20.5, P < .01), for cervicothoracic it was 96% (95% CI 94.4-97.1, Heterogeneity: I2 = 0%, τ2 = 0, P = .01) (Supplemental Figure 3(b)).
The AUC for cervical spine, cervicothoracic, thoracolumbar, lumbosacral and all regions were .928, .729, .879, .926 and .911, respectively (Supplemental Figure 3(c)).
MEP
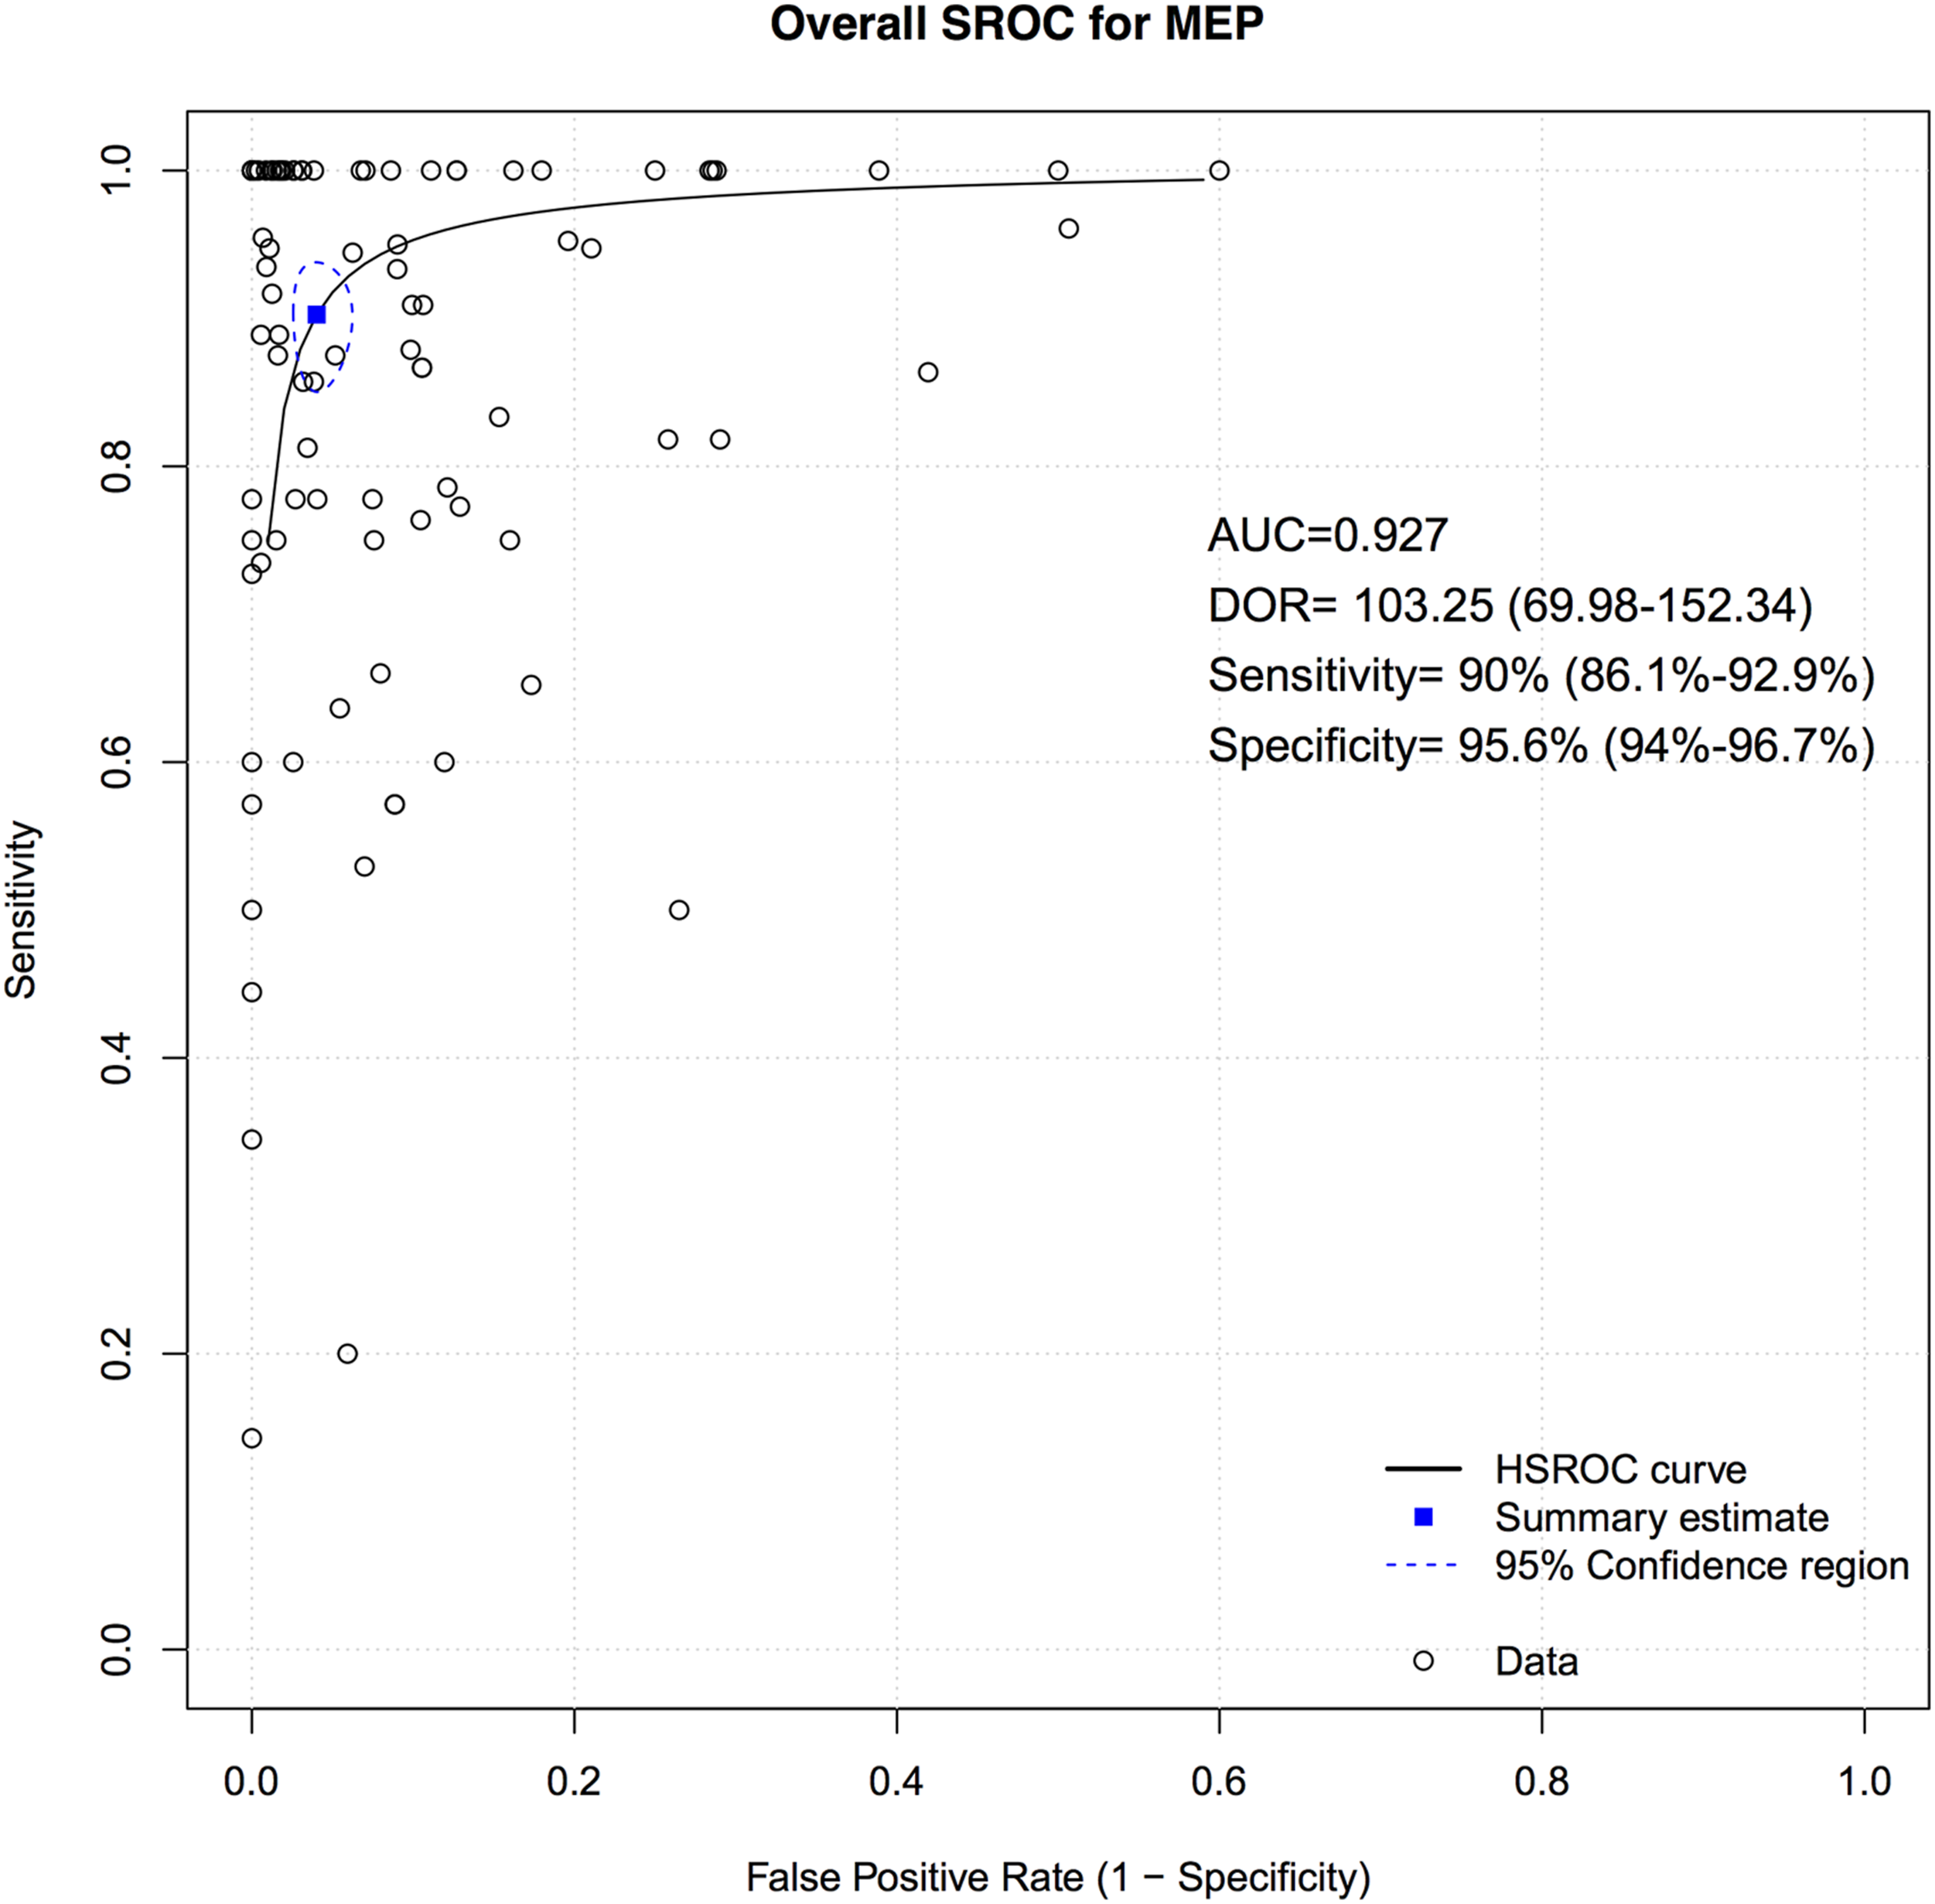
A total of 75 studies presented data for MEP on 79,545 patients. Overall, the sensitivity of MEP was 90% (95% CI 86.1-92.9, Heterogeneity: I2 = 32%, τ2 = 1.91, P < .01) (Figure 5), while the specificity was 95.6% (95% CI 94-96.7, Heterogeneity: I2 = 97%, τ2 = 2.7, P < .01) (Figure 6). Overall, the AUC value was .927, while the DOR was 103.25 (95% CI 69.98—152.34) (Figure 7). Forest plot for sensitivity of MEP. Forest plot for specificity of MEP. Overall sROC plot for MEP.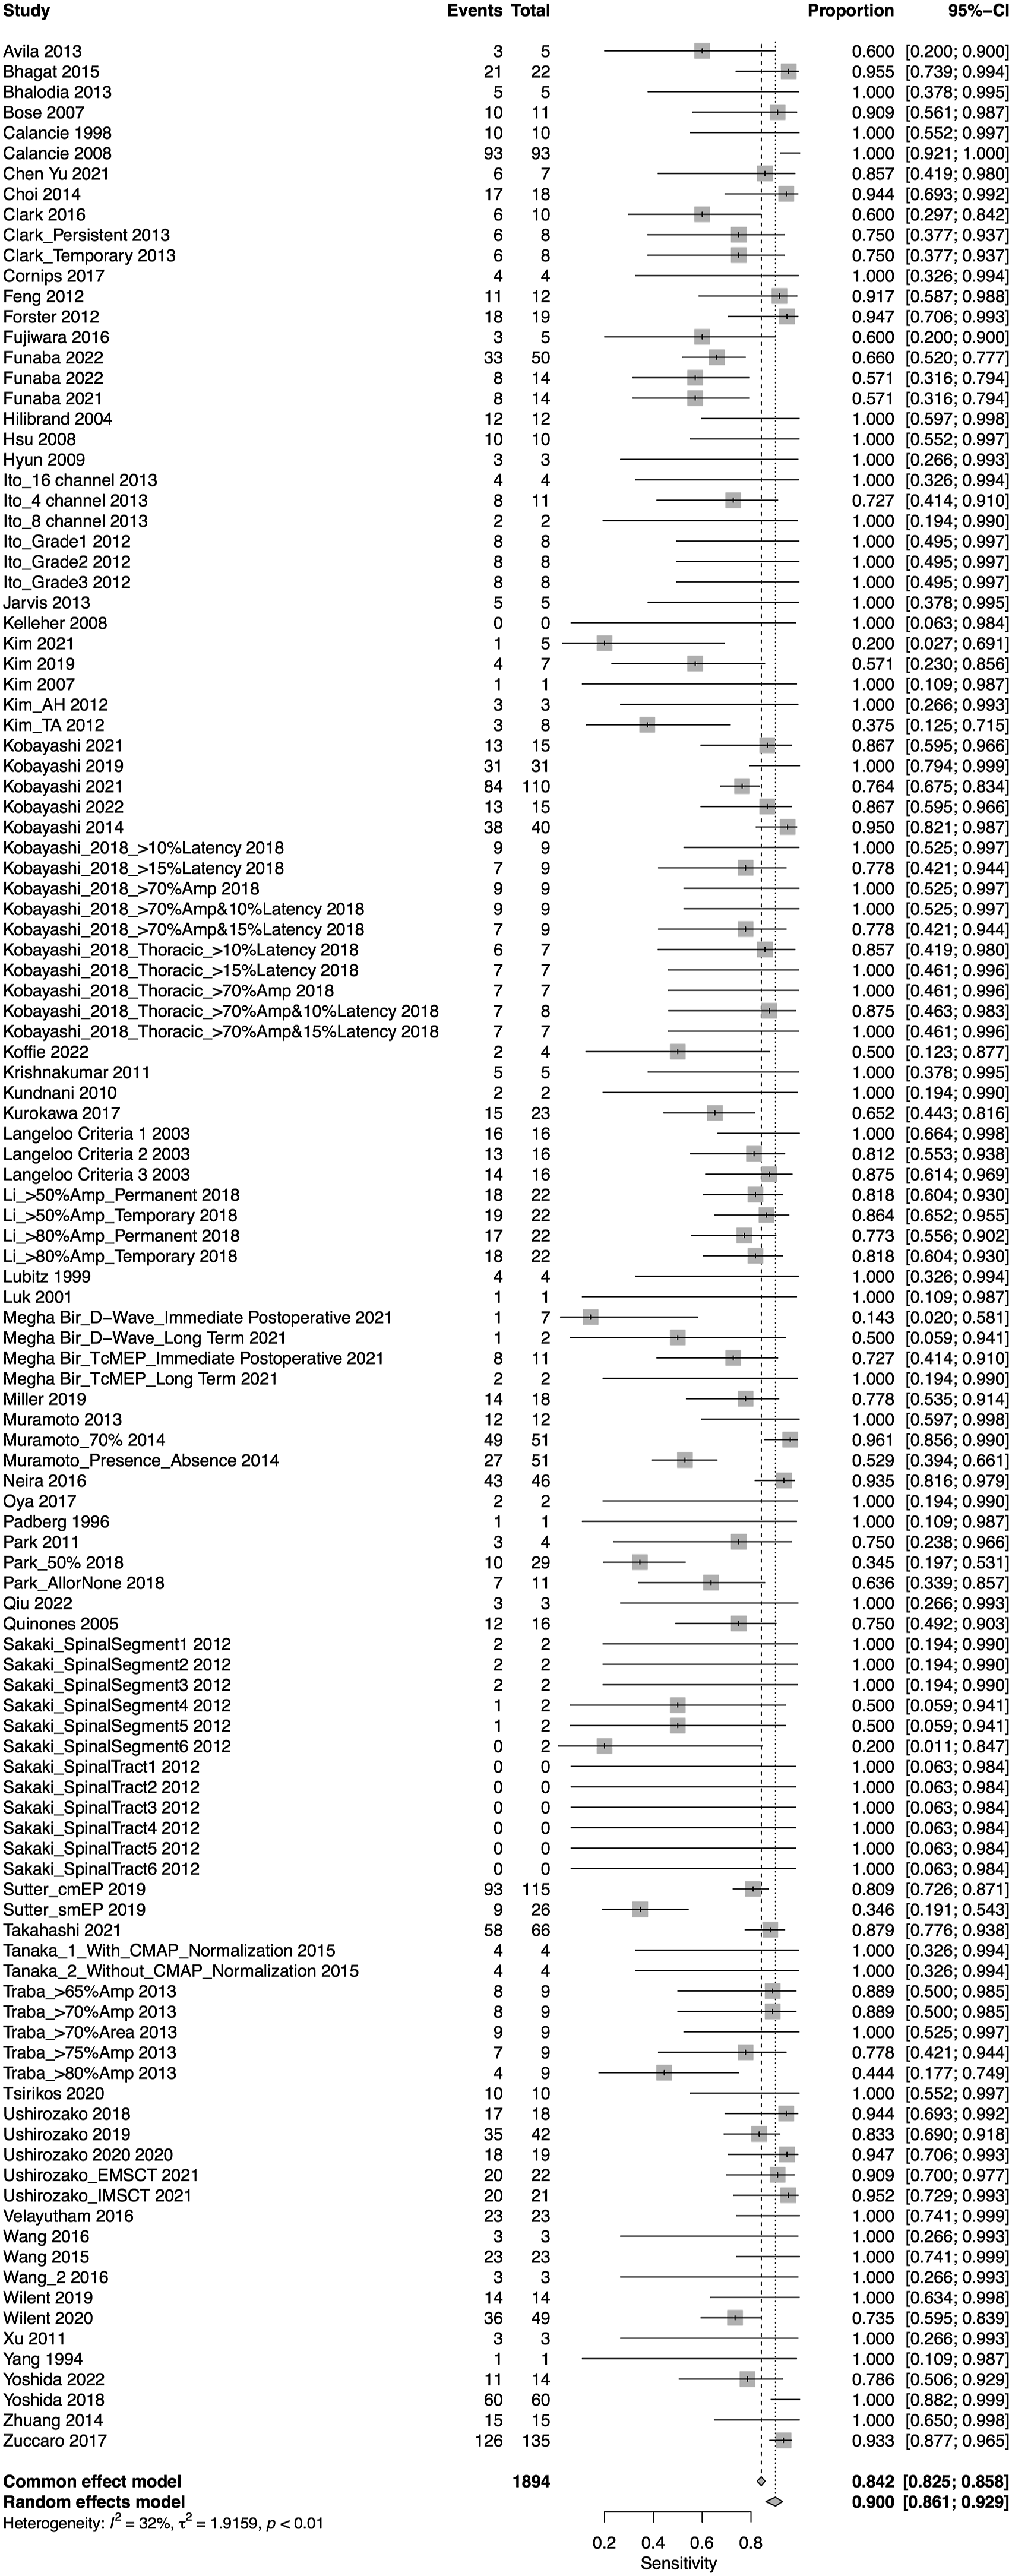
We also performed subgroup analysis for various thresholds for IONM alerts u, different reported disease groups and different regions.
Subgroup Analyses: 1. Thresholds:
The most commonly reported change in amplitude threshold for alert was 50% (n = 24 studies), followed by 70% (n = 20 studies), 80% (n = 16 studies), “all or none” (n = 5 studies), 65% (n = 5 studies), 75% (n = 3 studies), change in latency of >10% and >15% (n = 2 each), 10%, 20%, 30%, 40%, 50%–65%, 50%–80%, 60% (n = 1 each), and significant change. Nine studies either did not specify the criteria for alarm or reported a method other than amplitude change or latency change. The pooled sensitivities for 50% threshold, 70% threshold, 80% threshold, “all or none” alert, 65% threshold and 75% threshold were 85.4% (95% CI 75-92, Heterogeneity: I2 = 50%, τ2 = 1.47, P < .01), 91.3% (95% CI 85.4-95, Heterogeneity: I2 = 38%, τ2 = 1.16, P = .03), 92.3% (95% CI 79.2-97.4, Heterogeneity: I2 = 0%, τ2 = 2.59, P = .65), 56.8% (95% CI 45.3-67.5, Heterogeneity: I2 = 0%, τ2 = 0, P = .92), 94% (95% CI 85.1-97.7, Heterogeneity: I2 = 0%, τ2 = 0, P = .99) and 89.7% (95% CI 75.7-96.1, Heterogeneity: I2 = 0%, τ2 = 0, P = .43), respectively (Supplemental Figure 4(a)). The pooled specificity for 50% threshold, 70% threshold, 80% threshold, “all or none” alert, 65% threshold and 75% threshold were 94.2% (95% CI 88.2-97.2, Heterogeneity: I2 = 99%, τ2 = 3.42, P < .01), 90.4% (95% CI 85.4-93.9, Heterogeneity: I2 = 94%, τ2 = 1.39, P < .01), 96.7% (95% CI 94.2-98.1, Heterogeneity: I2 = 88%, τ2 = 1.47, P < .01), 96.1% (95% CI 92.7-98, Heterogeneity: I2 = 69%, τ2 = .39, P < .01), 98.2% (95% CI 97.3-98.8, Heterogeneity: I2 = 0%, τ2 = 0, P = .72) and 99% (95% CI 94.1-99.8, Heterogeneity: I2 = 25%, τ2 = 1.39, P = .43), respectively (Supplemental Figure 4(b)). 2. Disease Group:
In terms of disease group, most studies presenting data for MEP consisted of patients with mixed diseases (n = 27), followed by deformity (n = 19), degenerative diseases (n = 17), tumors (n = 12), and others (n = 2). The pooled sensitivities for studies consisting of patients with mixed diseases was 93.9% (95% CI 87.1-97.2, Heterogeneity: I2 = 20%, τ2 = 3.63, P = .12), for deformity it was 92.4% (95% CI 89.3-94.7, Heterogeneity: I2 = 0%, τ2 = 0, P = .95), for degenerative it was 80% (95% CI 66.3-89, Heterogeneity: I2 = 0%, τ2 = 1.0, P = .99), and for tumor it was 85.4% (95% CI 72.9-92.7, Heterogeneity: I2 = 73%, τ2 = 1.58, P < .01) (Supplemental Figure 5(a)).
The pooled specificities for studies consisting of patients with mixed diseases was 97% (95% CI 94.6-98.3, Heterogeneity: I2 = 93%, τ2 = 2.8975, P < .01), for deformity it was 96.1% (95% CI 93-97.9, Heterogeneity: I2 = 93%, τ2 = 3.51, P < .01), for degenerative it was 94.9% (95% CI 91.5-97, Heterogeneity: I2 = 99%, τ2 = 2.1, P < .01) and for tumor it was 85.4% (95% CI 72.9-92.7, Heterogeneity: I2 = 95%, τ2 = 1.94, P < .01) (Supplemental Figure 5(b)).
The AUC for mixed pathology group, deformity, degenerative and tumor were .937, .934, .948, .722 and .915, respectively (Supplemental Figure 5(c)). 3. Regions
In terms of region of surgery, most studies presenting data for MEP consisted of patients undergoing surgery for any region (n = 20), followed by surgery in the cervical spine (n = 11), lumbosacral (n = 9), thoracolumbar and cervicothoracic (n = 6 each) segments. The pooled sensitivity for studies consisting of patients with all regions was found to be 91.6% (95% CI 87.2-94.6, Heterogeneity: I2 = 35%, τ2 = 1.7, P < .01), for cervical spine surgery it was 80.2% (95% CI 64.7-89.9, Heterogeneity: I2 = 0%, τ2 = 1.26, P = 1.00), for thoracic spine surgery it was 100% (95% CI 0-100. Heterogeneity: I2 = 0%, τ2 = 0, P = .99), for lumbosacral it was 74.7% (95% CI 65.1-82.5, Heterogeneity: I2 = 0%, τ2 = 0, P = .78) and for cervicothoracic spine it was 90.6% (95% CI 77.6-96.4, Heterogeneity: I2 = 45%, τ2 = 2.37, P = .02) (Supplemental Figure 6(a)).
The pooled specificity for studies consisting of patients with surgery for any region was 97% (95% CI 95.1-98.2, Heterogeneity: I2 = 93%, τ2 = 3.44, P < .01), for cervical spine, it was 93.3% (95% CI 89.8-95.6, Heterogeneity: I2 = 96%, τ2 = 1.38, P < .01), for thoracic spine, it was 77.6% (95% CI 71.2-82.8, Heterogeneity: I2 = 35%, τ2 = .007, P < .01), for lumbosacral it was 98% (95% CI 91.1-99.6, Heterogeneity: I2 = 99%, τ2 = 2.7, P < .01), for cervicothoracic it was 92.8% (95% CI 87.1-96.1, Heterogeneity: I2 = 92%, τ2 = 1.47, P < .01) (Supplemental Figure 6(b)).
The AUC for cervical spine, cervicothoracic, thoracic, lumbosacral and all regions were .742, .919, .895, .804 and .934, respectively (Supplemental Figure 6(c)).
EMG
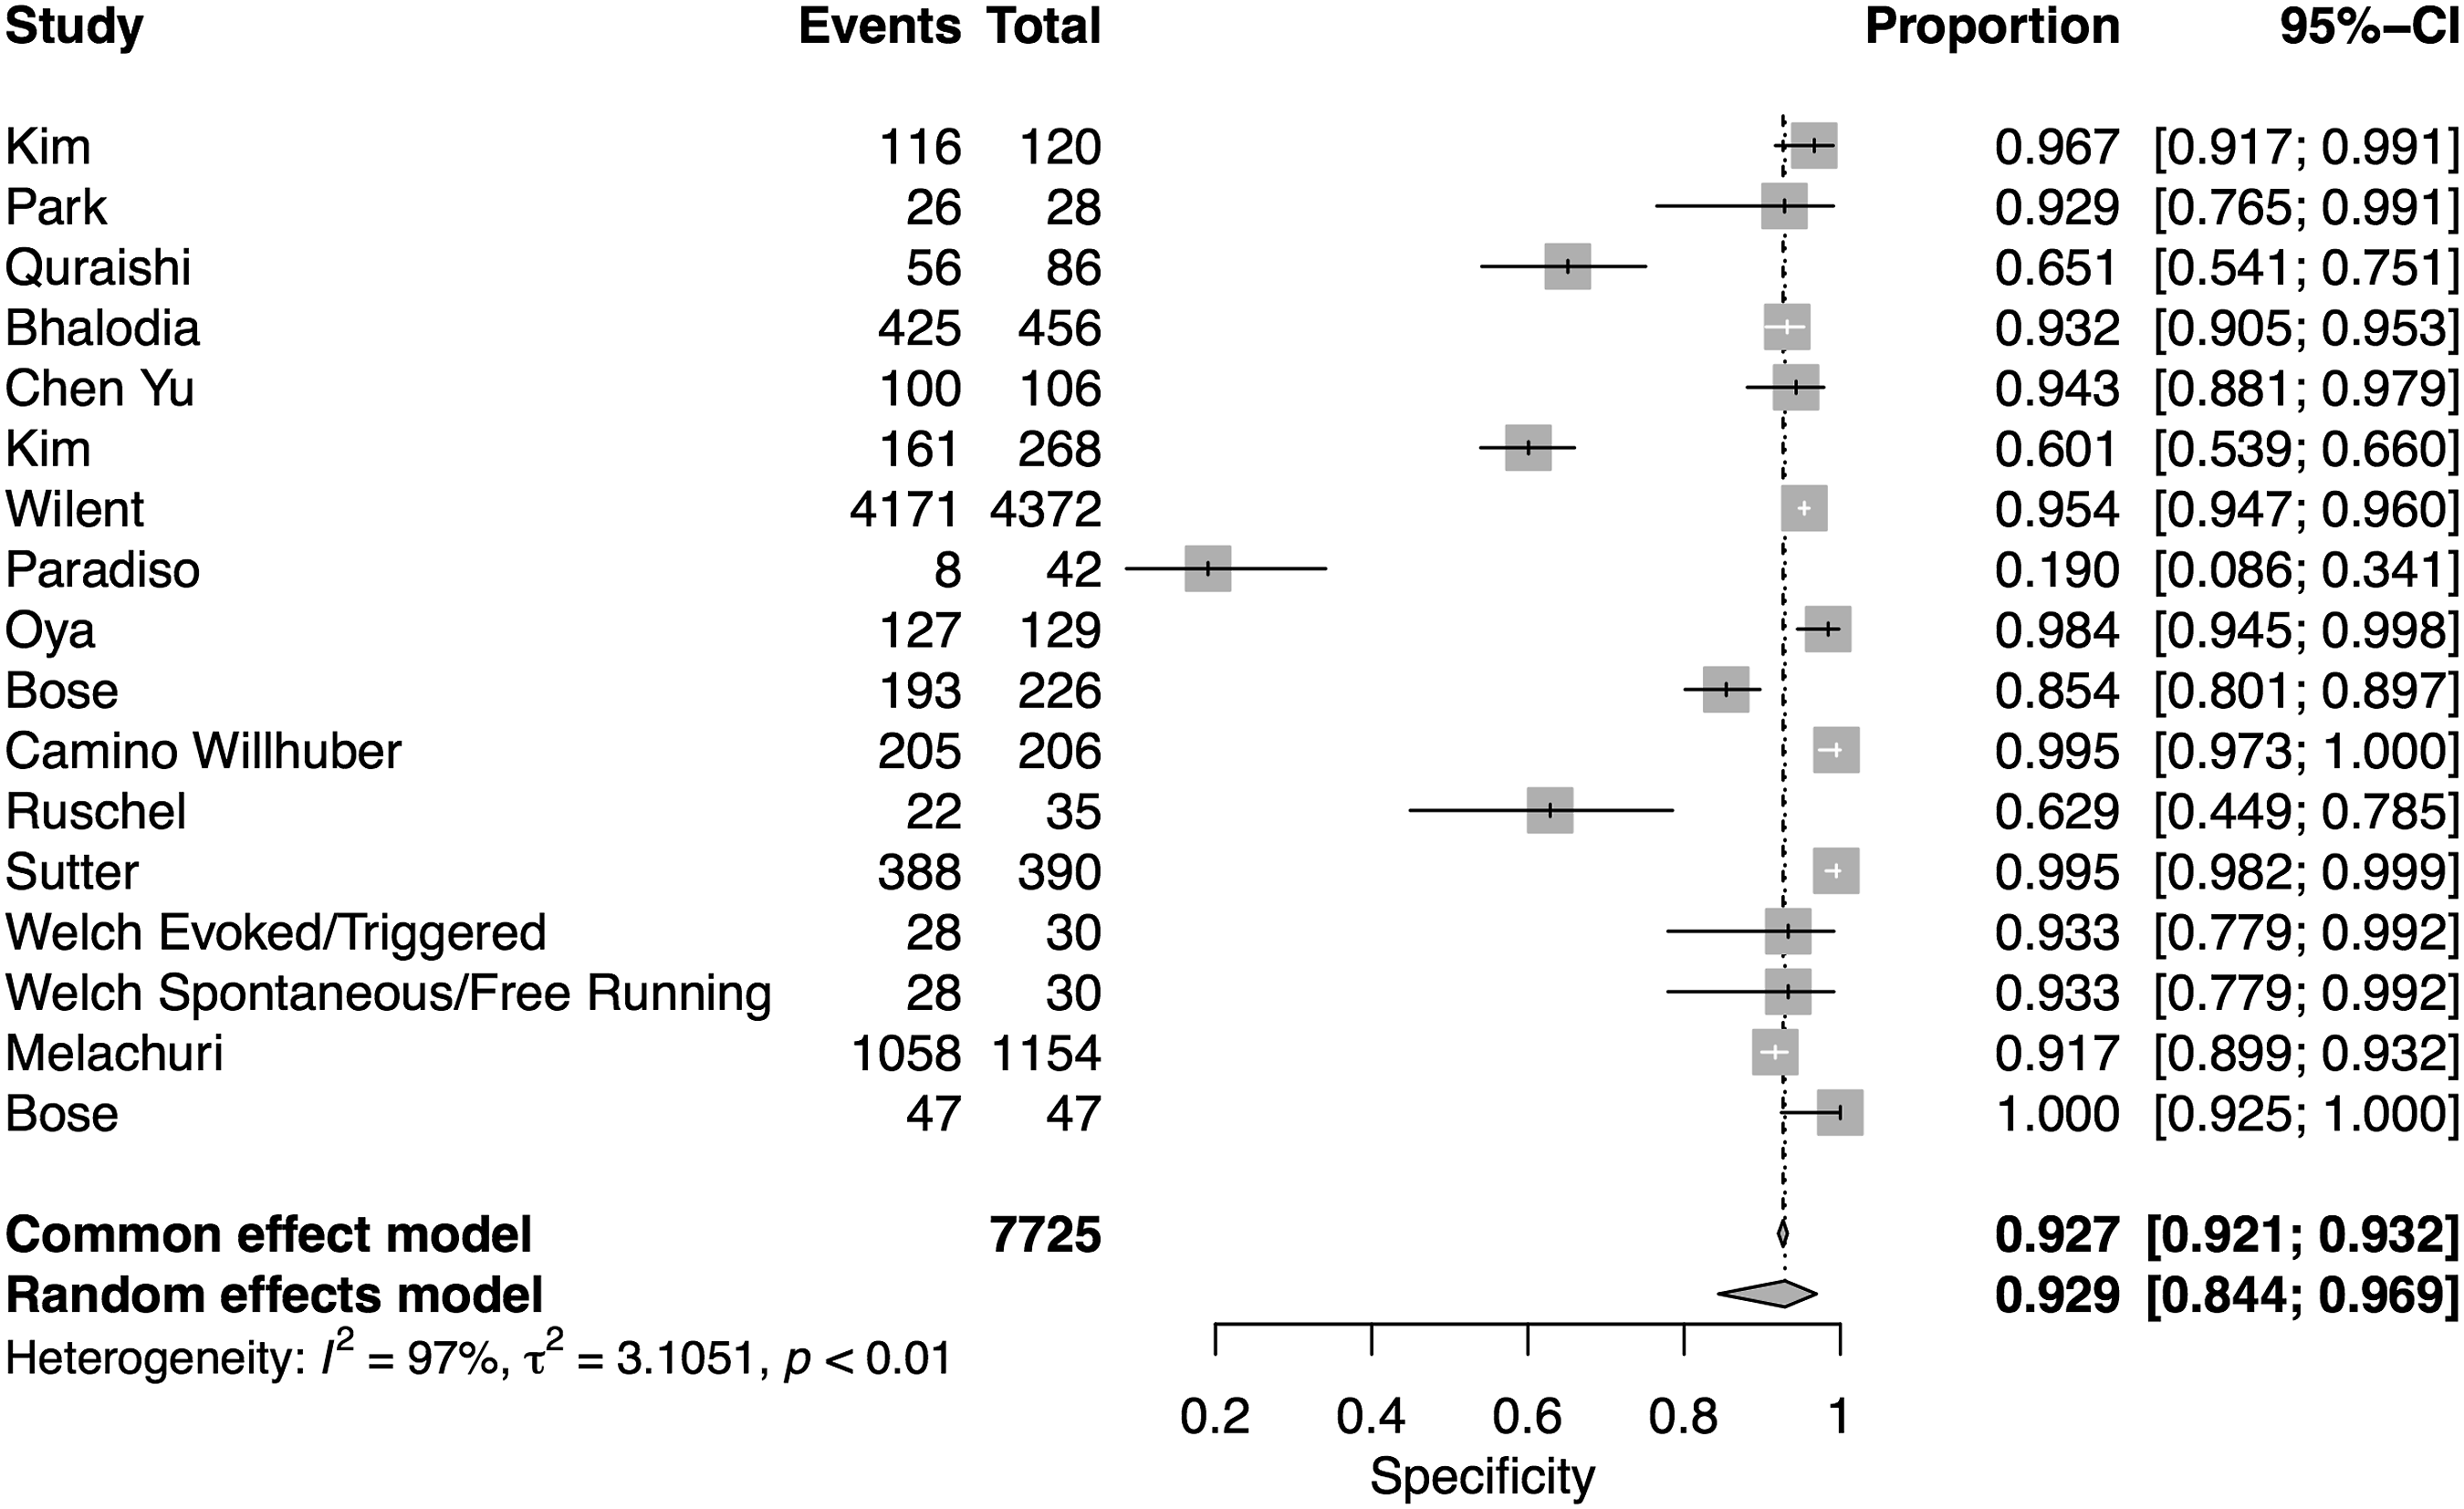
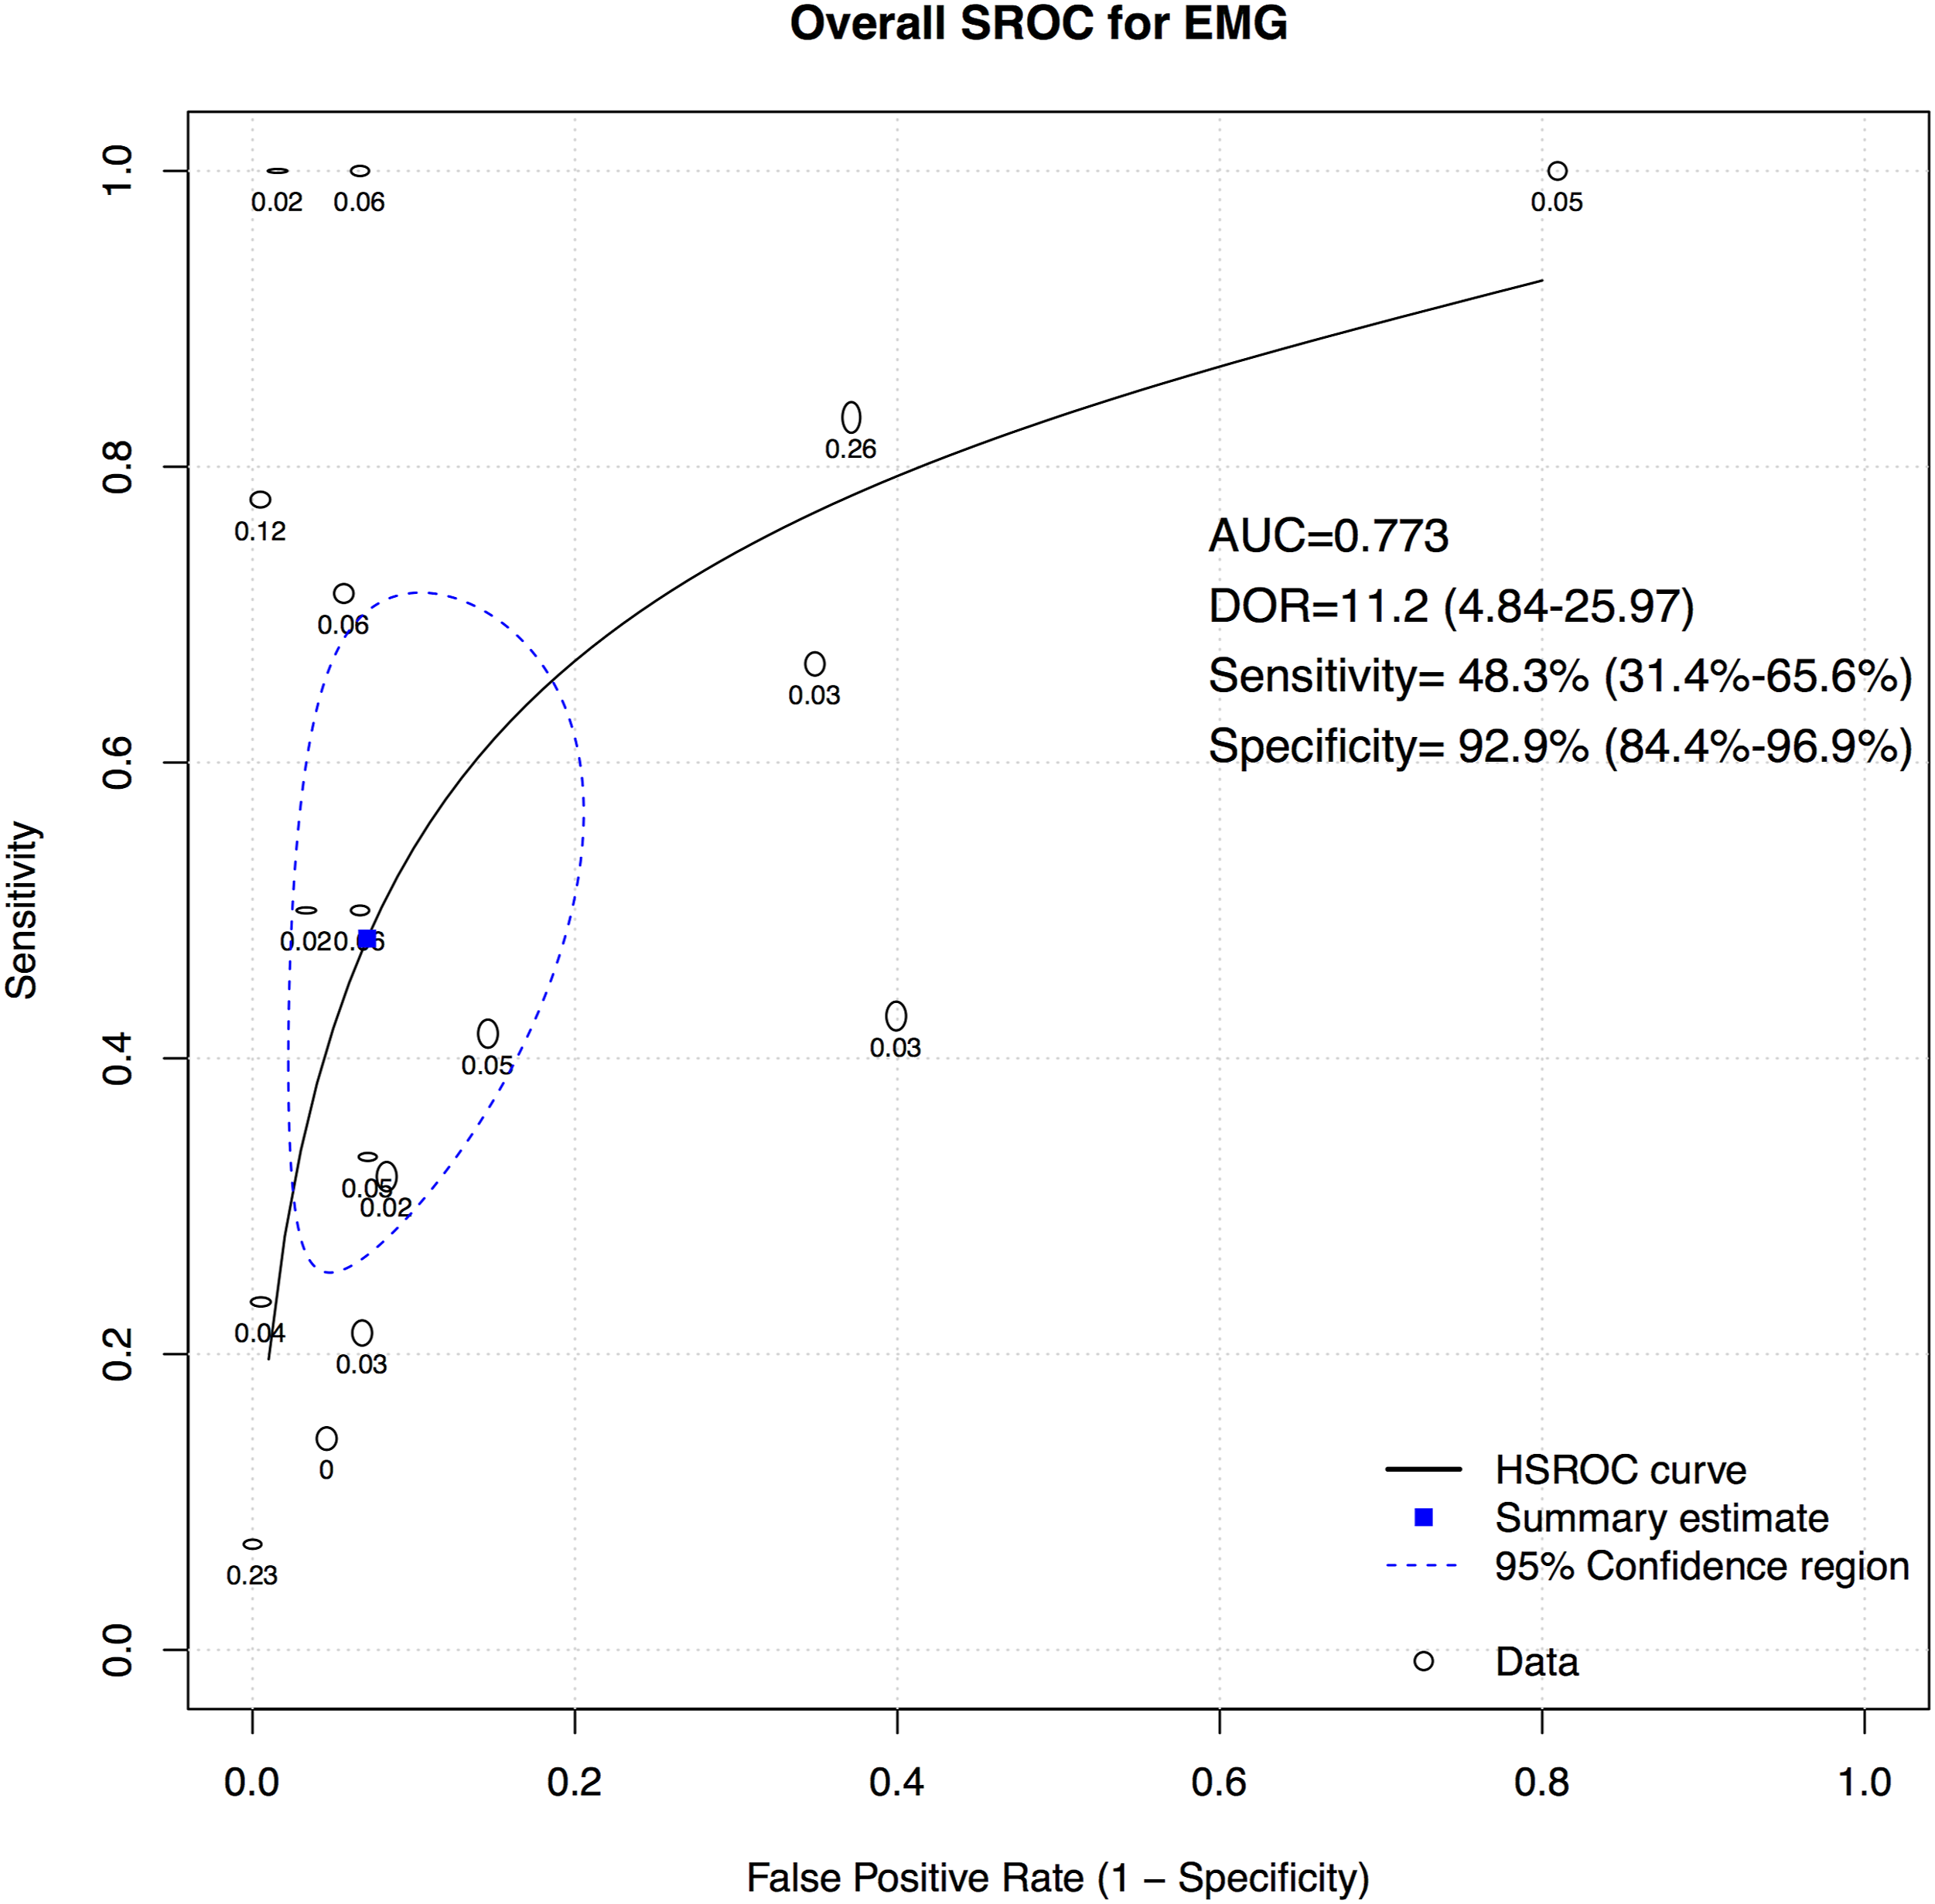
A total of 16 studies presented data for EMG on 7004 patients. Overall, the pooled sensitivity for EMG was 48.3% (95% CI 31.4-65.6, Heterogeneity I2 = 54, τ2 = 1.27, P < .01) (Figure 8), while the pooled specificity was 92.9% (95% CI 84.4-96.9, Heterogeneity I2 = 97, τ2 = 3.1, P < .01) (Figure 9). The AUC was .773 and the DOR was 11.2 (95% CI 4.84-25.97) (Figure 10). Forest plot for sensitivity of EMG. Forest plot for specificity of EMG. Overall sROC plot for EMG.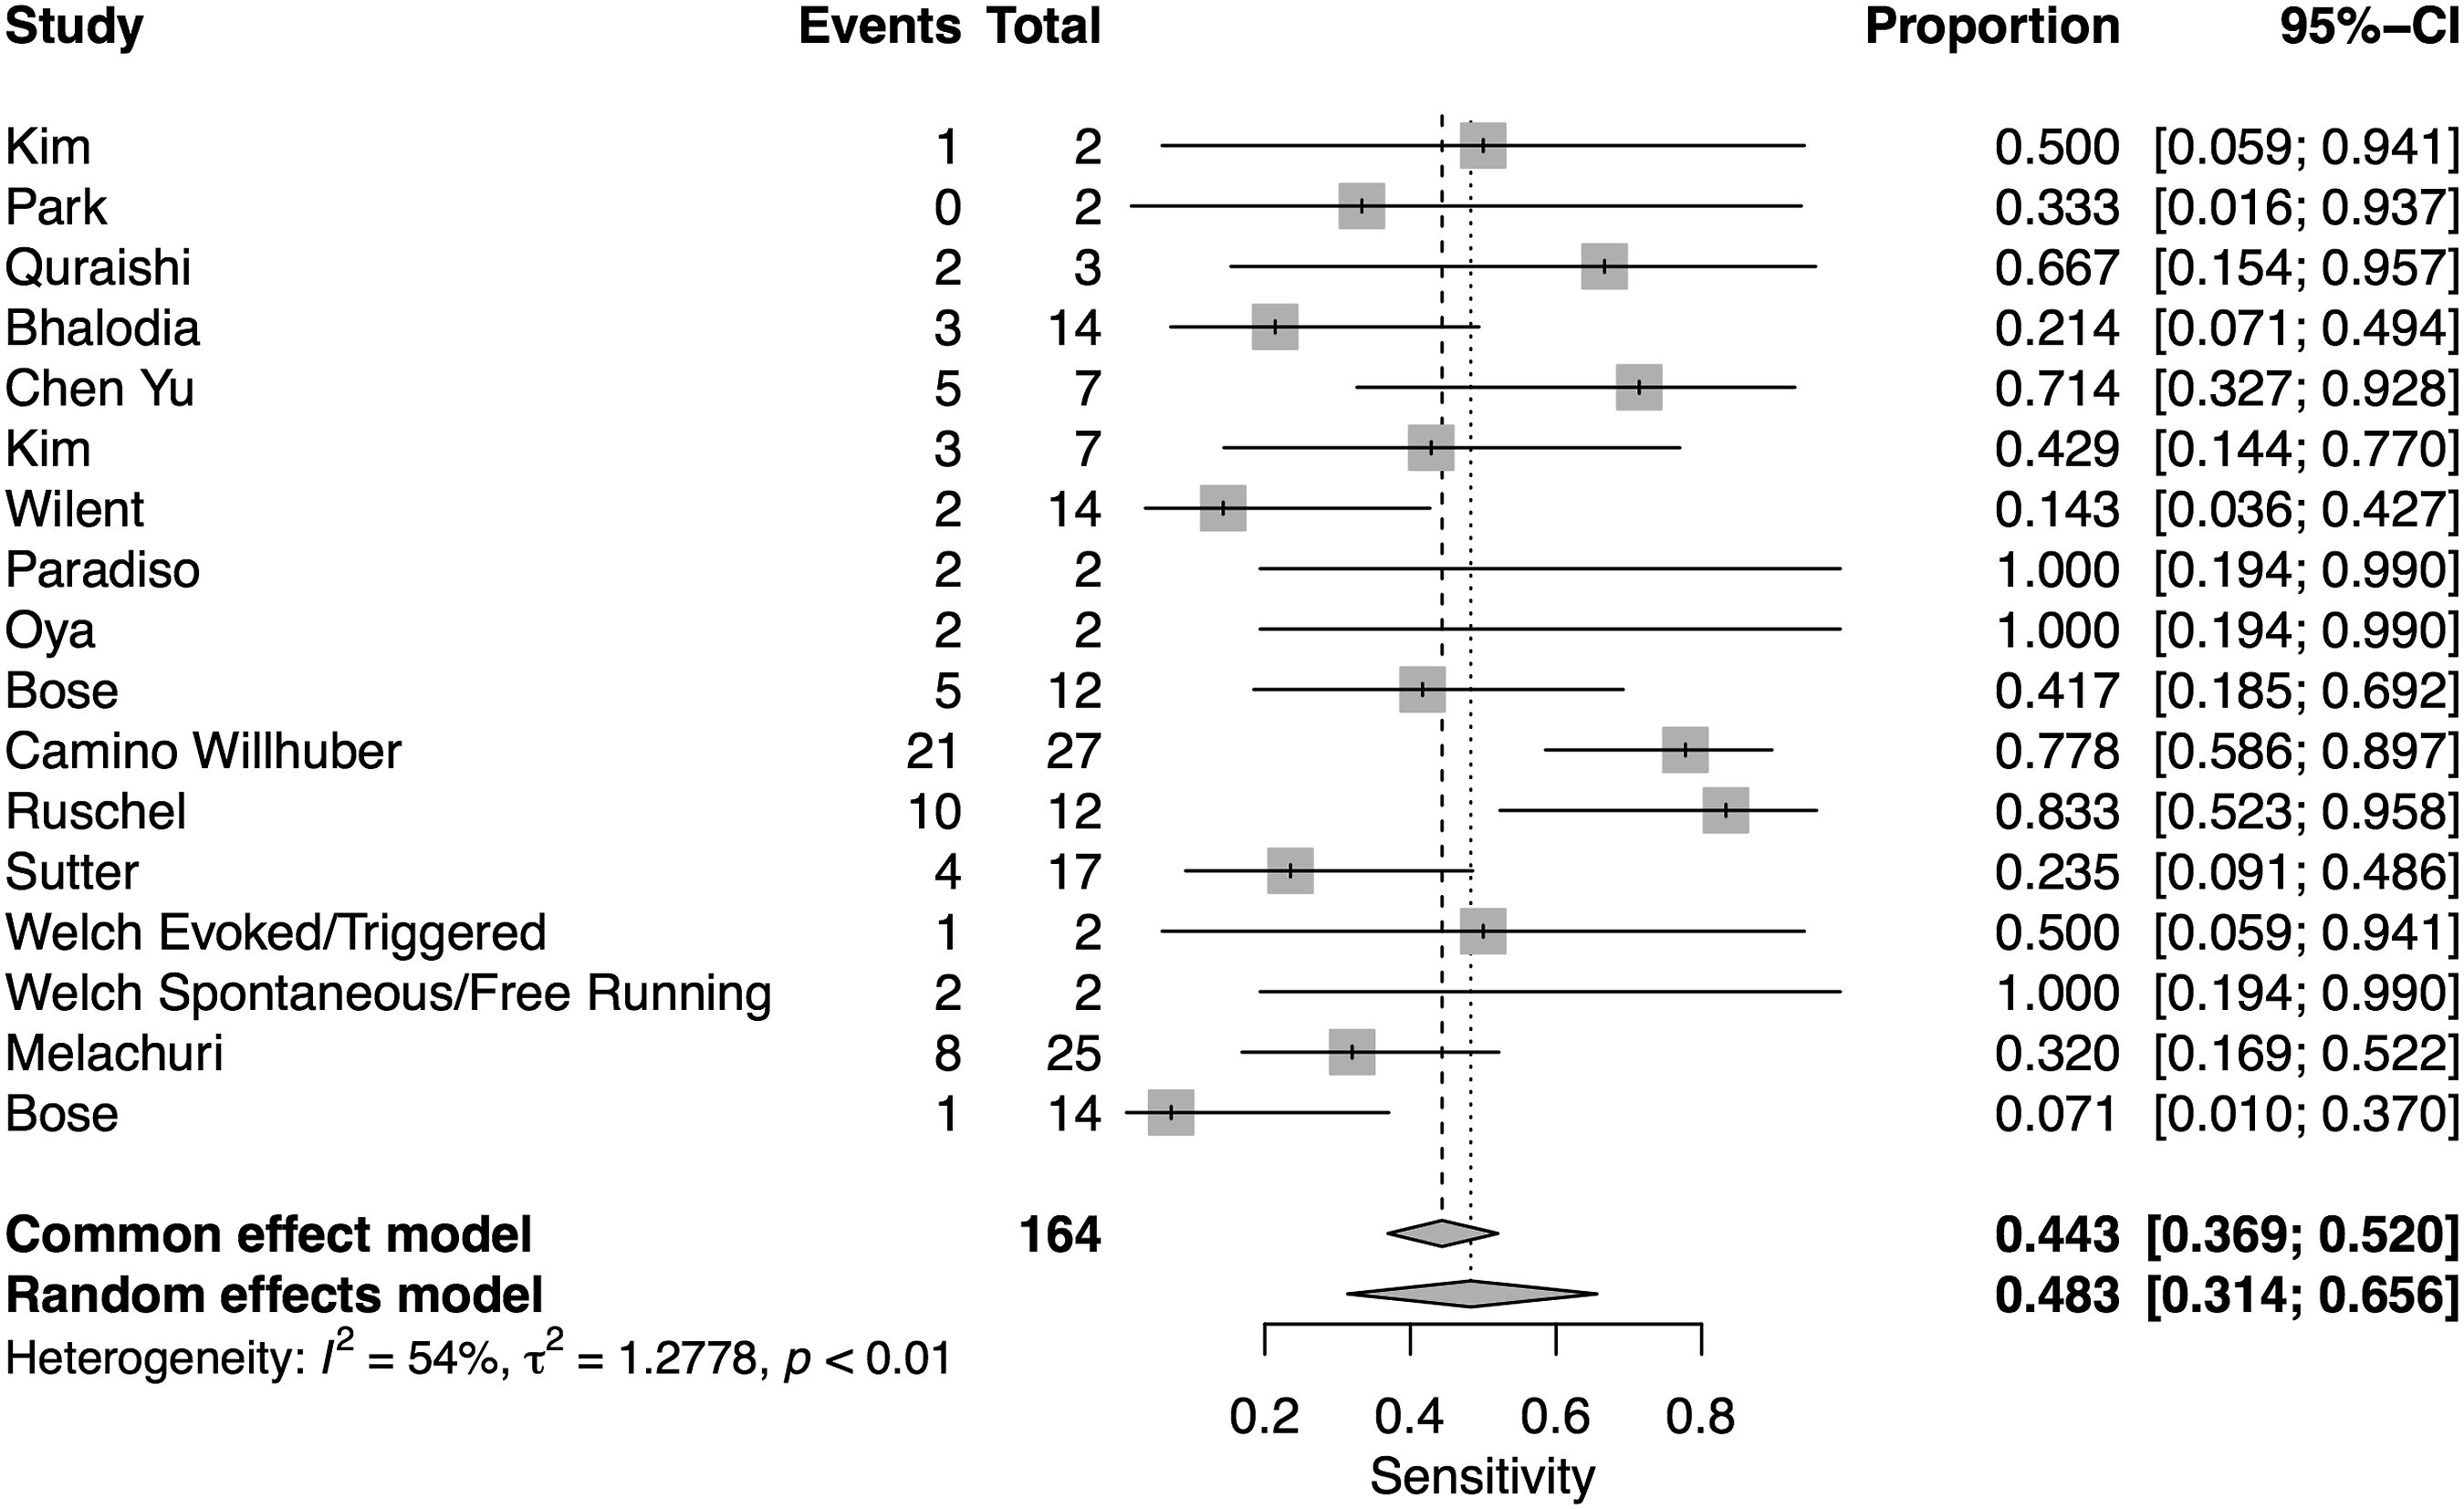
We also performed subgroup analysis for type of EMG, different reported disease groups, and different regions. 1. Type of EMG
Eleven studies reported on free-running or spontaneous EMG, 2 studies reported on evoked/triggered/stimulated EMG, and 4 studies reported on combined free-running and triggered EMG. The pooled sensitivity for free-running EMG was 54.6% (95% CI 33.8-74, Heterogeneity: I2 = 55%, τ2 = 1.13, P = .02), for evoked/triggered/stimulated EMG it was 33.3% (95% CI 31.4-65.6, Heterogeneity: I2 = 0%, τ2 = 0, P = .61), and for combined free-running and triggered EMG it was 40.7% (95% CI 9.4-82, Heterogeneity: I2 = 60%, τ2 = 2.5, P = .06) (Supplemental Figure 7(a)).
The pooled specificity for free-running EMG was 91.9% (95% CI 82.4-96.5, Heterogeneity: I2 = 98%, τ2 = 1.98, P < .01), for evoked/triggered/stimulated EMG it was 91.7% (95% CI 90-93.2, Heterogeneity: I2 = 0%, τ2 = 0, P = .75), and for combined free-running and triggered EMG it was 96.4% (95% CI 48.2-99, Heterogeneity: I2 = 97%, τ2 = 10.01, P < .01) (Supplemental Figure 7(b)).
The AUC for free-running was .773, for triggered EMG it was .873, and for combined free-running and triggered EMG it was .792 (Supplemental Figure 7(c)). 2. Disease Group
Three studies reported data on EMG for deformity surgery, 5 studies reported data for degenerative diseases and 5 studies reported data for surgery of mixed pathologies. One study each reported data for EMG for detethering, tumor and unspecified. The pooled sensitivity for EMG for deformity studies was found to be 30.2% (95% CI 14.7-52.1, Heterogeneity: I2 = 0%, τ2 = 0, P = .38), for degenerative studies it was found to be 76.2% (95% CI 61.1-86.7, Heterogeneity: I2 = 0%, τ2 = 0, P = .93), while for mixed pathology studies it was found to be 29.2% (95% CI 19.9-40.6, Heterogeneity: I2 = 0%, τ2 = 0, P = .50) (Supplemental Figure 8(a)).
The pooled specificity for EMG for deformity studies was found to be 94.7% (95% CI 64.1-99.4, Heterogeneity: I2 = 95%, τ2 = 3.73, P < .01), for degenerative studies it was found to be 97.3% (95% CI 95.6-98.3, Heterogeneity: I2 = 40%, τ2 = .36, P = .75), while for mixed pathology studies it was found to be 88.6% (95% CI 77.6-94.6, Heterogeneity: I2 = 99%, τ2 = .83, P < .01) (Supplemental Figure 8(b)).
The AUC for deformity was found to be .659, for degenerative it was found to be .888, while for various diseases it was found to be .552 (Supplemental Figure 8(c)). 3. Regions
Eight studies provided data for EMG for lumbosacral surgery, 5 studies provided data for cervicothoracic surgery, 2 studies provided data for EMG for surgery for any region, and one study provided data for EMG for cervical spine surgery.
The pooled sensitivity for lumbosacral surgery was 49.6% (95% CI 26.6-72.8, Heterogeneity: I2 = 63%, τ2 = 1.41, P < .01), for cervicothoracic surgery it was 36.1% (95% CI 16-62.7, Heterogeneity: I2 = 0%, τ2 = .3, P < .01) and for surgery for any region it was 80% (95% CI 53-93.4, Heterogeneity: I2 = 0%, τ2 = 0, P < .01) (Supplemental Figure 9(a)).
The pooled specificity for lumbosacral surgery was 94.7% (95% CI 78.6-98.8, Heterogeneity: I2 = 97%, τ2 = 5.1, P < .01), for cervicothoracic surgery it was 94.9% (95% CI 89.9-97.5, Heterogeneity: I2 = 91%, τ2 = .50, P < .01) and for surgery for any region it was 64.5% (95% CI 55.6-72.5, Heterogeneity: I2 = 0%, τ2 = 0, P < .01) (Supplemental Figure 9(b)).
The AUC values for lumbosacral surgery, cervicothoracic surgery and for surgery for any region were .738, .492 and .655, respectively (Supplemental Figure 9(c)).
Multimodal
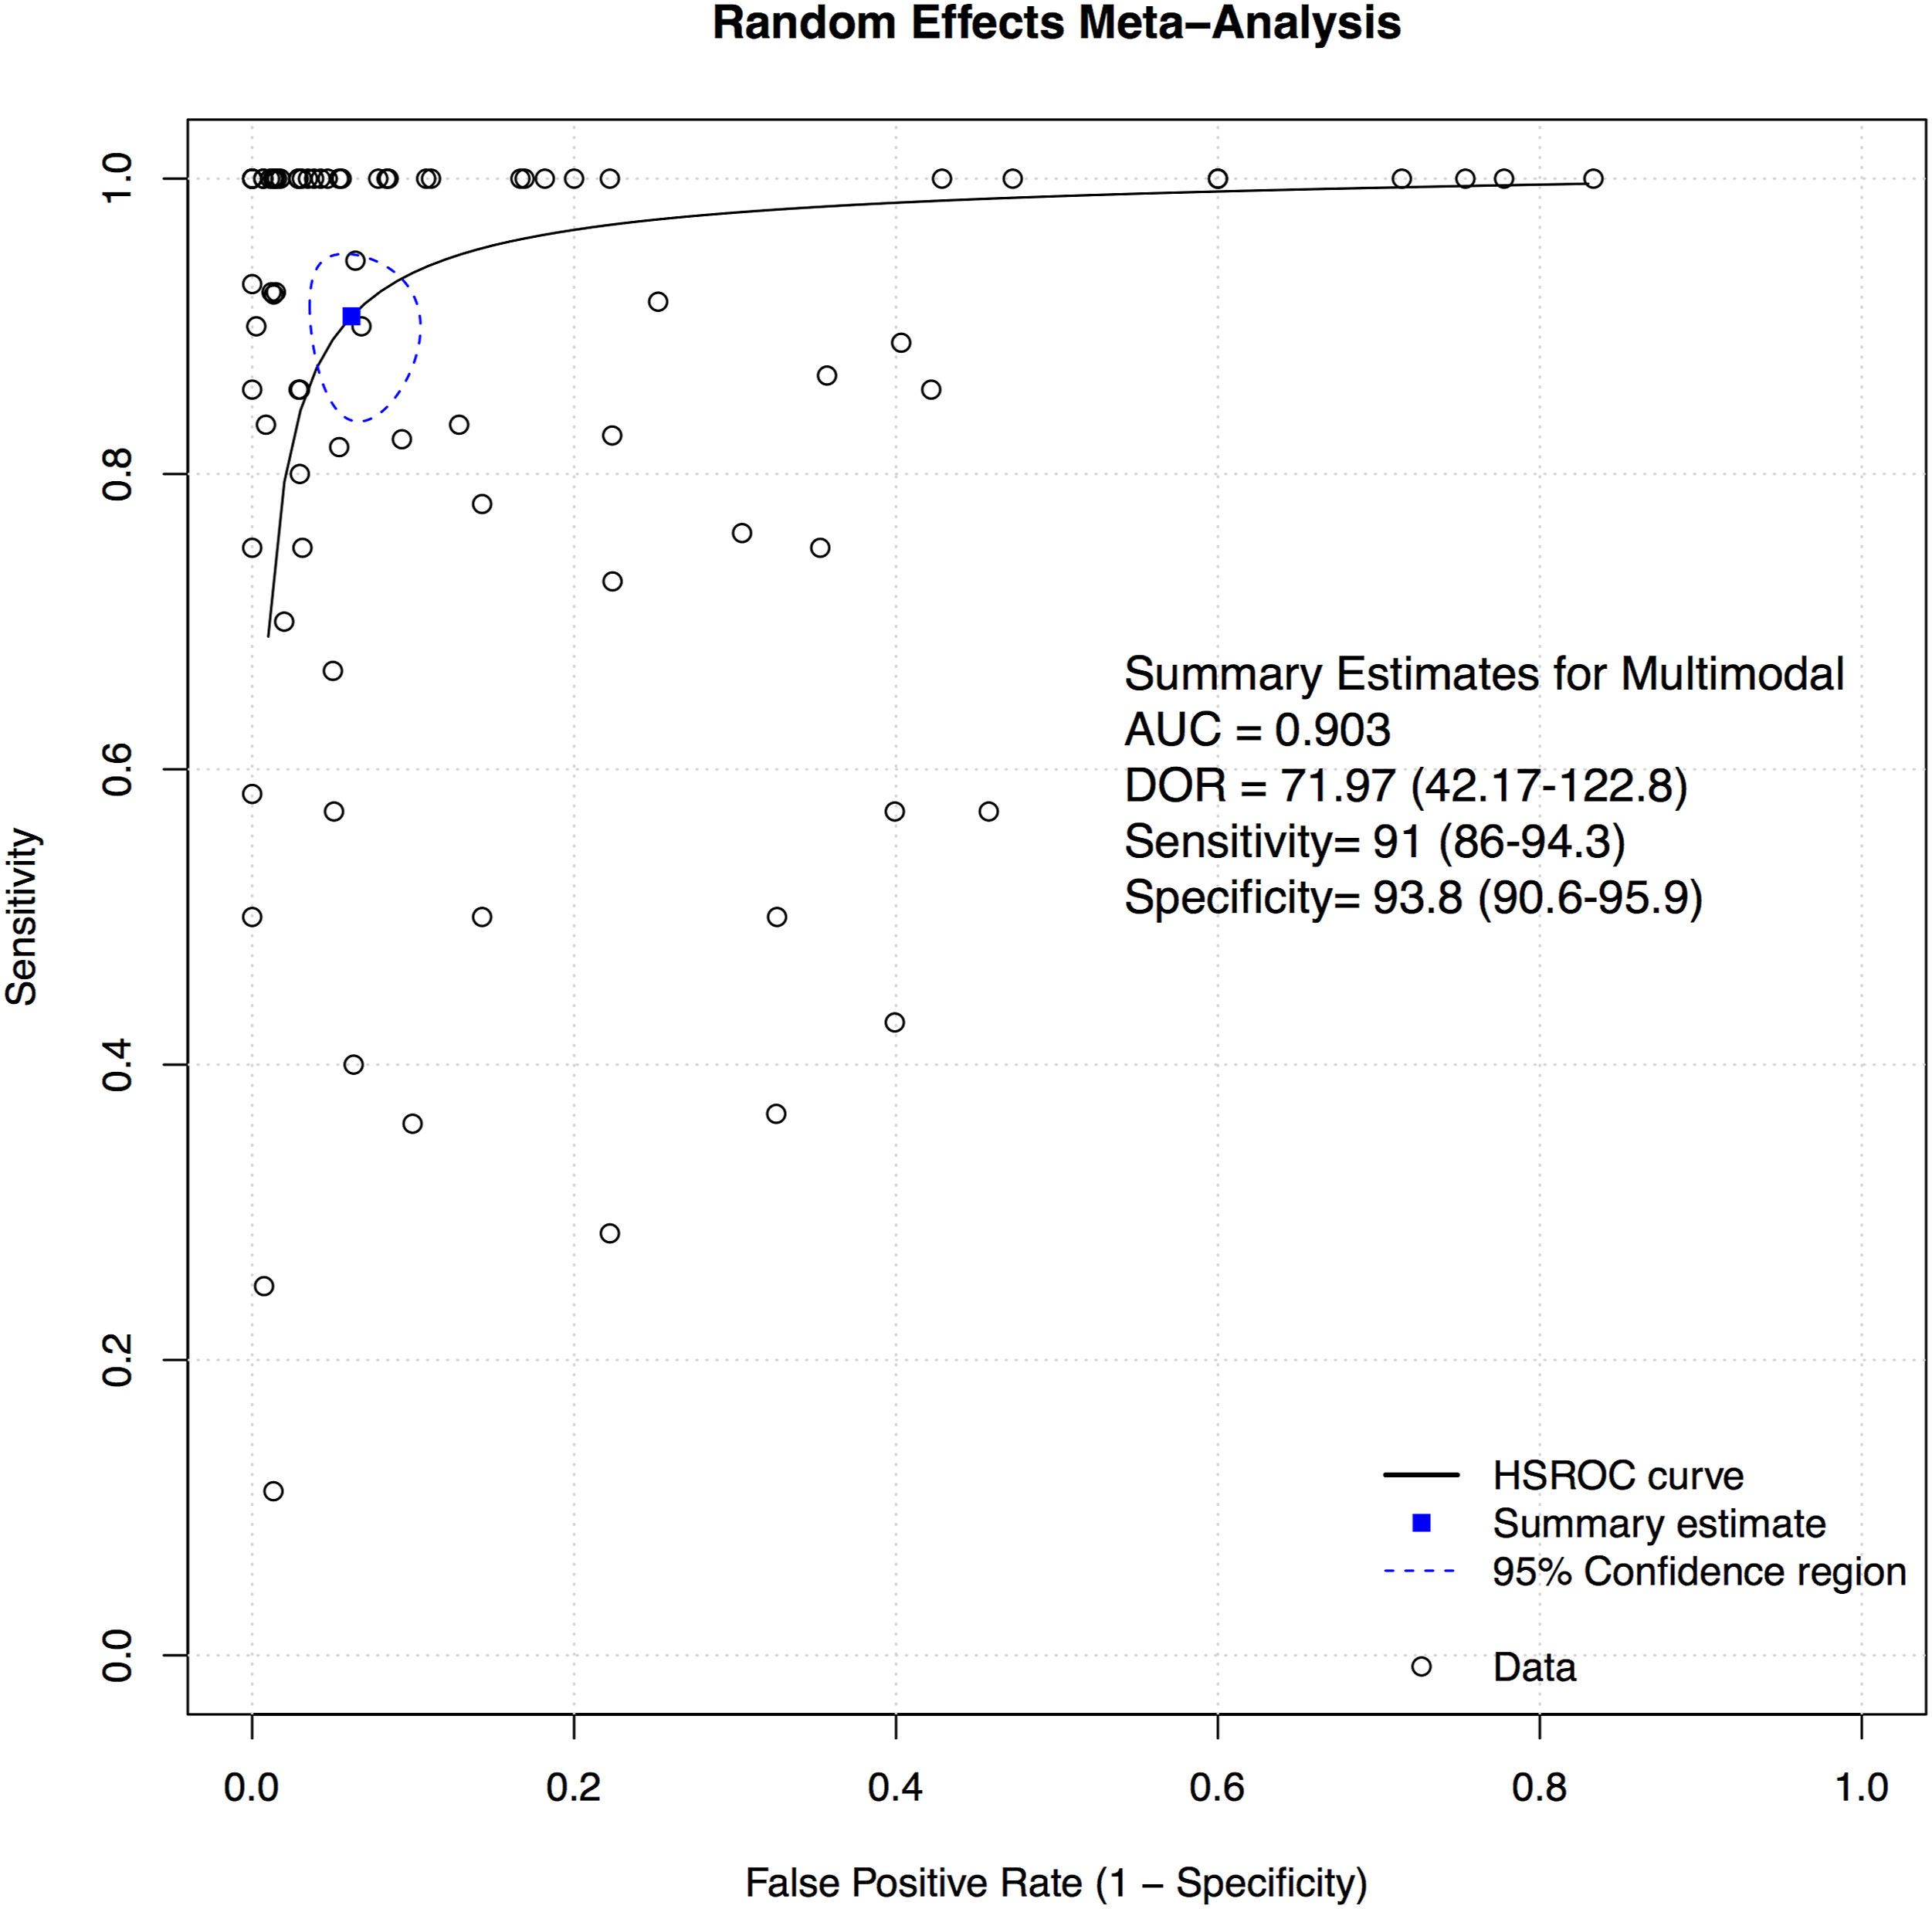
A total of 69 studies presented data for multimodal neuromonitoring on 58,325 patients. Overall, the sensitivity of multimodal neuromonitoring was 91% (95% CI 86%–94.3%) (Figure 11), while the pooled specificity was 93.8% (95% CI 90.6%–95.9%) (Figure 12). The AUC value was .903 while the DOR was 71.97 (95% CI 42.17-122.8) (Figure 13). Forest plot for sensitivity of Multimodal Neuromonitoring. Forest plot for specificity of Multimodal Neuromonitoring. Overall sROC plot for Multimodal Neuromonitoring.
We also performed subgroup analyses based on type of multimodal neuromonitoring, disease subset, and region of surgery. 1. Type of Multimodal Neuromonitoring.
A total of 33 studies presented data for combined SSEP and MEP, 27 studies for combined SSEP, MEP and EMG, 6 studies for combined SSEP, MEP and D-wave, 4 studies for combined MEP and EMG, 3 studies for combined MEP and D-wave, 2 studies for combined SSEP and EMG, and one study for combined SSEP and D-wave. The pooled sensitivity for SSEP and MEP was 93.5% (95% CI 83.1-97.7, Heterogeneity: 0%, τ2 = 3.8, P = .65), for combined SSEP, MEP and EMG it was 87.7% (95% CI 80-92.7, Heterogeneity: 18%, τ2 = 1.22, P = .19), for combined SSEP, MEP and D-wave it was 90.2% (95% CI 63.5-98, Heterogeneity: 63%, τ2 = 2.68, P = .01), for combined MEP and EMG it was 92.3% (95% CI 53.8-99.2, Heterogeneity: 0%, τ2 = 2.06, P = .65), for combined MEP and D-wave it was 90.4% (95% CI 86-94.3, Heterogeneity: 0%, τ2 = 0, P = .81), and for SSEP and EMG it was 90.7% (95% CI 3.6-100, Heterogeneity: 0%, τ2 = 9.91, P = .99) (Supplemental Figure 10(a)).
The pooled specificity for SSEP and MEP was 95.3% (95% CI 90.7-97.7, Heterogeneity: 95%, τ2 = 4.11, P < .01), for combined SSEP, MEP and EMG it was 94.3% (95% CI 88.7-97.2, Heterogeneity: 96%, τ2 = 4.27, P < .01), for combined SSEP, MEP and D-wave it was 93.1% (95% CI 83.6-97.3, Heterogeneity: 90%, τ2 = 1.48, P < .01), for combined MEP and EMG it was 77.2% (95% CI 40-94.5, Heterogeneity: 91%, τ2 = 2.35, P = .65), for combined MEP and D-wave it was 99.2% (95% CI 98.9-99.4, Heterogeneity: 77%, τ2 = 0, P = .01), and for SSEP and EMG it was 63.3% (95% CI 14.6-94.5, Heterogeneity: 100%, τ2 = 2.75, P < .01) (Supplemental Figure 10(b)).
The AUC values for combined SSEP and MEP was found to be .908; .881 for combined SSEP, MEP and EMG; .938 for SSEP, MEP and D-wave, and .848 for MEP and EMG (Supplemental Figure 10(c)). 2. Disease Group
A total of 23 studies presented data for multimodal neuromonitoring for deformity surgery, 17 studies for spinal tumors, 16 studies for various disease groups, 12 studies for degenerative, and 1 study for trauma.
The pooled sensitivity for multimodal neuromonitoring for deformity was 98.8% (95% CI 88.9-99.9, Heterogeneity: I2 = 0%, τ2 = 7.92, P = .51), for degenerative disease it was 74.7% (95% CI 62.3-84, Heterogeneity: I2 = 0%, τ2 = .35, P = .84), for mixed pathology it was 95.6% (95% CI 84.1-98.9, Heterogeneity: I2 = 68%, τ2 = 4.94, P < .01), and for tumor it was 83.9% (95% CI 75.6-89.8, Heterogeneity: I2 = 31%, τ2 = .66, P = .08) (Supplemental Figure 11(a)).
The pooled specificity for multimodal neuromonitoring for deformity was 96% (95% CI 91.4-98.2, Heterogeneity: I2 = 95%, τ2 = 3.78, P < .01) for degenerative disease it was 95.2% (95% CI 86.7-98.3, Heterogeneity: I2 = 96%, τ2 = 4.50, P < .01), for mixed pathology it was f 95.8% (95% CI 90.8-98.1, Heterogeneity: I2 = 98%, τ2 = 3.27, P < .01), and for tumor it was 88.6% (95% CI 77.1-94.7, Heterogeneity: 84%, τ2 = 3.49, P < .01) (Supplemental Figure 11(b)).
The AUC for deformity was .946, for degenerativ disease it was .787, for mixed pathology it was .958, and for tumor it was .844 (Supplemental Figure 11(c)). 3. Regions
Six studies provided data for multimodal neuromonitoring for lumbosacral surgery, 3 studies for cervicothoracic surgery, 37 studies for surgery for any region, 10 studies for cervical spine surgery, 11 studies for thoracolumbar surgery, and 2 studies for thoracic spine surgery.
The pooled sensitivity for lumbosacral surgery was 76.2% (95% CI 54.4-89.6, Heterogeneity: I2 = 32%, τ2 = 1.35, P = .15), for cervicothoracic surgery it was 98.4% (95% CI 6.4-100, Heterogeneity: I2 = 0%, τ2 = 13.02, P = .99), for surgery for any region it was 92.5% (95% CI 86.9-95.8, Heterogeneity: I2 = 41%, τ2 = 1.92, P < .01), for cervical spine surgery it was 81.2% (95% CI 54-94.1, Heterogeneity: 27%, τ2 = 2.4, P = .19), for thoracolumbar surgery it was 96.9% (95% CI 82.6-99.5, Heterogeneity: 0%, τ2 = 1.49, P = .99), and for thoracic surgery it was 67.7% (95% CI 49.7-81.7, Heterogeneity: 0%, τ2 = 0, P = .74) (Supplemental Figure 12(a)).
The pooled specificity for lumbosacral surgery was 91.5% (95% CI 69.3-98.1, Heterogeneity: I2 = 97%, τ2 = 5.78, P < .01), for cervicothoracic surgery it was 59.5% (95% CI 33.7-81, Heterogeneity: I2 = 77%, τ2 = .84, P < .01), for surgery for any region it was 95.2% (95% CI 91.4-97.4, Heterogeneity: I2 = 97%, τ2 = 4.03, P < .01), for cervical spine surgery it was 97.6% (95% CI 94.3-99.1, Heterogeneity: 94%, τ2 = 2, P < .01), for thoracolumbar surgery it was 92.1% (95% CI 81.2-97, Heterogeneity: 96%, τ2 = 2.59, P < .01) and for thoracic surgery it was 95.2% (95% CI 92.3-97, Heterogeneity: 0%, τ2 = 0, P = .64) (Supplemental Figure 12(b)).
The AUC values for cervical surgery, cervicothoracic surgery, thoracic surgery, thoracolumbar, lumbosacral and surgery for any region were found to be .0.928, .718, .845, .89, .791 and .916, respectively (Supplemental Figure 12(c)).
Publication Bias Assessment Using Funnel Plot
Publication bias was assessed using funnel plots and modified Hong’s test proposed by Noma.
38
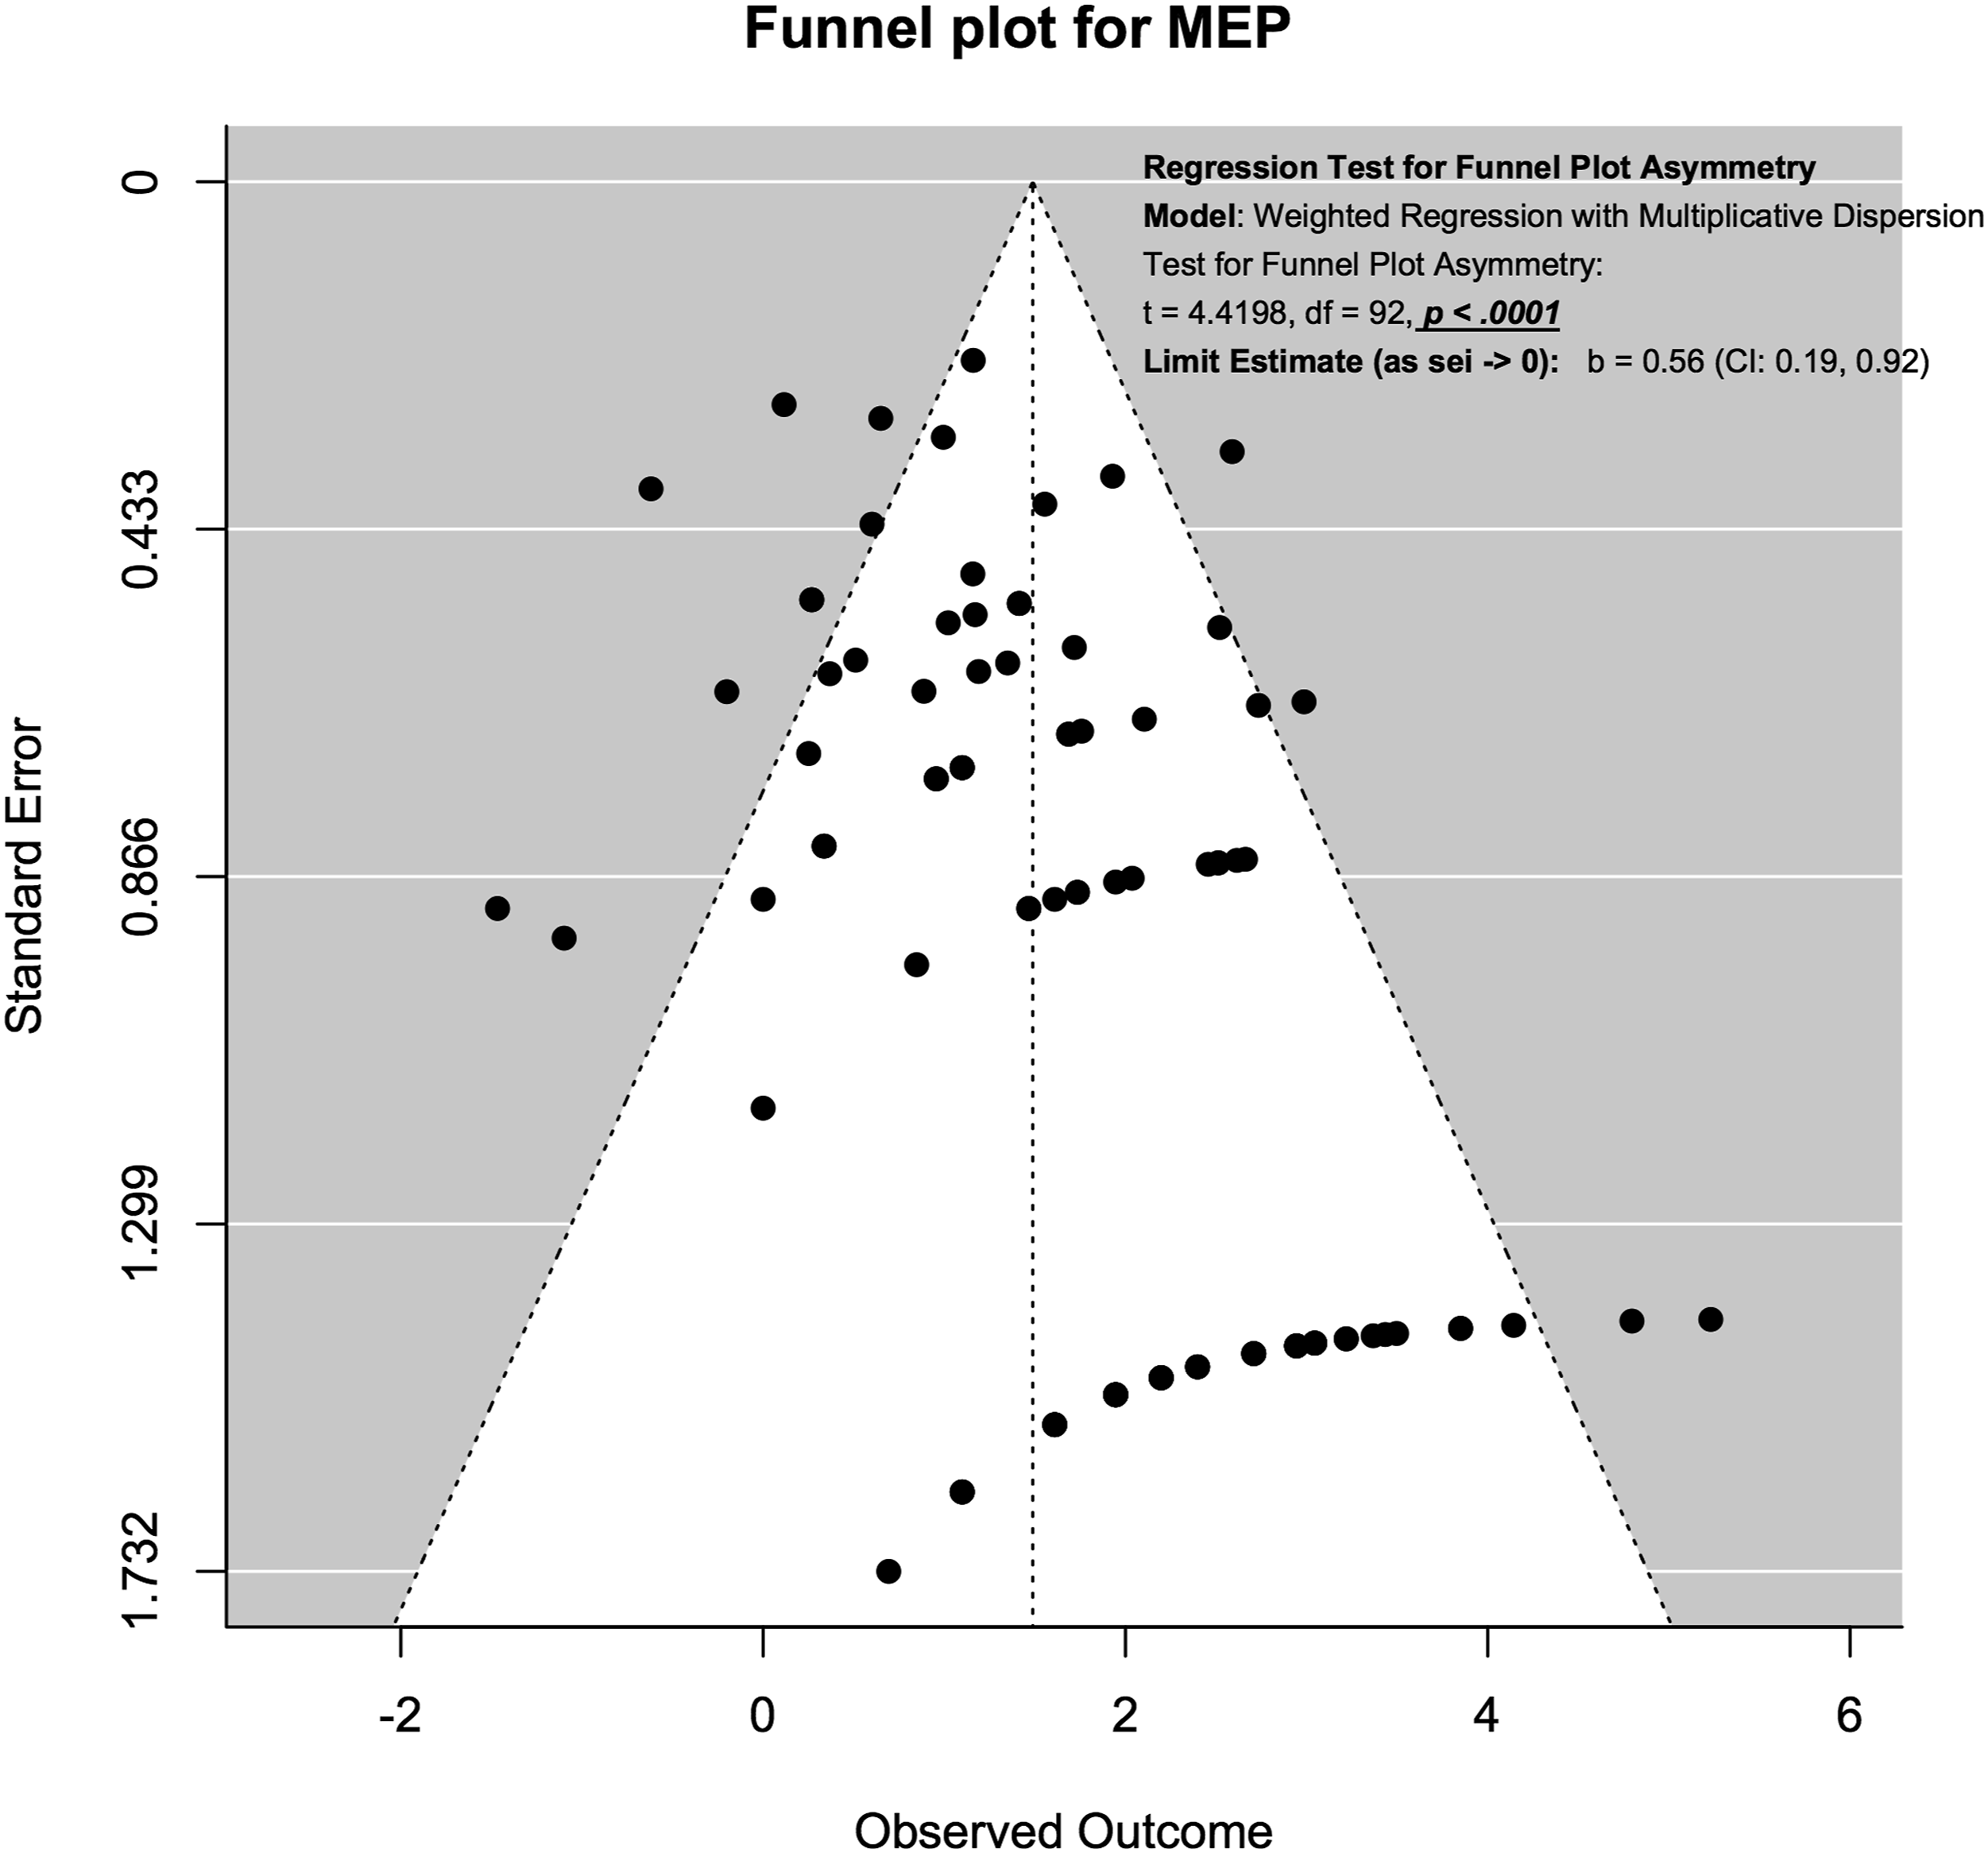
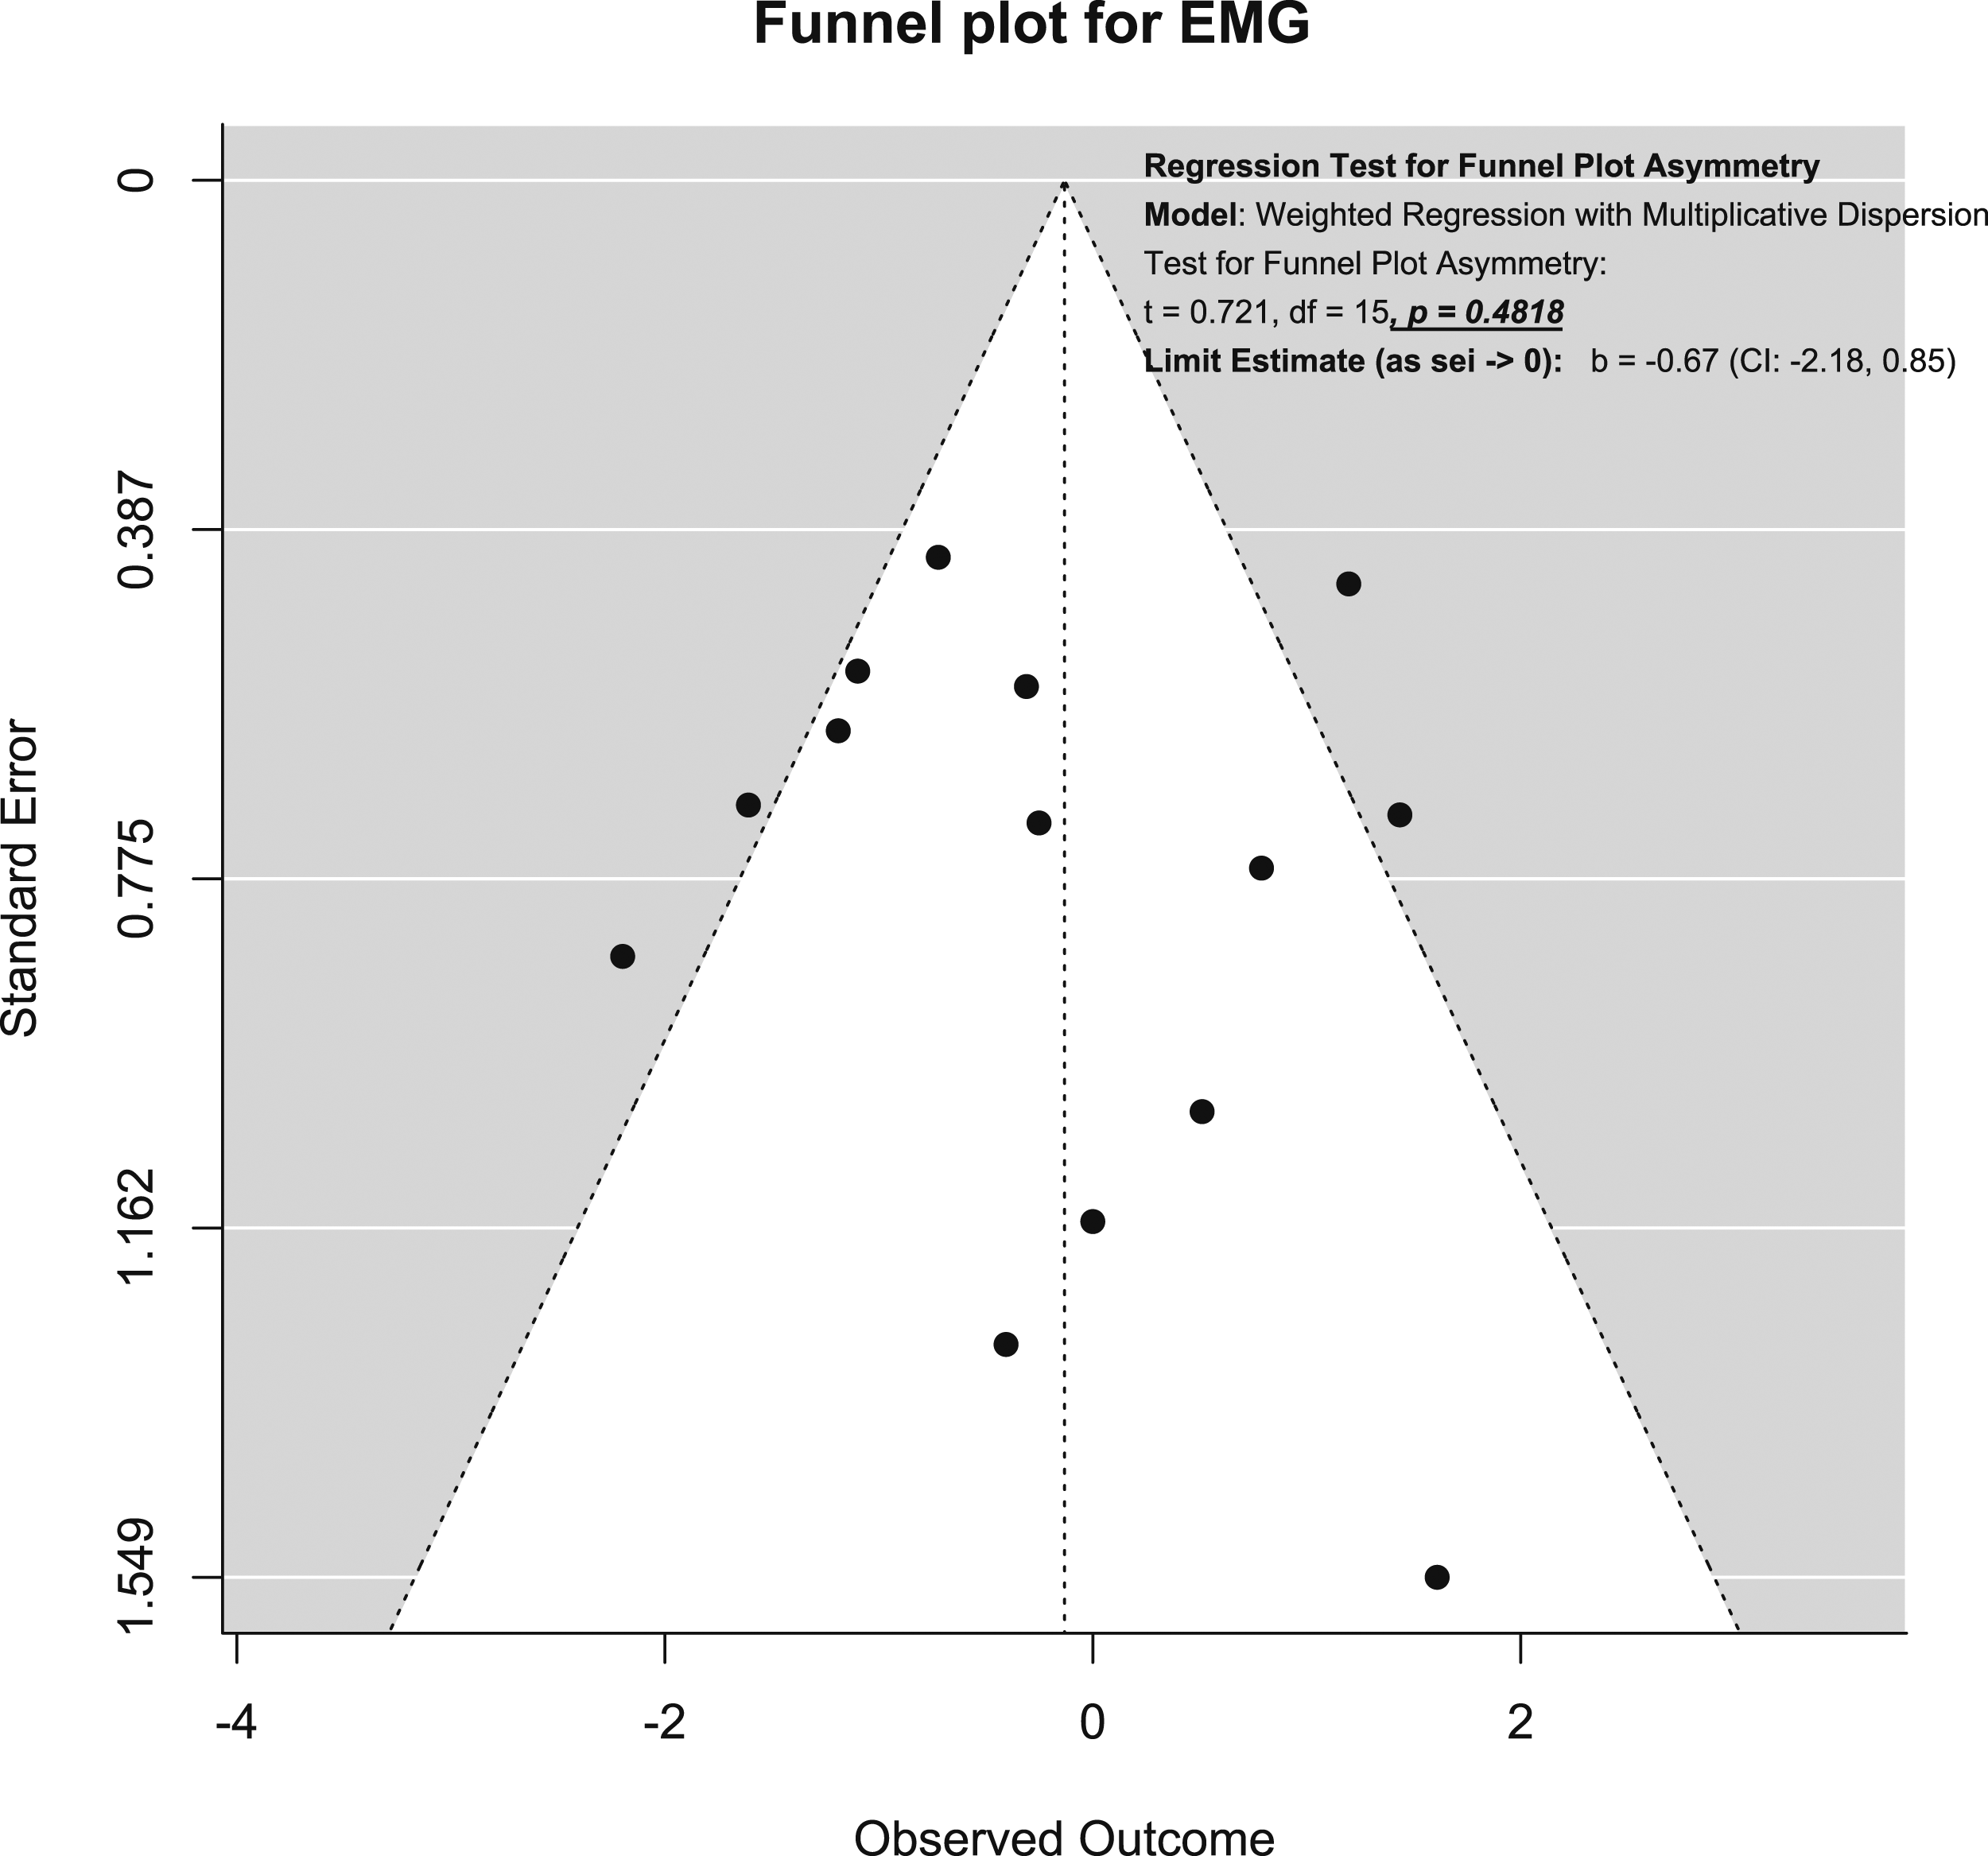
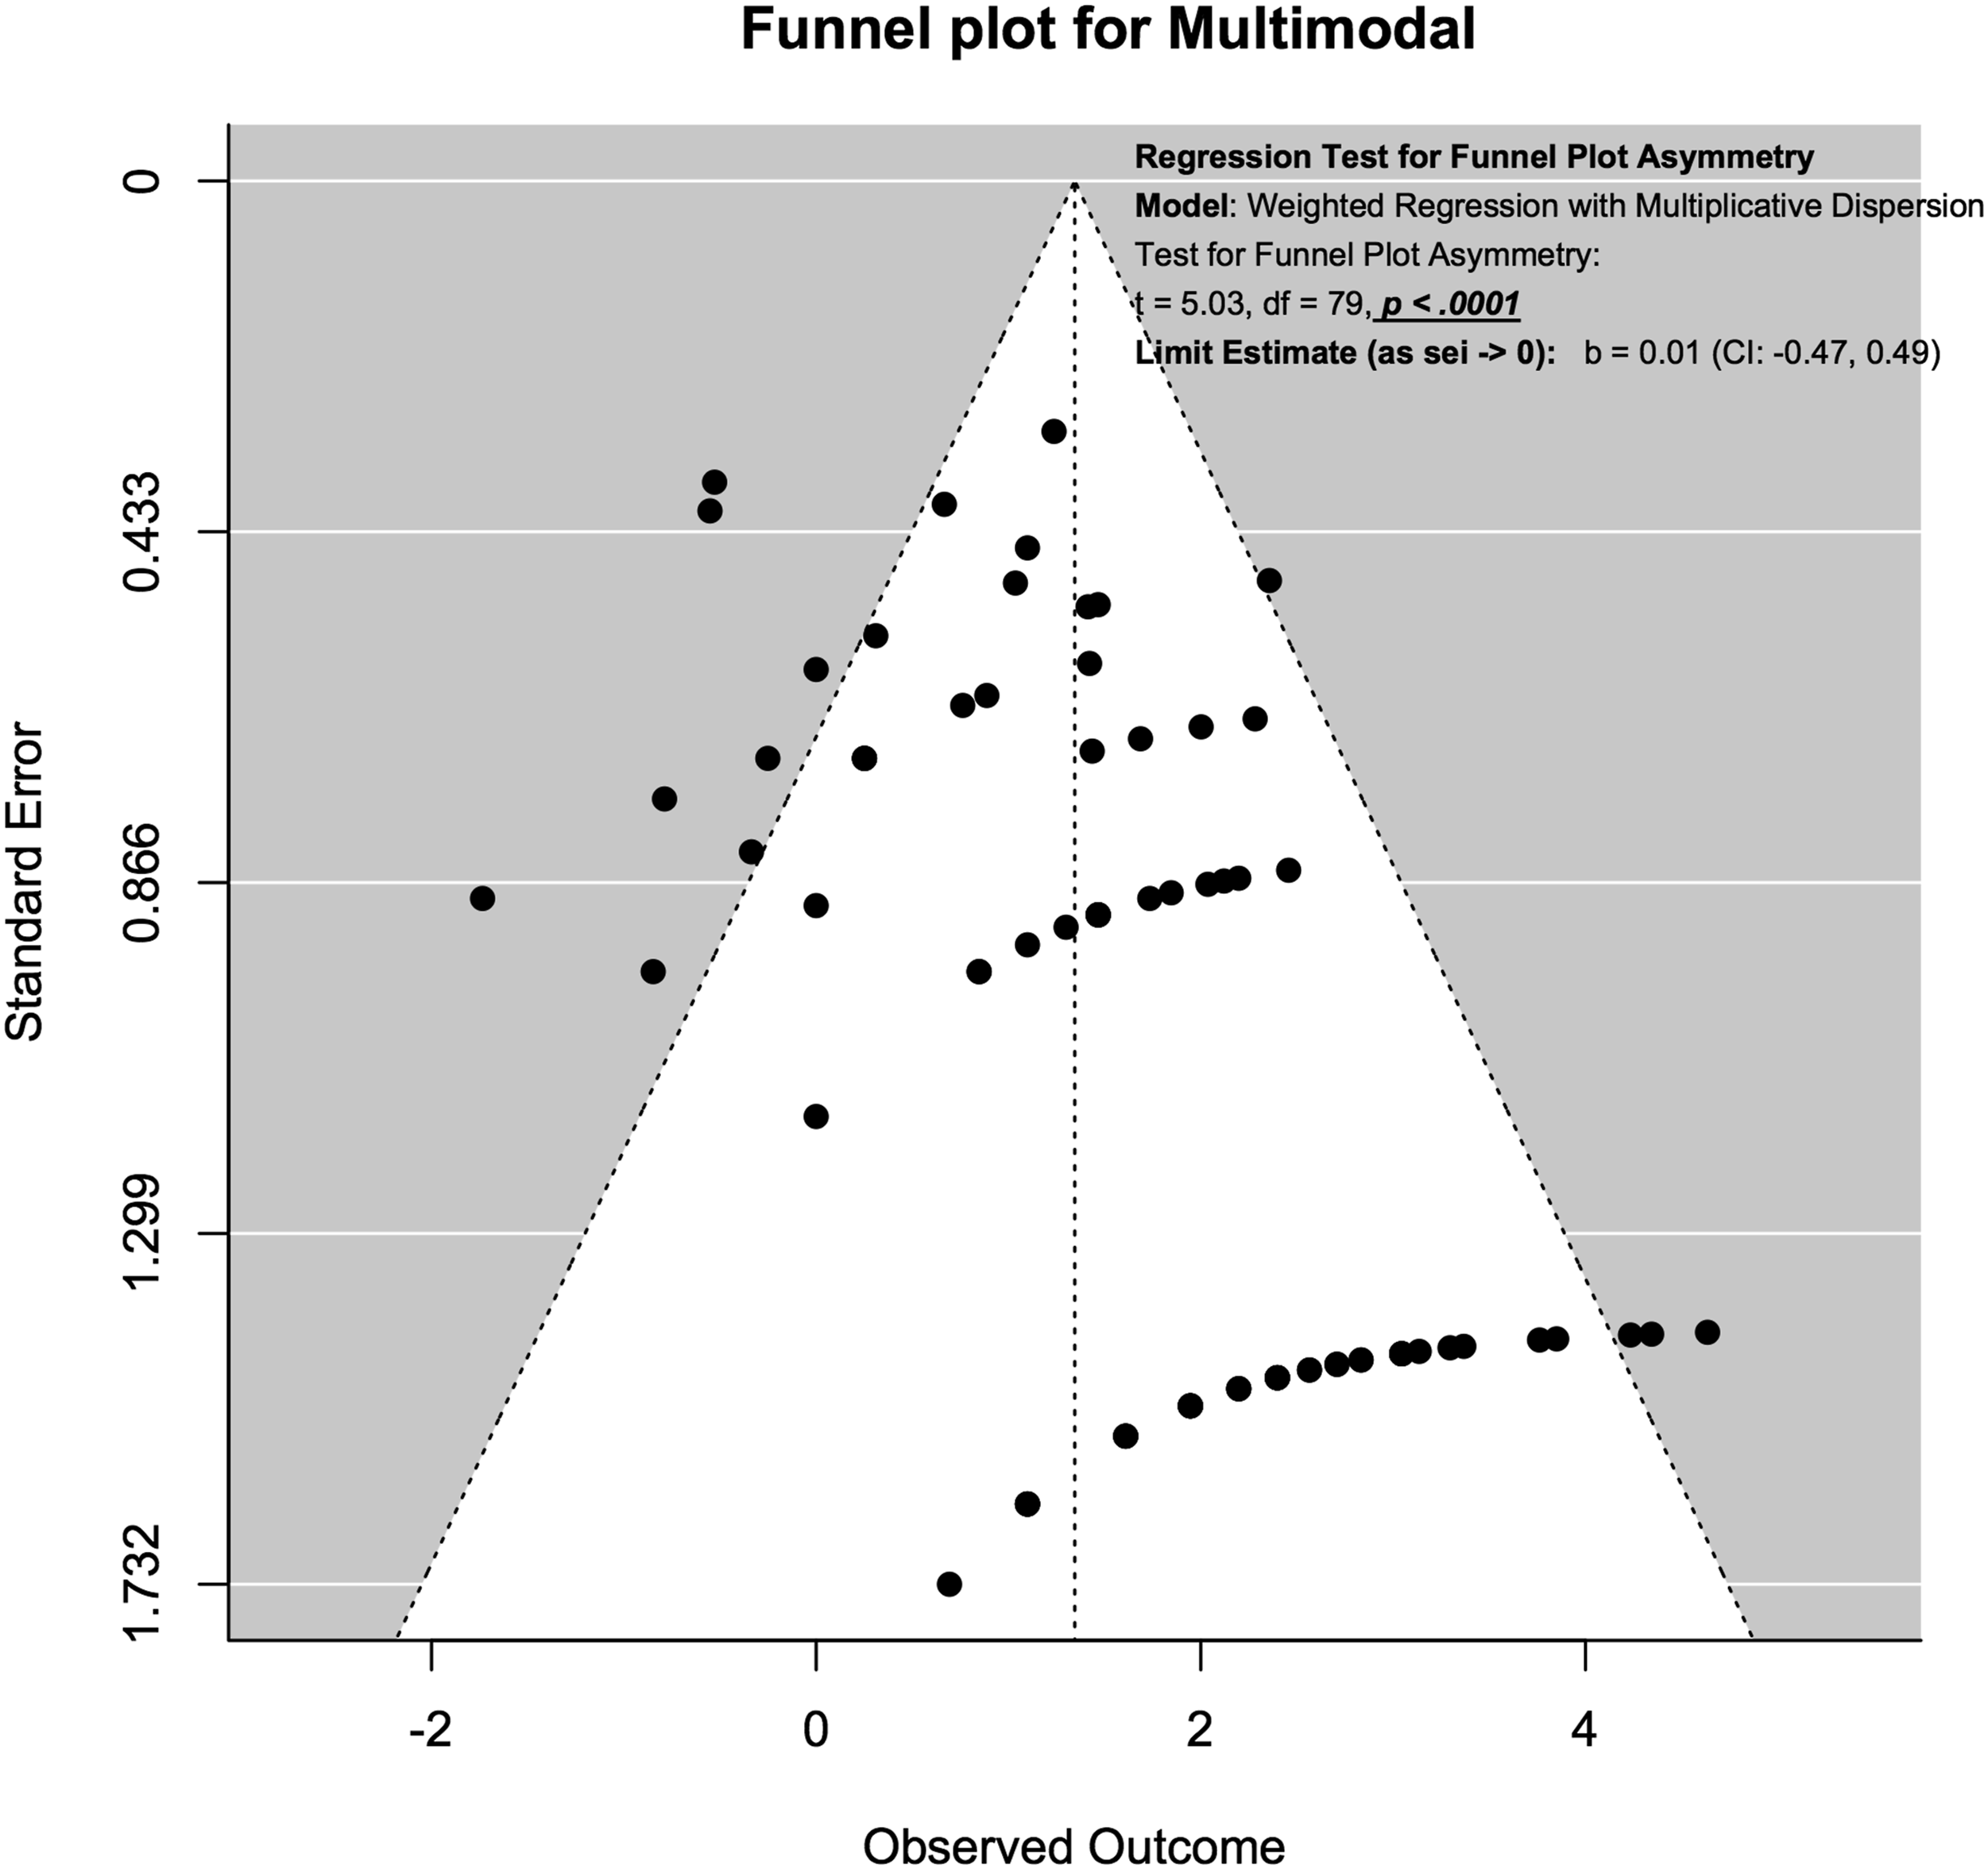
For SSEP neuromonitoring, (Figure 14), we observed slight asymmetry but the weighted regression with multiplicative dispersion test for asymmetry was not statistically significant (t = 1.61, df = 60, P = .11). For MEP neuromonitoring, (Figure 15), we observed asymmetry and the weighted regression with multiplicative dispersion test for asymmetry was statistically significant (t = 4.42, df = 92, P < .001). For multimodal neuromonitoring, (Figure 16), we observed asymmetry but the weighted regression with multiplicative dispersion test for asymmetry was not statistically significant (t = .72, df = 15, P = .48). For multimodal neuromonitoring, (Figure 17), we observed asymmetry and the weighted regression with multiplicative dispersion test for asymmetry was statistically significant (t = 5.03, df = 79, P < .001). Funnel plot for Assessment of Publication Bias for SSEP. Funnel plot for Assessment of Publication Bias for MEP. Funnel plot for Assessment of Publication Bias for EMG. Funnel plot for Assessment of Publication Bias for Multimodal Neuromonitoring.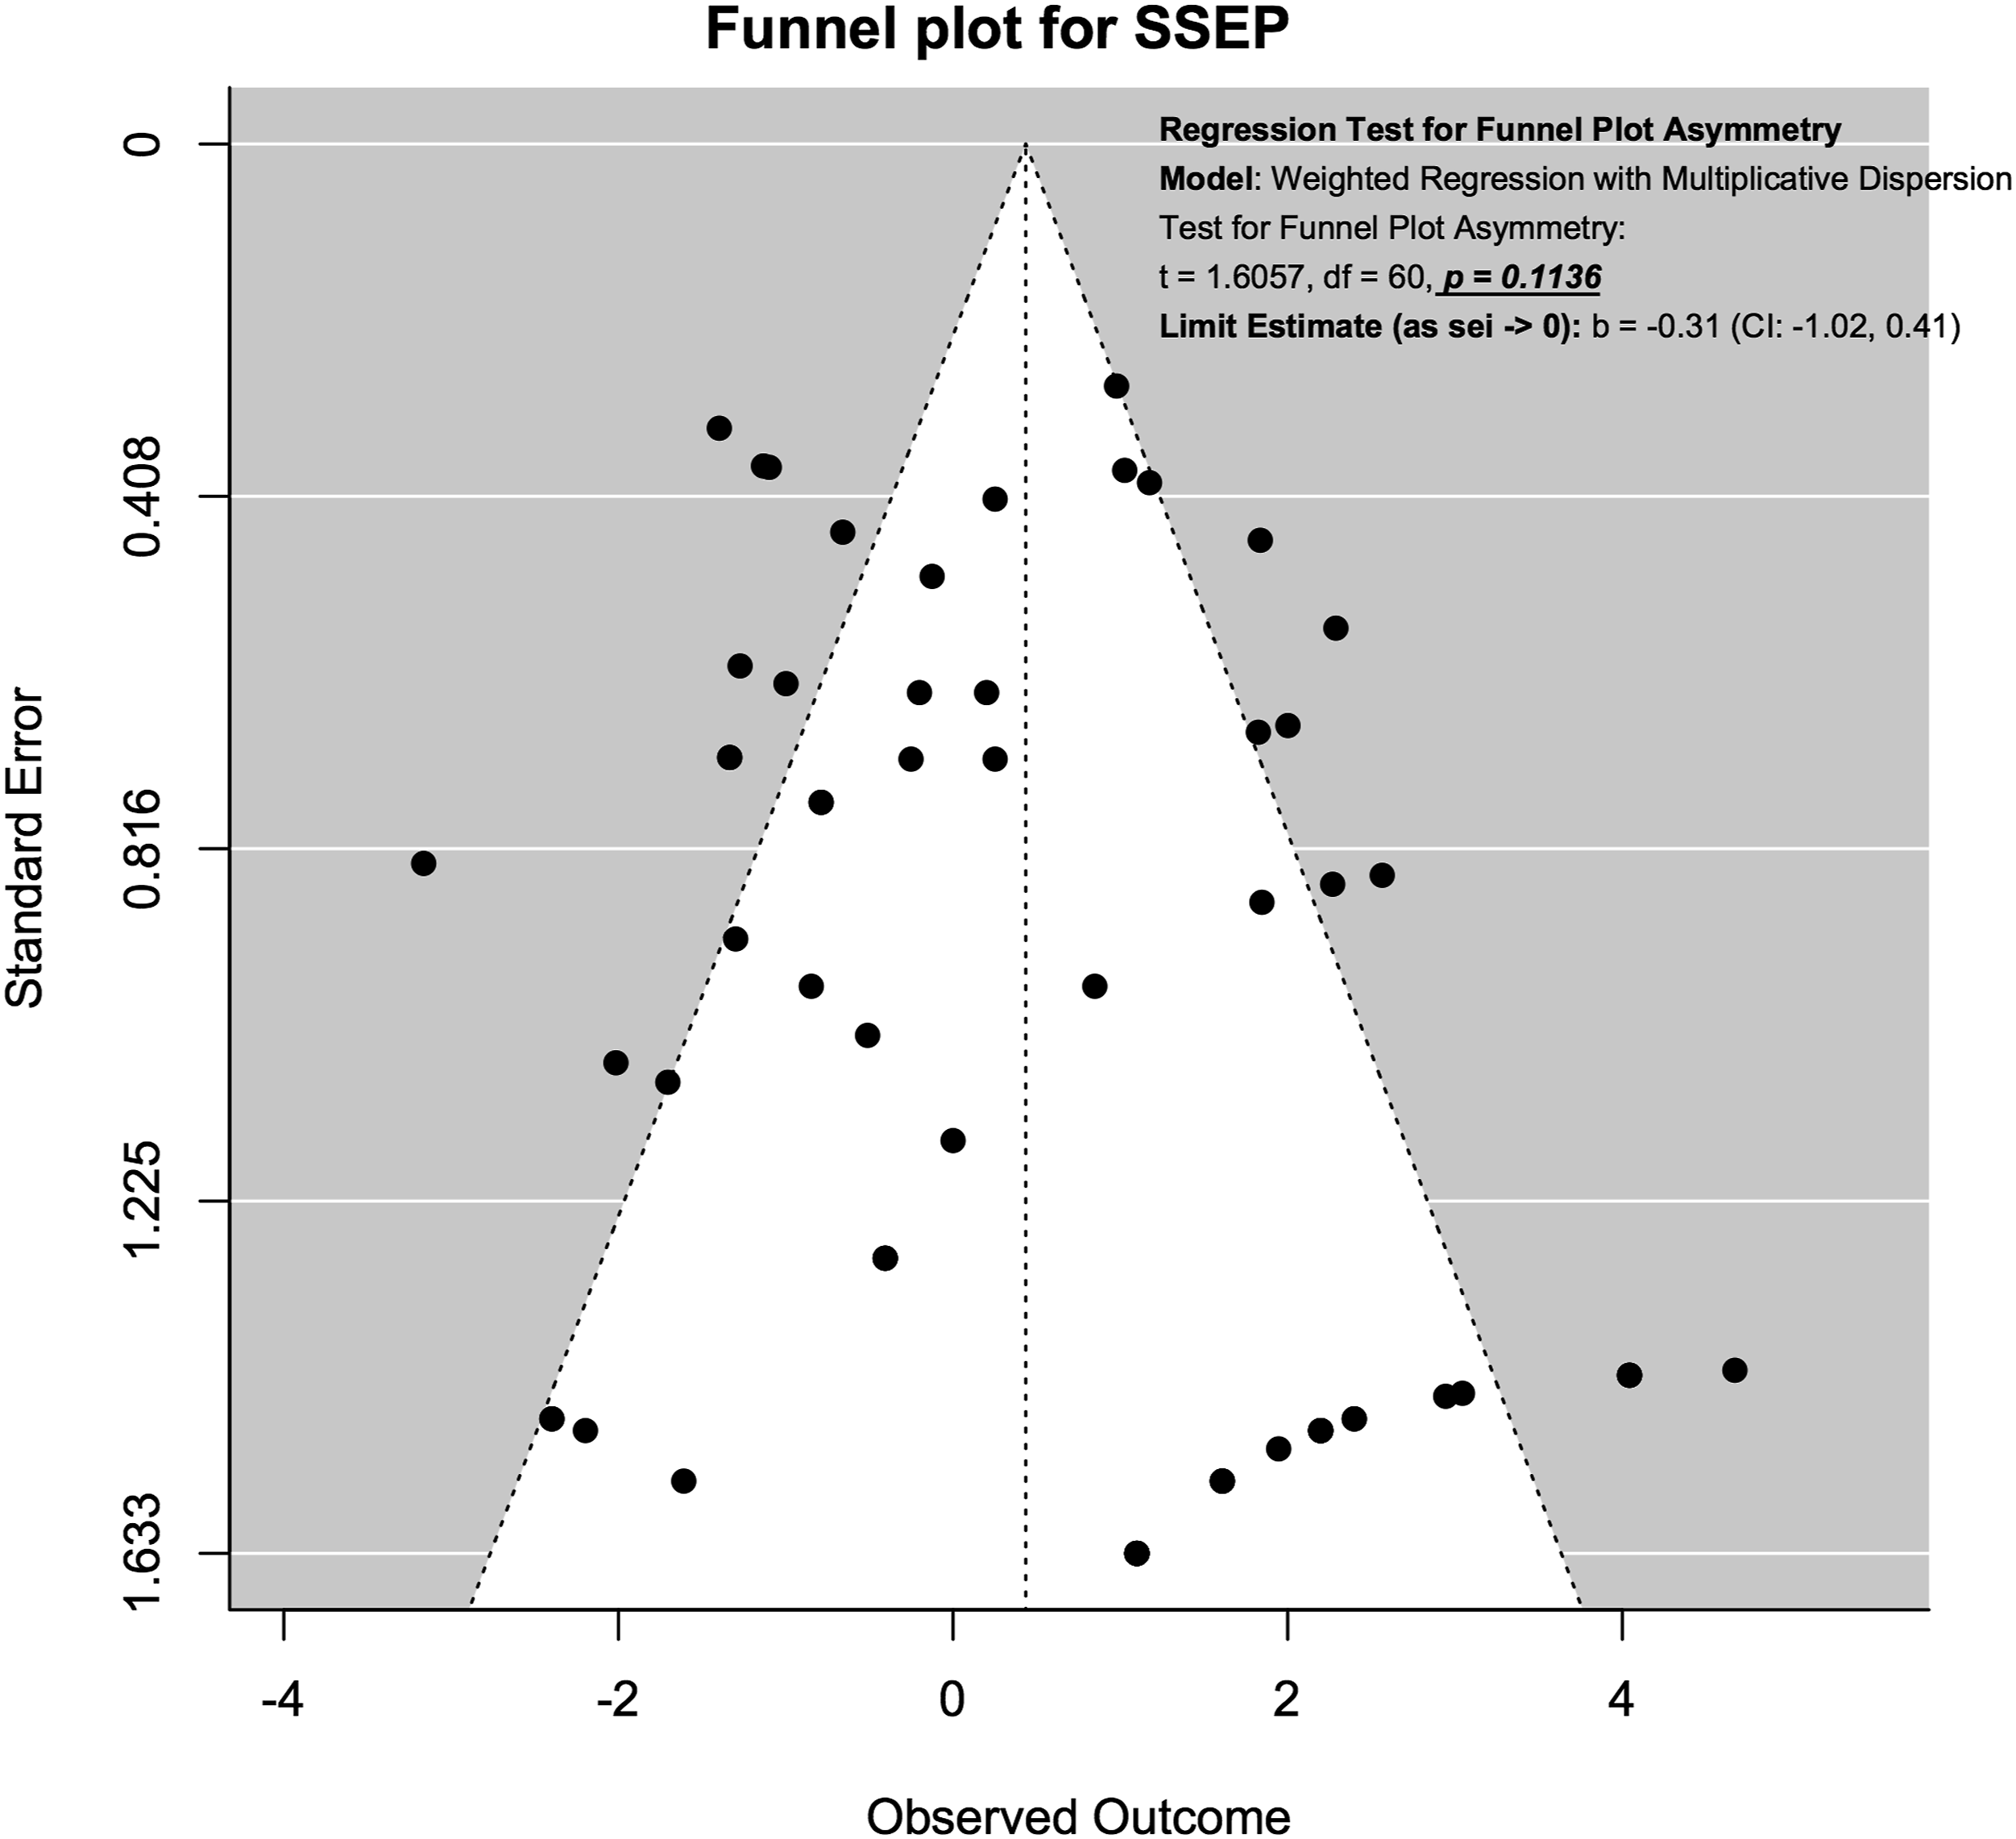
Risk of Bias Assessment Using QUADAS Tool
Risk of bias was assessed using the QUADAS tool
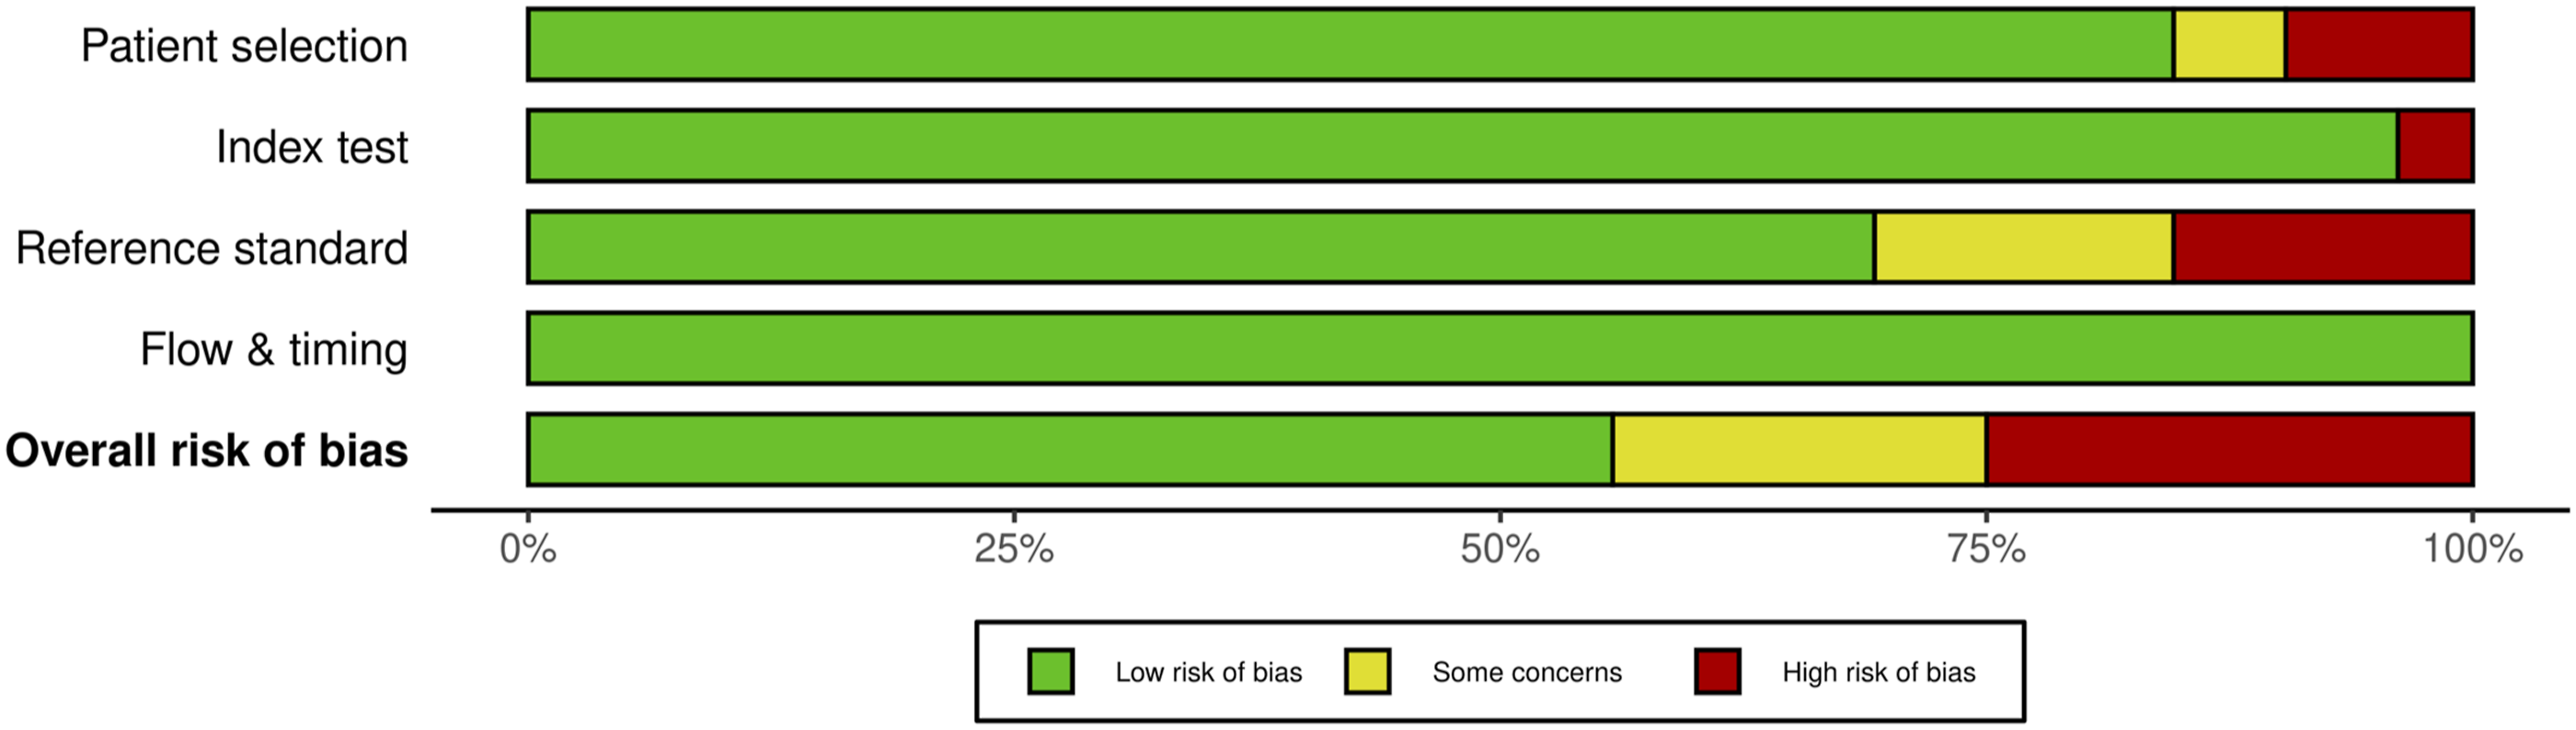
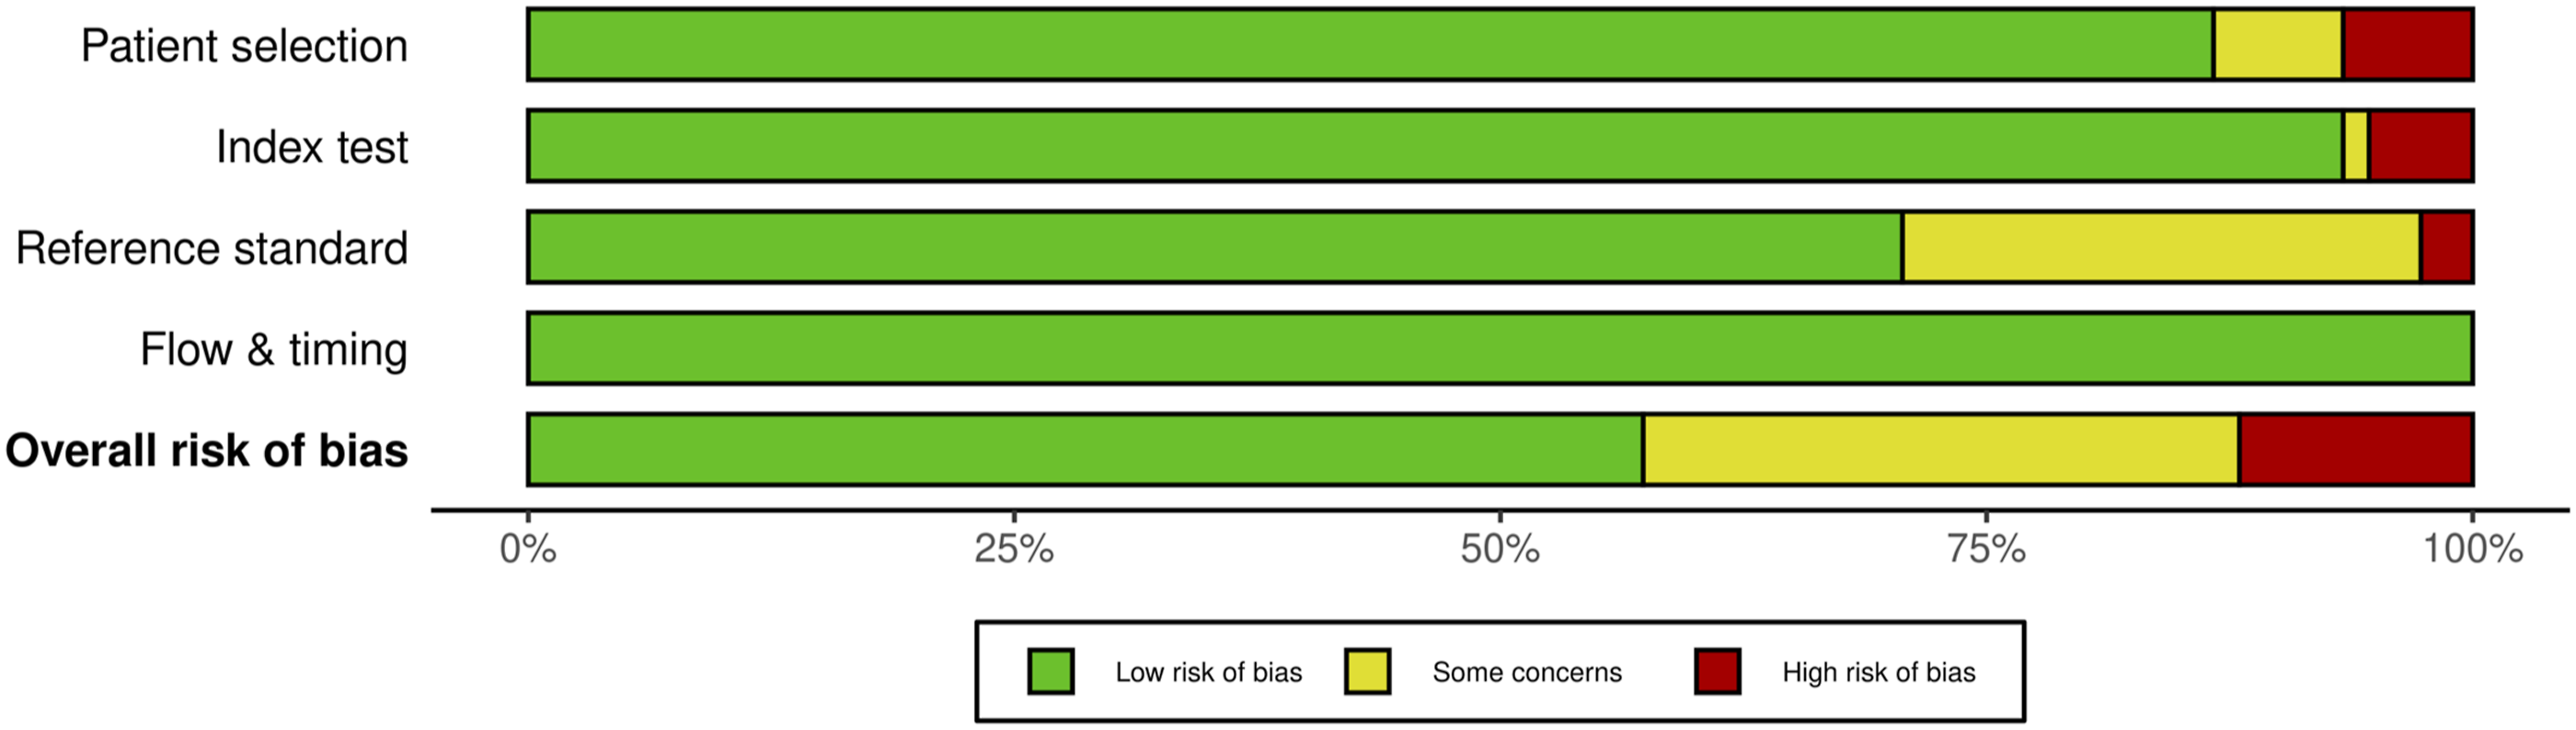
For SSEP monitoring, of the 52 studies, 10 studies (19.2%) had some concerns, 25% (n = 13) were high risk and the remaining 29 studies (55.8%) were low risk. For most of the studies that were graded down, risk of bias was identified in the “reference standard” domain; the reason was lack of specification details of the postoperative examination, or the use of a non-standard exam (Figures 18 and 19). QUADAS-2 risk of bias traffic light plot for SSEP. QUADAS-2 risk of bias summary plot for SSEP.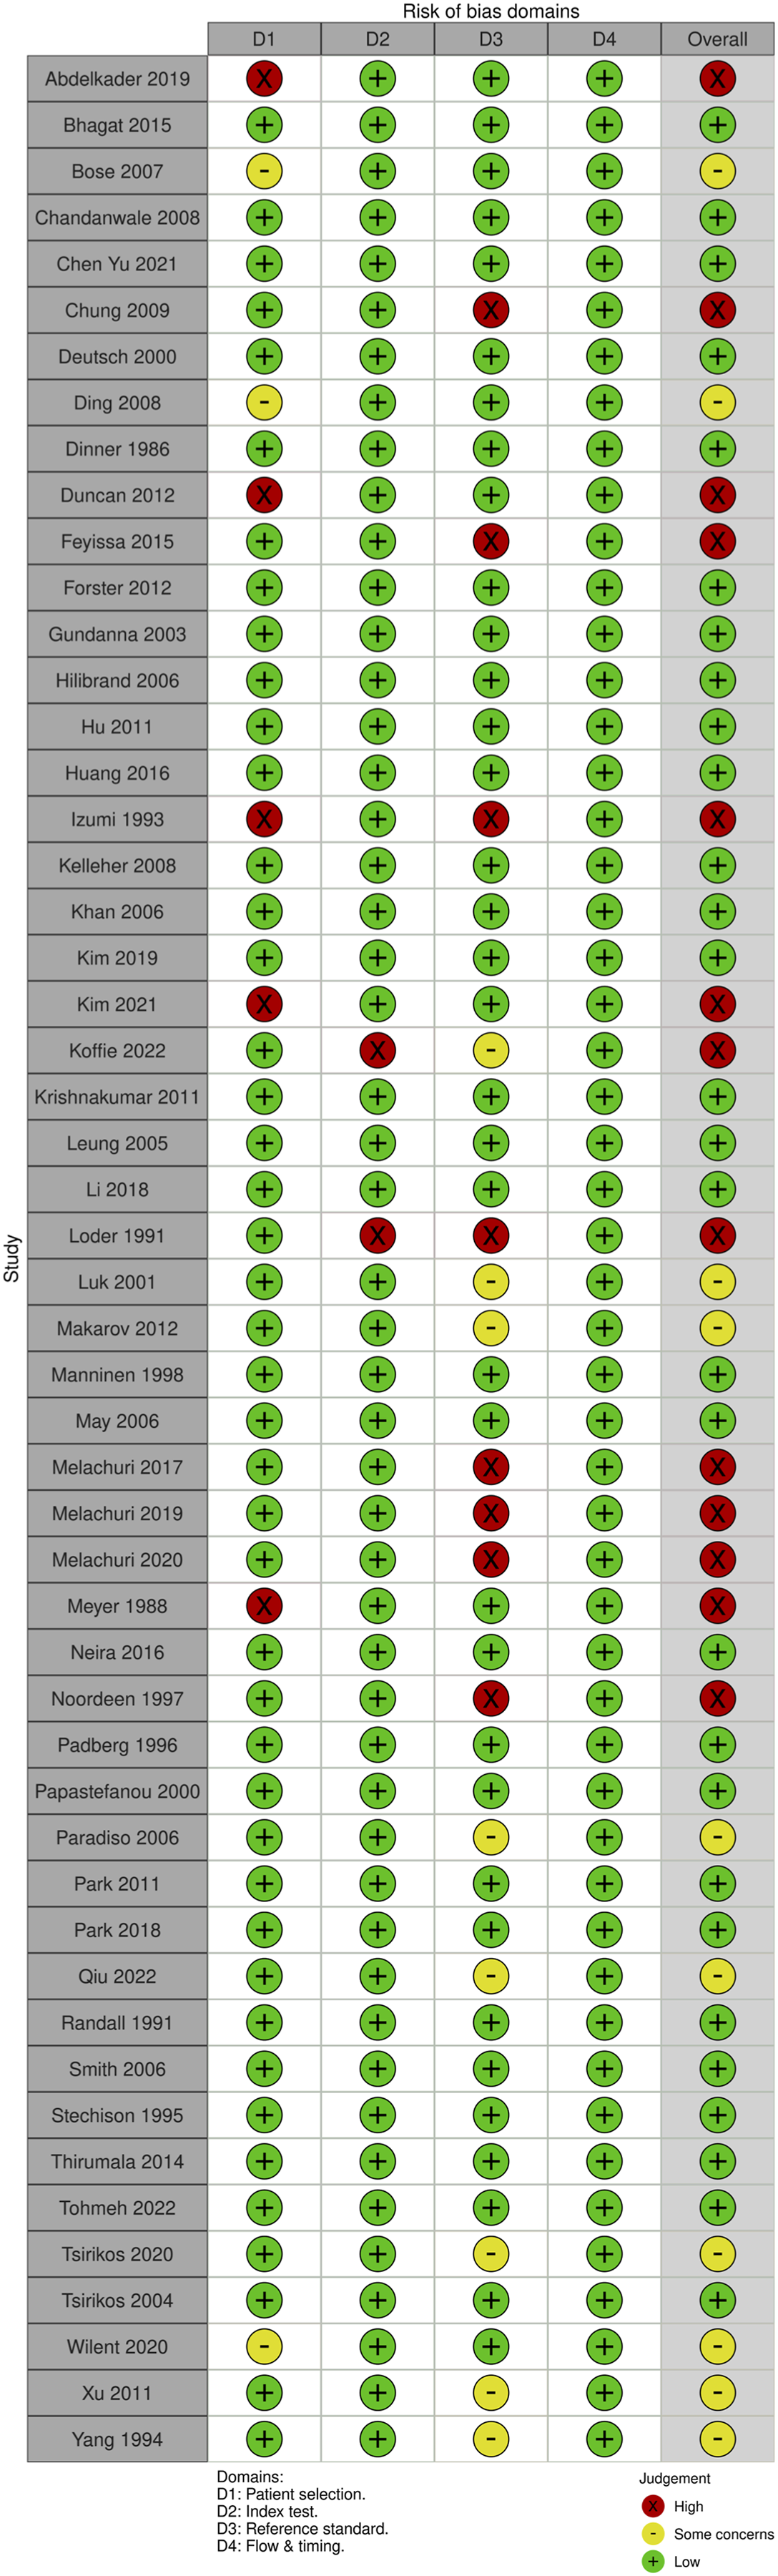
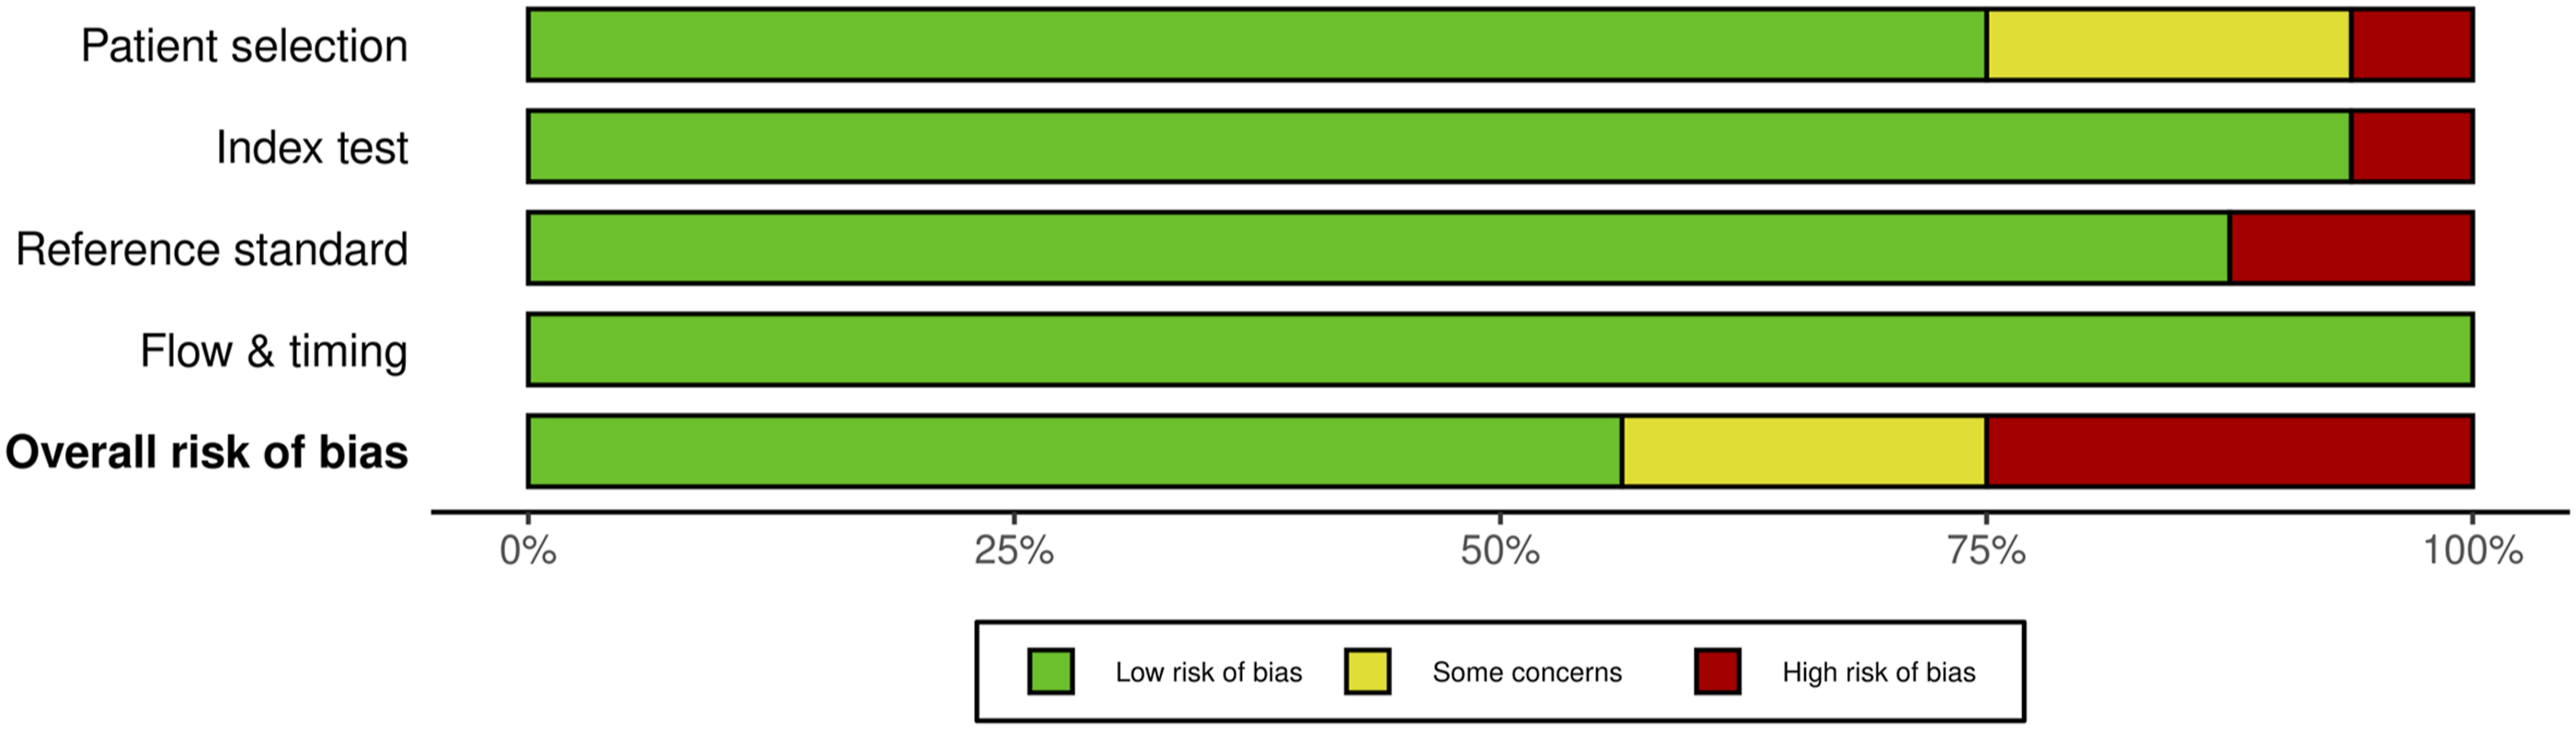
For MEP monitoring, of the 75 studies, 21 studies (28%) had some concerns, 10.7% (n = 8) were high risk and the remaining 46 studies (61.3%) were low risk. For most of the studies that were graded down, risk of bias was identified in the “reference standard” domain (Figures 20 and 21). QUADAS-2 risk of bias traffic light plot for MEP. QUADAS-2 risk of bias summary plot for MEP.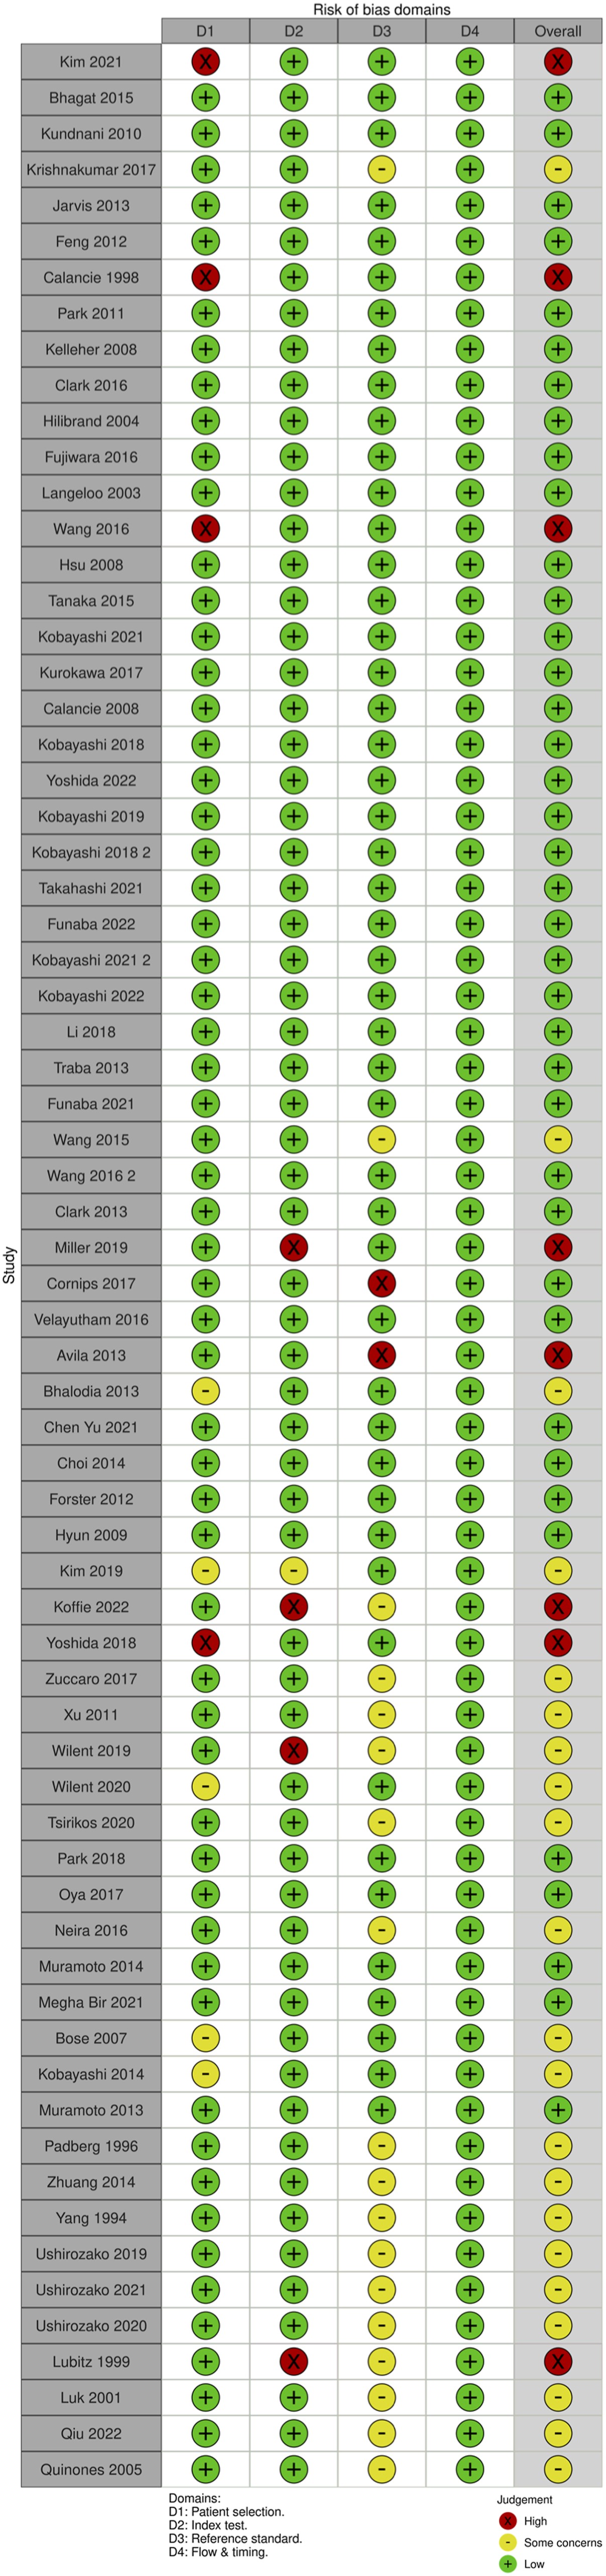
For EMG monitoring, of the 16 studies, 3 studies (18.75%) had some concerns, 25% (n = 4) were high risk and the remaining 9 studies (56.25%) were low risk. For most of the studies that were graded down, risk of bias was identified in the “index test” test domain; the reason was lack of specification details of the changes in EMG monitoring that were considered an alert (Figures 22 and 23). QUADAS-2 risk of bias traffic light plot for EMG. QUADAS-2 risk of bias summary plot for EMG.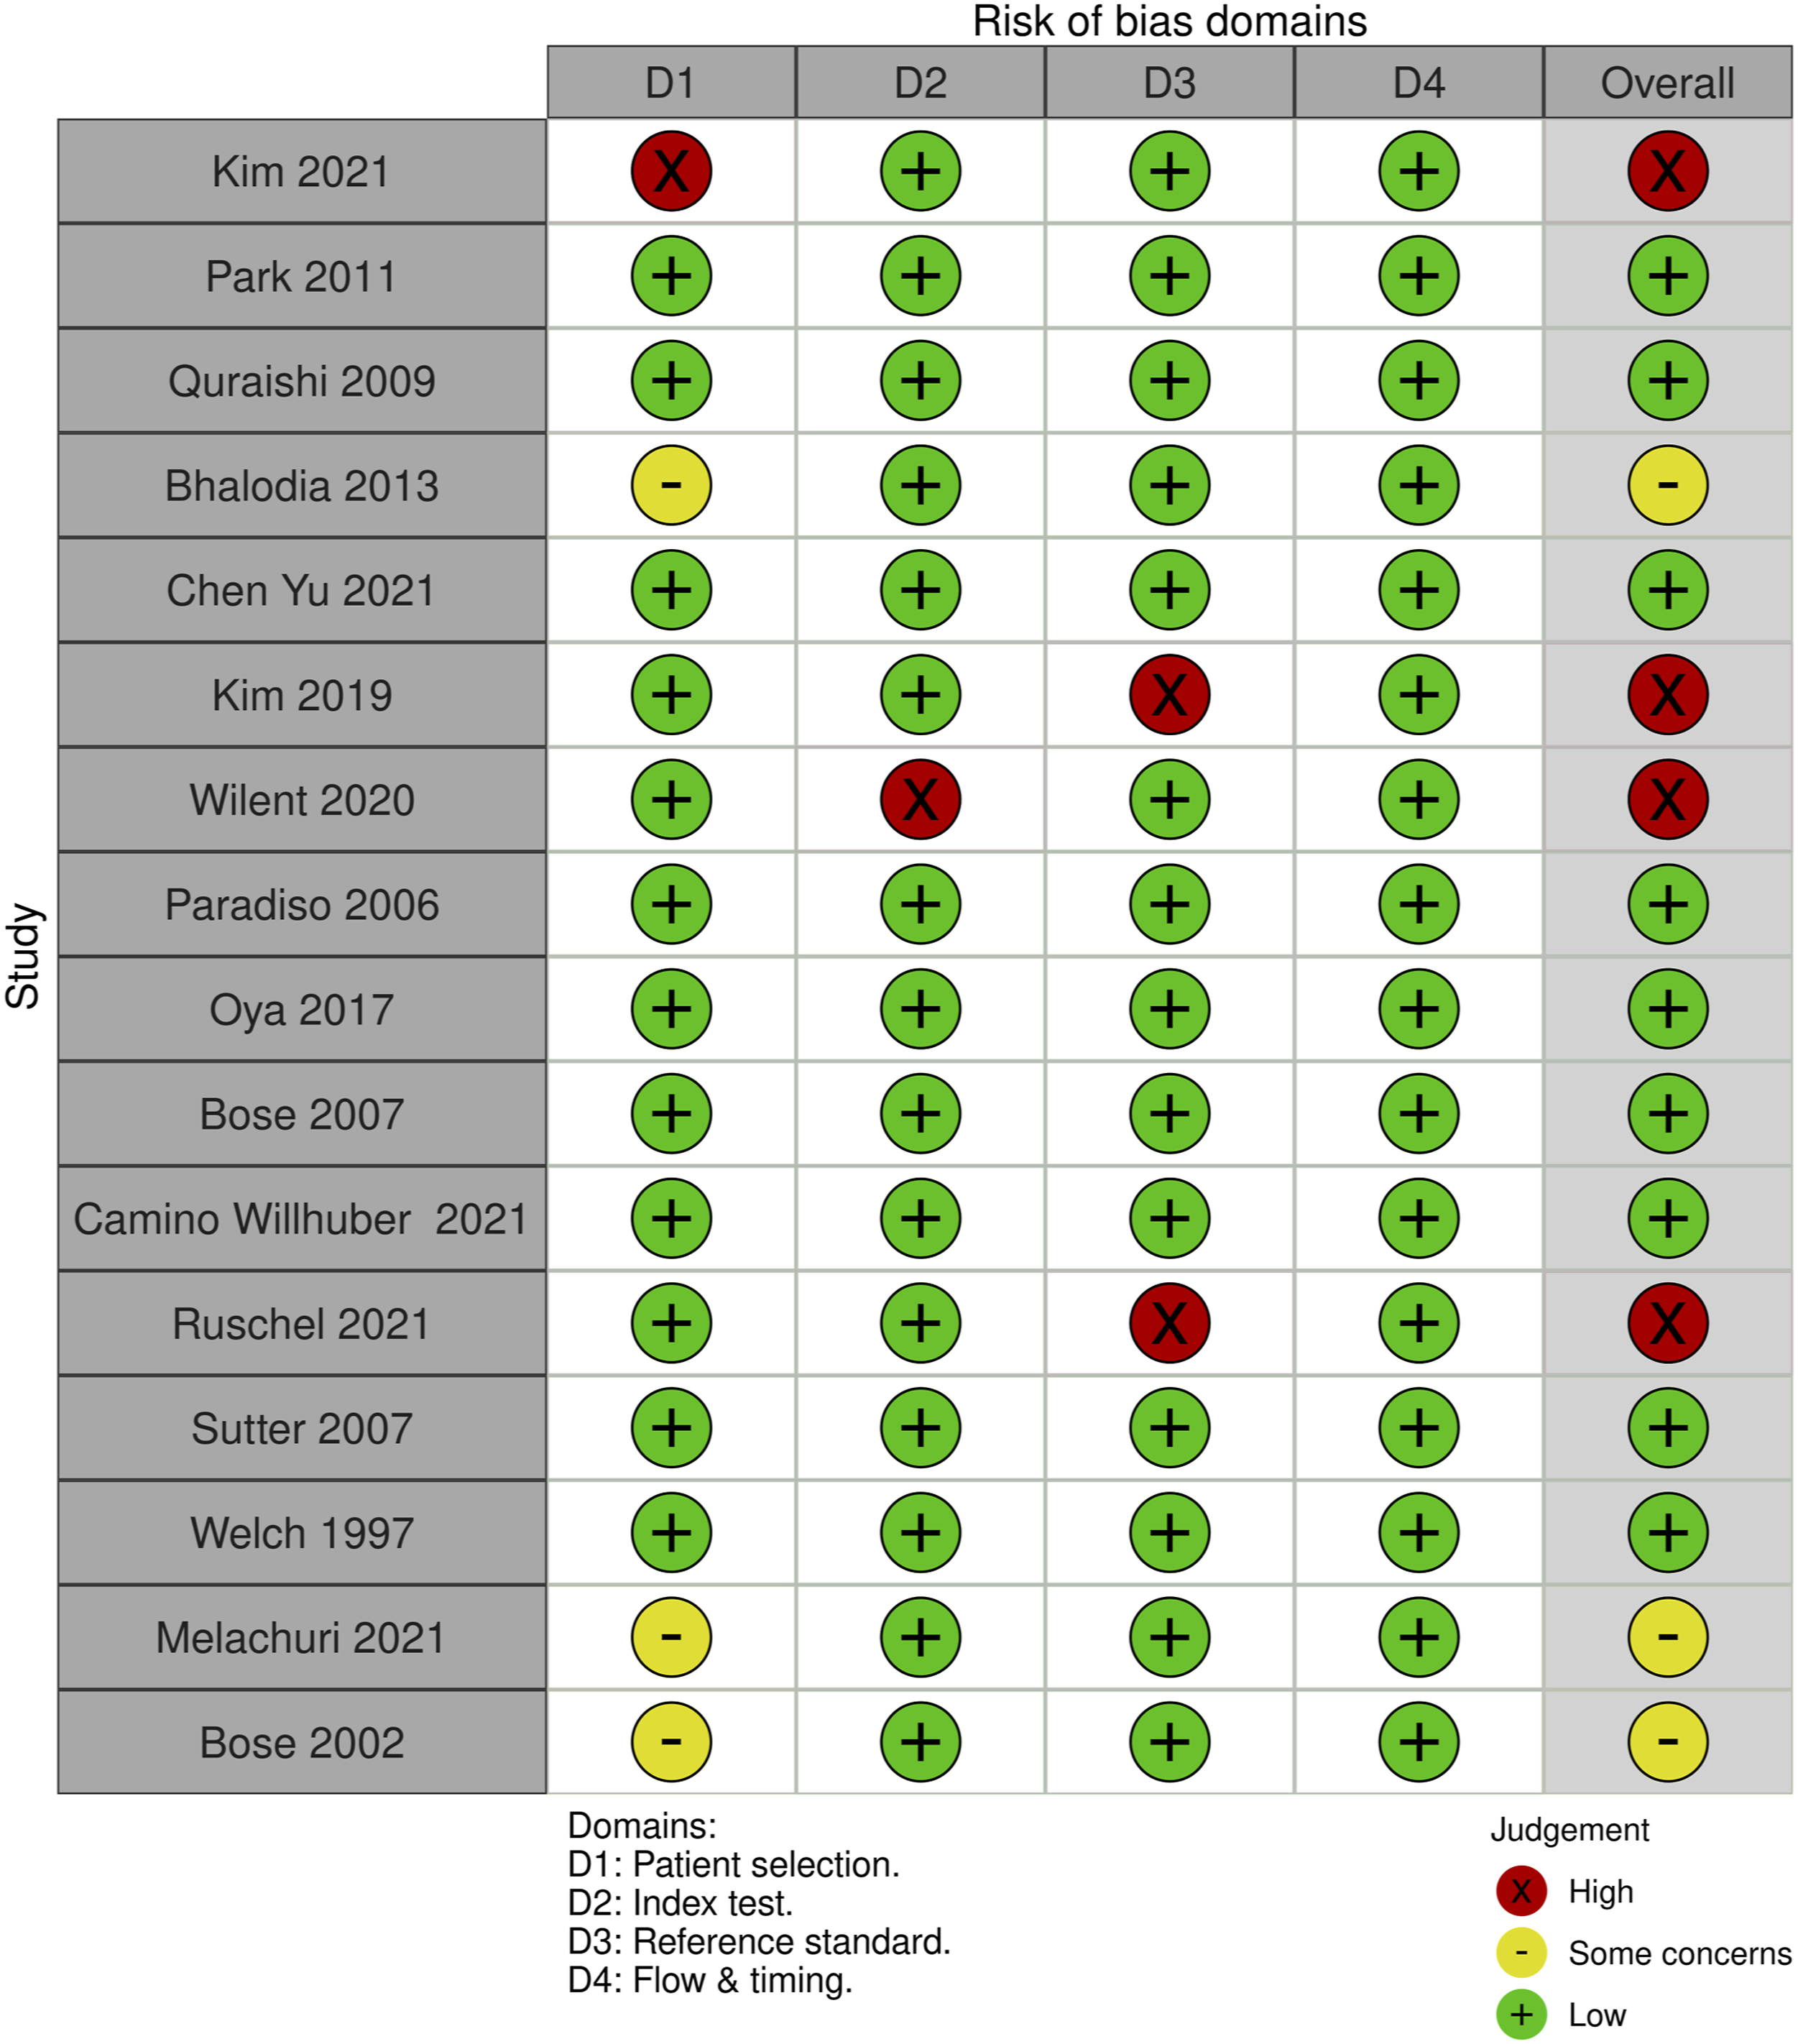
For multimodal neuromonitoring, of the 69 studies, 14 studies (20.3%) had some concerns, 14 studies (20.3%) were high risk and the remaining 41 studies (59.4%) were low risk. For most of the studies that were graded down, ris of bias was identified in the “index” domain; the reason was lack of specification/details of the criteria that constituted an alert. (Figures 24 and 25). QUADAS-2 risk of bias traffic light plot for multimodal neuromonitoring. QUADAS-2 risk of bias summary plot for multimodal neuromonitoring.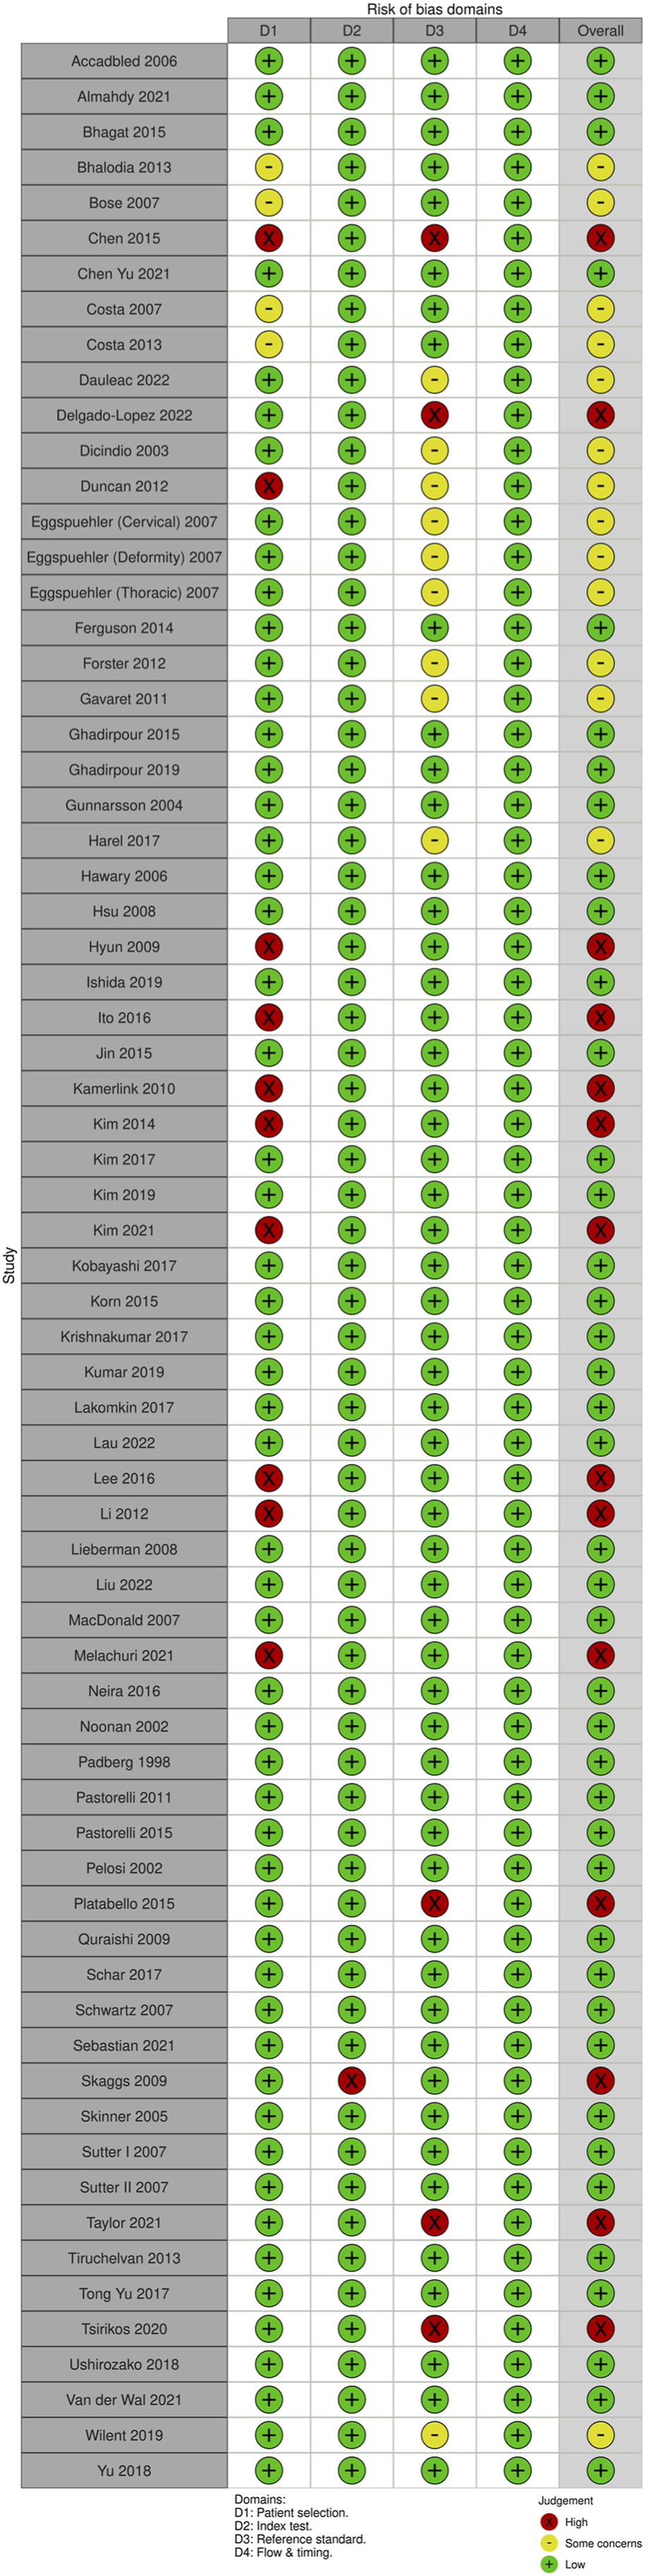
GRADE Assessment of Strength of Evidence
GRADE strength of evidence for different neuromonitoring approaches.
Discussion
One of the potential benefits of neuromonitoring is that it allows the surgical team to detect a SCI early on and to institute measures that may potentially reverse or minimize the neurologic deficit. The earlier an injury is detected, the more likely it is that corrective action can be taken to prevent or minimize further damage.
Another potential benefit of neuromonitoring is that it may help to reduce the risk of complications during surgery. Neuromonitoring can also help to improve the accuracy and precision of surgical procedures that involve the spinal cord. By providing real-time information about the function of the spinal cord sensory and motor tracts, neuromonitoring can help the surgical team make more informed decisions about how to proceed with the surgery. This may lead to better outcomes and a lower risk of complications. In addition, neuromonitoring can help to reduce the risk of legal liability for the surgical team. If an SCI occurs during surgery, the surgical team may be held responsible if they did not take appropriate precautions to prevent the injury. By using neuromonitoring, the surgical team can demonstrate that they took additional precautions to minimize the risk of injury and protect the patient's health.
In the current systematic review and meta-analysis, the authors sought to comprehensively summarize all available evidence related to the use of neuromonitoring to detect ISCI. Using novel quantitative statistical methods, we found that all neuromonitoring modalities have acceptable test characteristics as evident from the sROC and AUC. Moreover, we were also able to compute diagnostic test accuracy of each neuromonitoring type for specific disease groups and for specific regions of surgery. We discuss briefly the role of neuromonitoring for specific disease groups.
Monitoring for Cervical Degenerative Surgery
IONM has been more commonly used in degenerative cervical spine surgery recently, even though the risk of neurological complications is low. 204 SSEP is currently the IONM modality that is used the most frequently. 205 It is used in cervical spine surgery not only for assessment of the spinal cord and nerve roots following surgical positioning, but also for the monitoring of sensory tracts throughout the procedure. However, SSEP changes during surgery are not necessarily linked to postoperative neurological impairments due to its low specificity, as demonstrated in our analyses. As a result, many experts advise against using it as the sole monitoring modality in complicated cervical surgeries. This is evident from our results given that the sensitivity of using SSEP alone in cervical spine surgery was only 46%.
Numerous studies have proven that MEPs are reliable at detecting probable neurological damage. In their study, Clark et al found that using MEPs for predicting postoperative impairments in patients undergoing surgery for degenerative cervical myelopathy had a sensitivity of 71% and a specificity of 94%. 59 In 427 consecutive patients who underwent cervical spine surgery, Hilibrand et al compared the utilization of both SSEP and transcranial MEP (tcMEP) monitoring. 2 The authors described 12 individuals who had considerable monitoring modifications, 2 of whom were later discovered to have new neurological impairments. Since only one of the 2 patients with a deficiency had SSEP alterations, the authors came to the conclusion that the reported sensitivity and specificity for tcMEP were only 25% and 100%, respectively. However, recent studies have shown more promising results and better diagnostic accuracy for detecting intraoperative injury.47,49,95,97,157,185 The pooled results yielded a net sensitivity of 80.2% for MEP for cervical surgery.
In order to increase the effectiveness of IONM during cervical decompression surgery, a combination of SSEP, MEP and EMG has been explored due to the safety issues with the use of only SSEPs and the limitations of MEPs, as previously stated. While a previous qualitative analysis found an overall sensitivity of 50%, our analyses yielded a pooled sensitivity of 81.2%.
Some experts argue against the use of IONM in non-complex cervical spine surgeries, despite the fact that numerous researchers have shown its value. Traynelis et al 206 concluded that surgical decompression and reconstruction for symptomatic cervical spine disease may be safely carried out without the use of IONM after conducting a retrospective examination of 720 patients. Ajiboye et al 207 likewise discovered no advantage of IONM in the prevention of new postoperative neurological problems following anterior cervical surgery, supporting this study's findings. Our analyses, when restricted to studies investigating the use of multimodal monitoring for cervical spine and non-complex degenerative diseases, yielded a sensitivity of 62.7%. Therefore, there is ongoing debate in the spine community over whether monitoring is necessary for routine, non-complex cases.
Monitoring for Deformity Surgery
Several studies have highlighted the importance of using IONM in spinal deformity surgery. The incidence of neurological problems following scoliosis surgery has decreased dramatically since the 1970s, when SSEP monitoring was first introduced. 208 A large study by Nuwer et al published the findings of a survey by the Scoliosis Research Society (SRS), which asked its members to submit information on the surgical outcomes of patients who had undergone surgery, including the use of IONM. With stated sensitivity of 92% and specificity of 98.9%, SSEP monitoring was used in 51263 of 97586 spinal cases (53%), and positive and negative predictive values were 42% and 99.9%, respectively. However, given that this study did not provide 2 × 2 data for TP, FP, FN and TN, it was not included in our analyses. Nevertheless, our results showed optimum performance of all modalities for detecting ISCI during deformity surgery; 94% sensitivity for SSEP, 92.4% for MEP, and 98.8% for multimodal neuromonitoring.
Degenerative Lumbar Surgery
Although IONM is frequently employed in the treatment of spinal deformity in the present day, its application in degenerative lumbar surgery, particularly in straightforward procedures, is still debatable. 209 Supporters of IONM emphasize the technology’s significance in accurately identifying spinal nerve root damage, particularly in revision and instrumented fusion cases.48,164,210,211 The issue of monitoring spinal nerve root function is still debatable despite developments.209,212 Additionally, although numerous studies have supported the use of IONM in lumbar fusion surgery, it is still unclear whether the improved detection of crisis events intraoperatively translates to a decreased rate of postoperative neurological deficit. 213 Our results indicate that while EMG has poor sensitivity for most other surgeries, its role in nerve root monitoring for degenerative spine surgeries employing pedicle screw fixation and instrumentation in most cases is still valuable, with a pooled sensitivity of 76.2%.
Spinal Tumor Surgery
The value of neuromonitoring for spinal tumor surgery is also well established. A previous systematic review by Rijs et al included 14 studies and reported a pooled sensitivity of 80.8% for SSEP, 83.8% for MEP, and 83.5% for multimodal monitoring. We were able to identify 29 studies reporting the results of various neuromonitoring techniques for tumor surgery. We found the pooled sensitivity of SSEP for tumor surgery to be 33.2% based on 5 studies; 85.4% for MEP based on 12 studies; and 88.6% for multimodal based on 17 studies. Moreover, we were also able to parse out the statistics based on type of tumors, ie intra-medullary vs extra-medullary. Among patients undergoing surgery for intra-medullary tumors, the sensitivity for MEP monitoring was 74% and for multimodal was 81.4%. For extra-medullary tumors, the sensitivity for MEP and multimodal monitoring were 85.9% and 82.9%, respectively.
It is clear that IONM is a tool with significant usefulness when removing spinal cord tumors. It provides the surgeon with crucial knowledge about potential spinal cord damage and has enabled more complete tumor resections. Its important to remember that IONM is a tool and not a cure. Its value varies depending on the particular circumstance and how the surgeon applies the knowledge from the IONM alert to the resection technique. However, it would be much more useful to gather information with a longer follow-up on both the neurologic result and the quality of life in the present era of value-based health care. 11
Conclusion
The present systematic review and meta-analysis has summarized the role of neuromonitoring for detecting ISCI during spine surgery. Our results indicate that there is low level evidence that all neuromonitoring modalities have acceptable performance in terms of detecting ISCI, particularly for high-risk spinal surgery. It is therefore recommended that some form of neuromonitoring be employed, particularly in high-risk spinal surgery.
Supplemental Material
Supplemental Material - Accuracy of Intraoperative Neuromonitoring in the Diagnosis of Intraoperative Neurological Decline in the Setting of Spinal Surgery—A Systematic Review and Meta-Analysis
Supplemental Material for Accuracy of Intraoperative Neuromonitoring in the Diagnosis of Intraoperative Neurological Decline in the Setting of Spinal Surgery—A Systematic Review and Meta-Analysis by Mohammed Ali Alvi, Brian K. Kwon, Nader Hejrati, Lindsay A. Tetreault, Nathan Evaniew, Andrea C. Skelly, and Michael G. Fehlings in Global Spine Journal
Footnotes
Acknowledgments
MGF is supported by the Robert Campeau Family Foundation/Dr C.H Tator Chair in Brain and Spinal Cord Research at UHN. BKK is the Canada Research Chair in Spinal Cord Injury and the Dvorak Chair in Spinal Trauma. NH acknowledges support by the Research Fund of the University of Basel for Excellent Junior Researchers. This Focus Issue was reviewed by the Joint Guidelines Review Committee of the American Association of Neurological Surgeons and Congress of Neurological Surgeons as well as the North American Spine Society. However, this review process does not constitute or imply endorsement of this work product by these organizations.
Declaration of Conflicting Interests
The author(s) declared no potential conflicts of interest with respect to the research, authorship, and/or publication of this article.
Funding
The author(s) disclosed receipt of the following financial support for the research, authorship, and/or publication of this article: This research was financially supported by the AO Foundation, AO Spine and Praxis Spinal Cord Institute. This study was jointly organized and funded by AO Foundation through the AO Spine Knowledge Forum Spinal Cord Injury (SCI) (www.aospine.org/kf-sci), a focused group of international SCI experts, and the Praxis Spinal Cord Institute (![]() ) through funding from Western Economic Diversification Canada. The funding bodies did not control or influence the editorial content of the articles or the guidelines process. Methodologic and analytic support for this work was provided by Aggregate Analytics, Inc, with funding from the AO Foundation and Praxis Spinal Cord Institute.
) through funding from Western Economic Diversification Canada. The funding bodies did not control or influence the editorial content of the articles or the guidelines process. Methodologic and analytic support for this work was provided by Aggregate Analytics, Inc, with funding from the AO Foundation and Praxis Spinal Cord Institute.
Supplemental Material
Supplemental material for this article is available online.
References
Supplementary Material
Please find the following supplemental material available below.
For Open Access articles published under a Creative Commons License, all supplemental material carries the same license as the article it is associated with.
For non-Open Access articles published, all supplemental material carries a non-exclusive license, and permission requests for re-use of supplemental material or any part of supplemental material shall be sent directly to the copyright owner as specified in the copyright notice associated with the article.