
Abstract
Study Design
Data collection of radiological parameters in non-pathological adult spines.
Objectives
Establishing a baseline database for measurements of the spinal lordosis ratio between upper and lower arcs of the lumbar spine unique to each type of spine described by Roussouly’s classification. Illustrating the importance of correct rationing of the upper and lower arcs.
Methods
Standardised standing true lateral plain radiographs of the spine (including base of skull and proximal femurs) from 373 adult volunteers were obtained. Exclusion criteria : any history of disease involving the spine, pelvis, hips or lower limbs. Incidental detection of any spinal deformity on radiography also excluded further participation in this study. Sacro-pelvic parameters data collected : Pelvic Incidence (PI), Pelvic Tilt (PT), Sacral Slope (SS), location of Inflection Point, number of vertebras in the spinal lordosis and type of Roussouly’s spine. Values of upper arc, lower arc and spinal lordosis ratio (SLR) was determined.
Results
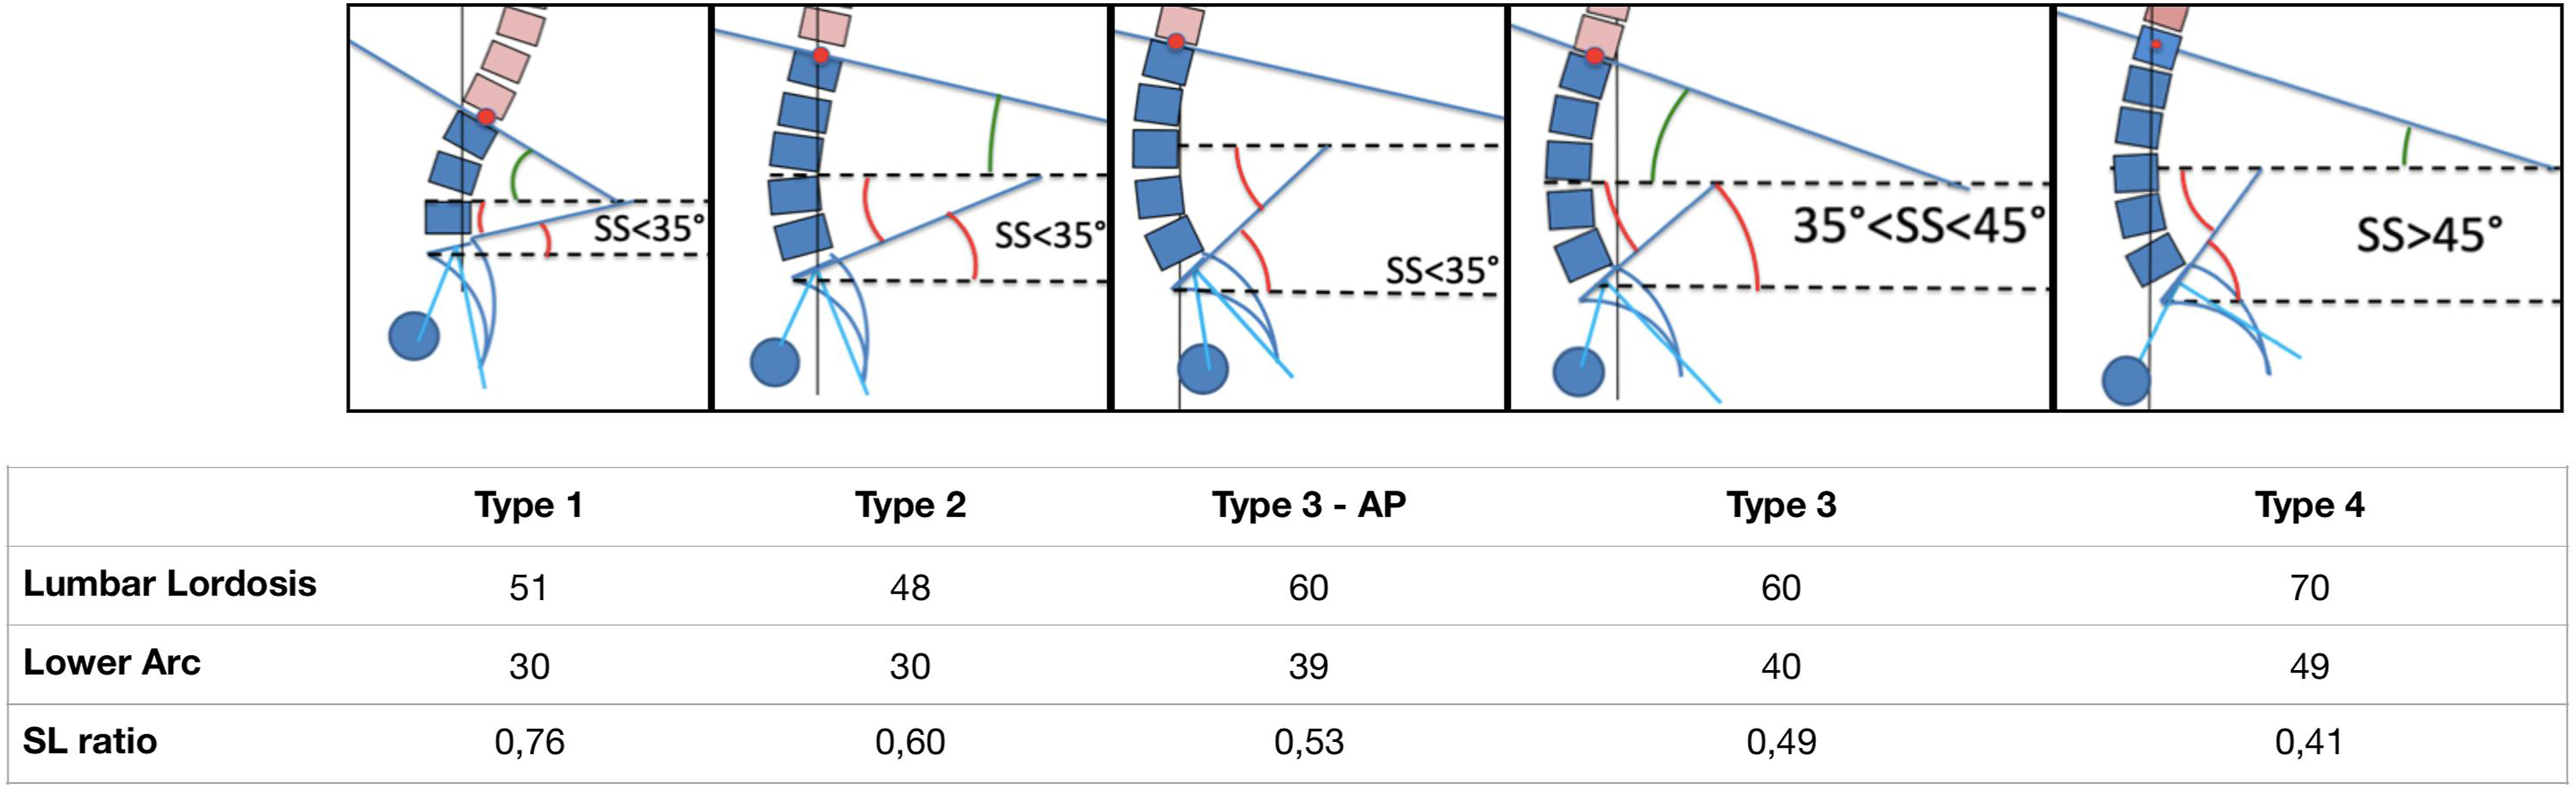
Bivariate analysis revealed statistically significant (P < .0001) correlation between the types of sagittal spinal alignments based on Roussouly’s classification and the SLR. Type 1: SLR .76 ± .17, Type 2: SLR .60 ± .18, Type 3 with anteverted pelvis: SLR .53 ± .11, Type 3: SLR .49 ± .12, Type4: SLR .41 ± .11.
Conclusion
With this data we are able to quantify the ratio of lumbar lordosis unique to each type of Roussouly’s spine. It functions as a guide when planning lumbar spine surgeries in order to restore the SLR correctly and thus prevent post-op complications such as proximal junction kyphosis.
Keywords
Introduction
The anatomical nomenclature of the spinal segments traditionally classifies the human spinal curvatures as cervical lordosis (CL: C1 to C7), thoracic kyphosis (TK: T1 to T12) and lumbar lordosis (LL: L1 to L5).
1
This anatomic description, as it often does, differs from the biomechanical point of view. This lead Roussouly to propose a functional segmentation of the spinal curves in the sagittal plane where junctions of the curves were defined by inflexion points. Based on the inflection point, the proximal limit of the lordotic curve may be higher than L1 thus forming a long spinal lordosis (SL), or it may be lower thus forming a short SL.
2
When analysing the SL construction, the main landmarks identified are: the apex , the inflexion point and the sacral plate. Berthonnaud et al defined two tangential arcs of a circle and placed the centre of each arc on a horizontal line drawn from the apex
3
[Figure 1]. The lower arc of spinal lordosis (LAL) extends from S1 to the apex, while the upper arc of spinal lordosis (UAL) extends from the apex to the inflexion point (where lordosis transitions to kyphosis). Using this geometrical construct, it is possible to demonstrate that the angle of the lower arc of SL is equal to the sacral slope (SS) angle.
4
The angle of the upper arc of SL is found to be constant at 20° in the asymptomatic population
5
[Figure 1]. The variability of SS and pelvic incidence (PI) in the population explains the different morphologies of SL resulting in the five types of spinal sagittal alignment described in the Roussouly classification.5-7 Restoring a SL adapted to its pelvic morphology is the challenge in treatment of sagittal imbalance.8,9 The objective of this study is to establish and quantify the spinal lordosis ratio (SLR) between upper and lower arcs of SL for each type of spinal sagittal alignment in an asymptomatic population. Inflection point is where lordosis turns into kyphosis, Upper lumbar arc (θ) which is usually constant at 20°, Lower lumbar arc (β) which is equivalent to sacral slope (SS) angle.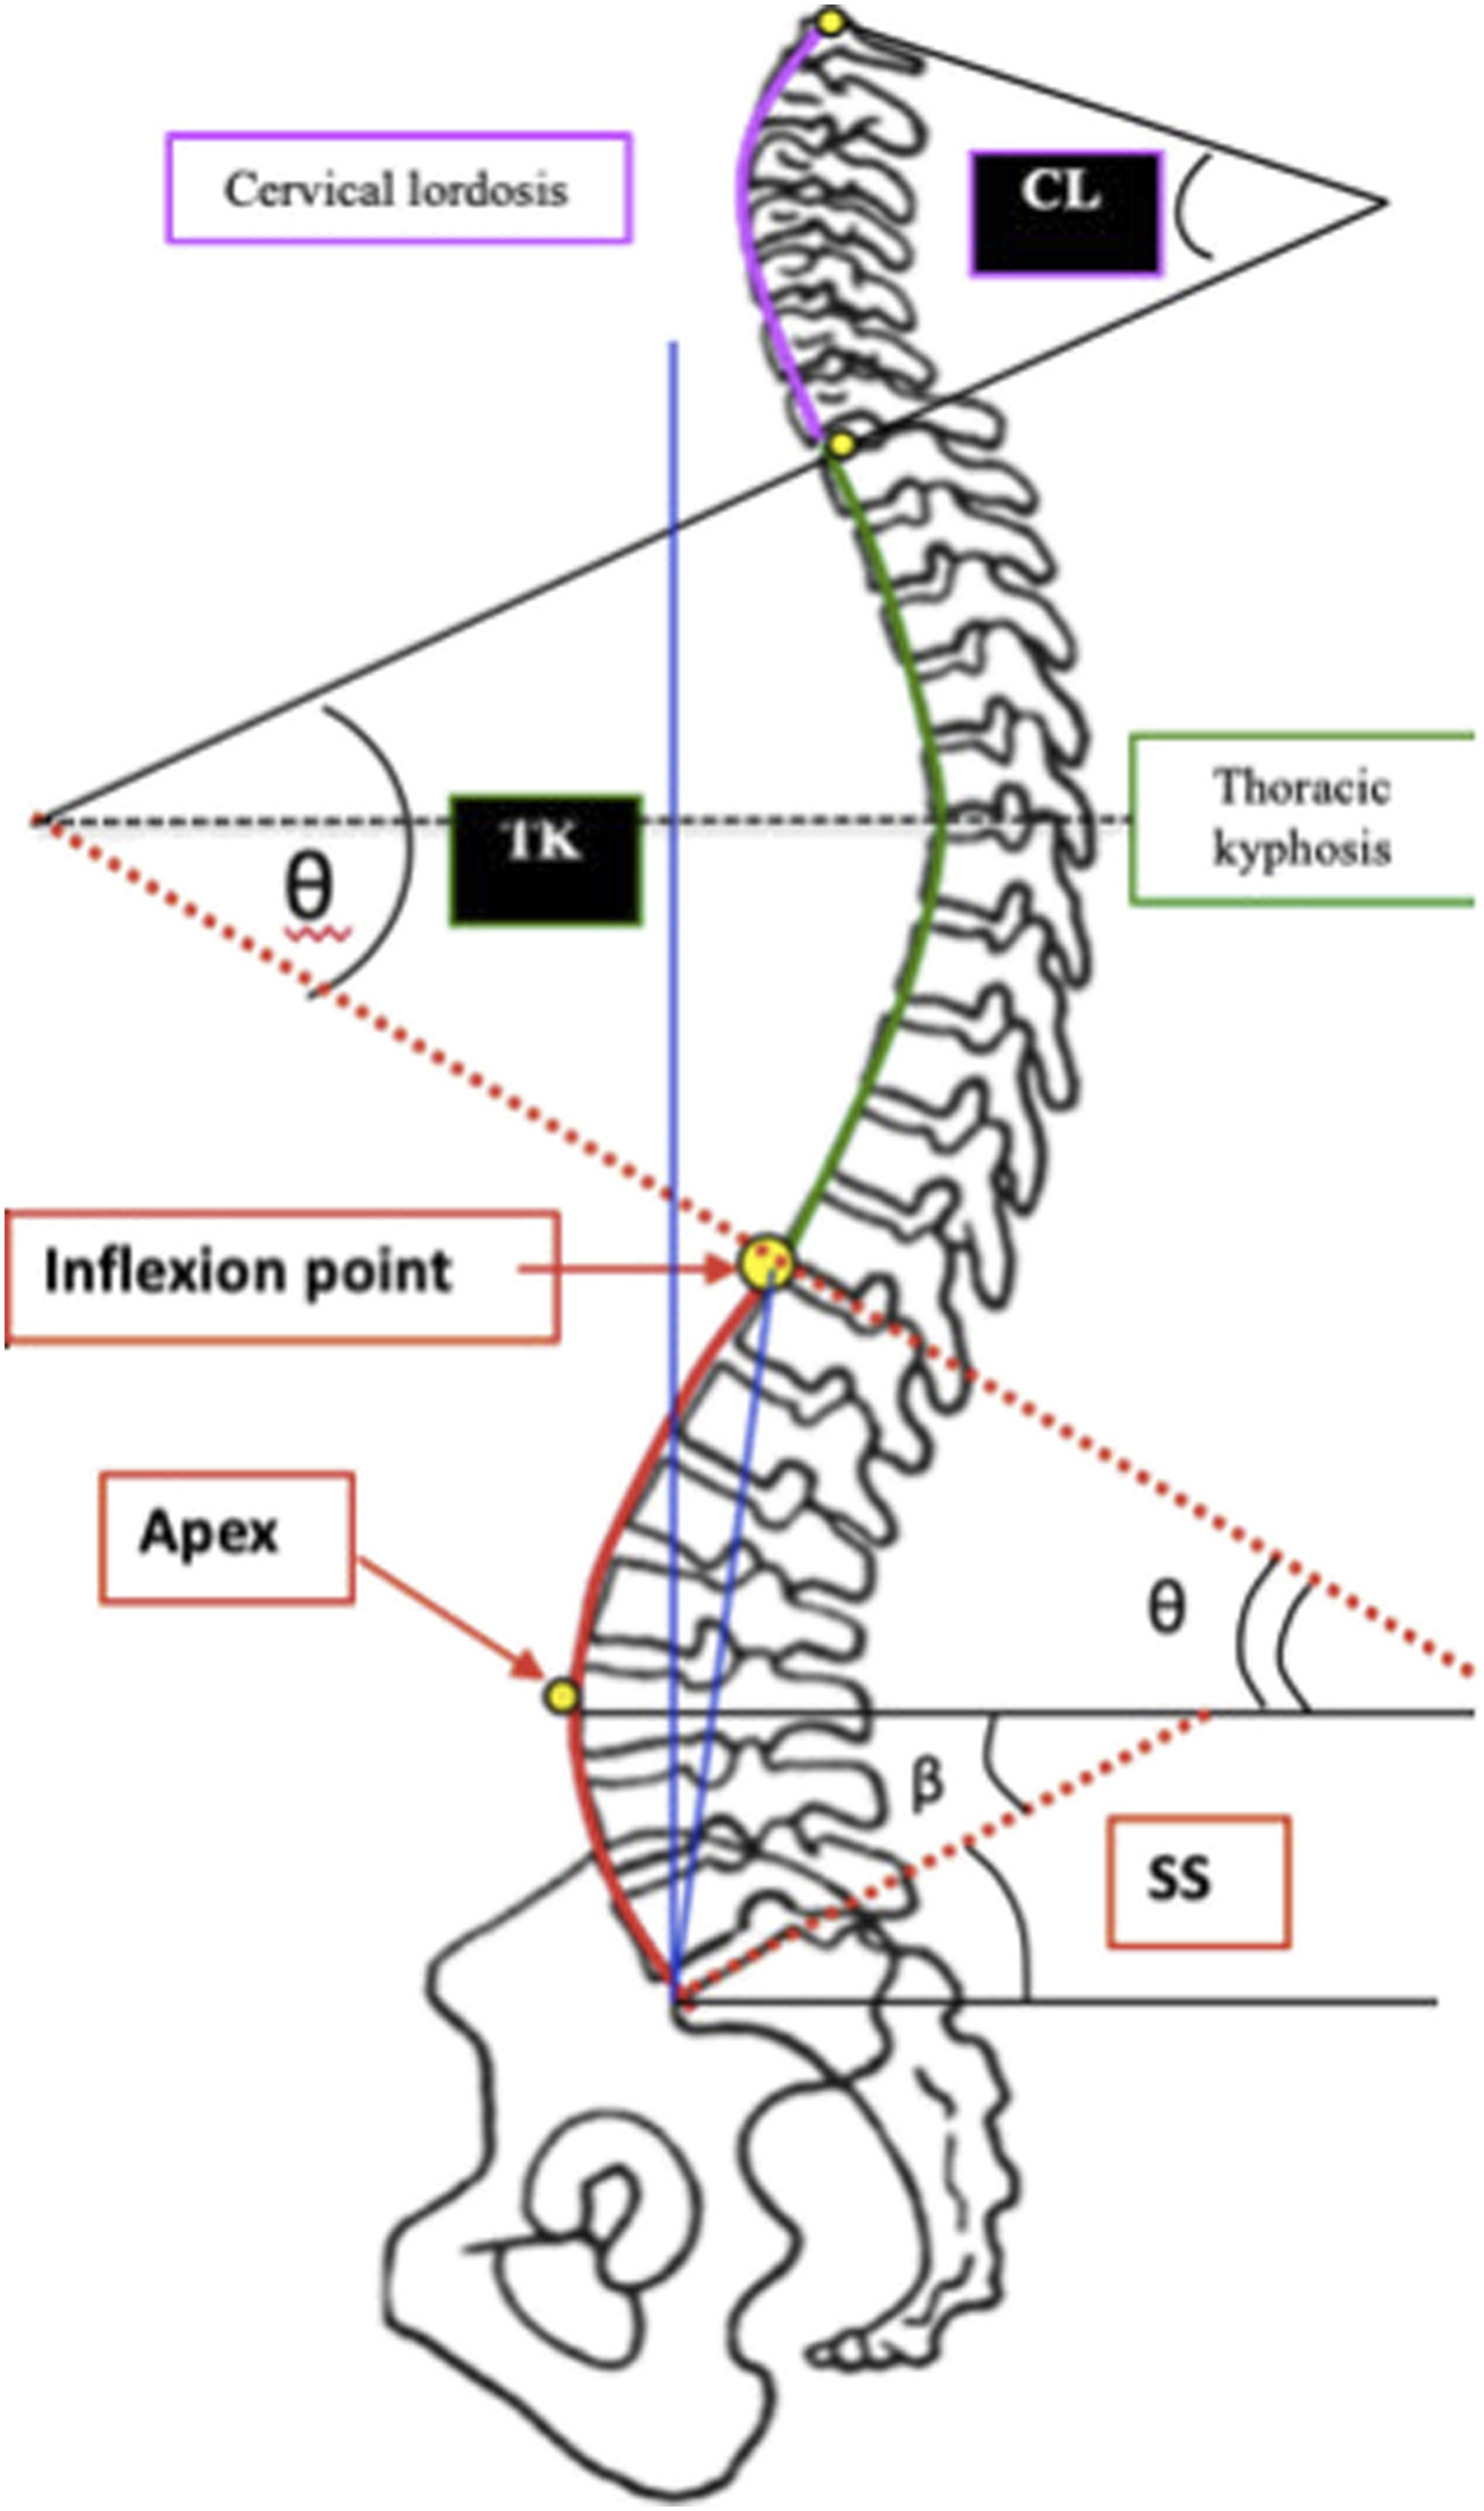
Materials and Methods
A total of 373 adult volunteers, 195 females and 178 males were enrolled in this study. Mean age was 27 years. The entire population was Caucasian. Consent to participate in this study was obtained from each patient. There was no need to obtain IRB approval for the collection of our data. At time of enrolment, patients were ensured to be free from current or past history of spinal, hip or pelvic disease. Exclusion criteria were: history of back pain or deformity, history of hip or lower limb disease or discrepancy, and detection of any radiographic abnormalities eg: scoliosis, spondylolisthesis or Scheuermann’s kyphosis.
The radiographic protocol was standardised. For each subject, a standing 30 × 90 cm left true lateral radiograph of the spine and pelvis was obtained from the base of the skull to the proximal femur, limiting the pelvic rotation in the coronal plan. The distance between the radiographic source and the film was fixed at 230 cm for all radiographs. Subjects stood in a comfortable position, with shoulders and elbow flexed, hands placed on supports, and with hips and knees fully extended. Plain radiographs were scanned using a VXR8 film scanner in jpg or in bitmap format at 75 dpi if not available in digital format.
Sacropelvic parameters (PI, pelvic tilt PT and SS), SL, inflexion point location, total numbers of lordotic vertebrae and type of Roussouly’s spinal sagittal alignment were measured by a single observer using the Keops software (SMAIO, France). 10
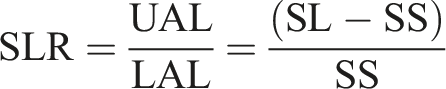
As explained, the lower arc angle of spinal lordosis LAL is equal to SS. The upper arc angle of spinal lordosis UAL was obtained using the formula UAL = SL – LAL = SL – SS. [Figure 1]. The spinal lordosis ratio was calculated using the equation,
The data was analysed in a statistically independent unit using software R (version 3.4.2). The link between SL ratio and the five types of spinal sagittal alignment by Roussouly classification was analysed using Kruskal-Wallis, Mann-Whitney-Wilcoxon and Holm tests. Spearman test was used for correlations. P = .05 was chosen as significance level.
Results
Sacropelvic Morphology of the Cohort
For all asymptomatic subjects, PI, PT and SS values were respectively 52° ± 11°, 12° ± 6° and 40° ± 8°. SL was 60° ± 10°.
UAL was 20° ± 5° and SL ratio was .52 ± .17
Sacropelvic Morphology by Roussouly’s Classification of Spinal Sagittal Alignment
Type 1 : 39 subjects, 22 females and 17 males. PI, PT and SS were 40°± 5°, 10°± 5°and 30°± 4°. SL was 51°± 6°.
UAL was 22°± 4° and SL ratio was .76 ± .17.
Type 2 : 75 subjects, 41 females and 34 males. PI, PT and SS were 41°± 5°, 11°± 5° and 30°± 4°. SL was 48°± 6°.
UAL was 18°± 5° and SL ratio was .60 ± .18.
Type 3 with anteverted-pelvis (AP) : 57 subjects, 33 females and 24 males. PI, PT and SS were 45°± 4°, 6°± 4° and 39°± 2°. SL was 60°± 5°.
UAL was 21°± 4° and SL ratio was .53 ± .11.
Type 3 : 94 subjects, 54 males and 40 females. PI, PT and SS were 56°± 4°, 15°± 4° and 40°± 3°. SL was 60°± 6°.
UAL was 20°± 5° and SL ratio was .49 ± .12.
Type 4 : 108 subjects, 59 females and 49 males. PI, PT and SS were 62°± 9°, 13°± 7° and 49°± 4°. SL was 70°± 6°.
UAL was 20°± 5°and SL ratio was .41 ± .11.
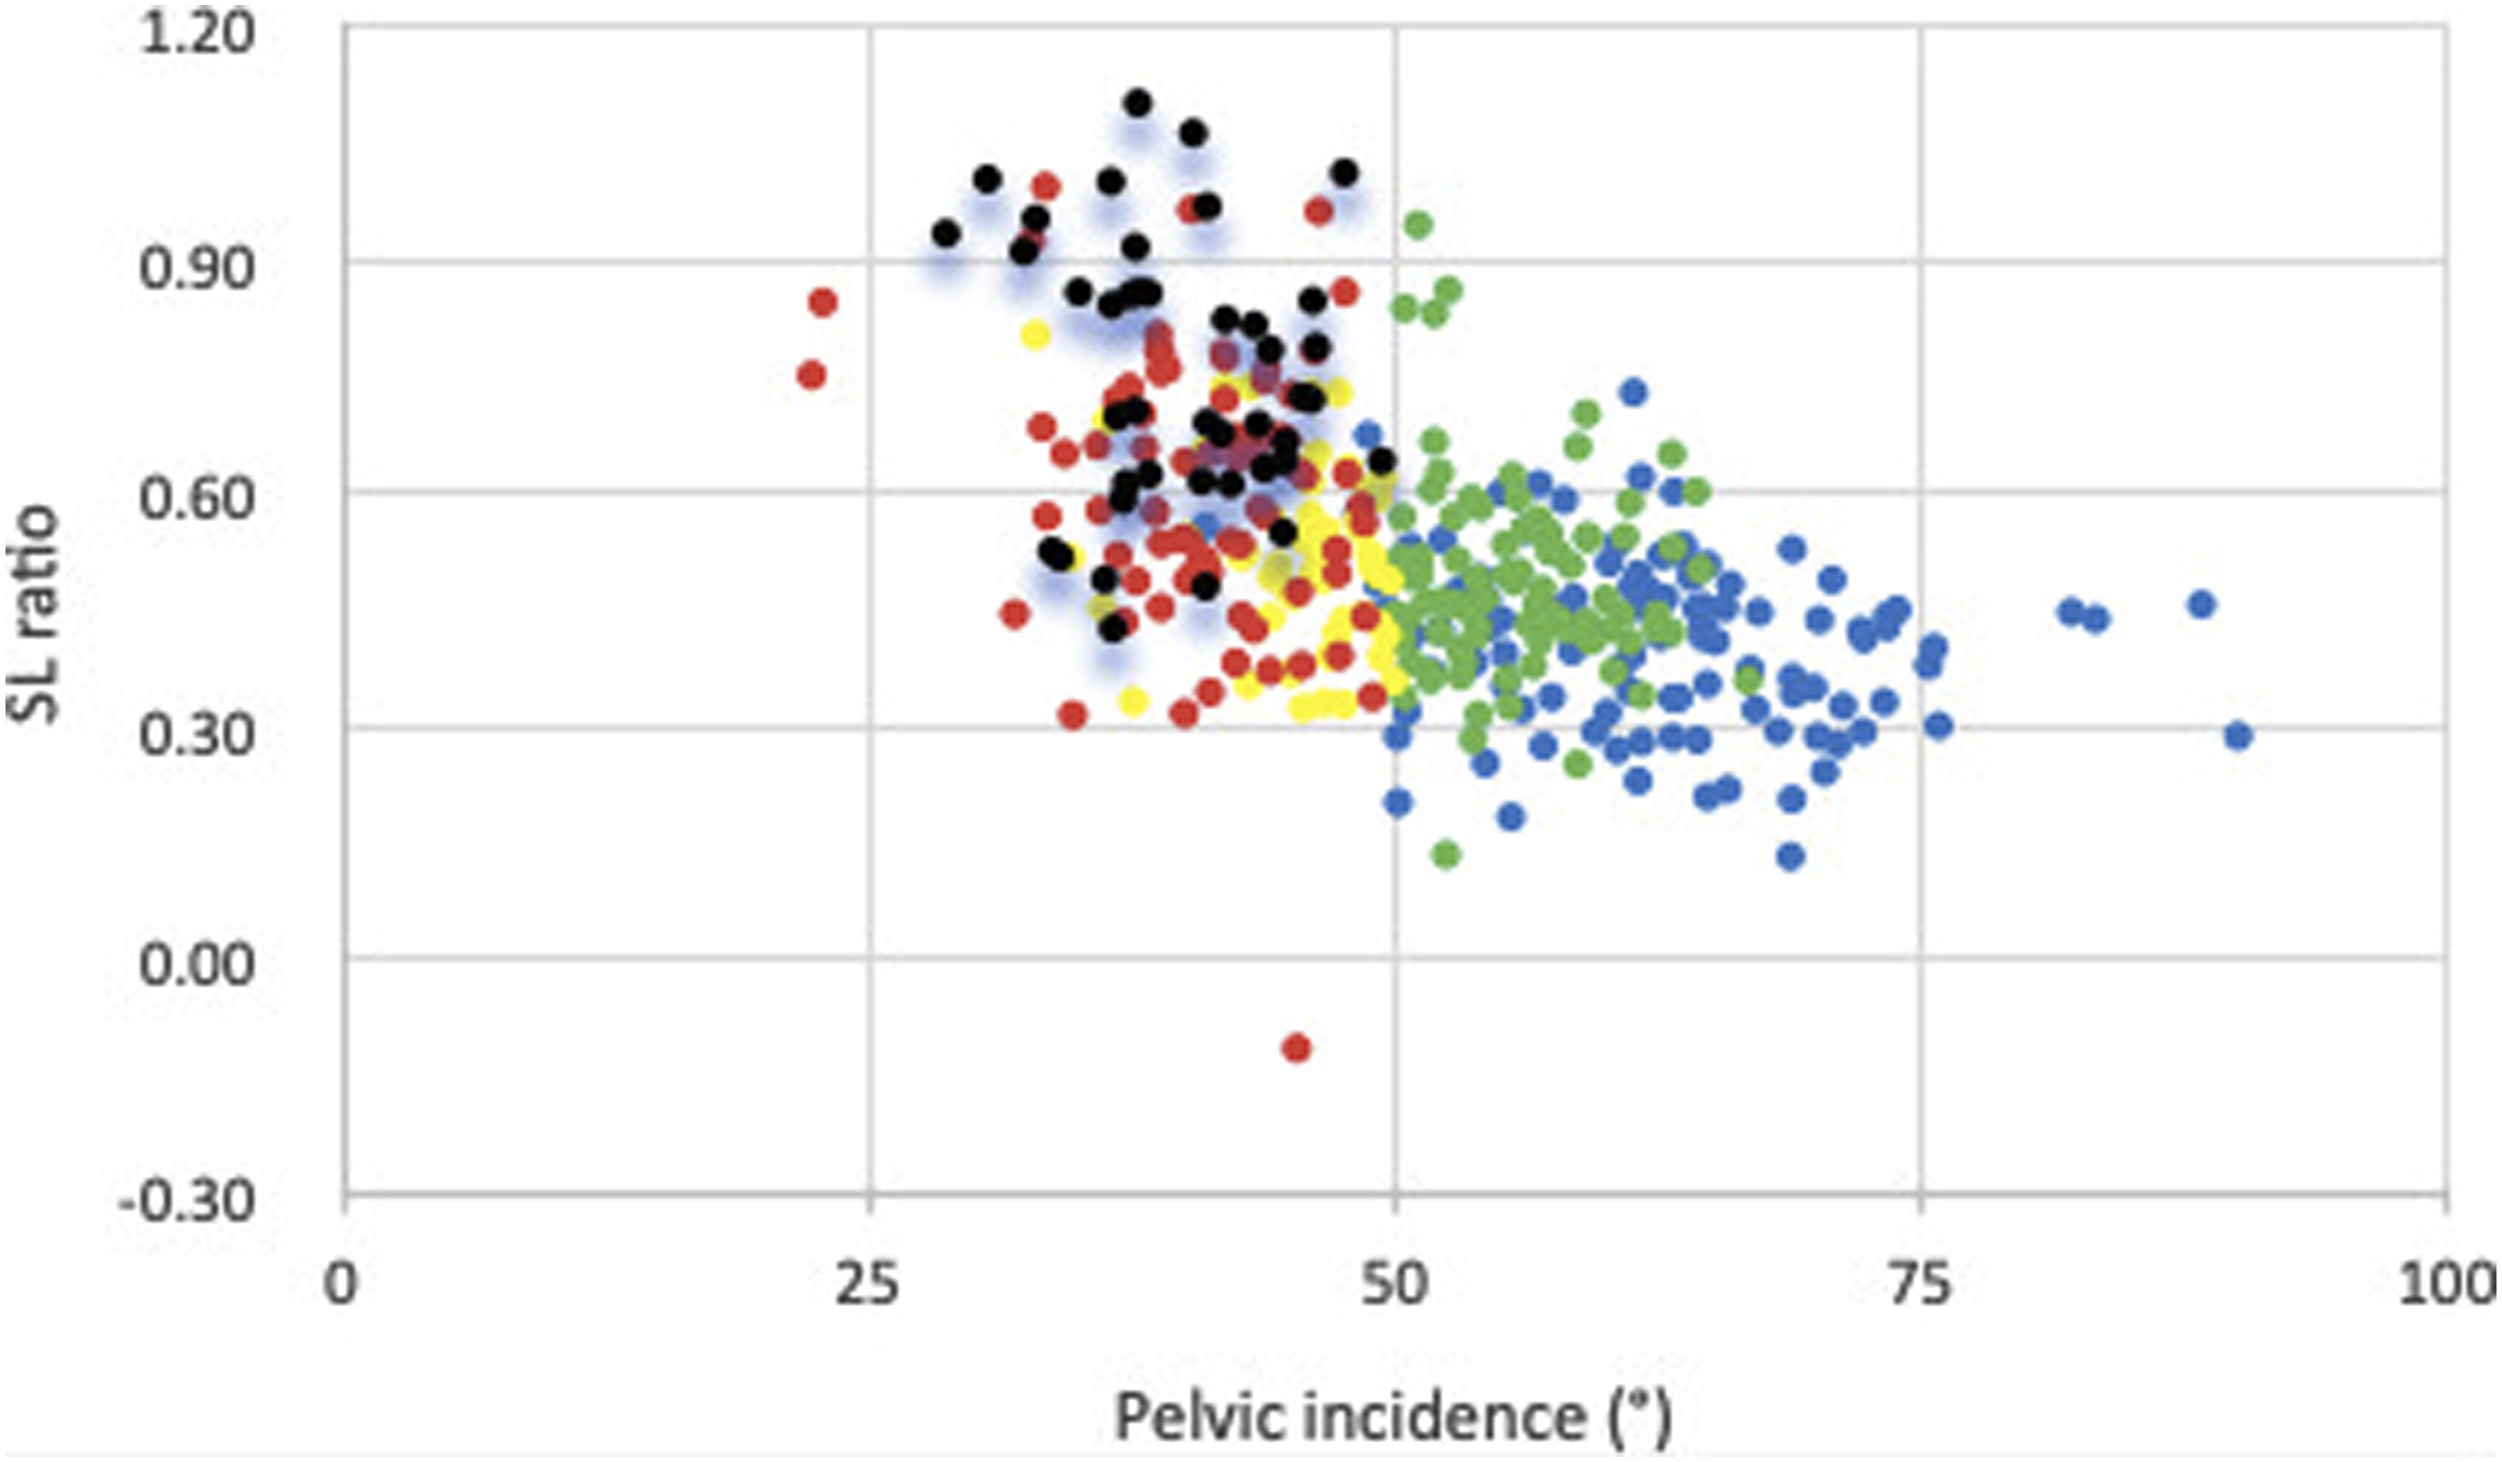
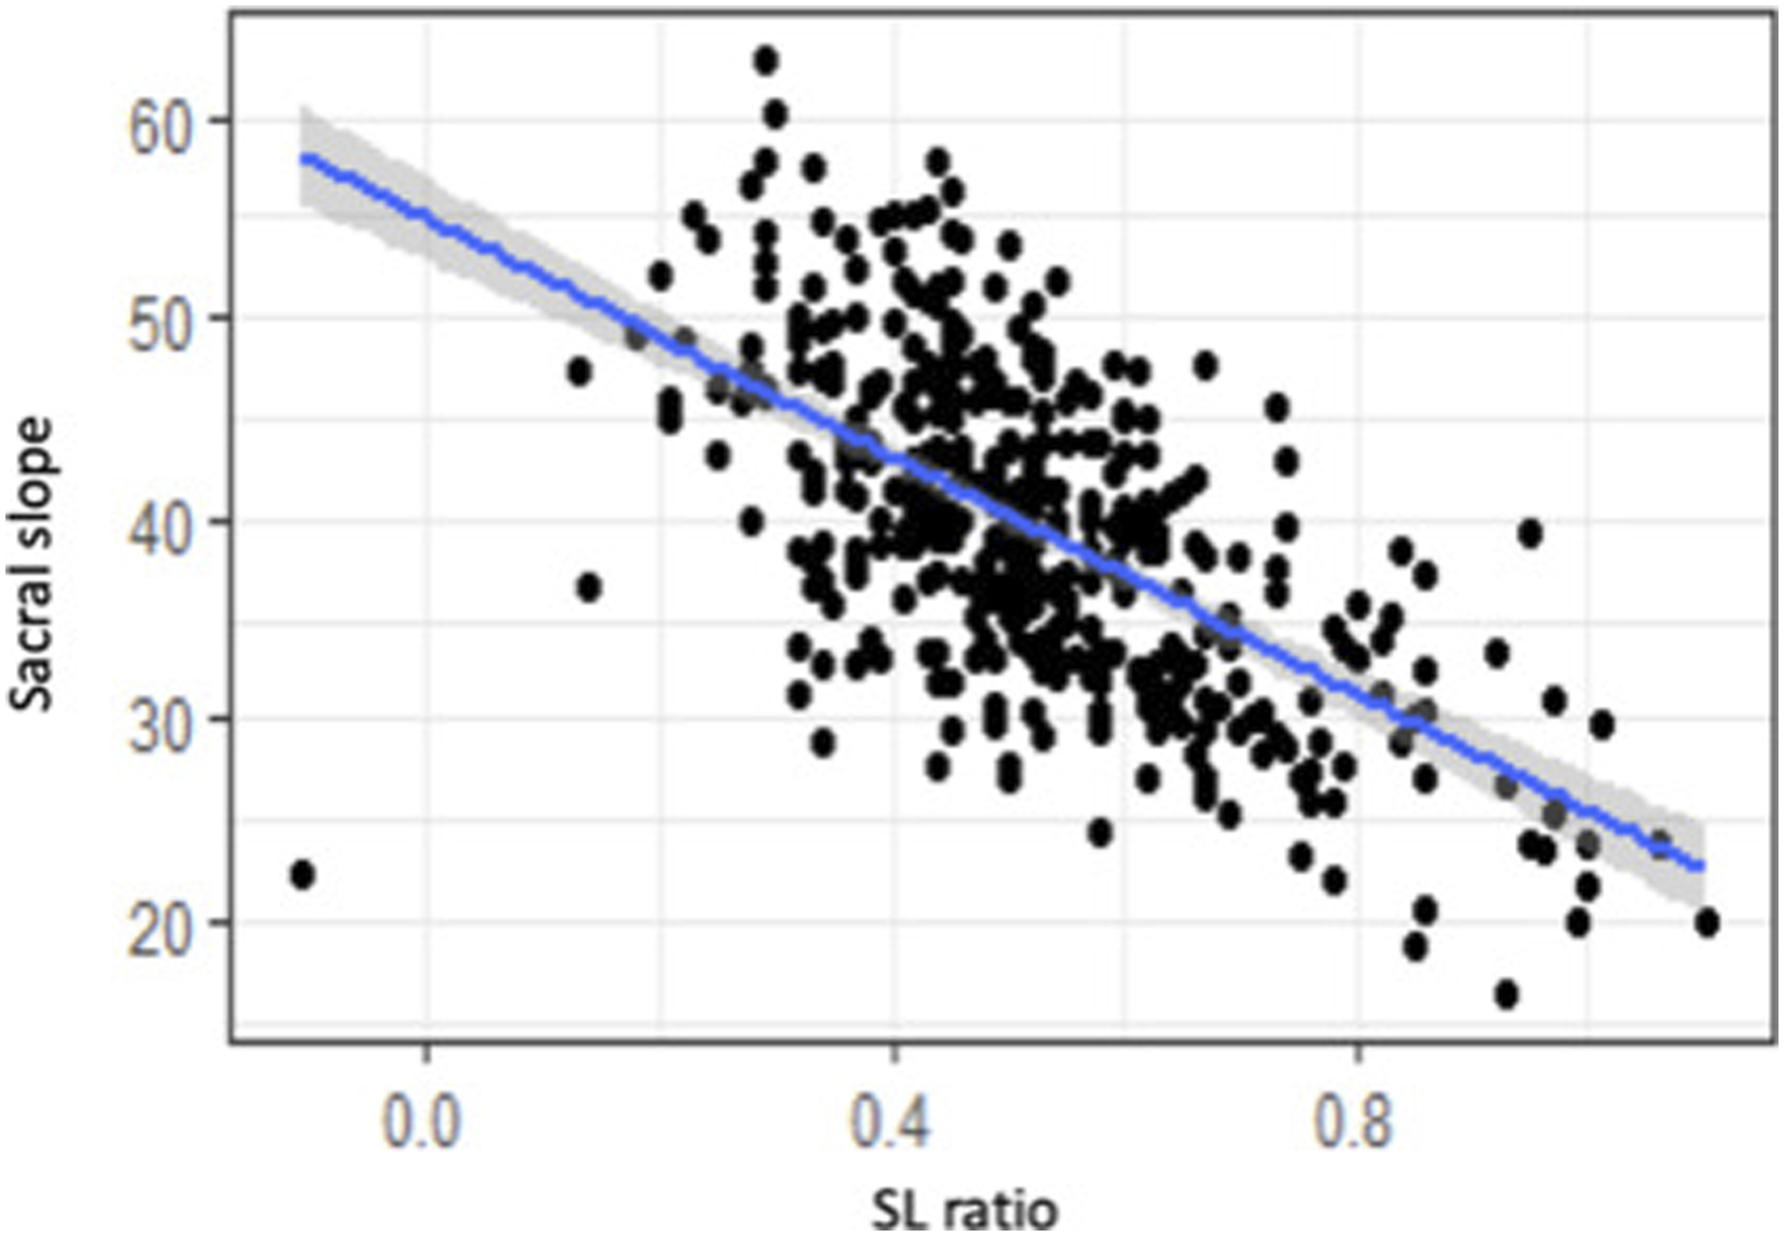
Distribution of SL ratio according to PI and SS is illustrated in Figures 2 and 3. Distribution of SL ratio according to SS by Roussouly’s Classification (type 1 = black, type 2 = red, type 3 AP = yellow, type 3 = green, type 4 = blue). Distribution of SL ratio according to PI by Roussouly’s Classification (type 1 = black, type 2 = red, type 3 AP = yellow, type 3 = green, type 4 = blue).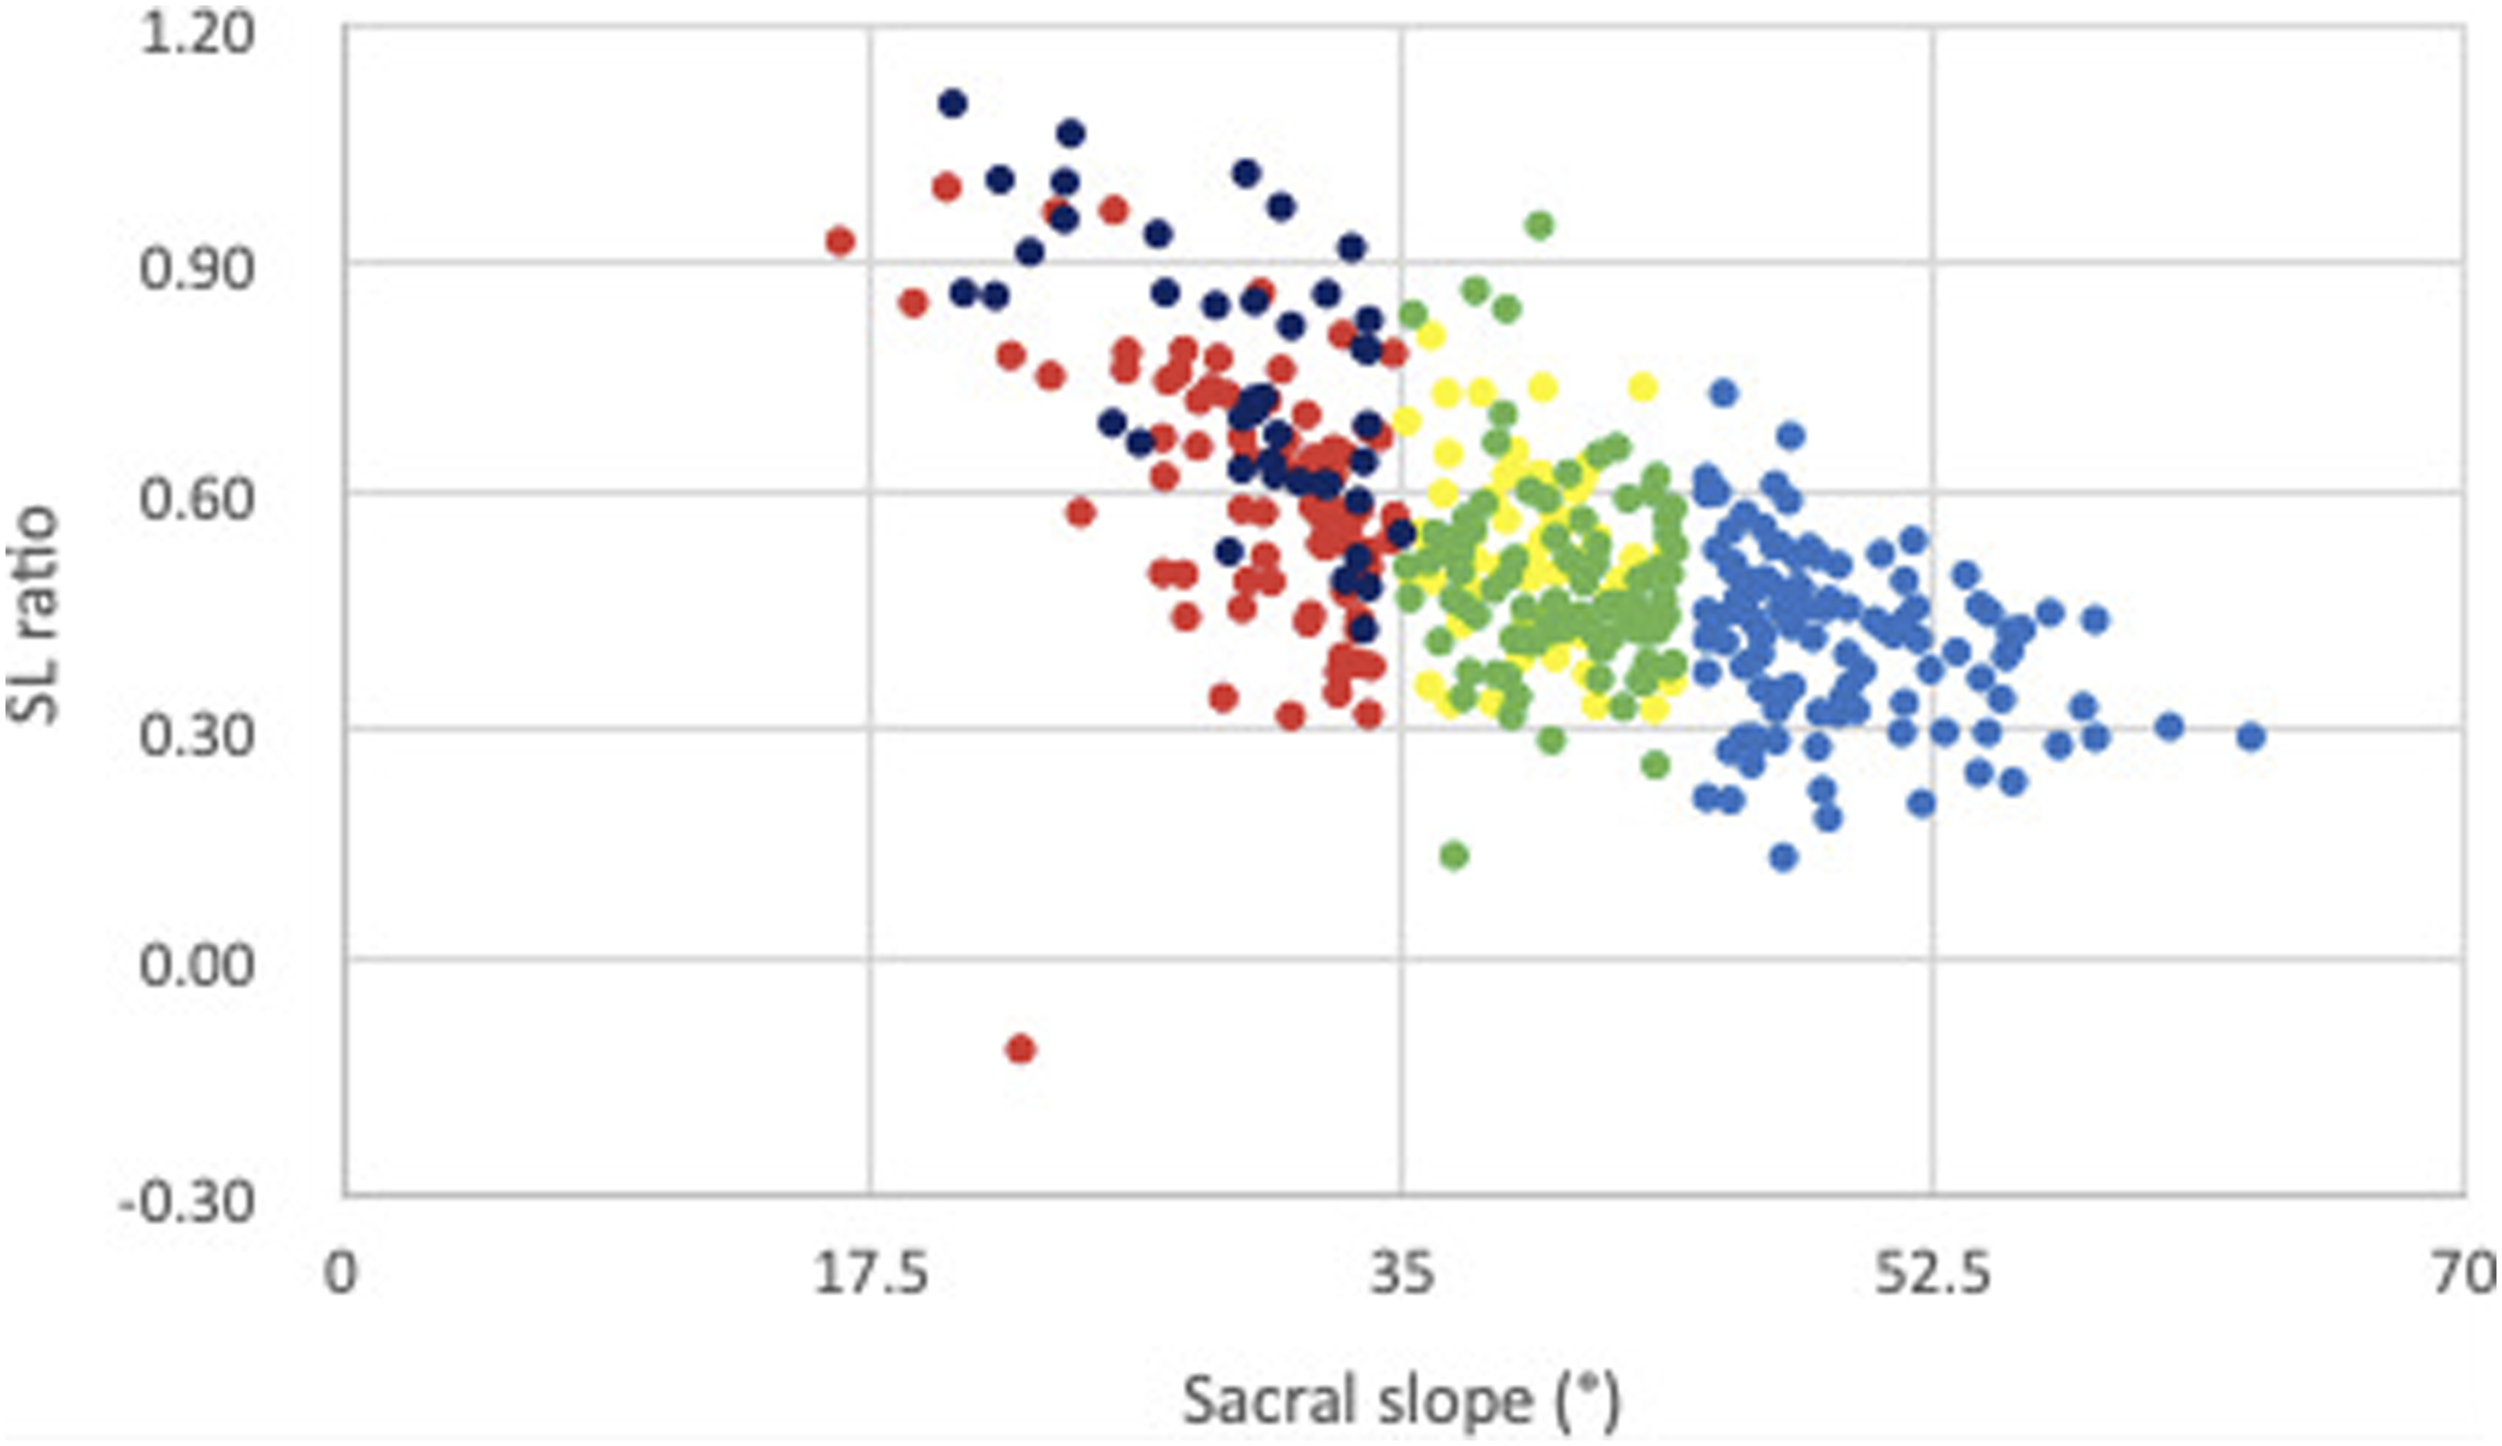
Link Between Spinal Lordosis Ratio (SLR) and Sagittal Profile.
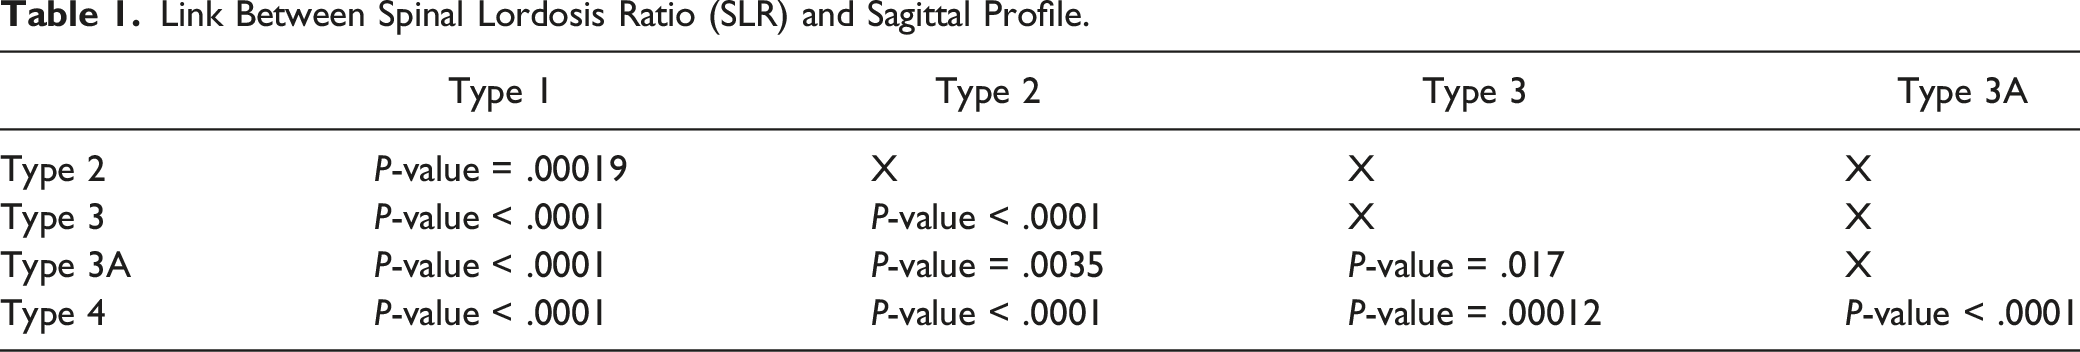
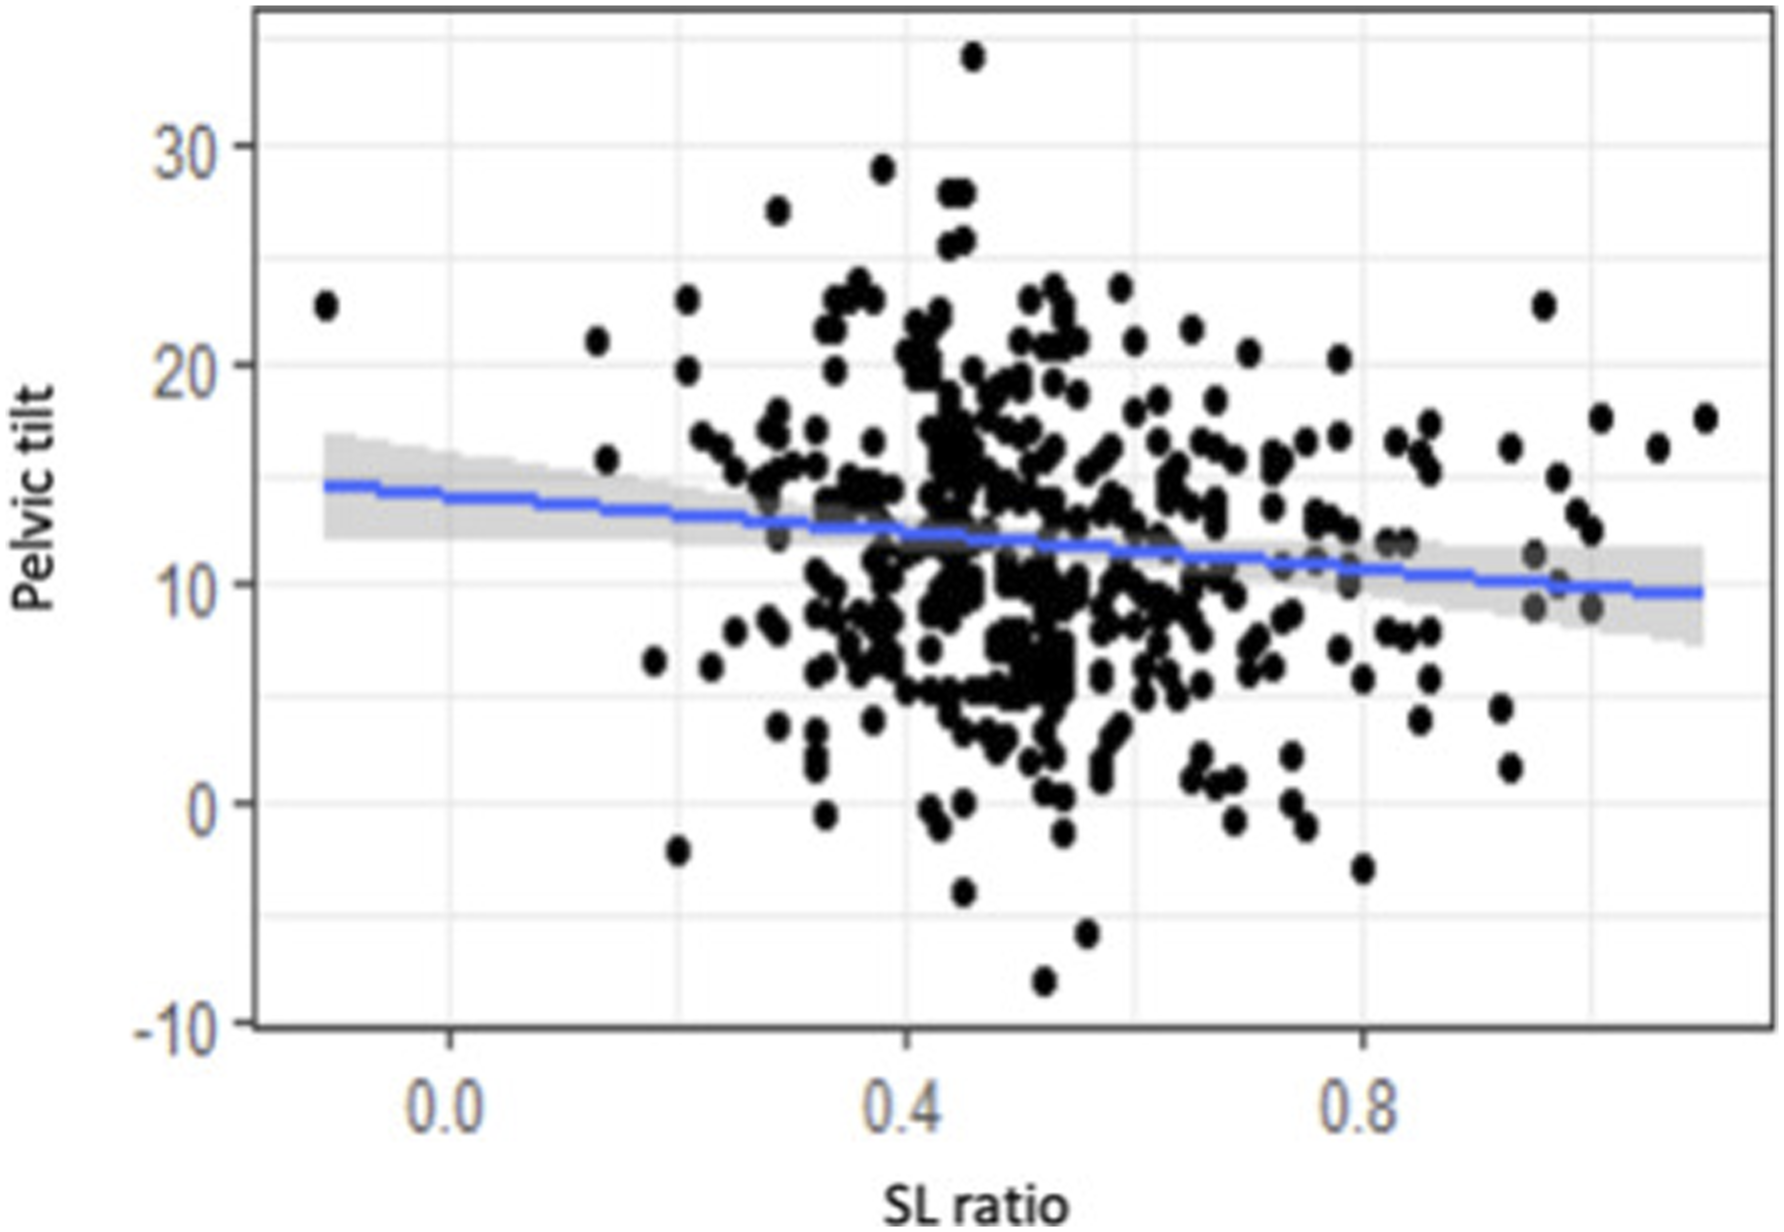
Correlations
For the entire population there is a low correlation between SLR and PT Linear regression between PI and spinal lordosis ratio (SLR). Linear regression between PT and spinal lordosis ratio (SLR). Linear regression between SS and spinal lordosis ratio (SLR). Illustration demonstrating each type of spine according to Roussouly’s classification and its corresponding LL, lower arc and SL ratio.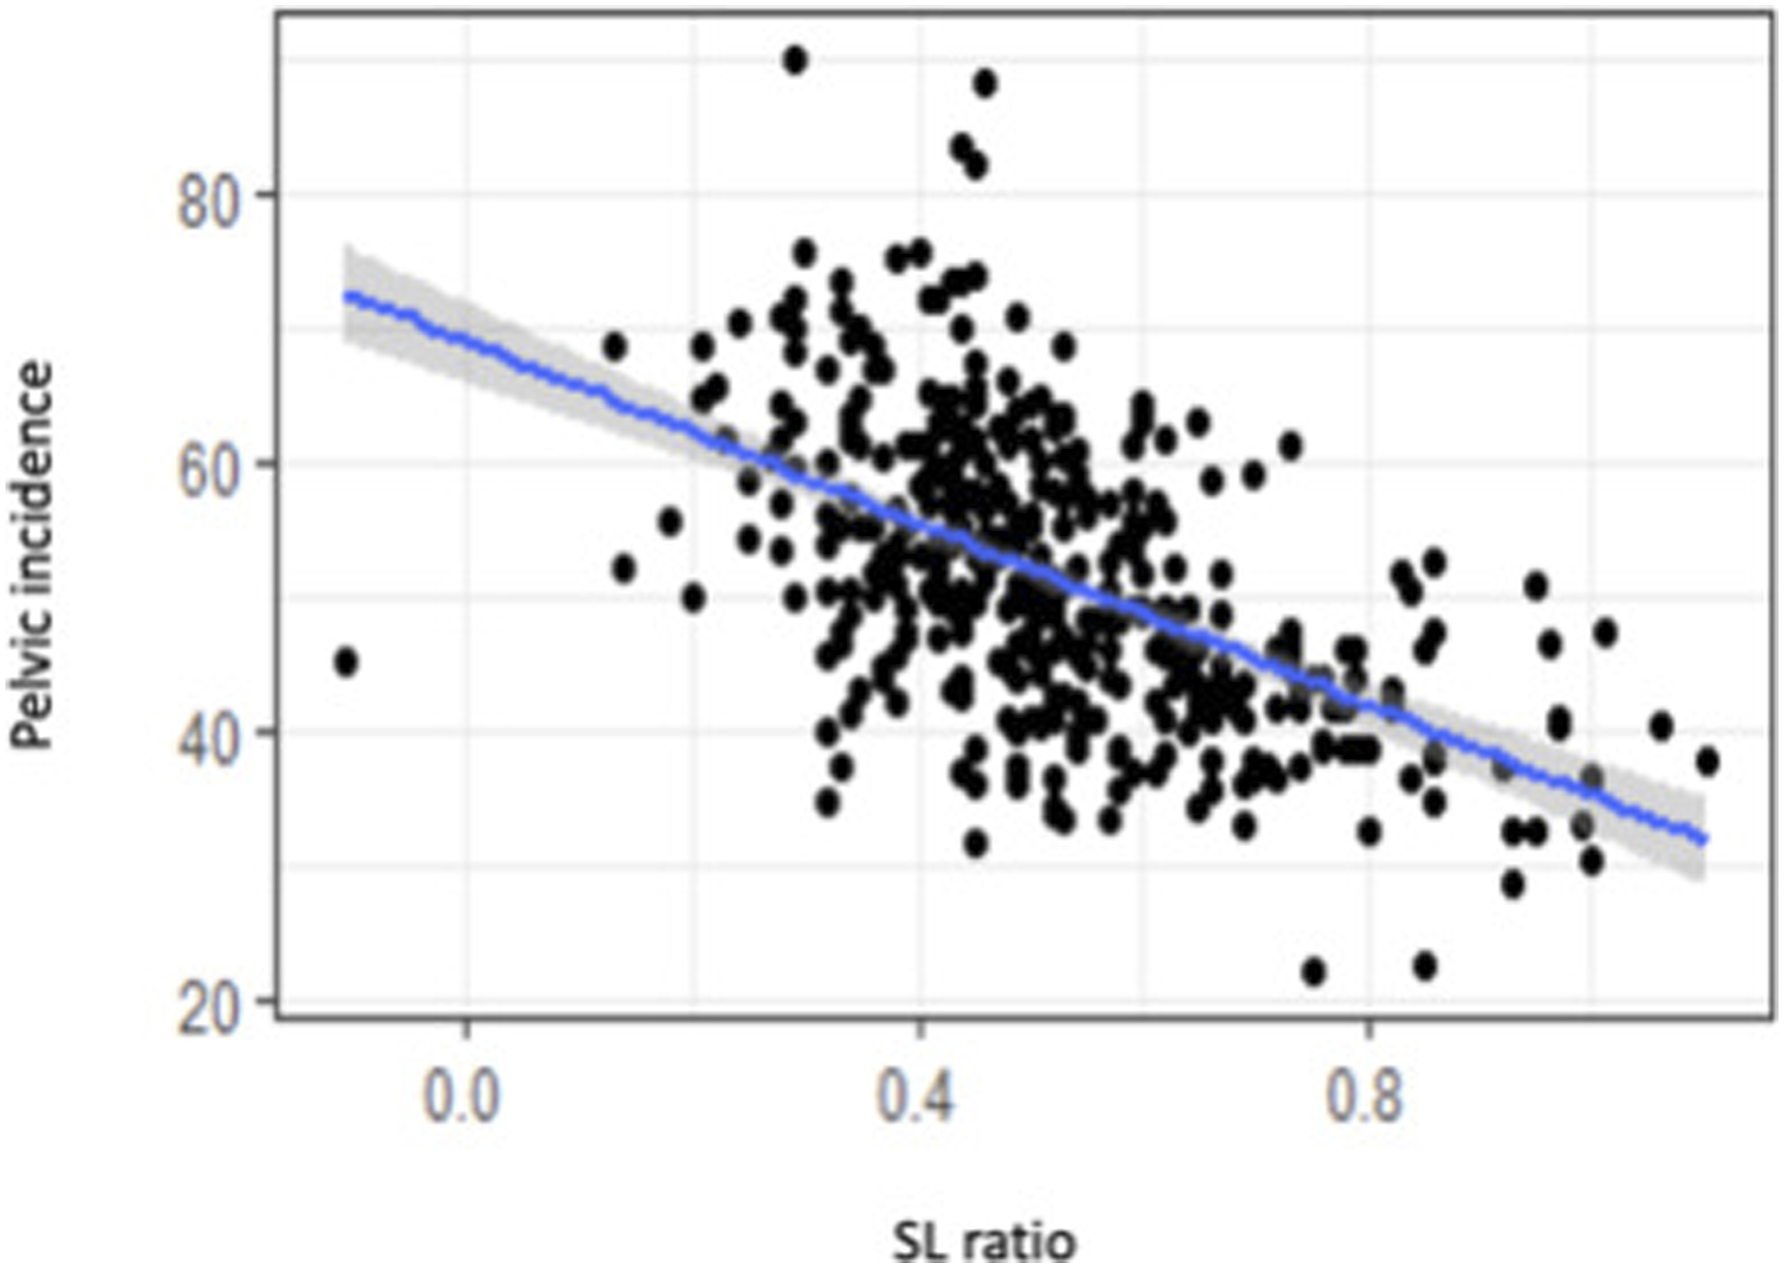
Discussion
Since the Hippocrates era, the boundaries of spinal curves between lordosis and kyphosis has been anatomically determined between T12 and L1. 1 The main measurement of LL was the angle between the sacral plate and T12-L1 disc. Since then, numerous correlations between LL angle and pelvic balance parameters have been published9,11-15; among them the correlation between PI and LL, which became a key factor for treatment strategy of spinal balance restoration thus resulting in the PI = LL value being the ultimate reference for spinal-pelvis balance evaluation.16,17 However, numerous complications have been known to happen which affects this balance, the best example being Proximal Junctional Kyphosis (PJK), despite restoration of a perfect angle of LL according to the PI = LL relationship.18,19 Even if statistically, based on average values, LL seemed to follow PI in a direct relation, this no longer holds true for particular values of PI, and differences between high and low PI were found to be significant.5,8 Another point was to determine the border of lumbar lordosis and thoracic kyphosis based on where the curves transitioned resulting in a reciprocal curves length variation (not fixed at L1-S1). Instead of LL described by only one angle (with an anatomically described fixed length: L1-S1), SL was described by one angle between the Inflexion Point and S1, and one length (number of vertebrae). At the same time some authors emphasised the importance of focusing the spinal lordosis curve on the distal part of lumbar spine. 19
In our study, based on Berthonnaud’s spinal lumbar segmentation we demonstrated that in a normal situation there is a geometrical curve rationing inside the SL itself. It was found that the UAL (between the perpendicular to the tangent on the Inflexion point and the horizontal through the Apex) is almost always constant around 20°. This means that variation of SL angle is mainly dependent on SS value following the equation: SL = SS + 20°. This relation explains the very strong correlation between SL and SS (r = .89). 7
Following Roussouly’s spinal sagittal alignment classification we support that there are various SL shapes in terms of PI. Even though the previous PI = LL rule seemed to work in the majority of patients, we have demonstrated that there are variations in each type of spinal lordosis. The greatest change was observed in patients with Type 1 spines where UAL was higher with a larger vertebra range. This demonstrated the Type 1 specificity where SS was very low and SL was mainly dependant on the UAL. We can understand that this higher UAL explains the corresponding Thoraco-Lumbar Kyphosis. In regards to Type 2, 3, 4, spines, there was a slight variation of UAL with a similar small variation in each Type.
Following this study, we conclude that, lumbar lordosis should not only be defined by one global angle, but also by its length and rationing of its angles. In order to define this angle rationing in a normal situation we propose using a SLR of the intrinsic angles (upper and lower arcs) as a reference for SL restoration in surgical planning.
What is the importance of restoring the upper and lower arc angles separately and as close as possible to the original spinal type and not just restoring the global lumbar lordosis ? Following Berthonnaud’s description, for a single global angle of SL, we can construct two models of spinal lordosis rationing: the first with the lordosis ratio in a normal situation (UAL = 20°), and the second with increasing UAL (eg: 30°) and reciprocal decreasing LAL to obtain the same global angle. As UAL = LAK (lower angle of thoracic kyphosis) the second (higher) UAL construct leads to an increased lower thoracic kyphosis. This is a common situation in degenerative spines with distal discopathies (involving L4/5, L5/S1) that results in a loss of distal lordosis (thus decreasing LAL and SS). When surgical correction and restoration of lumbar lordosis focuses mainly on L2/3 and L3/4 (UAL), based on the LL global angle correction, without correcting the distal lordosis (LAL), this will result in two main consequences: uncorrected sacral slope and proximal junctional kyphosis. This is a result of not correcting the LAL, which results in an uncorrected SS and pelvic retroversion, and also with an increasing UAL it may eventually lead to a proximal junctional kyphosis.
Correct angle rationing in spinal lordosis restoration seems to be a key-point to obtain the correct sagittal balance. To improve the surgical strategy for lordosis correction in spinal deformity treatment we propose a SLR which is easy to measure and corresponds to the patient’s PI, based on an asymptomatic population. Following this study, we hope to demonstrate the possible correlation between an incorrect spinal lordosis rationing and its resulting sagittal balance complications, by collecting a similar set of data in a population of patients with pathological spines.
Footnotes
Declaration of Conflicting Interests
The author(s) declared no potential conflicts of interest with respect to the research, authorship, and/or publication of this article.
Funding
The author(s) received no financial support for the research, authorship, and/or publication of this article.