
Abstract
Study Design:
Retrospective case series.
Objective:
To evaluate if spine measurement software can simulate sagittal alignment following pedicle subtraction osteotomy (PSO).
Methods:
We retrospectively reviewed consecutive adult spinal deformity patients who underwent lumbar PSO. Sagittal measurements were performed on preoperative lateral, standing radiographs. Sagittal measurements after simulated PSO were compared to actual postoperative measurements. A regression equation was developed using cases 1-7 to determine the amount of manual rotation required of each film to match the simulated sagittal vertical axis (SVA) to the actual postoperative SVA. The equation was then applied to cases 8-13.
Results:
For all 13 cases, the spine software accurately simulated lumbar lordosis, pelvic incidence lumbar lordosis mismatch, and T1 pelvic angle, with no significant differences between actual and simulated measurements. The pelvic tilt (PT), sacral slope (SS), thoracolumbar alignment (TL), thoracic kyphosis (TK), T9 spino-pelvic inclination (T9SPi), T1 spino-pelvic inclination (T1SPi), and SVA were inaccurately simulated. The PT, SS, T9SPi, T1SPi, and SVA all change with manual rotation of the film, and by using the regression equation developed with cases 1-7, we were able to improve the accuracy and decrease the variability of the simulated PT, SS, T9SPi, T1SPi, and SVA for cases 8-13.
Conclusions:
Dedicated spine measurement software can accurately simulate certain sagittal measurements, such as LL, PI-LL, and TPA, following PSO. A number of measurements, including PT, SS, TL, TK, T9SPi, T1SPi, and SVA were inaccurately simulated. Our preliminary algorithm improved the accuracy and decreased the variability of certain measurements, but requires future prospective studies for further validation.
Keywords
Introduction
The spine is an essential part of human anatomy that contributes to maintaining energy-efficient posture and balance. 1 Sagittal plane spinal deformity has gained attention for its relationship to health-related quality of life (HRQoL) and disability. 2 -5 The sagittal vertical axis (SVA) represents global sagittal balance, and even minor increases in the SVA correlate to adverse symptoms, underscoring the importance of intervention to prevent deformity progression and restore alignment.
Pedicle subtraction osteotomy (PSO) is a powerful technique that can attain up to 30° to 35° of lordosis, improve clinical outcomes, and correct SVA. 6 -8 PSO procedures are high risk with numerous complications, necessitating accurate preoperative planning. 9 -11 A mathematical model exists to determine the degree of PSO needed for adequate sagittal correction, though it does not account for compensatory mechanisms that influence sagittal balance such as pelvic tilt (PT). 12
A more recently validated formula considers PT, the planned thoracic kyphosis (TK), and planned lumbar lordosis (LL) to predict postoperative SVA. 13,14 While this formula is a useful tool for preoperative planning, it does rely on the assumption that the surgeon will achieve the planned LL and TK. Additionally, these mathematical formulas do not provide a visual depiction of postoperative outcome.
Surgimap Spine (Nemaris Inc, New York, NY) is radiographic analysis software validated for measuring spino-pelvic parameters and capable of simulating a PSO. The accuracy of the PSO simulation remains yet to be determined. 15 One study investigated the software for planning 2-level PSO and concluded it to be inaccurate, while a different study reported a unique simulation method and a single case with accurate results. 16,17 Further exploration of the software’s PSO simulation is required to better understand its potential use in preoperative planning.
Our aim with this retrospective study was to evaluate the capability of this spine measurement software to simulate sagittal alignment measurements following lumbar PSO and to propose a preliminary algorithm to enhance the accuracy of the software simulation.
Methods
Patient Sample
The institutional review board approved this retrospective case series of adult spinal deformity patients who underwent single-level lumbar PSO by a single surgeon at a single center between 2011 and 2015. Demographic and operative data were obtained through the hospital electronic medical record. All patients studied had preoperative and postoperative sagittal radiographs showing landmarks of both femoral heads and the C2 vertebrae. Patients without the appropriate landmarks visible on sagittal standing radiograph were excluded. Measurements were made on the most recent preoperative films and the most immediate postoperative films.
Sagittal Measurements
The sagittal measurements investigated are depicted in Figure 1 and include pelvic incidence (PI), pelvic tilt (PT), sacral slope (SS), lumbar lordosis (LL), pelvic incidence–lumbar lordosis (PI-LL) mismatch, thoracolumbar alignment (TL), thoracic kyphosis (TK), T9 spino-pelvic inclination (T9SPi), T1 spino-pelvic inclination (T1SPi), T1 pelvic angle (TPA), and SVA. The measurements were made using Surgimap (Nemaris Inc, New York, NY), a validated software. 15 The “SA spine” tool was used, in which the user outlines the femoral heads and defines the sacral endplate, the superior endplate of L1, the superior endplate of T1, and the inferior endplate of C2, which produces all the described measurements (Figure 2A). A single user performed all measurements on 3 separate occasions on all preoperative and postoperative films. The user was blinded to which preoperative and postoperative films belonged to each patient as a means to reduce bias in measurements. The average of the 3 separate measurement events on each film was taken for data analysis.
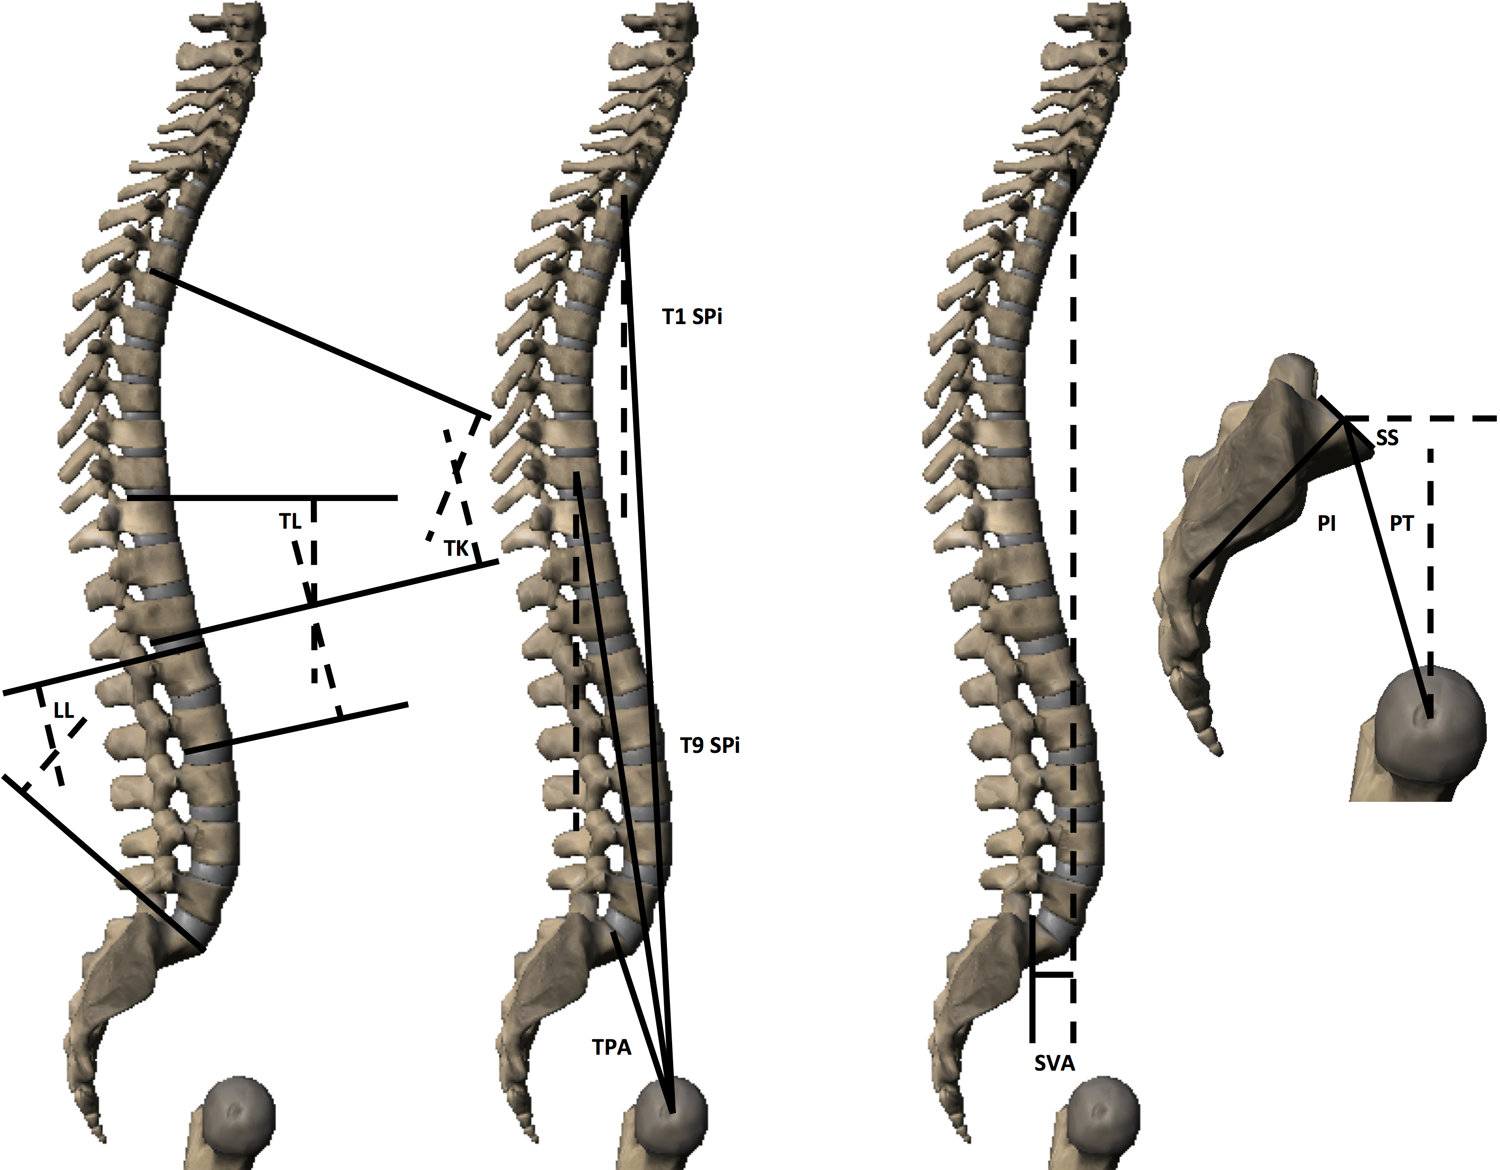
Sagittal measurements collected for the study.
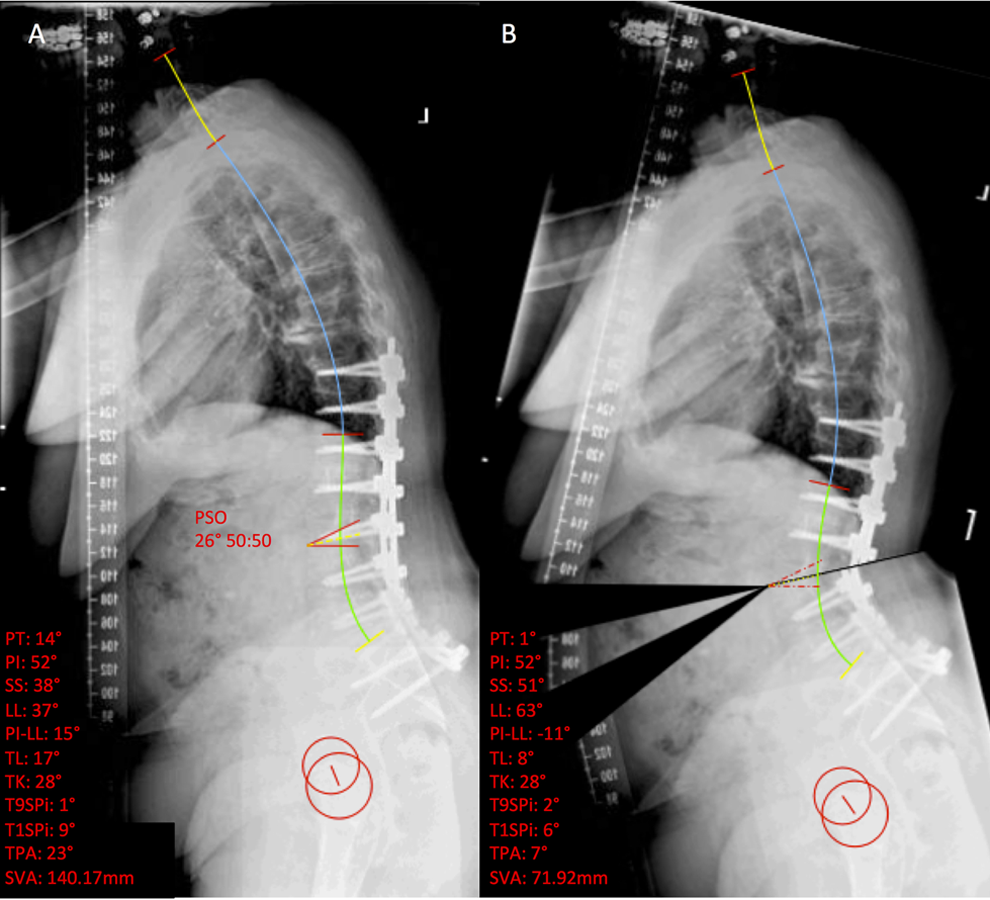
(A) Representative preoperative sagittal standing radiograph with sagittal measurements made with Surgimap. (B) Sagittal radiograph and measurements after simulation of the PSO at L3.
Surgimap PSO Simulation
To simulate a PSO within the software, the “wedge osteotomy” tool is selected. The user then draws 2 lines to create the angle of resection. For our study, the size of the osteotomy was based on the size of the pedicle. The apex of the resection was the center of the anterior side of the vertebral body, and the resection angle was from the posterosuperior corner of the operative vertebral body to just beneath the pedicle (Figure 3). The software has a tool for setting the ratio that each half of the film will be rotated about the osteotomy. We set this to the default of 50:50. Once the simulation is executed, the film is cut and rotated about the apex of the osteotomy, and the preoperative measurements change to the simulated measurements (Figure 2B). We statistically compared the sagittal measurements after PSO simulation to the actual postoperative sagittal measurements for all cases.
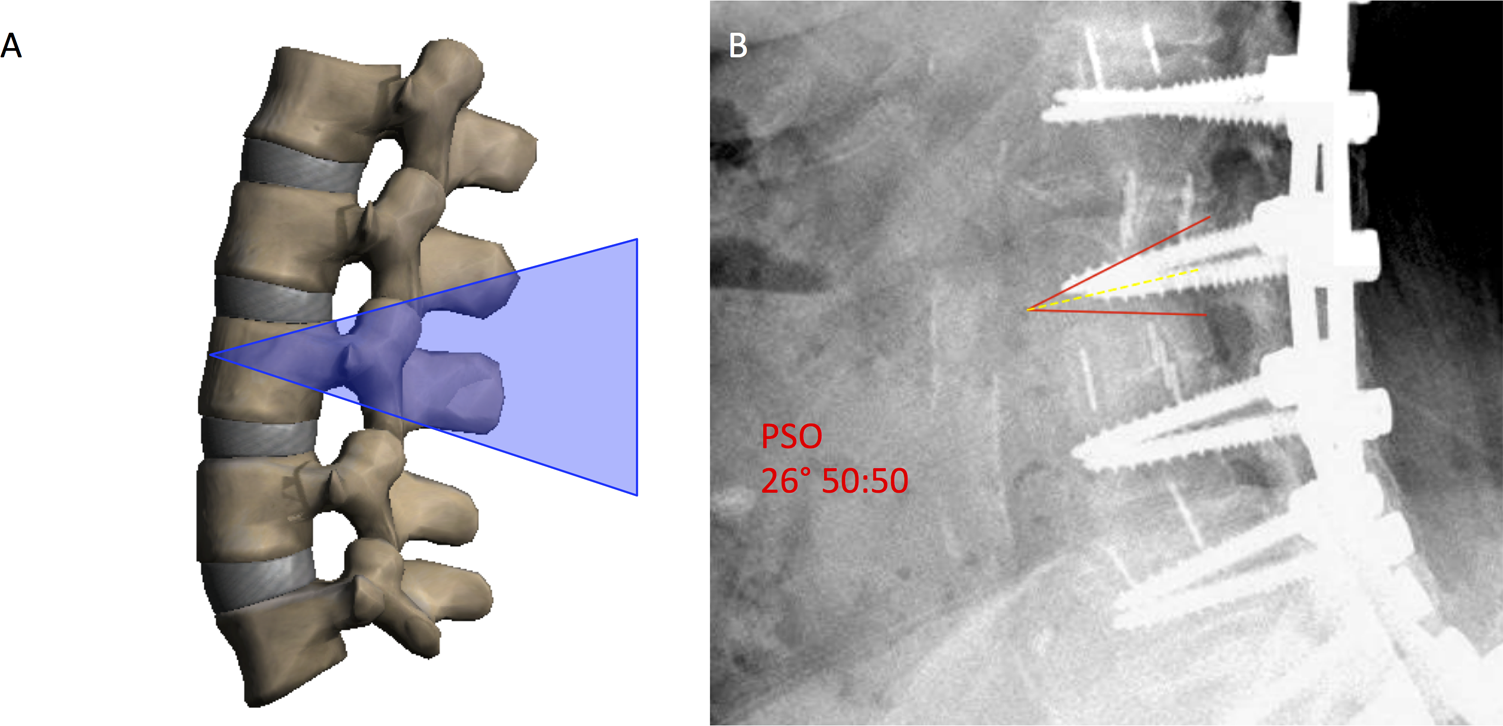
(A) Schematic of representative pedicle subtraction osteotomy. Blue shaded area indicates area of resection, which is the angle between a line from the center of the anterior side of the vertebral body that passes through the posterosuperior corner of the body, and a line from the same point on the anterior side of the vertebral body that passes just beneath the pedicles. (B) Representative PSO depicted in the software.
Manual Rotation of Films After Osteotomy Simulation
The values of any measurement defined by the horizontal or vertical plane will change if the radiograph is manually rotated within the software. Radiographs can be rotated clockwise or counterclockwise degree by degree. The measurements we collected that change with rotation included PT, SS, T9SPi, T1SPi, and SVA. It may therefore be possible to manually rotate each simulated film to achieve a more accurate overall prediction of each measurement. Pelvic incidence, LL, PI-LL, TL, TK, and TPA do not change with manual rotation of the film, and we therefore did not assess them when generating and testing our regression equation.
Generating a Linear Regression Equation for Manual Rotation of Each Film
If manual rotation of the films does improve the accuracy of simulated results, then developing a systematic way to know how much to rotate each film after each simulation is paramount. To do this, we took the angular rotation needed to match the simulated SVA to the actual postoperative SVA for the first 7 consecutive cases and generated a regression equation for this angle versus preoperative SVA (Figure 4). Therefore, the x-axis of a plot for such a regression was preoperative SVA, and the y-axis was the angle the radiograph was rotated following the PSO simulation to match the simulated SVA to the actual postoperative SVA. This regression equation was subsequently validated internally by applying it to cases 8 to 13. We refer to chronologic cases 1 to 7 as group 1 and cases 8 to 13 as group 2.
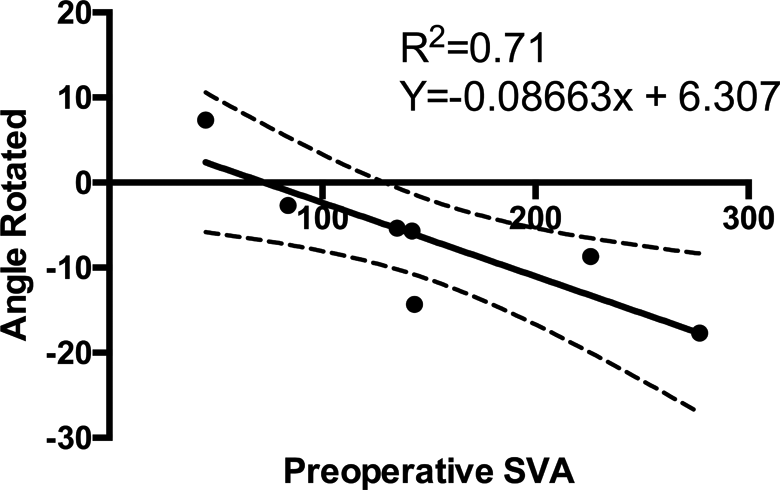
Linear regression with 95% confidence intervals of preoperative SVA versus angle rotated to match the simulated SVA to the actual postoperative SVA for cases 1 to 7.
Validation of the Regression Equation
To test the regression equation developed with group 1, we applied it retrospectively to the subsequent 6 consecutive cases (group 2). The preoperative measurements, osteotomy simulation, and postoperative measurements were all made in the same way as described above. After simulation of the osteotomy, the patient’s preoperative SVA was plugged into the regression equation to determine how much to rotate the simulated film (Figure 5). For the regression equation, we assessed only the sagittal measurements that change with rotation of the film, which were PT, SS, T9SPi, T1SPi, and SVA.
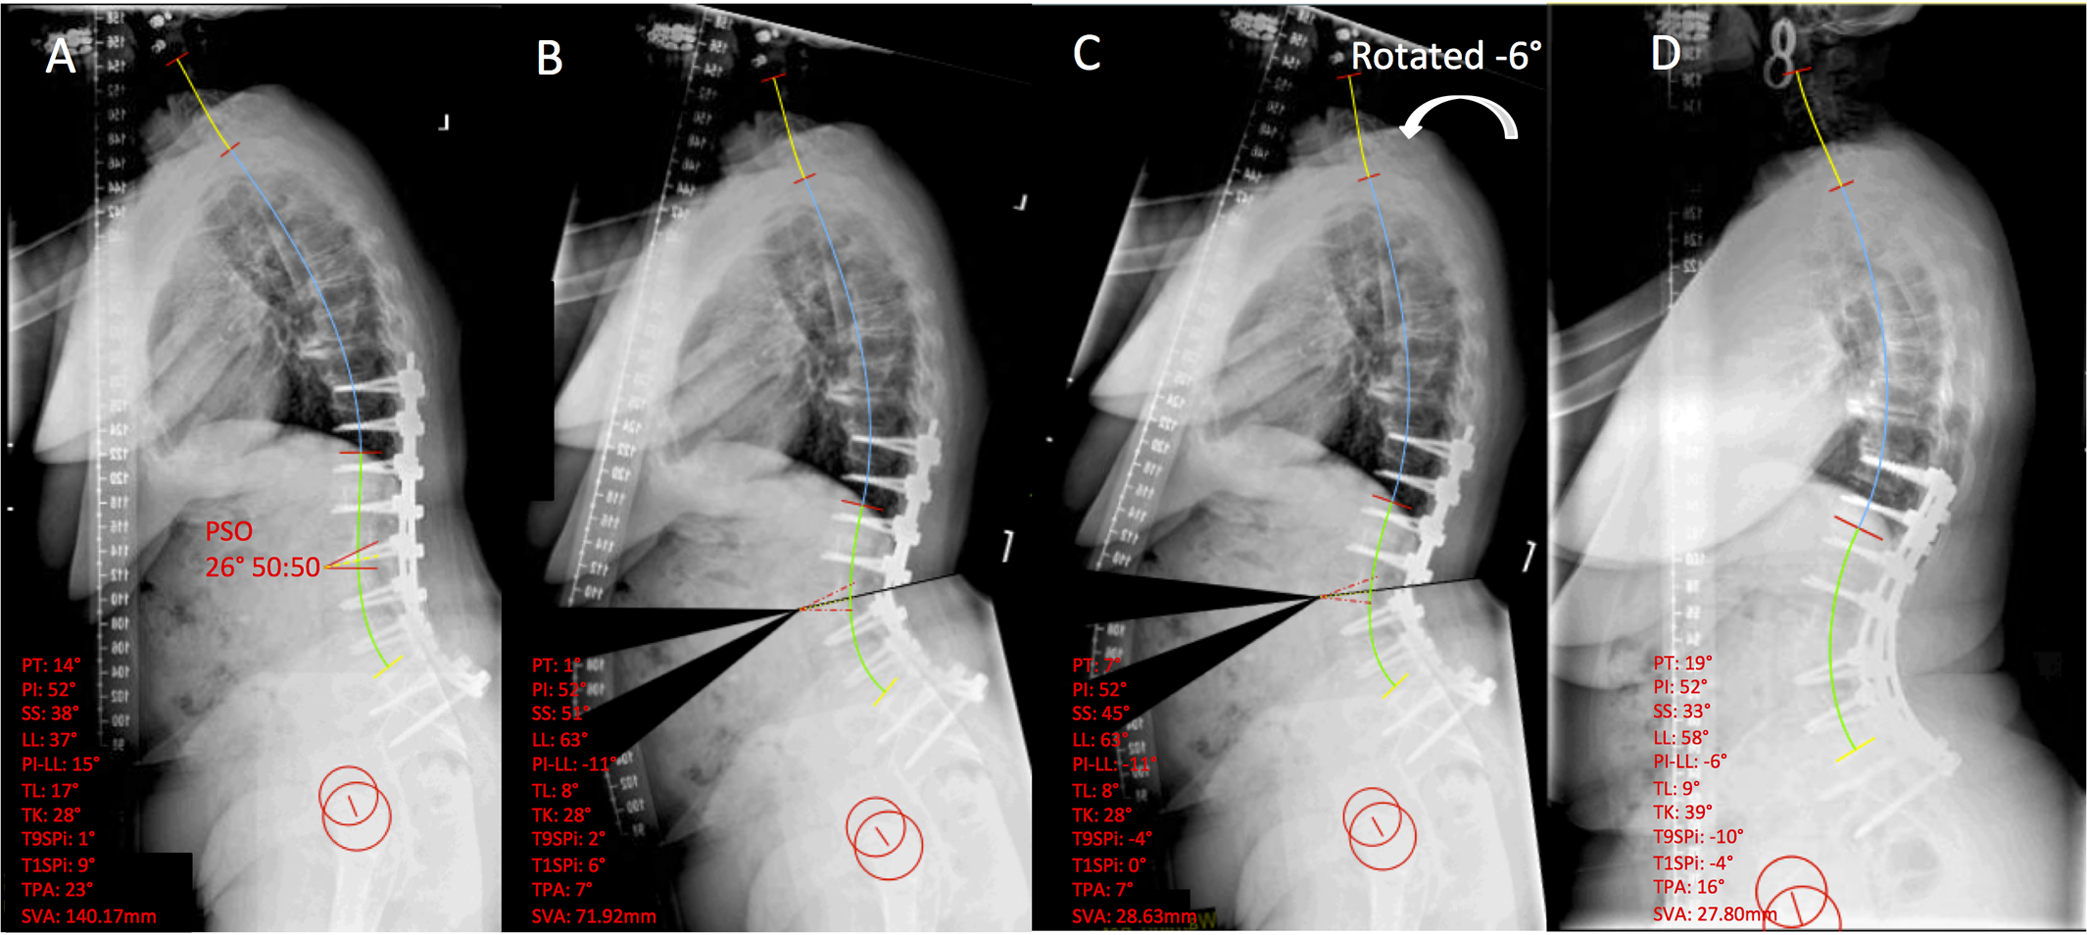
Representative sequence for our preliminary algorithm. (A) Preoperative film with sagittal measurements depicted. (B) Simulated PSO prior to manual rotation of the film. (C) Rotated −6° as dictated by the regression equation y = −0.08663x + 6.307. (D) Postoperative film. Note that only PT, SS, T9SPi, T1SPi, and SVA change with rotation of the film.
Statistical Analysis
All statistical analyses were performed with Prism GraphPad V6 (La Jolla, CA). A nonparametric, paired t test was used to compare each subject’s actual outcome to the simulated outcome. Unpaired t test and Fisher’s exact test were used to compare numerical and categorical data between group 1 and group 2. Statistical significance was taken as a P value <.05.
Results
Patient Characteristics and Preoperative Sagittal Measurements for All 13 Cases
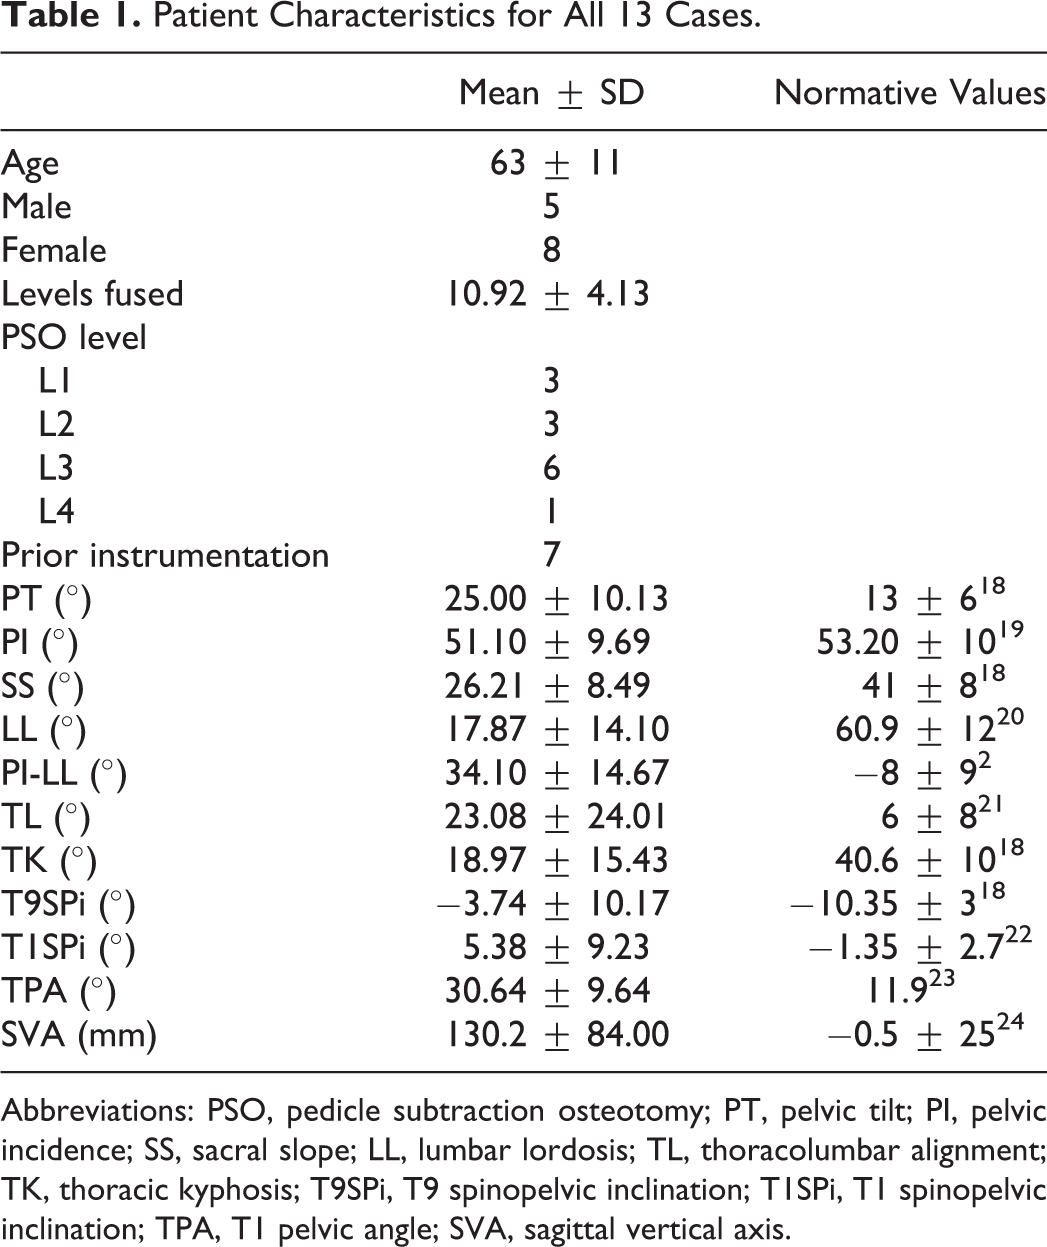
Table 1 summarizes the demographic and operative characteristics of our 13 cases. The average preoperative PT, PI-LL, TL, T9SPi, T1SPi, TPA, and SVA were all abnormally high compared to normative values (Table 1). 2,18 -24 Contrarily, SS, LL, and TK were abnormally low compared to normative values.
Patient Characteristics for All 13 Cases.
Abbreviations: PSO, pedicle subtraction osteotomy; PT, pelvic tilt; PI, pelvic incidence; SS, sacral slope; LL, lumbar lordosis; TL, thoracolumbar alignment; TK, thoracic kyphosis; T9SPi, T9 spinopelvic inclination; T1SPi, T1 spinopelvic inclination; TPA, T1 pelvic angle; SVA, sagittal vertical axis.
Postoperative and PSO Simulated Measurements for All 13 Cases
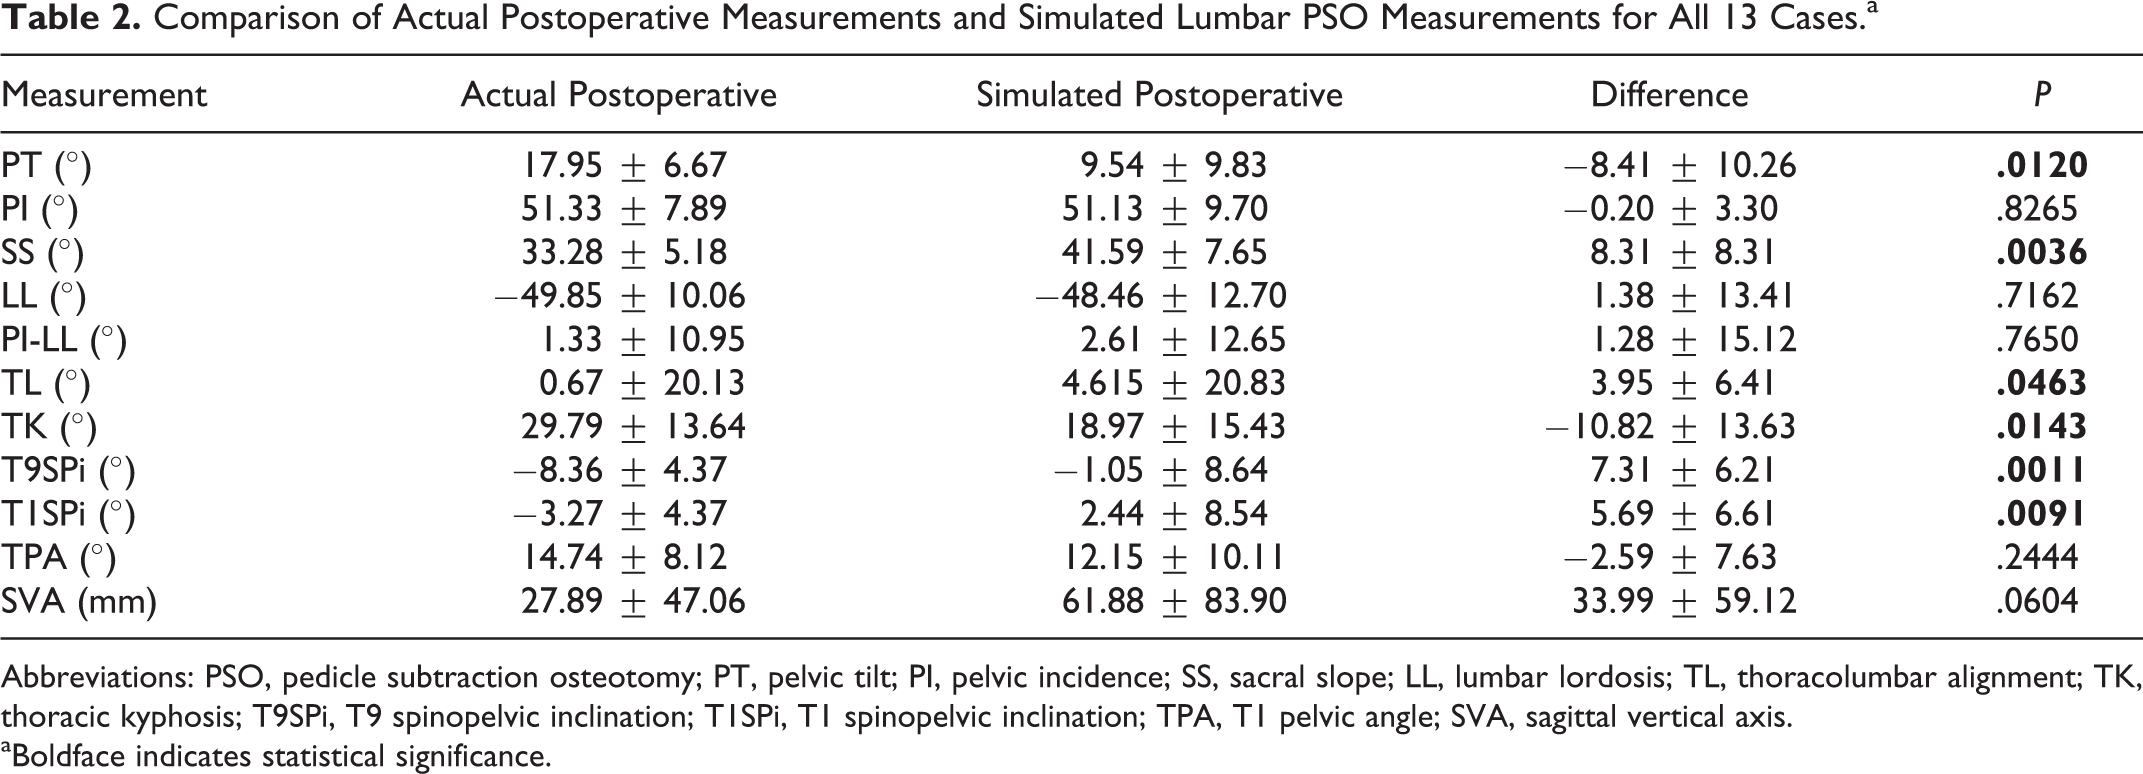
Simulation of lumbar PSO for all 13 cases showed statistically different results compared to the actual postsurgical outcome for PT, SS, TL, TK, T9SPi, and T1SPi. Despite a lack of significance, the simulated SVA was more than 30 mm different from the actual postoperative SVA with a high standard deviation of 59.12 mm (Table 2).
Comparison of Actual Postoperative Measurements and Simulated Lumbar PSO Measurements for All 13 Cases.a
Abbreviations: PSO, pedicle subtraction osteotomy; PT, pelvic tilt; PI, pelvic incidence; SS, sacral slope; LL, lumbar lordosis; TL, thoracolumbar alignment; TK, thoracic kyphosis; T9SPi, T9 spinopelvic inclination; T1SPi, T1 spinopelvic inclination; TPA, T1 pelvic angle; SVA, sagittal vertical axis.
aBoldface indicates statistical significance.
Generation of Regression Equation Using Group 1
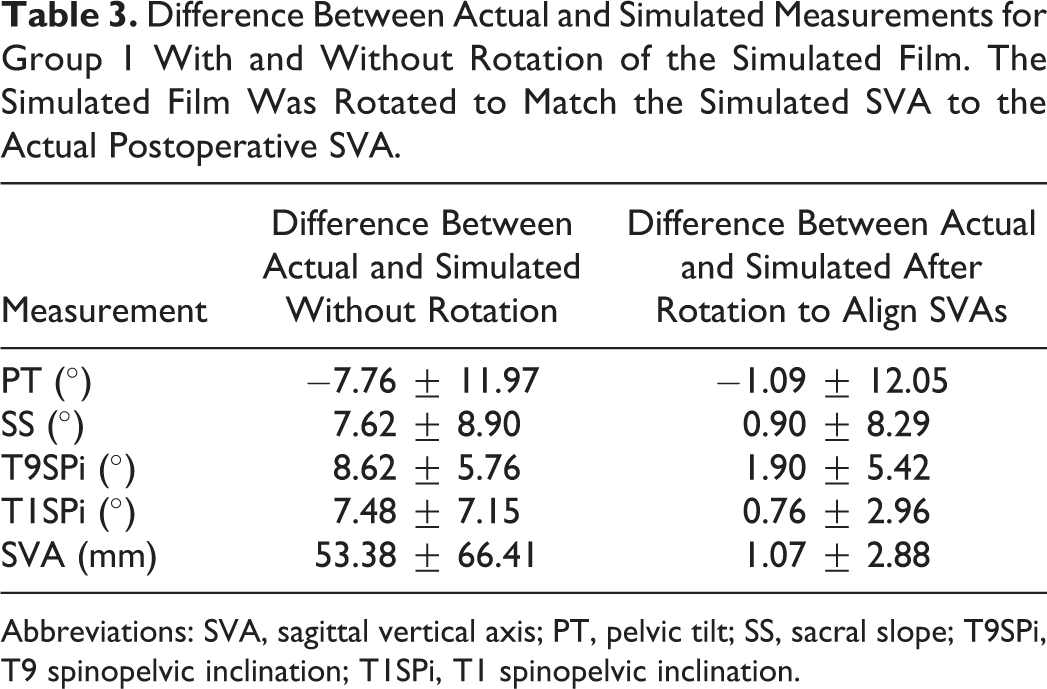
Several of the sagittal measurements change with manual rotation of the simulated film within the software, namely, PT, SS, T9SPi, T1SPi, and SVA. After manual rotation of the film to match the simulated SVA to actual postoperative SVA, all 5 measurements that change with rotation of the film became more accurate (Table 3). The standard deviations of all 5 measurements with the exception of PT also improved, making the predicted values less variable after rotation of the films.
Difference Between Actual and Simulated Measurements for Group 1 With and Without Rotation of the Simulated Film. The Simulated Film Was Rotated to Match the Simulated SVA to the Actual Postoperative SVA.
Abbreviations: SVA, sagittal vertical axis; PT, pelvic tilt; SS, sacral slope; T9SPi, T9 spinopelvic inclination; T1SPi, T1 spinopelvic inclination.
We found a strong, significant correlation between preoperative SVA and angular rotation of the simulated film needed to match simulated SVA to postoperative SVA (R 2 = 0.71; Figure 4). The linear regression equation was y = −0.08663x + 6.307, with x being the preoperative SVA and y being the angle needed to rotate the radiograph after PSO simulation to match the simulated SVA to the actual postoperative SVA.
To test this equation, we simulated the lumbar PSO for group 2, substituted in the preoperative SVA for the x variable for each case, and then rotated each film the proper amount as dictated by the equation. Only the measurements that change with rotation of the films were assessed using the equation, since the accuracy of the other measurements had already been established and do not change based on rotation of the film.
Patient Characteristics and Preoperative Sagittal Measurements of Groups 1 and 2
A summary of the patient demographic and operative characteristics for groups 1 and 2 is presented in Table 4. There were no significant differences between the groups with respect to age, gender, levels fused, diagnosis, PSO level, or prior instrumentation.
Patient Characteristics Between the First 7 Cases Used to Generate the Algorithm and the Subsequent 6 Cases Used to Test the Algorithm.a
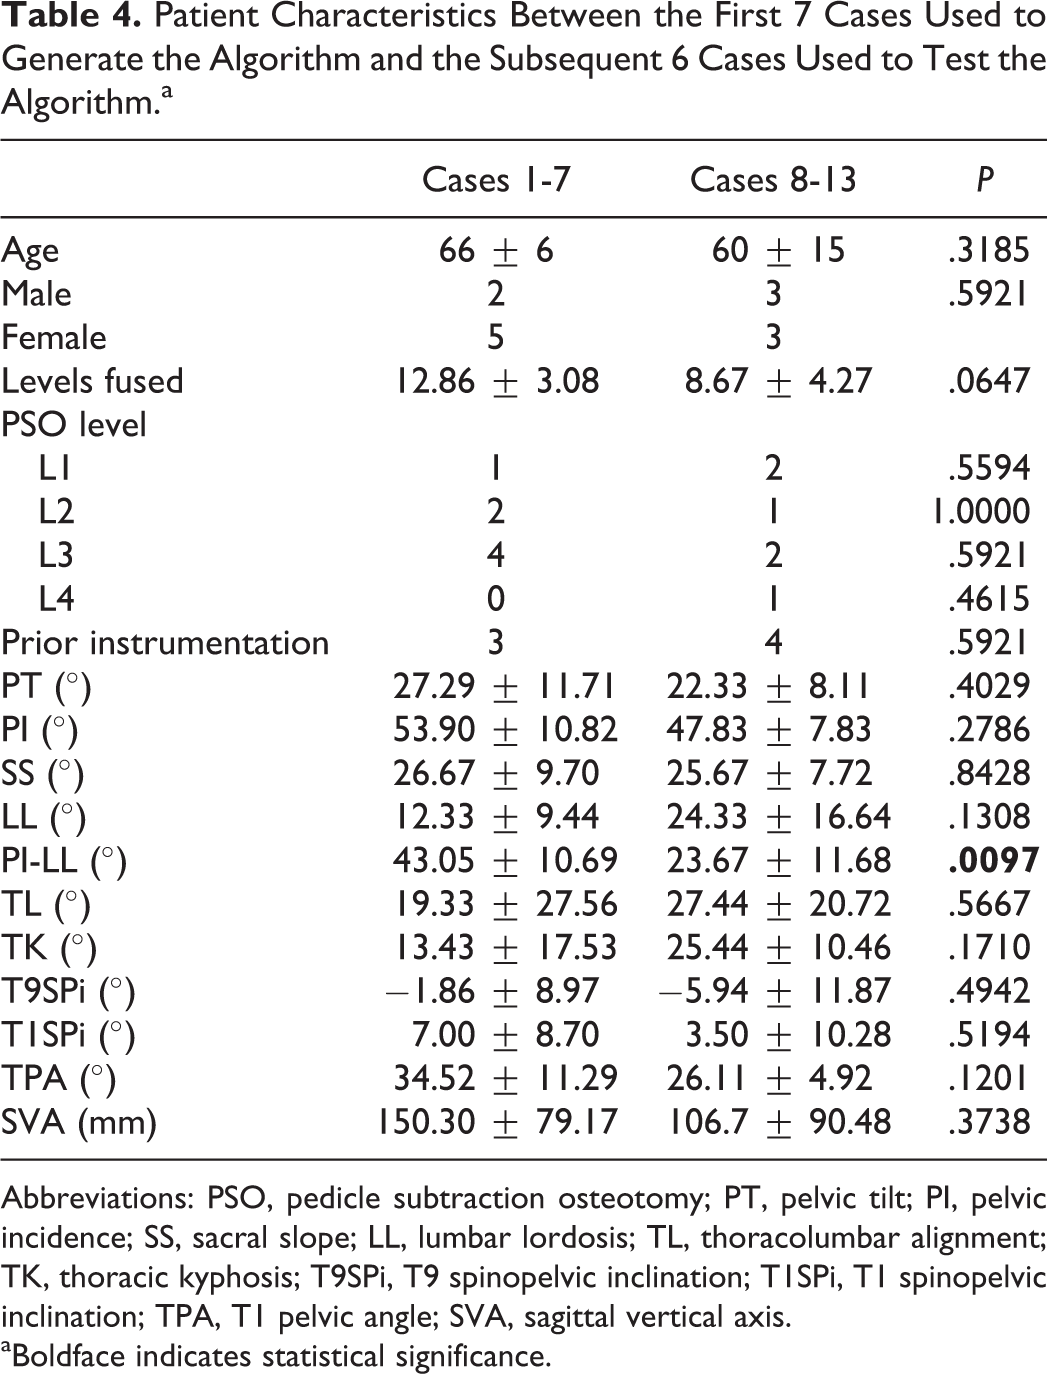
Abbreviations: PSO, pedicle subtraction osteotomy; PT, pelvic tilt; PI, pelvic incidence; SS, sacral slope; LL, lumbar lordosis; TL, thoracolumbar alignment; TK, thoracic kyphosis; T9SPi, T9 spinopelvic inclination; T1SPi, T1 spinopelvic inclination; TPA, T1 pelvic angle; SVA, sagittal vertical axis.
aBoldface indicates statistical significance.
A summary of numerical preoperative sagittal measurements for groups 1 and 2 is presented in Table 4. Both groups of cases had abnormally high preoperative PT, PI-LL, TL, TPA, T1SPi, and SVA. Both groups also had abnormally low SS, LL, and TK. It is important to note that there was a statistically significant difference in PI-LL between group 1 (43.05 ± 10.69) and group 2 (23.67 ± 11.68; P = .0097).
Simulated Sagittal Measurements of Group 2 With and Without Rotation of Films Dictated by the Regression Equation
Without rotation of the simulated films, there was only a significant difference between actual and simulated measurements for SS (Table 5). As already noted and seen in Table 3, when assessing all 13 cases, there was a significant difference between actual and simulated sagittal measurements for PT, SS, T9SPi, and T1SPi.
Group 2 Comparison of Actual Postoperative Measurements to Surgimap Simulated Measurements After PSO With and Without Rotation as Dictated by the Regression Equation.a
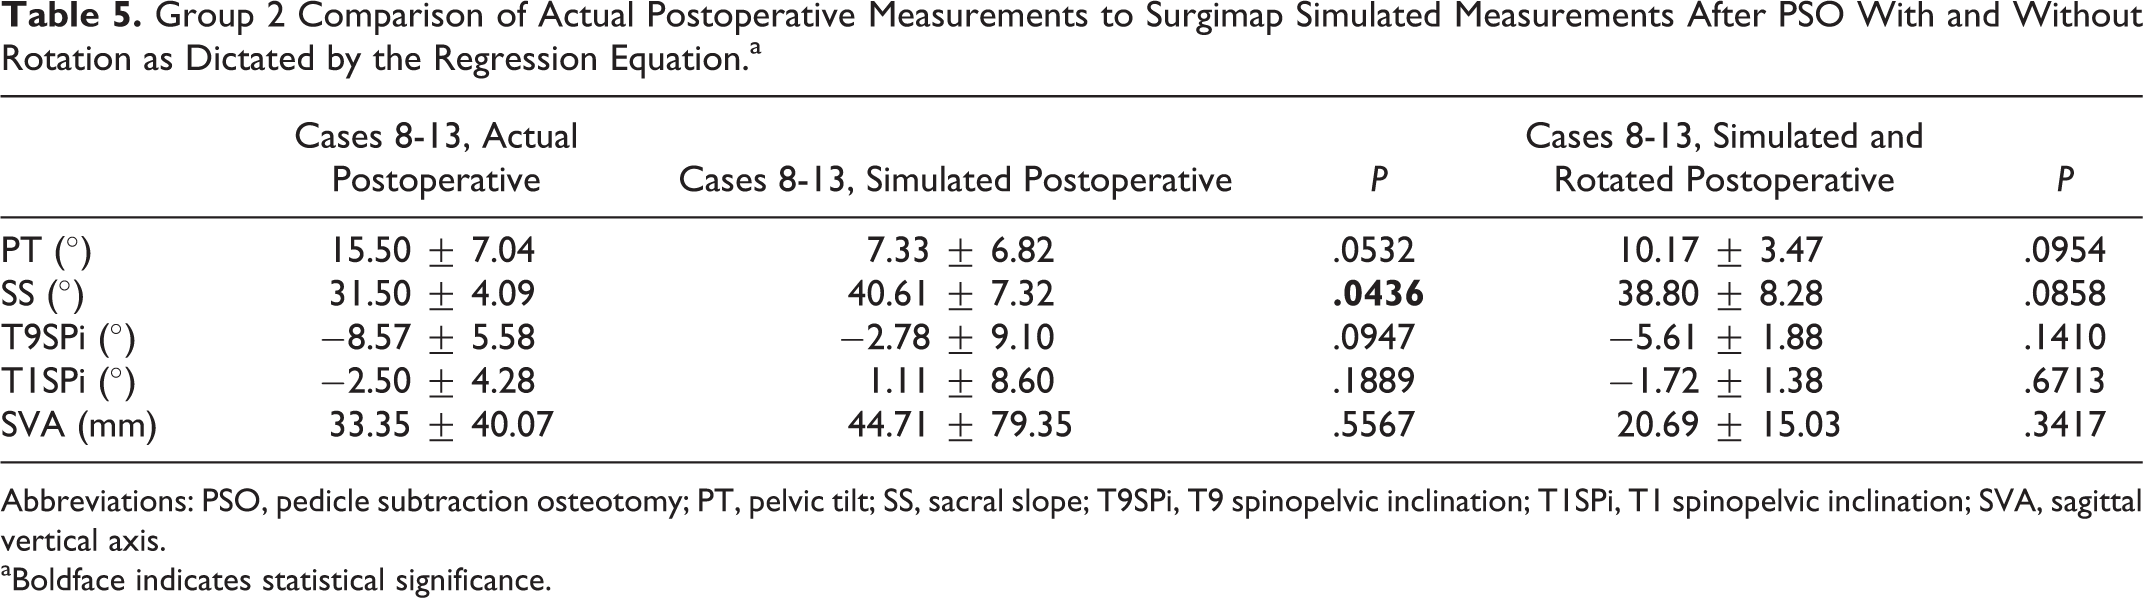
Abbreviations: PSO, pedicle subtraction osteotomy; PT, pelvic tilt; SS, sacral slope; T9SPi, T9 spinopelvic inclination; T1SPi, T1 spinopelvic inclination; SVA, sagittal vertical axis.
aBoldface indicates statistical significance.
After rotation of the films based on the regression equation developed with group 1, every measurement affected by rotation, which includes PT, SS, T9SPi, T1SPi, and SVA, improved in both accuracy and variability with the exception of SVA, which became on average 1.29 mm less accurate, but close to 15 mm less variable (Table 5). Additionally, the difference in actual and predicted SS lost statistical significance after rotation of the films.
Discussion
The aim of this retrospective study was to assess the accuracy of spine measurement software to simulate the sagittal radiographic outcomes following lumbar PSO and to determine if we could develop a systematic method to improve the accuracy of the simulation. Previously validated equations for predicting sagittal alignment following PSO are invaluable tools for osteotomy planning and execution, but none provide a visual representation of postoperative alignment. 12 -14 Our preliminary algorithm and regression equation provides a straightforward visual simulation of postsurgical sagittal alignment following lumbar PSO, albeit with some limitations.
Surgimap was capable of predicting postsurgical PI-LL and TPA even without the additional rotation. The PI-LL has become a focal target of surgical deformity correction for its strong relation to negative HRQoL, disability, and global sagittal imbalance. 2,25 -28 PI-LL is one of the more important measurements to accurately predict if the software is to be used for meaningful preoperative planning. Surgimap accurately simulated the PI-LL in our 13 cases with an average difference from the actual outcome of only 1.28°. TPA is another important representation of spinopelvic alignment that correlates with HRQoL, and it is valuable for surgical planning because it is independent of many postural compensatory mechanisms. 23 The mean difference between actual and simulated TPA was minor (−2.59°) and not statistically significant, suggesting the software can effectively predict postsurgical TPA. The accurate simulation of these 2 measurements suggests the software may be a useful tool for preoperative planning.
It must be noted that a number of simulated sagittal parameters for all 13 cases were statistically different from the actual postoperative parameters with high variability between simulated and actual spinopelvic measurements. These measurements included PT, SS, TL, TK, T9SPi, and T1SPi. The simulated SVA, while not statistically different from the actual, was over 30 mm off target with very high variability (standard deviation of 59.12 mm). Of these inaccurately predicted sagittal measurements, the PT, SS, T9SPi, and T1SPi change with manual rotation of the simulated films. For each degree of film rotation, these measurements also change by a degree, and the magnitude of SVA change depends on each patient.
In order to develop an algorithm to enhance the accuracy of these simulated measurements, we divided our patients into cases 1 to 7 (group 1) and cases 8 to 13 (group 2) based on chronologic date of surgery. Group 1 cases were manually rotated until the SVA of the simulated film was as close as possible to the SVA of the actual postoperative film, and a regression equation was then developed based on preoperative SVA and angular rotation needed to align the SVAs. The regression equation exhibited an R 2 value of 0.71. This equation was subsequently internally validated with patients from group 2.
For group 2, the simulated PT, SS, T9SPi, and T1SPi all became more accurate and less variable after rotation of the simulated films. The SVA became slightly less accurate, but perhaps more important, the difference between the simulated and actual SVA became much less variable, indicating an improvement in precision. Consequently, our algorithm was able to improve the accuracy and precision of many of the predicted sagittal measurements.
The T1SPi and SVA are both important parameters that describe global sagittal balance, and both are related to HRQoL. 5,22 Glassman et al 5 demonstrated the linear correlation of symptom severity with increasing SVA, and Lafage et al 22 found that T1SPi may have a stronger correlation with HRQoL than that of SVA when comparing the coefficient of correlation to Scoliosis Research Society, Oswestry Disability Index, and Short Form-12 outcome scores. The improvement in all of the positional measurements with rotation of the films, especially T1SPi and SVA, demonstrates the benefit of employing our algorithm to the simulation. These findings, coupled with the ability of the software to accurately predict PI-LL and TPA, suggest its potential for preoperative surgical planning.
Two measurements that do not change with rotation of the film, and therefore cannot be improved by our algorithm, were TL and TK. These measurements showed a statistically significant difference between actual and simulated outcomes for all 13 of our cases. An inherent pitfall in the software is the reliance on cutting and pasting the film around the osteotomy site. The thoracic spine remains unchanged with the osteotomy simulation and with rotation of the film, which is why preoperative TK and simulated TK remain unchanged. Mobile segments of the thoracic spine are likely to change with instrumentation, and postural compensation will affect the thoracic spine. The software cannot yet account for these factors, thereby highlighting an important limitation for using it to predict thoracic measurements near the osteotomy site.
The strengths of our algorithm are that the osteotomy size is based on the patient’s vertebral anatomy, and the angular rotation of the film is based on preoperative measurements. It can therefore be applied to every patient. Akbar et al proposed a method of osteotomy planning and prediction using Surgimap by rotating the film to achieve a desired postoperative PT, then simulating the osteotomy based on the angle of additional lordosis needed to achieve a neutral SVA. 16 While the authors found an accurate prediction for a single case, the size of the osteotomy may in fact be impractical for a certain patient’s anatomy. Considering the angle of the osteotomy is the additional lordosis needed, the angle may either be too narrow and resect through the pedicle, or be too large and resect the majority of the vertebral body. Additionally, the technique requires the surgeon to rotate the film to the desired postoperative PT, not what the actual postoperative PT may be.
Our algorithm provides the benefits of a systematic osteotomy execution and film rotation to present the most accurate actual outcome, not what the desired outcome or assumed outcome is. Our results demonstrate that spine measurement software can accurately predict important sagittal measurements such as PI-LL and TPA following a lumbar PSO and that our algorithm improves the accuracy and precision of the PSO simulation for any measurement influenced by rotation of the films.
Limitations
Our study had a small sample size and is relatively underpowered. Our patient sample group is quite heterogeneous, with a variety of preoperative diagnoses and osteotomy levels. These factors may affect how accurate the predictions are and need to be investigated further. It is important to note that the patients in cases 8 to 13 had a statistically different preoperative PI-LL than the patients in cases 1 to 7 and, therefore, may have affected the accuracy of the regression equation. Another limitation of this study is that the linear regression is dependent on multiple assumptions, some of which are necessary to simplify our effort to predict a patient’s postoperative alignment after a PSO. First, our regression equation is based on a specific PSO technique by a single surgeon where the angle of the osteotomy is dependent on the surgeon’s technique and the patient’s anatomy (specifically the location, morphology, and size of the pedicle). Thus, the regression equation may be dependent on these variables. Additionally, a number of patients in this case were reoperations with prior fusion and instrumentation. It may be that simulated and actual spinopelvic parameters such as PT and SS may be significantly different in de novo deformity patients. The reason being that the Surgimap algorithm assumes a 50:50 ratio for the degree each half of the film will rotate about the osteotomy site. Therefore, in patients with increased compensatory pelvic retroversion secondary to significant anterior misalignment (ie, high SVA), this may incorrectly estimate the amount of PT that is restored when lumbar lordosis is restored via means of the PSO.
Conclusions
Our results demonstrate the potential for Surgimap to be used to simulate sagittal alignment outcome following lumbar PSO. The software can accurately simulate the important sagittal measurements of PI-LL and TPA following lumbar PSO, but it has limitations for predictions of the thoracic spine. The software cannot accurately predict a number of positional measurements such as PT, SS, T9SPi, T1SPi, and SVA, but our preliminary algorithm provides a systematic, patient-specific way to improve the accuracy of all of these measurements. Future prospective studies are needed to further develop, strengthen, and validate this preliminary algorithm.
Footnotes
Authors’ Note
This research was approved by the Icahn School of Medicine at Mount Sinai Institutional Review Board.
Declaration of Conflicting Interests
The author(s) declared the following potential conflicts of interest with respect to the research, authorship, and/or publication of this article: Dr Samuel K. Cho has received personal fees from DePuy, Medtronic, Stryker, and Zimmer, all outside of the submitted work.
Funding
The author(s) received no financial support for the research, authorship, and/or publication of this article.