
Abstract
Study Design
Retrospective cohort study.
Objectives
Development, validation, and decision curve analysis of a novel tool (NZSpine) for modelling risk of complications within 30 days of spine surgery.
Methods
Data was gathered retrospectively from medical records of patients who underwent spine surgery at a single tertiary centre between January 2019 and December 2020 (n = 488). Postoperative adverse events were classified objectively using the Comprehensive Complication Index (CCI). The model was derived using backward stepwise logistic regression. Validation was undertaken using bootstrap resampling. Discrimination was determined by calculating the area under the receiver operating characteristic (AUC). Calibration was assessed graphically. Clinical utility of the model was assessed using decision curve analysis (DCA). Performance measures were compared to an existing tool, SpineSage.
Results
Overall complication rate was 34%. Modelling showed higher age, surgical invasiveness and preoperative anemia were most strongly predictive of any complication (OR = 1.03, 1.09, 2.1 respectively, P < .001), whereas the occurrence of a major complication (CCI >26) was most strongly associated with the presence of respiratory disease (OR = 2.82, P < .001). At validation, the model showed good discrimination with an AUC of .73 (.71 - .75) and excellent calibration. SpineSage had an AUC of .71, while DCA showed the novel model had greater expected benefit at all risk thresholds.
Conclusion
NZSpine is a novel risk assessment tool for patients undergoing acute and elective spine surgery and may help inform clinicians and patients of their perioperative risk.
Introduction
Patient understanding of perioperative risk is a critical component of shared decision making for surgical procedures. 1 Traditionally, specific estimations of risk tend to be based on overall incidence in large clinical series. Individualization of risk profile according to surgical and patient-specific factors is a clear improvement on such methods, and significant modelling efforts have been undertaken to address this 2
Several models exist for predicting risk of postoperative complications after spine surgery3–6 however the majority have been developed in US cohorts. 2 Geographic variation in healthcare funding, socioeconomic level and ethnic makeup may mean that such models are not generalizable to other settings. In addition no current models for postoperative complications have incorporated an assessment of clinical utility (decision curve analysis, DCA), which is a standard element of model development,7–9 possibly due to poor awareness or understanding of these methods within the field. 10
Furthermore, there is poor agreement between both patients and surgeons as to what constitutes a significant complication. 11 Existing tools have used a priori definitions of major complication, or provided estimates for the risk of any complication,3–5 however we felt a patient may question the relevance of a risk estimate in which minor complications eg postoperative electrolyte abnormalities, and major complications such as emergent revision surgery, are treated equally.
The aim of this current study is to describe derivation, internal validation, and decision curve analysis of a model for predicting the risk of significant adverse events, as determined by a validated measure of complication severity. 12
We compared our model with SpineSage which we have shown in unpublished work to be the most reliable existing model for our population.
Methods
This study was approved by our institutional Clinical Audit Support unit, approval number 4091. We followed the recommendations set out in the Transparent Reporting of a multivariable prediction model for Individual Prognosis or Diagnosis (TRIPOD) statement for predictive modelling methodology. 13
Source of Data
Data was gathered retrospectively from medical records for a cohort of 488 patients who underwent spine surgery between January 2019 and December 2020 at a tertiary referral centre in New Zealand. Data collection occurred in a first pass for predictor variables, and a second pass for outcome, but formal blinding was not possible. Sample size was based on an anticipated 10 variables in the final model, necessitating an outcome incidence of 100. 7 Patients were considered eligible if they underwent spine surgery, as defined by a Surgical Invasiveness Index (SII) >0. 14
Outcome
A complication was considered to have occurred if there was any deviation from the expected postoperative course, with cumulative severity classified using the Comprehensive Complication Index (CCI). 12 The CCI is a continuous, validated measure of complication severity that also allows for cumulative morbidity of multiple complications to be assessed. 12 We considered a significant complication as a cumulative severity equivalent grade III or greater, and we treated this as the primary outcome. We further classified complications by organ system, death, or a return to the operating theatre.
Predictors
We selected variables for the model a priori if they were deemed clinically relevant based on experience, previously published evidence or if they were known confounders.15,16 Only variables available to the clinician in the preoperative period were included.
Candidate variables we considered were age, gender, ethnicity, body mass index (BMI), preoperative diagnosis, acuity of surgery, revision surgery, smoking status, renal impairment, autoimmune disease, chronic steroid use, respiratory disease, hypertension, cardiac disease, diabetes, pre-existing malignancy, psychiatric diagnosis, preoperative anaemia (haemoglobin concentration <130 g/L for males, <120 for females), 17 and preoperative hypoalbuminaemia (albumin concentration <35 g/L). 18 Invasiveness of surgery was determined using SII. Age, BMI, and SII were classified as continuous variables, while anaemia and hypoalbuminaemia were classified as categorical.
Variables collected that were not included in the model due to co-dependence were level of surgery, approach, procedure, and American Society of Anaesthesiologists score (ASA).
Statistical Analysis
Complete case analysis was undertaken as the incidence of missing data was <1%. Univariate association with the primary and secondary outcome was examined using the chi-square test for nominal variables, the Mann-Whitney U test for ordinal variables, and the unpaired t-test for continuous variables. We calculated odds ratios using Nagelkerke’s R2 method. To avoid bias, univariate significance was not considered when selecting factors in the multivariable model. 19
Linear relationship of the continuous variables with the outcome was confirmed using the Box-Tidswell transformation and absence of collinearity with Snee’s method. Departure from linearity was further assessed visually using cubic and quadratic terms.
The initial logistic regression model for significant complications included all candidate variables according to the criteria specified above, then a backward stepwise approach was used to exclude terms that did not show significant association with the outcome according to P value from the Wald test. At each step a log likelihood ratio was calculated to ensure that variable exclusion was not significantly affecting the model. We did not examine interaction terms due to inadequate power. 20 In the final parsimonious model, all factors were statistically significant. Odds ratios were calculated based on regression coefficients in the final multivariable model. A separate model for the occurrence of any complication was created using the same steps.
Performance
Calibration of the model was assessed visually using a plot of observed risk against predicted risk. Discrimination was assessing using the area under the receiver operating characteristic (AUC). To assess the optimism of the model, we drew 1000 samples with replacement from the original cohort, then repeated all model development steps for each bootstrap sample. The average AUC of the bootstrapped models was then compared to the original sample, with the difference between the two representing the optimism of the model. 21 AUC of the model was compared to that of SpineSage using DeLong’s test.
Clinical utility was assessed using decision curve analysis (DCA). DCA determines the “net benefit” of the model as the weighted difference between true positives and false negatives and allows comparison of expected outcome based on model predictions against universal strategies of treating all or no patients. 22 The optimal strategy is represented by the greatest net benefit across a range of acceptable risk.
Analysis was undertaken using R, version 1.4.
Results
Baseline Surgical and Demographic Information.
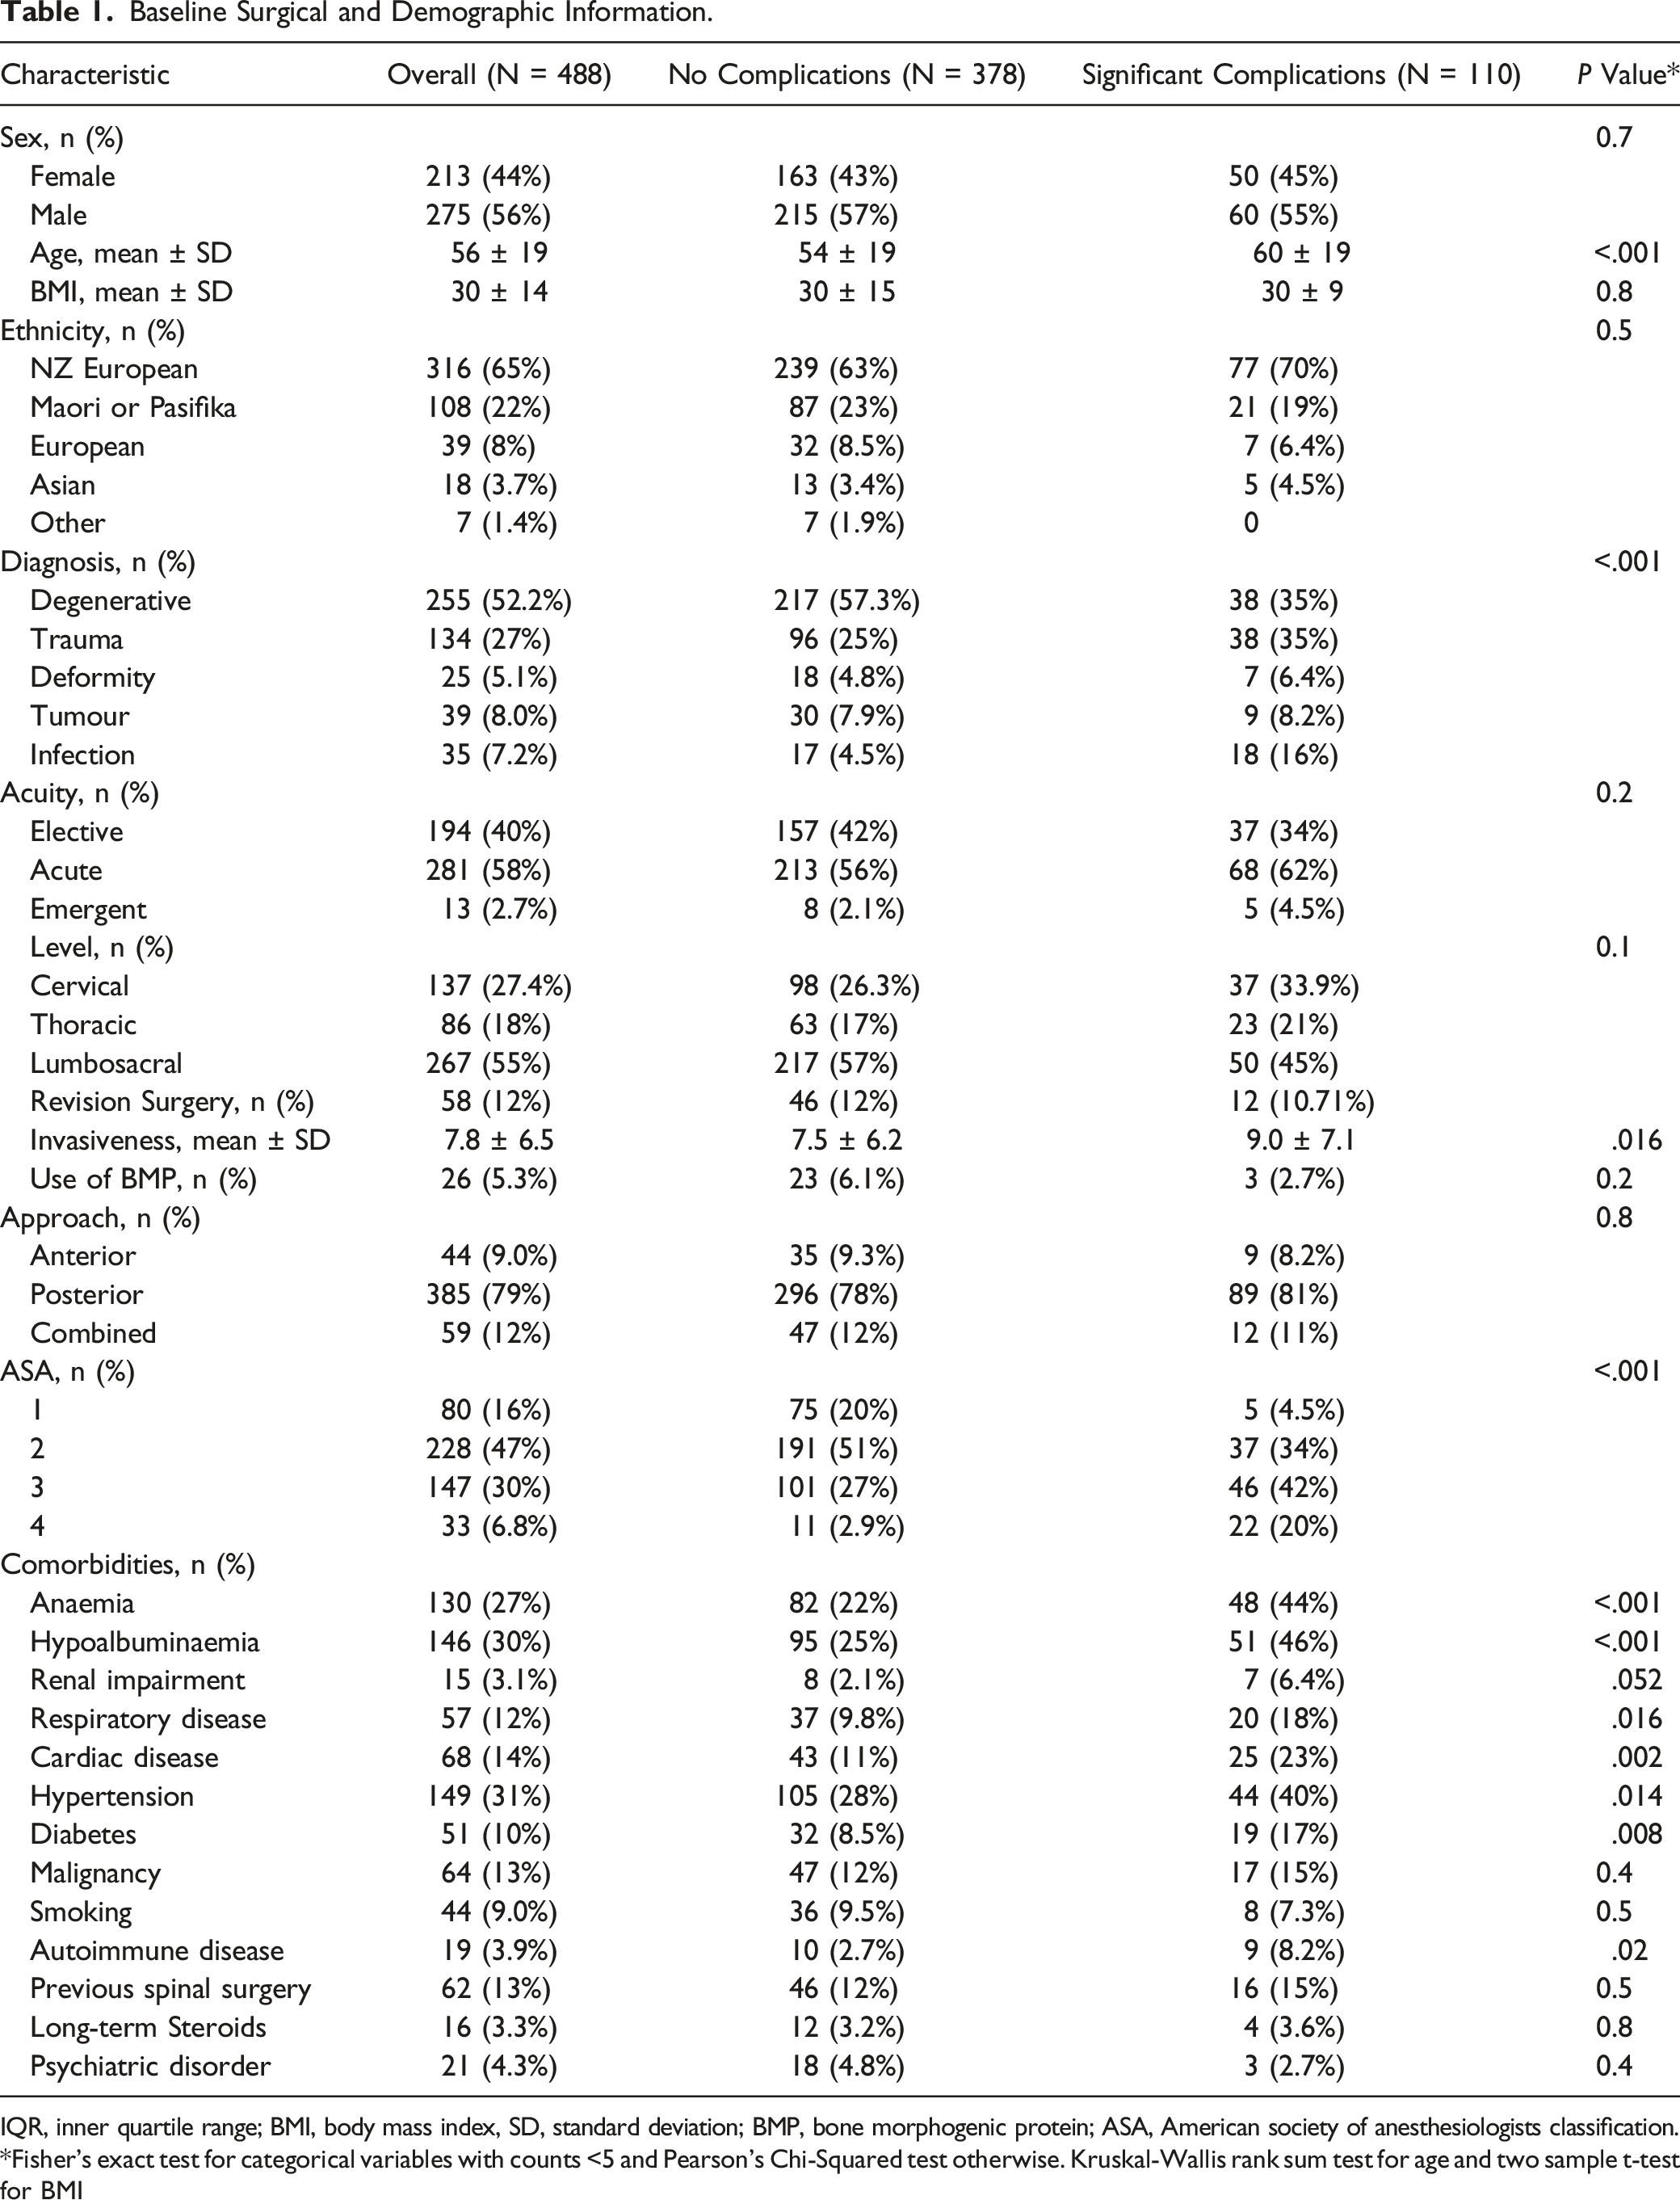
IQR, inner quartile range; BMI, body mass index, SD, standard deviation; BMP, bone morphogenic protein; ASA, American society of anesthesiologists classification.
*Fisher’s exact test for categorical variables with counts <5 and Pearson’s Chi-Squared test otherwise. Kruskal-Wallis rank sum test for age and two sample t-test for BMI
Incidence of complication subgroups.
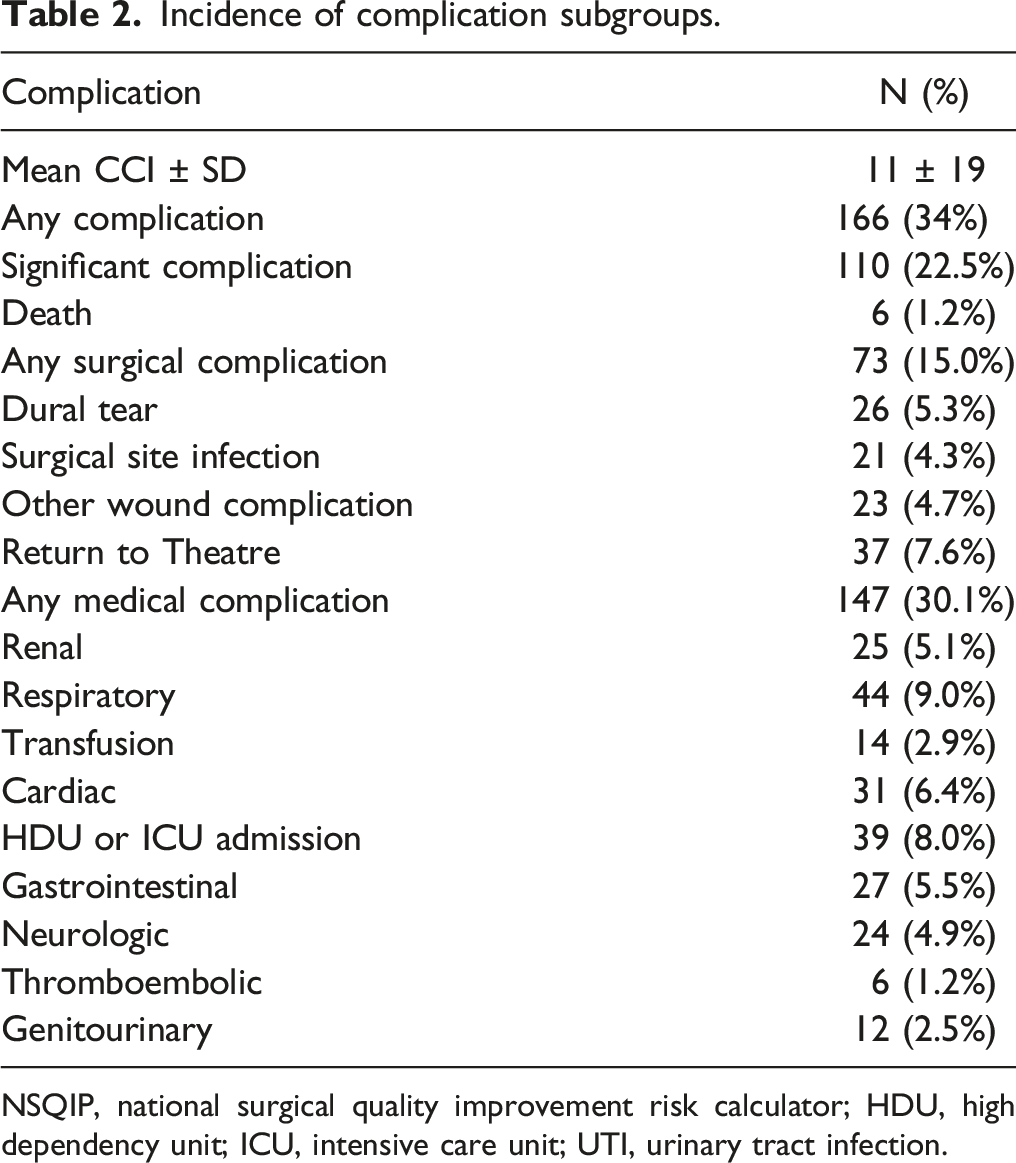
NSQIP, national surgical quality improvement risk calculator; HDU, high dependency unit; ICU, intensive care unit; UTI, urinary tract infection.
Univariate Analysis for Any Complication.
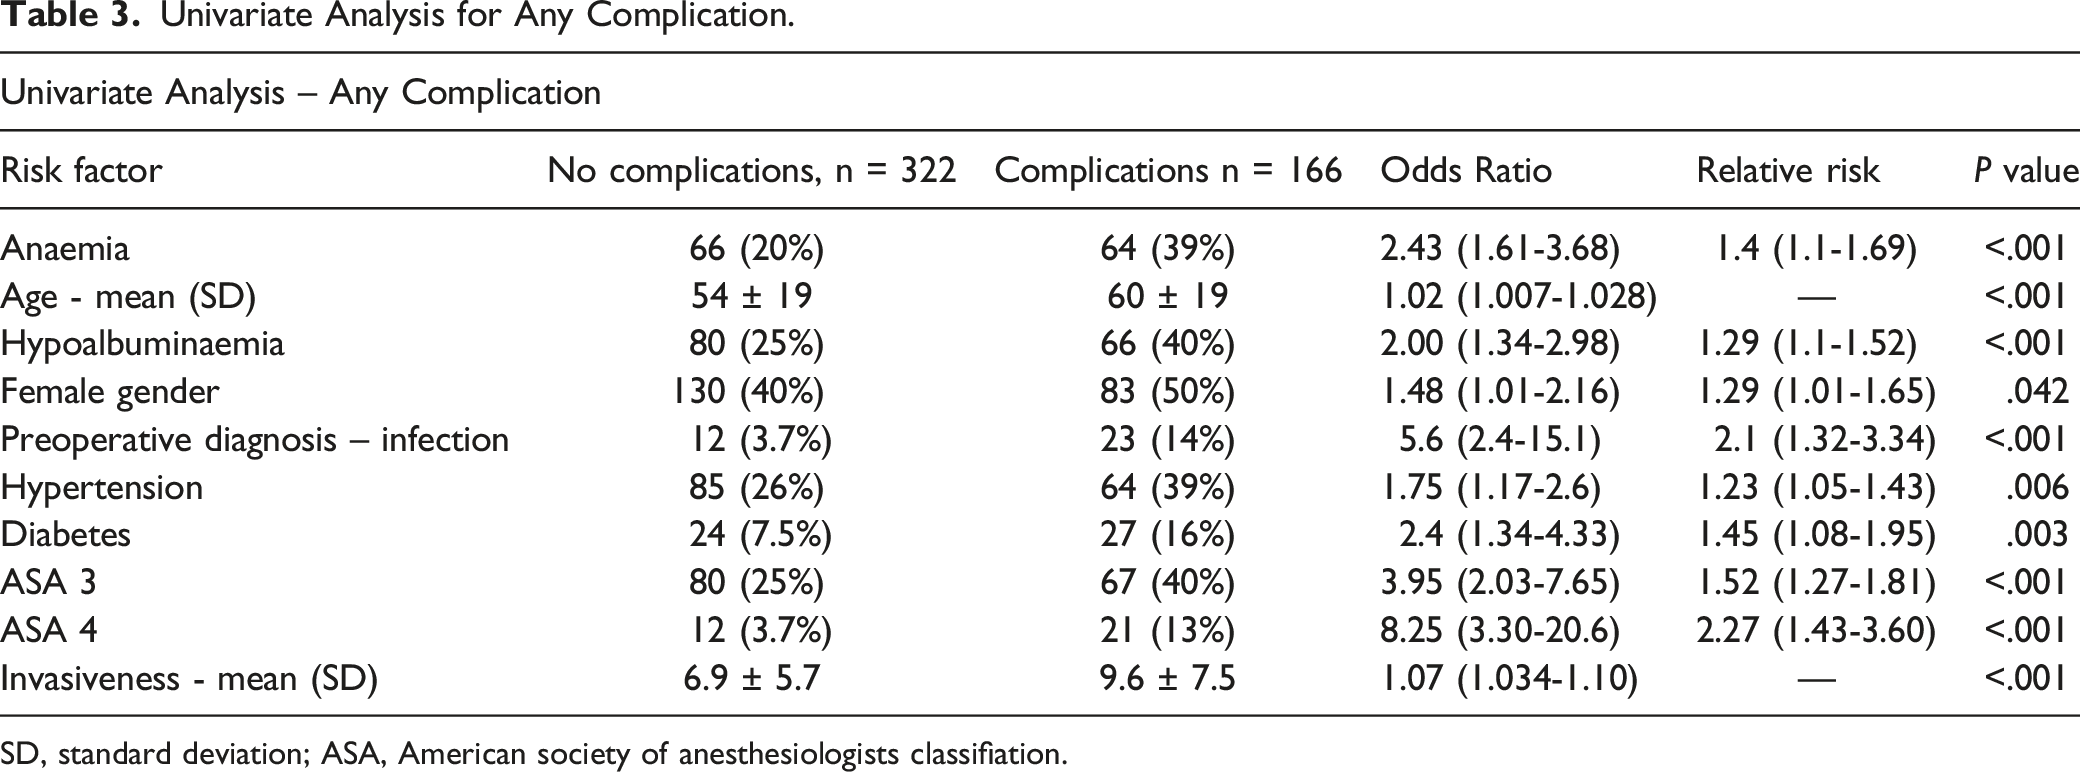
SD, standard deviation; ASA, American society of anesthesiologists classifiation.
Univariate Analysis for significant Complications.
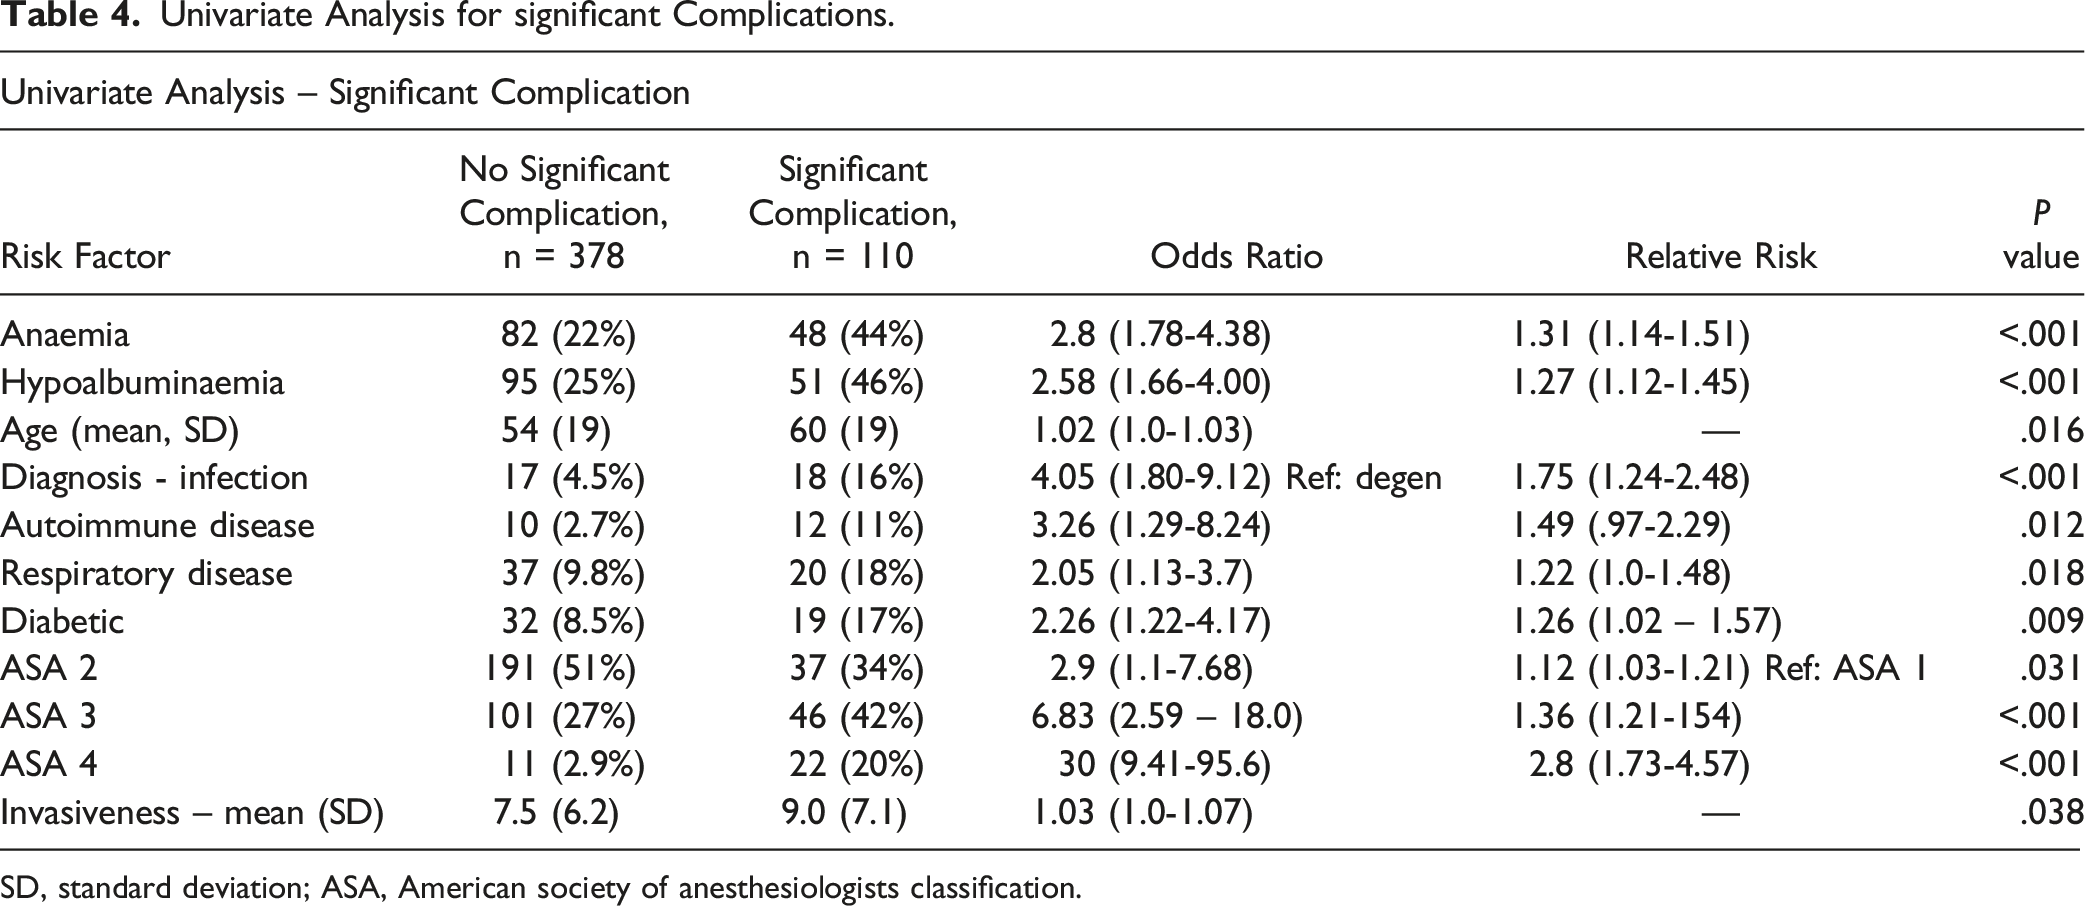
SD, standard deviation; ASA, American society of anesthesiologists classification.
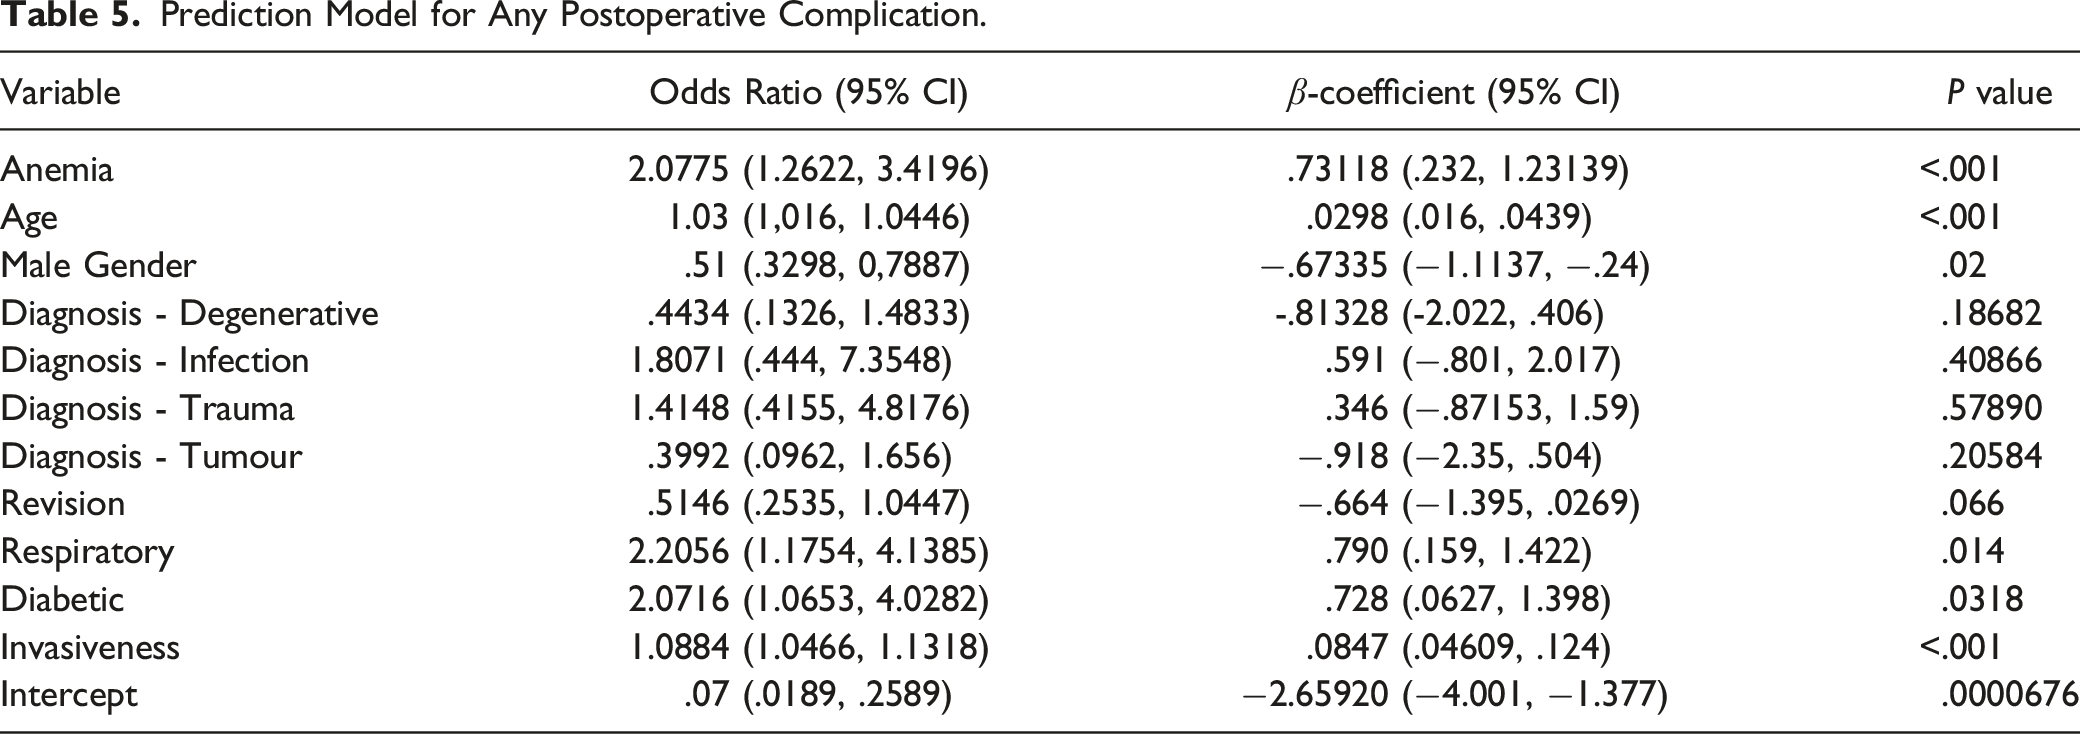
Prediction Model for Any Postoperative Complication.
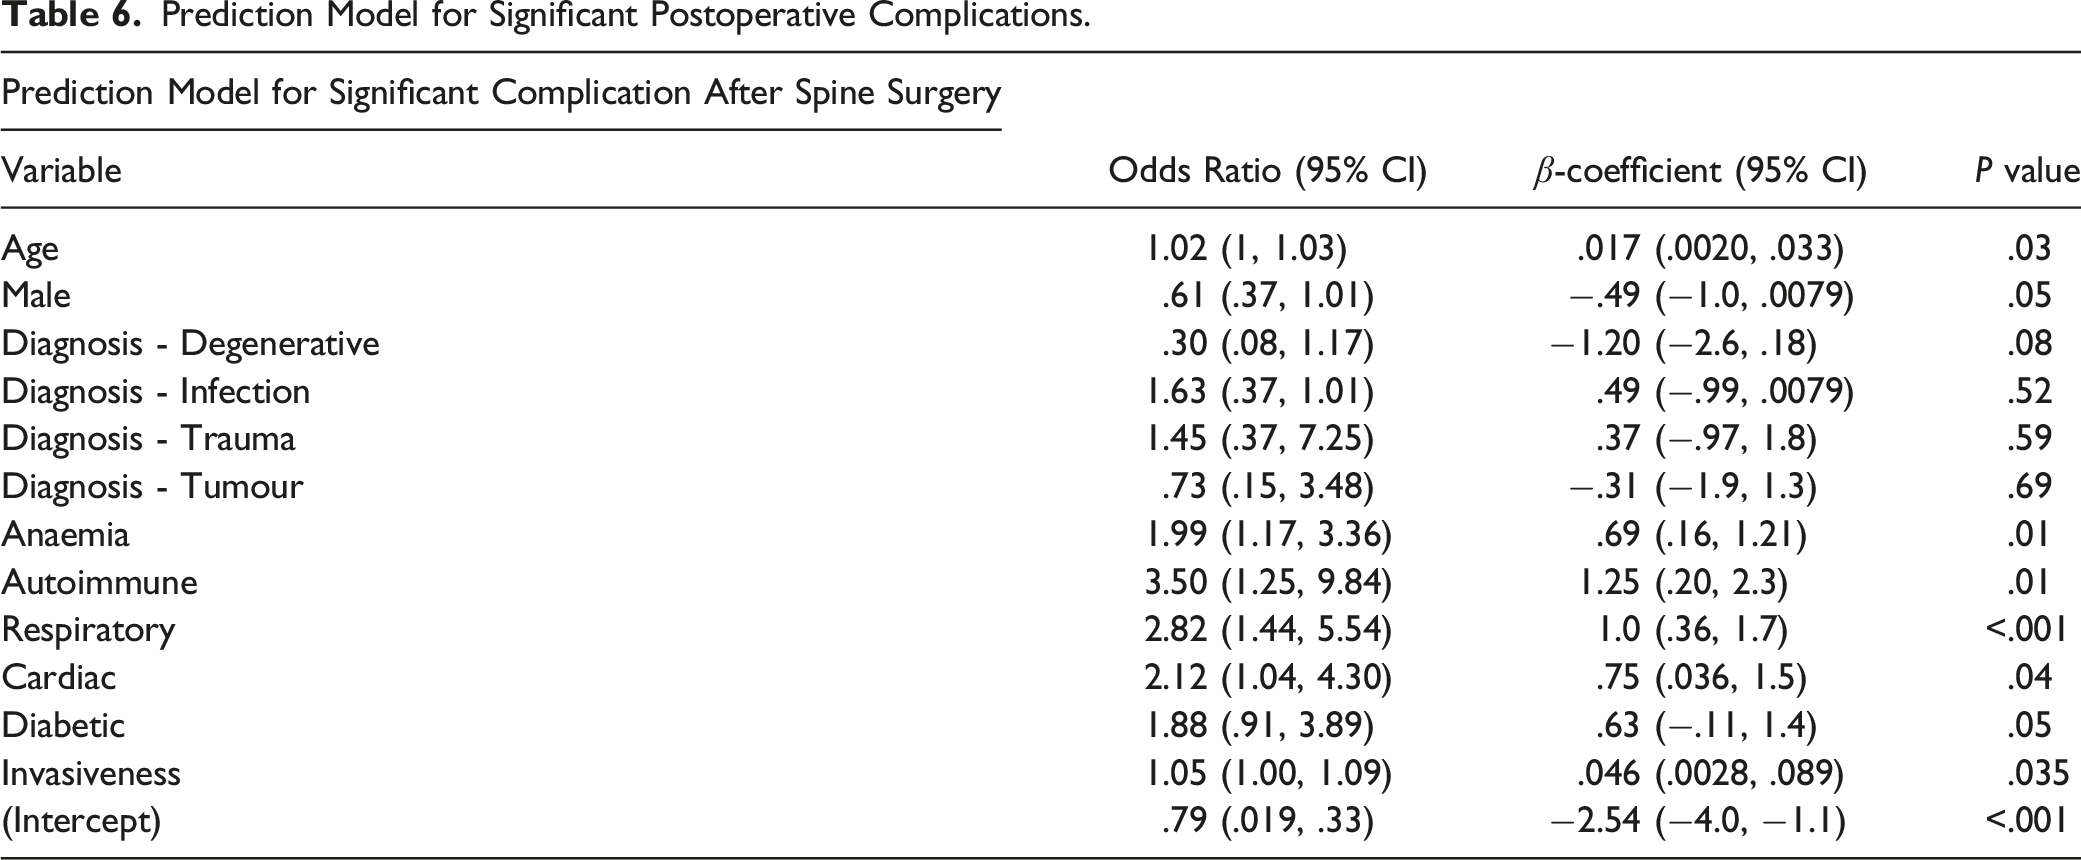
Prediction Model for Significant Postoperative Complications.
Validation
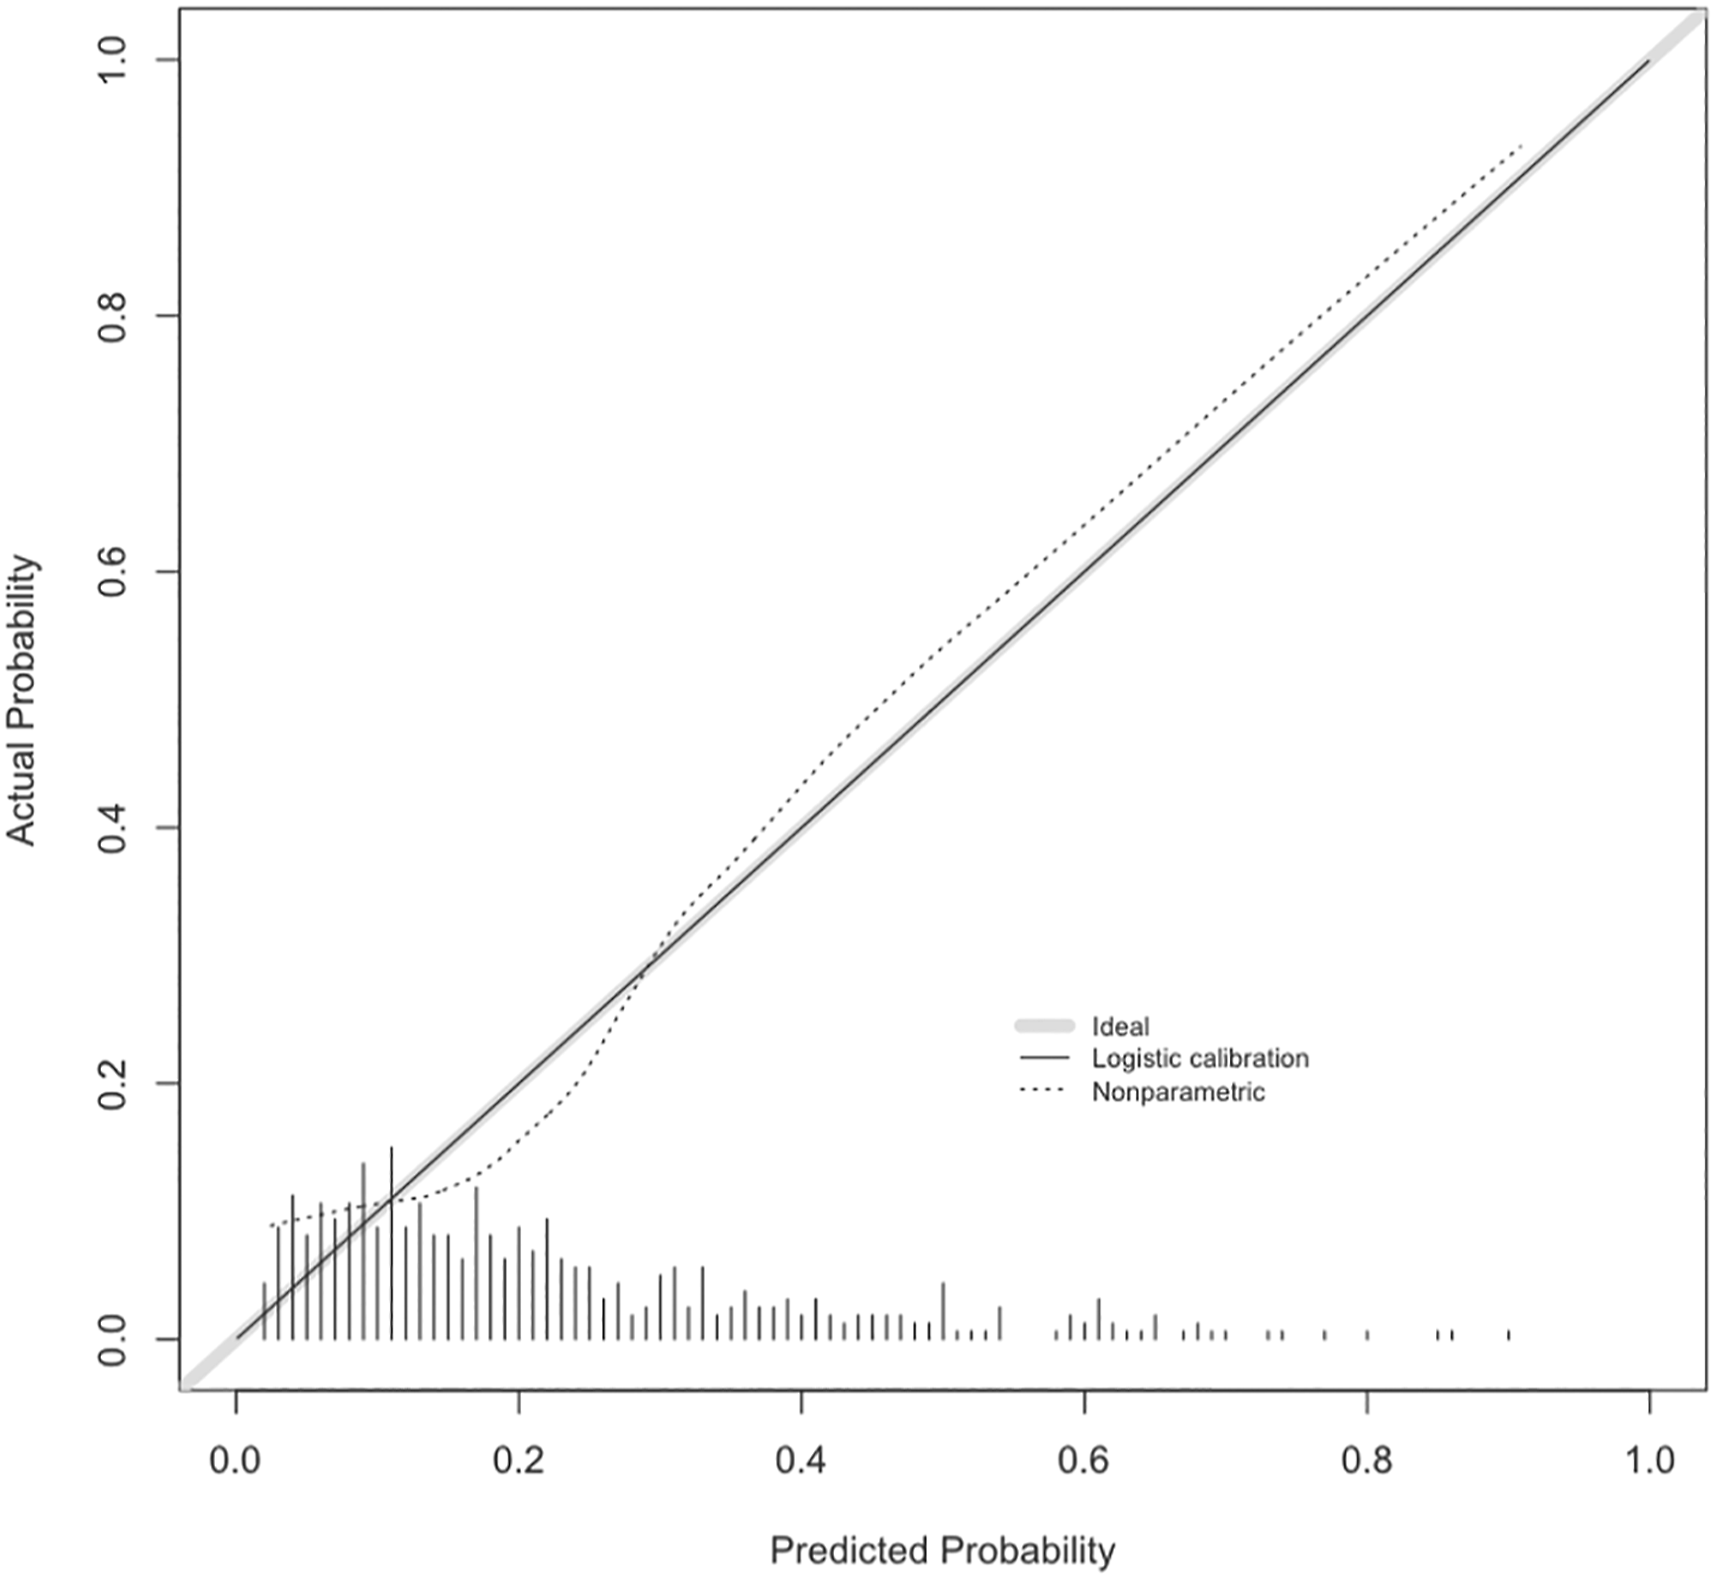
The model showed good discrimination with an AUC of .76 (.71‐.80) for significant complications and .75 (.71‐.81) for any complication. Calibration was excellent (Figures 1 and 2). Calibration curve for any complication. Calibration curve for significant complication.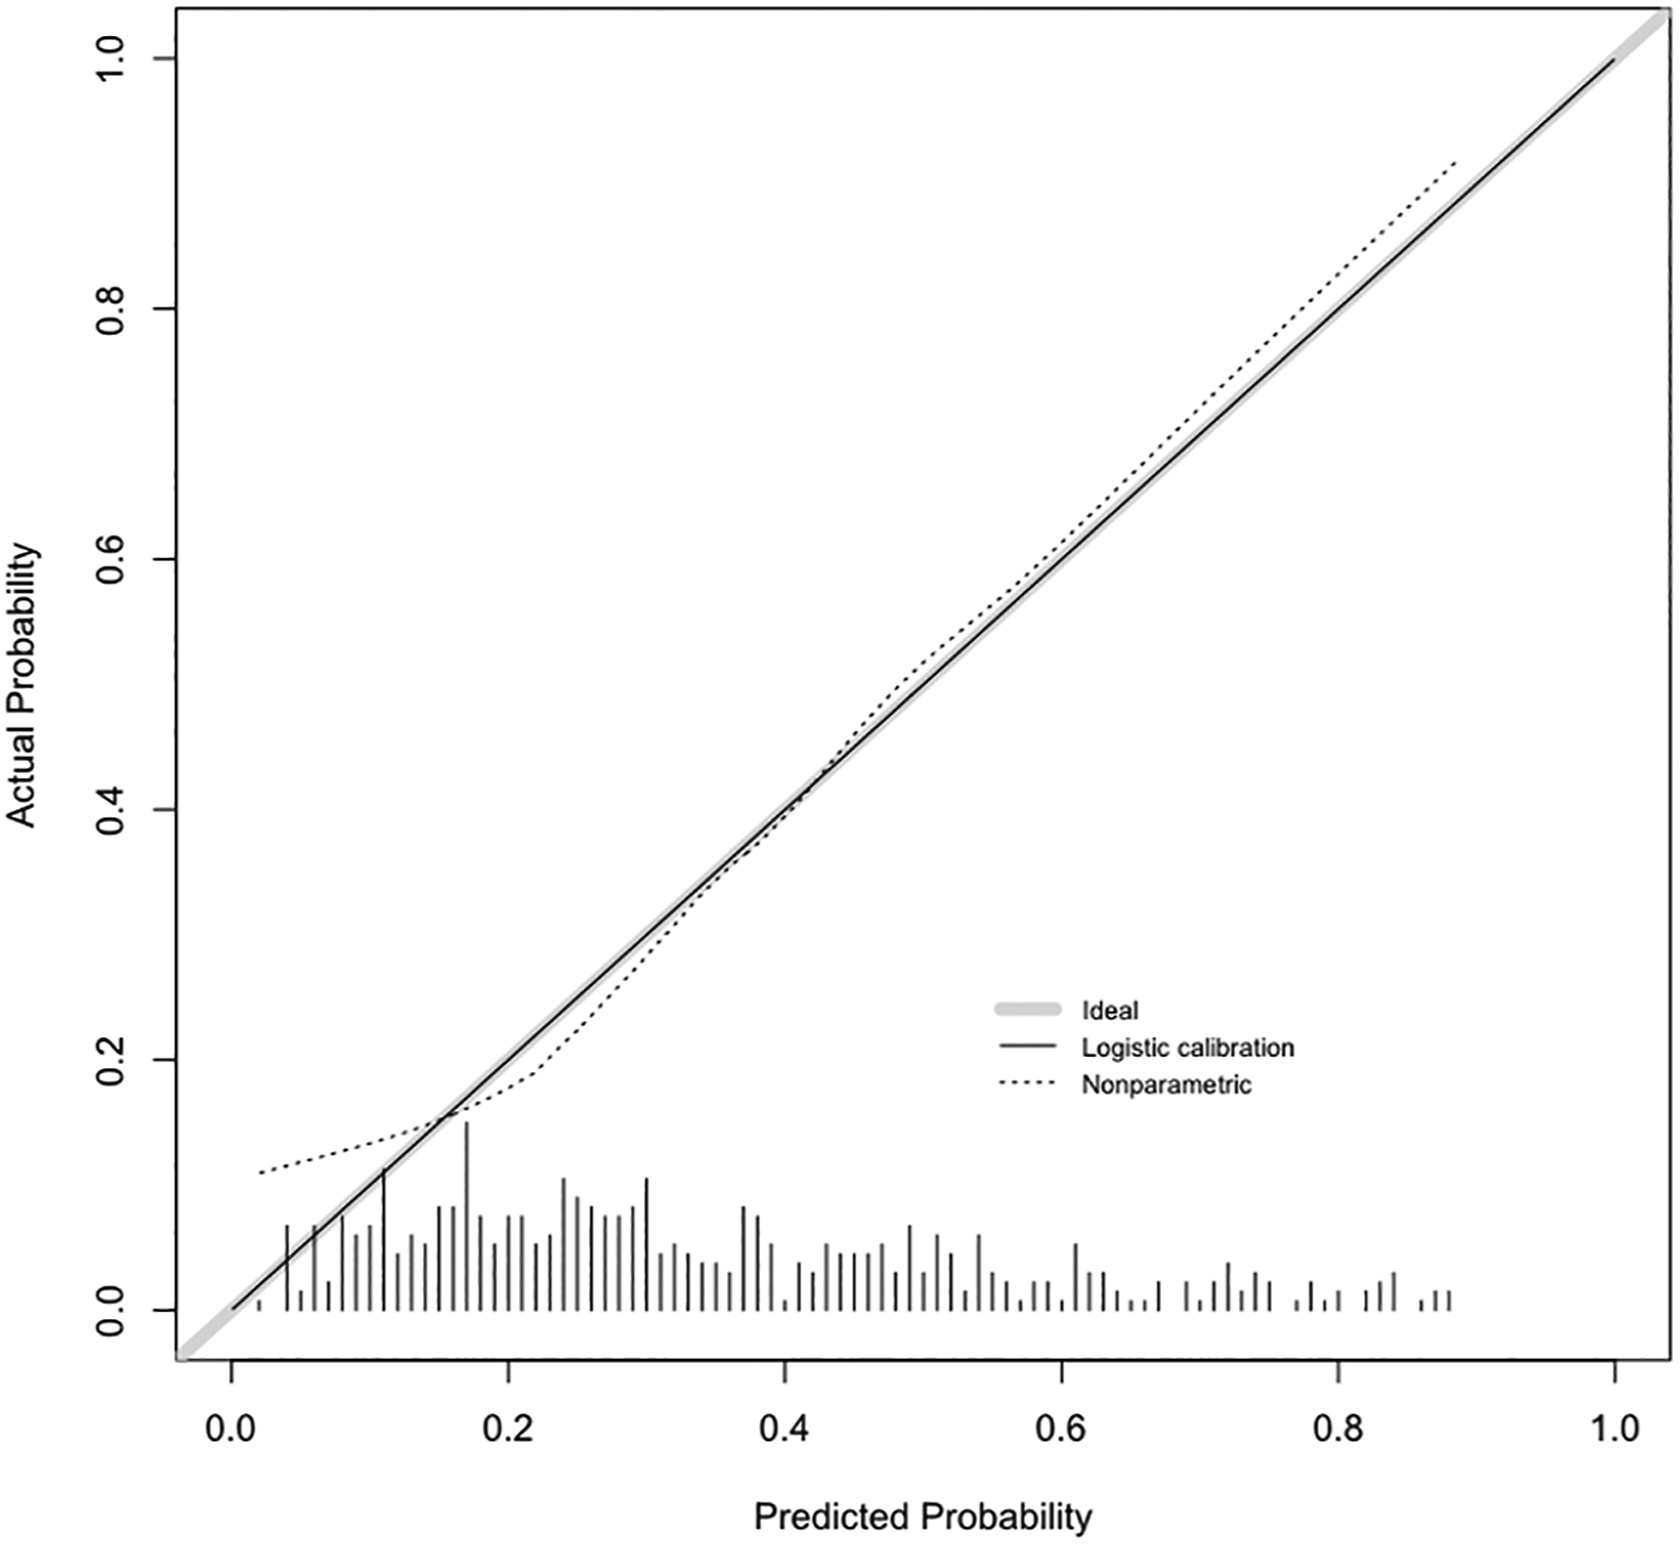
The average AUC of the bootstrapped models was .73 and .72 for any and significant complications respectively, indicating a mild degree of optimism in the models. The extant SpineSage model had an AUC of .71 for any complication which did not differ significantly from out model (P = .62), but systematically underestimated risk (Figure 3). We could not compare the predictions of significant complications between the models due to differing definitions.
3
Results of sensitivity analysis based on positive identification of class membership if predicted risk >50% resulted in accuracy of 74% (70 – 78%, P < .001) for any complication and 80% (76 – 84%, P < .001) for significant complications. Calibration curve for SpineSage.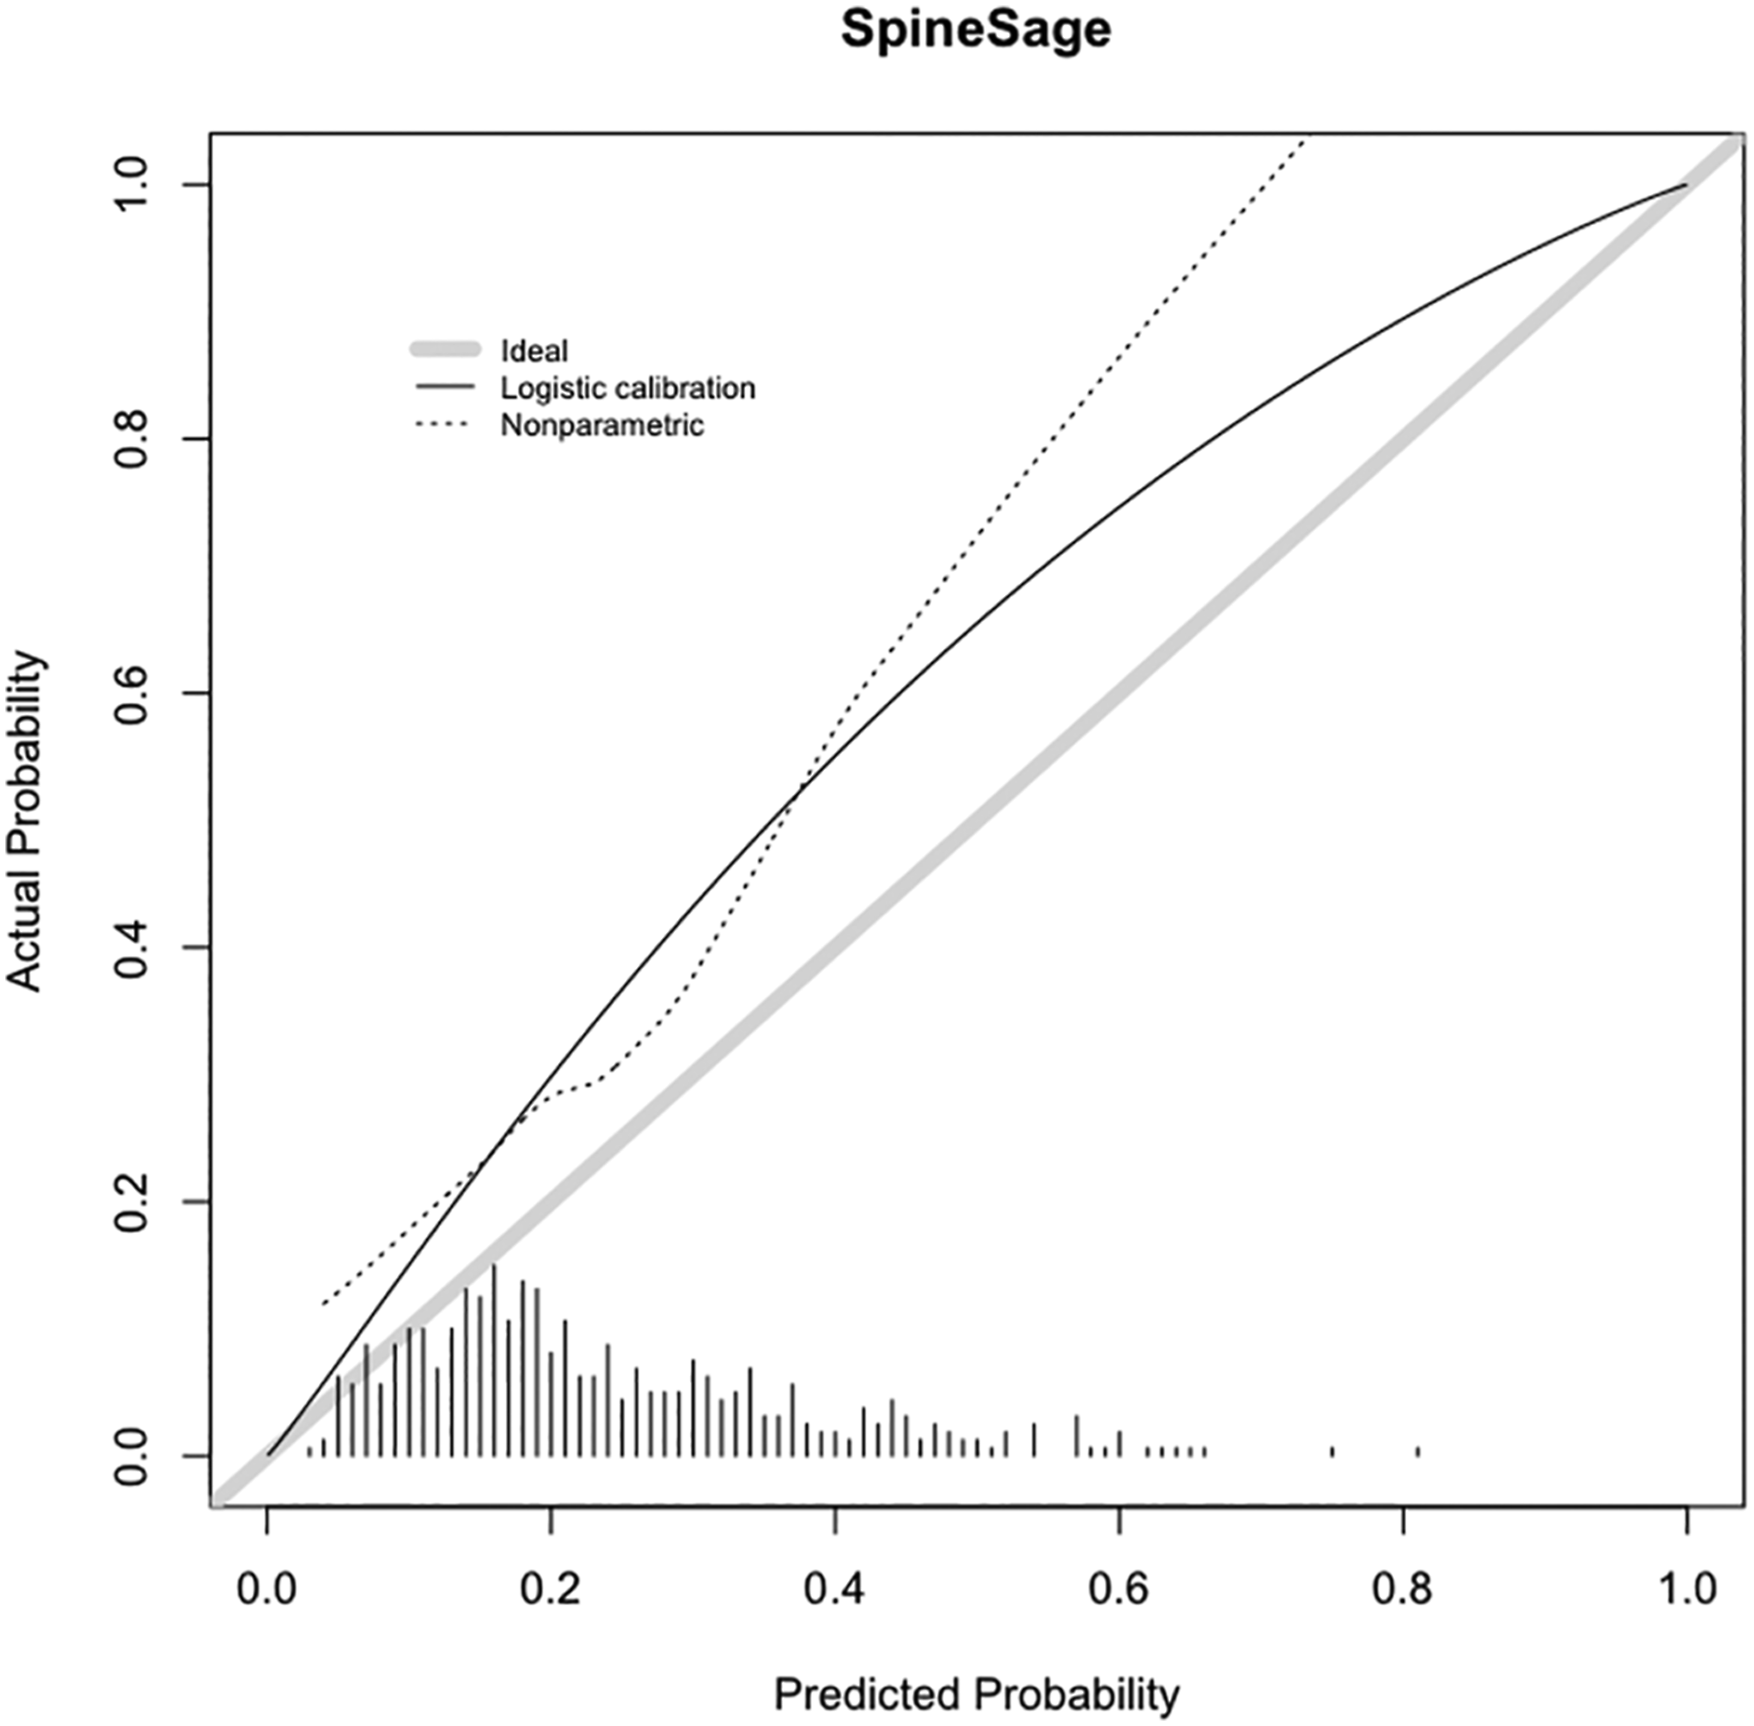
Clinical Utility
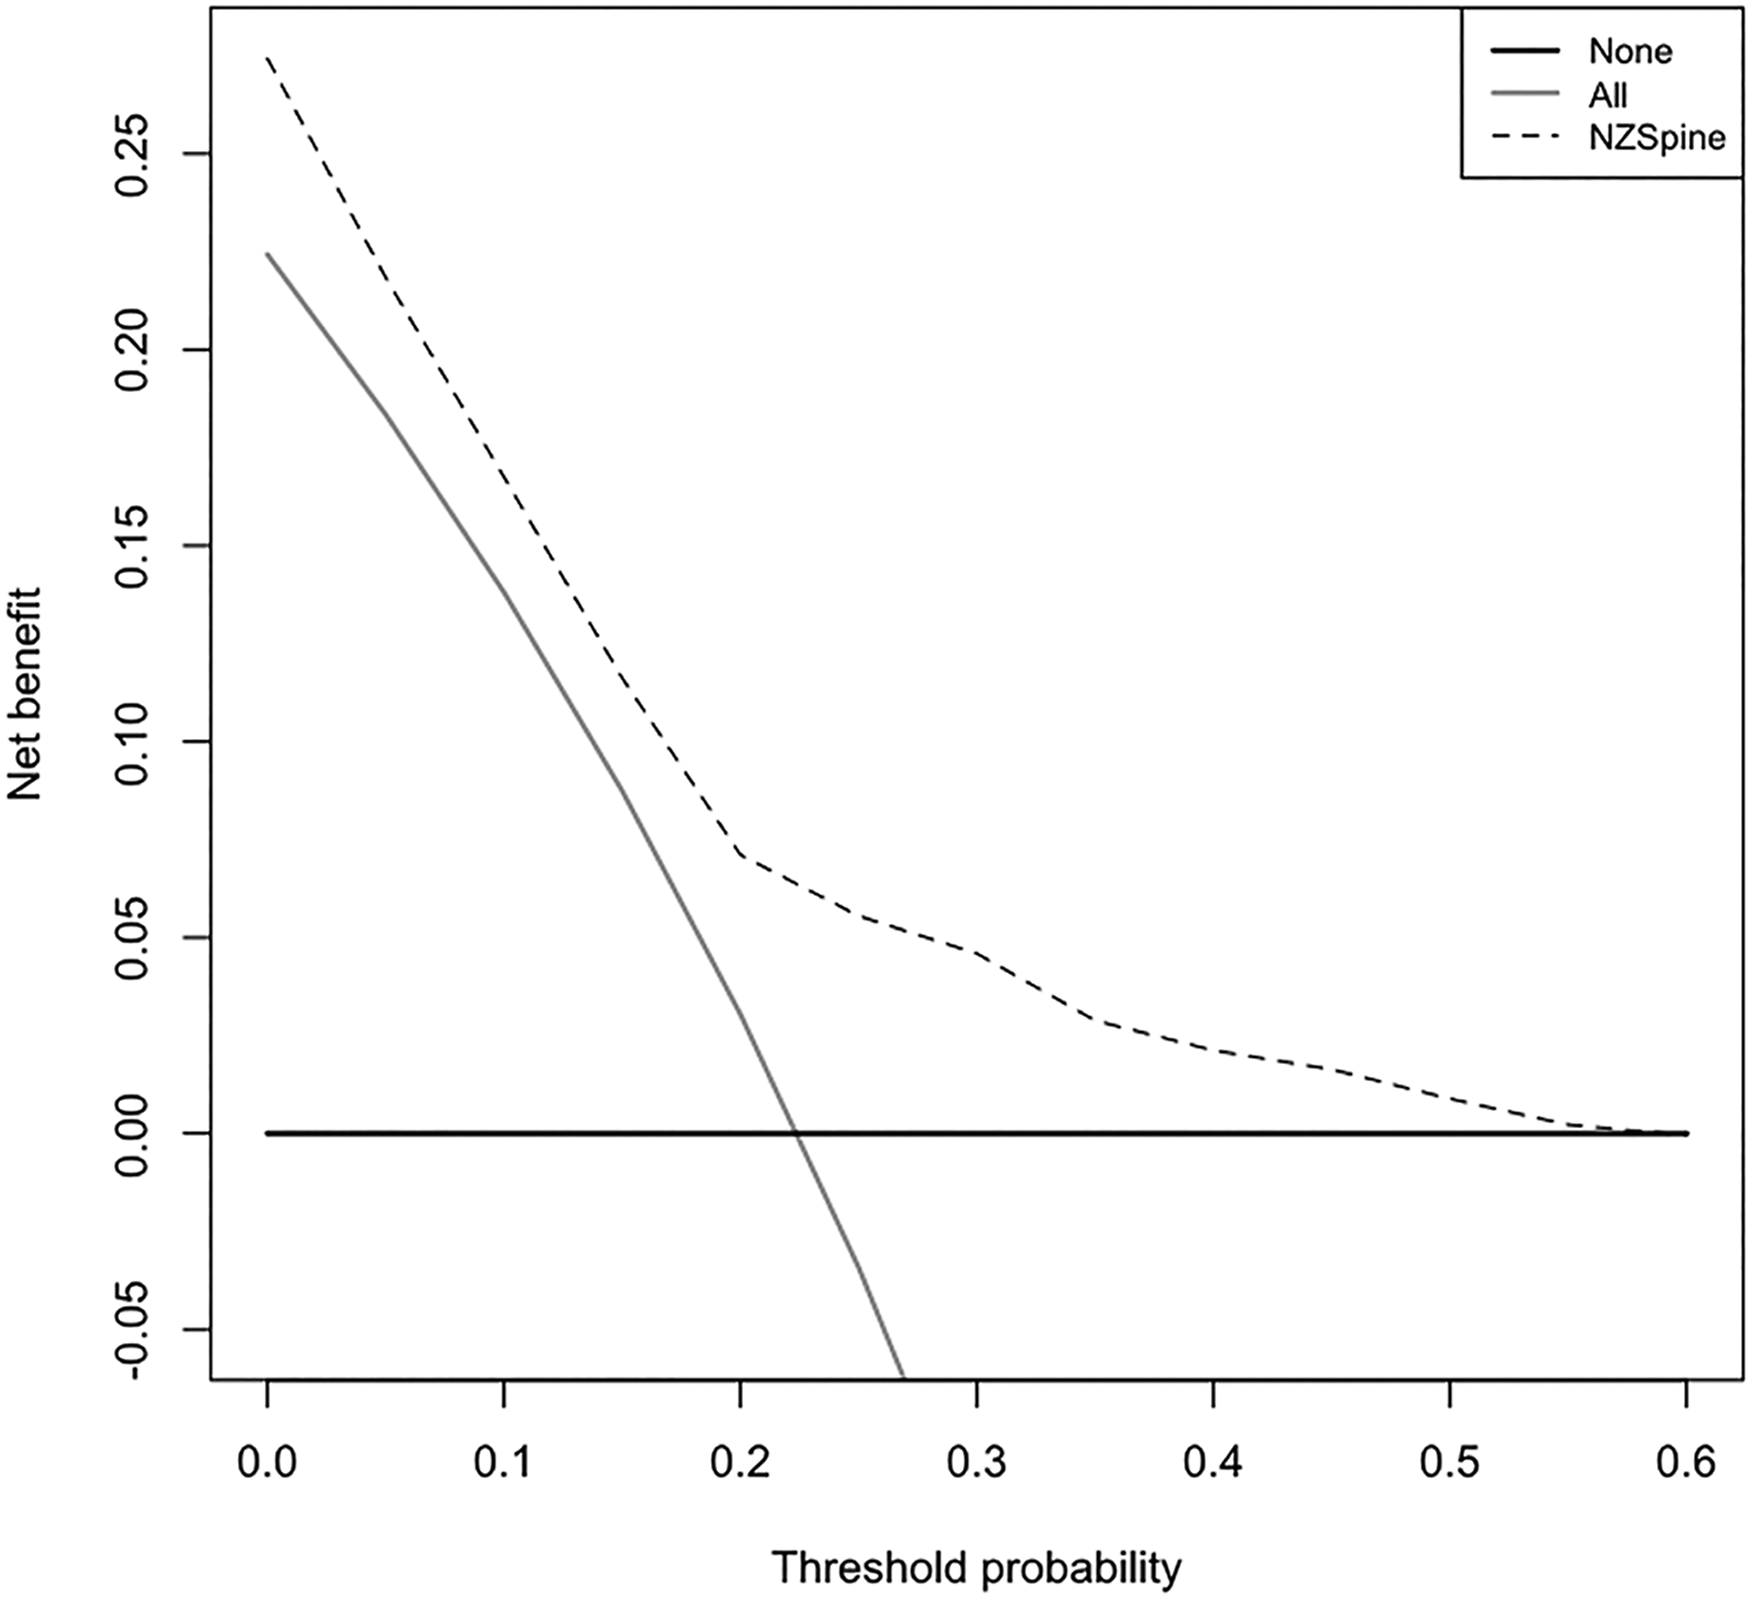
The results of the decision curve analysis are showing in Figures 4 and 5. Both models showed greater net benefit than universal strategies of treating all, or no patients across all acceptable risk thresholds. The model for any complication was superior to the SpineSage model. Decision curves for any complication. Decision curve for significant complication.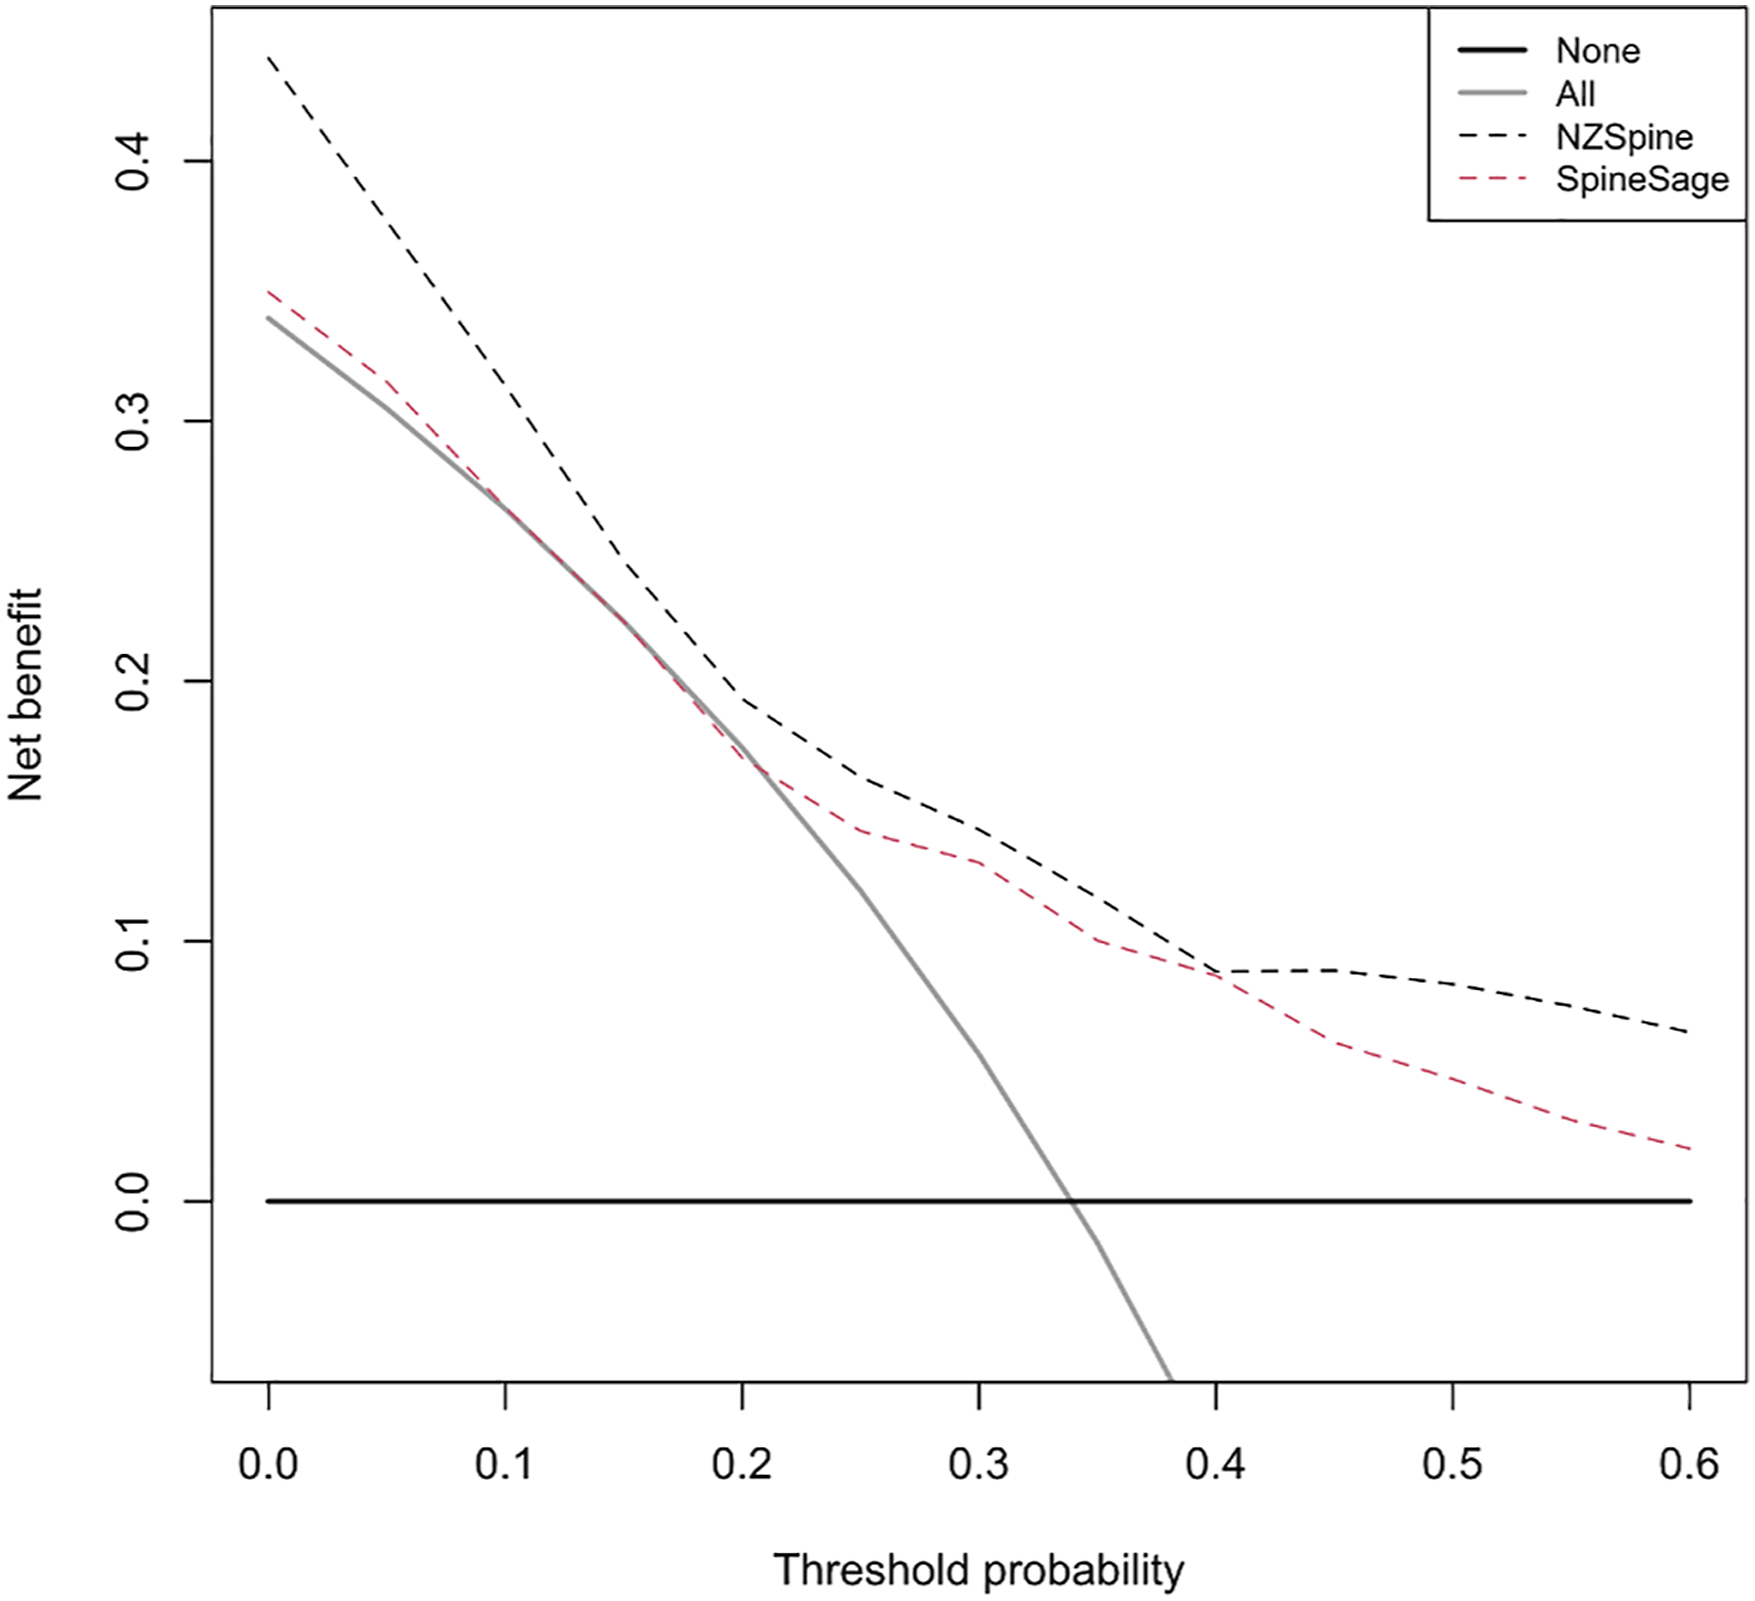
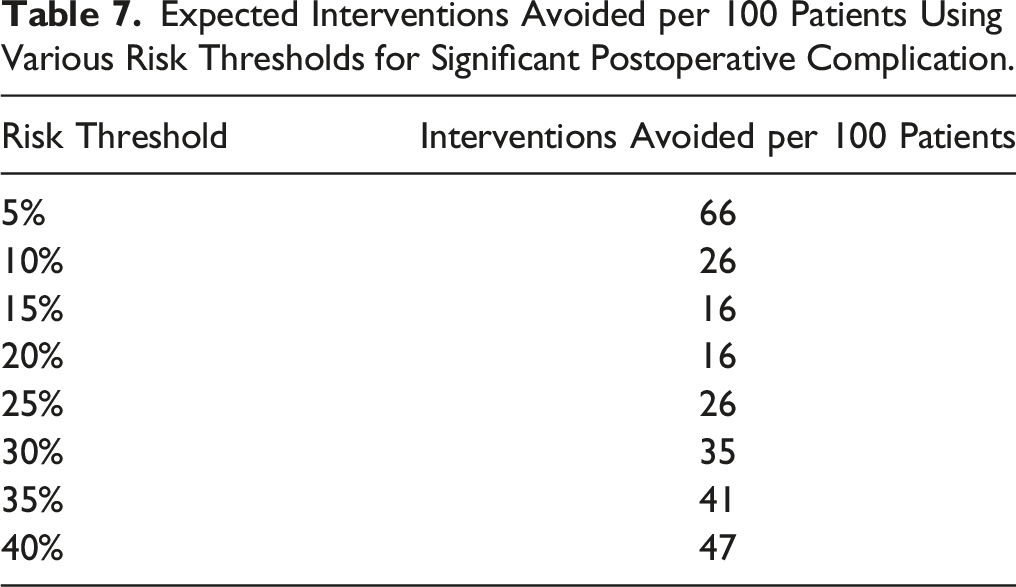
Expected Interventions Avoided per 100 Patients Using Various Risk Thresholds for Significant Postoperative Complication.
Use of the Model
Tables 5 and 6 show the B coefficients and intercept used in the final models. The prediction equation for significant complications is given below, where p represents the probability of a complication: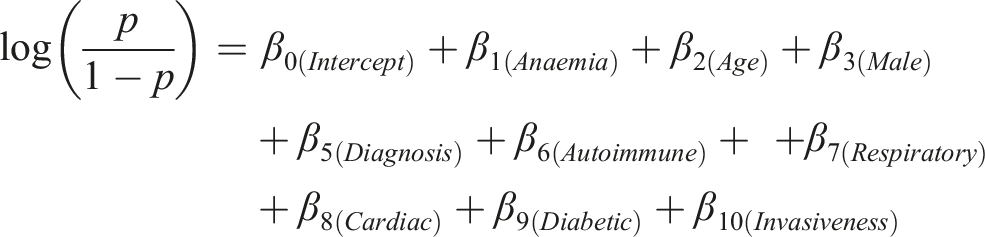
For convenience, the model is available at Supplementary Materials [Please refer to NZSpine Excel file].
Discussion
We have presented a simple logistic regression model for patients undergoing spine surgery based on objective and validated definitions of postoperative complications. The model is theorized to provide clinical benefit to patients across all relevant levels of risk.
Our study has several strengths. Firstly, we used an accepted, statistically sound methodological framework to develop and evaluate our model. 13 As a consequence, we avoided common pitfalls in model development such as inadequate outcome incidence and overfitting. 8 Furthermore, and in contrast to previous tools, we used an objective, patient-centred measure of complication severity that accounts for multiple outcomes within the same patient. 12 Finally, our cohort is one of few based outside the United States, 2 providing further evidence for the use of prediction tools in other populations.
A commonly used prediction tool is the American College of Surgeons National Surgical Quality Improvement Program Risk Calculator (NSQIP). 23 When applied to spine surgery, this model showed slightly inferior discrimination compared to our model (AUC .67 - .71) but vastly inferior calibration,24,25 suggesting significant influence of other specialties on the cohort. Furthermore, the NSQIP definition of a significant complication is questionable - a patient may question the relevance of calculator in which a UTI and catastrophic postoperative haemorrhage are treated equally.
SpineSage also provides a separate prediction of major complication, however the development study does not provide the incidence of major complications in the cohort, so the reliability of this model is uncertain 3 . The use of a prediction that incorporates the cumulative effect of relatively minor complications is of obvious benefit to decision making for both patients and clinicians.
An additional benefit of our model is our diverse cohort. Most models are based on primarily (>95%) degenerative cohorts4–6,26, whereas SpineSage excluded patients undergoing surgery for malignancy. 3 We did not apply any exclusion criteria, hence the models is usable for all surgical indications.
Finally, no other models for complications of spine surgery have presented any measure of clinical utility. By including decision curve analysis, we were able to show that the model is relevant to clinical practice – by contrast, an extremely well performing model may be of little clinical utility if in the cohort studied it provides little benefit over existing strategies. 22
Our study has several limitations. First, our sample size is small compared to models based on “big data” approaches with cohorts ranging into the hundreds of thousands. Such approaches sacrifice granularity of data in favor of statistical power, and it has been suggested that this approach may increase the risk of bias as data is often collected for a separate purpose than the development of a statistical model. 8
Secondly, the discriminative power of the model is relatively modest compared to some other published models, however we took a rigorous approach to internal validation – the often-performed training-validation split and random cross-validation methods have been shown to be inefficient and unlikely to show significant differences from the development data, increasing risk of model overfitting. 7
In New Zealand, prioritisation for elective surgery incorporates a “surgeon assessment of risk”. Patients who are judged by the clinician to have a >5% risk of perioperative complications are less likely to be allocated public funds for their operation. In the field of spine surgery it is currently unclear upon what basis this assessment is made, therefore a standardized, objective tool such as NZSpine may help to reduce any regional variation in this judgement.
To our knowledge, no clinical impact studies of prognostic scoring systems or predictive models in spine surgery have been conducted. This may be due to the poor utilization of measures of clinical utility within the field. 10 Our results should be corroborated by rigorous, independent external validation and if the model retains its performance the logical next step is a prospective assessment of utilizing the model in clinical practice.
Supplemental Material
Supplemental Material - Development of a Prediction Model for Significant Adverse Outcome After Spine Surgery
Supplemental Material for Development of a Prediction Model for Significant Adverse Outcome After Spine Surgery by Martin Coia Jadresic, and Joseph F. Baker in Global Spine Journal
Footnotes
Declaration of Conflicting Interests
The author(s) declared no potential conflicts of interest with respect to the research, authorship, and/or publication of this article.
Funding
The author(s) received no financial support for the research, authorship, and/or publication of this article.
Author’s Note
The manuscript submitted does not contain information about medical device(s)/drug(s). This study was approved by our institutional Clinical Audit Support Unit, approval number 4091.
Supplemental Material
Supplemental material for this article is available online.
References
Supplementary Material
Please find the following supplemental material available below.
For Open Access articles published under a Creative Commons License, all supplemental material carries the same license as the article it is associated with.
For non-Open Access articles published, all supplemental material carries a non-exclusive license, and permission requests for re-use of supplemental material or any part of supplemental material shall be sent directly to the copyright owner as specified in the copyright notice associated with the article.