
Abstract
Objective:
To identify the independent risk factors for postpartum stress urinary incontinence by combining pelvic floor ultrasound parameters with clinical information.
Methods:
Pelvic floor examination and clinical data were collected from 152 postpartum women who underwent pelvic floor ultrasound at Yancheng Third People’s Hospital between December 2023 and September 2024. Independent risk factors for postpartum stress urinary incontinence were identified using multivariate logistic regression analysis. A nomogram model was constructed using R 4.3.1 software and the rms package to evaluate the correlation between the identified factors and the disease.
Results:
Maximal Valsalva state posterior urethrovesical angle (RVA), bladder neck descent, and Young’s modulus of the resting posterior lip of the urethral sphincter were identified as independent risk factors for postpartum stress urinary incontinence (p < 0.05). The areas under the receiver operating characteristic curve for RVA, bladder neck descent, and posterior lip of the urethral sphincter were 0.840, 0.867, and 0.914, respectively, indicating high diagnostic efficiency. The nomogram model demonstrated that the risk of developing stress urinary incontinence increased with higher RVA and bladder neck descent values and lower posterior lip of the urethral sphincter values, with posterior lip of the urethral sphincter showing the strongest correlation with the disease.
Conclusion:
RVA (Valsalva), bladder neck descent, and posterior lip of the urethral sphincter are independent risk factors for postpartum stress urinary incontinence. The nomogram model based on these factors demonstrated high diagnostic performance (area under the curve = 0.984), suggesting potential utility for clinical application. However, this model is preliminary and requires validation in larger, multicenter cohorts before widespread use.
Keywords
Introduction
Stress urinary incontinence (SUI) is a condition characterized by the involuntary loss of urine, caused by increased intra-abdominal pressure due to exertion, physical activity, sneezing, or coughing. 1 The prevalence of SUI varies across regions; in the United States, ~15.7% of adult women suffer from SUI, 2 while in China, the prevalence is a staggering 18.9%. 3 The pathogenesis of SUI is primarily associated with factors such as age, childbirth, obesity, and constipation. 4 Previous studies have shown that the pooled prevalence of SUI among all women within the first 3 months postpartum is 33%. 5 Postpartum SUI not only affects patients’ mental health, leading to a reduced quality of life, 6 but also imposes a significant burden on the healthcare system and society. 7 Therefore, this study innovatively integrates elastography with conventional pelvic floor ultrasound parameters to comprehensively assess both the structural and mechanical properties of the pelvic floor. By combining these multimodal imaging indicators with clinical variables, we developed a predictive nomogram for postpartum SUI, enabling individualized and quantitative risk assessment and providing a novel tool for early identification and prevention of postpartum SUI.
Methods
Sample size assessment
In this study, nine variables were included in the multivariate logistic regression analysis. According to the rule of thumb, the sample size should be 5, 10, or 20 times the number of variables. 8 Therefore, a minimum of 45 cases was required for this study.
Data collection
This study was a prospective observational study, in which postpartum women were recruited for pelvic floor ultrasound examinations and relevant clinical and imaging data were collected from December 2023 to September 2024. A total of 152 postpartum women who underwent pelvic floor ultrasound at Yancheng Third People’s Hospital during this period were included, comprising 94 in the SUI group and 58 in the healthy control group. Inclusion criteria included the following: (1) Diagnosed with SUI according to international guidelines. 9 This study adopted a “questionnaire screening plus clinical evaluation” approach as the primary diagnostic process. Initially, participants were screened using the International Consultation on Incontinence Questionnaire–Short Form (Supplemental Material)10,11 or a similar structured questionnaire, followed by outpatient clinical assessment by a specialist, including observation of urine leakage during coughing or the Valsalva maneuver. For cases in which the questionnaire and clinical evaluation results were inconsistent or when further clarification of etiology was clinically necessary (e.g., in patients with mixed urinary incontinence or a history of pelvic surgery), a standard urodynamic examination was performed to confirm the diagnosis and determine group allocation. Participants with consistent questionnaire/clinical findings and, when applicable, urodynamic confirmation were included in the SUI group. (2) Age >18 years. Exclusion criteria including the following: (1) Women with pelvic floor dysfunction; (2) those with intrauterine growth restriction or threatened preterm labor; (3) those with pregnancy complications, abnormal amniotic fluid levels, or placenta previa; (4) history of pelvic surgery; (5) urinary or reproductive system infections; and (6) those unsuitable for participation due to major illnesses. This study was approved by the hospital’s ethics committee (number: 2023-99).
Included parameters
The parameters collected for analysis included age, BMI, number of deliveries, vaginal delivery, C-section, age of primiparity, neonatal weight (max), urethral rotation angle in the maximal Valsalva state (URA (Valsalva)), maximal Valsalva state posterior urethrovesical angle (RVA (Valsalva)), bladder neck descent (BND), levator hiatus angle in the maximal Valsalva state (LHA (Valsalva)), Young’s modulus of the resting anterior lip of the urethral sphincter (E-a), Young’s modulus of the resting posterior lip of the urethral sphincter (E-p), E-a/E-p, and urethral funneling.
Pelvic floor ultrasound examination
The patient was placed in the supine lithotomy position and asked to empty their bladder, ensuring a residual urine volume of <50 ml. The three-dimensional pelvic floor examination was conducted using an ultrasound diagnostic device (Mindray R8) with a convex probe operating at a frequency of 3.5–5 MHz. The convex probe was inserted in the mid-sagittal plane through the perineum to clearly display the pubic symphysis, urethra, vagina, and rectum (Figure 1(a)). Urethral funneling was measured under the Valsalva maneuver (Figure 1(b)), along with URA, RVA, and BND measurements (Figure 1(c)), and LHA under Valsalva (Figure 1(d)), with the average of three measurements recorded. Shear wave elastography (SWE) examination was performed using an ultrasound diagnostic device (GE LOGIQ Fortis) with an endocavity probe operating at a frequency of 3–12 MHz. The probe was inserted into the vagina, and when stable, with the urethra centered in the image displaying the pubic symphysis, urethra long axis, and bladder (Figure 1(e)), the SWE program was initiated, adjusting the appropriate depth and sample box size to fully cover the E-a and E-p, with a range set to 100 kPa. The optimal image was achieved when the color map showed homogeneous filling without artifact or signal dropout; the image was then frozen and stored. Using the Q-BOX measurement tool, a region of interest was placed at the bladder neck, set to a circular diameter of 5 mm, selecting an area with uniform color fill to measure the Young’s modulus values of the E-a and E-p (Figure 1(f)), with three measurements taken to calculate the average values for the E-a and E-p, yielding a ratio of E-a/E-p. All procedures were performed by the same physician and conducted in accordance with the guidelines of the International Urogynecological Association.

Pelvic floor ultrasound examination. (a) Mid-sagittal view through the perineum showing the pubic symphysis, urethra, vagina, and rectum. (b) Measurement of urethral funneling under Valsalva maneuver. (c) Measurement of URA, RVA, and BND under Valsalva. (d) LHA under Valsalva. (e) Pubic symphysis, urethra long axis, and bladder. (f) Young’s modulus values of the anterior and posterior lips of the urethral sphincter.
Statistical analysis
SPSS 27.0 software was used to analyze the data. For continuous variables that did not follow a normal distribution, the Mann–Whitney U test, a non-parametric method, was applied, with results expressed as median (M) and interquartile range (Q1–Q3). For continuous variables with a normal distribution, the independent samples t-test was used, with results presented as mean ± standard deviation (X ± s). Categorical variables were analyzed using the chi-square (χ2) test, and results were expressed as percentages (%). A p < 0.05 was considered statistically significant. Prior to multivariate logistic regression analysis, multicollinearity among predictors was assessed using the variance inflation factor (VIF), and variables with VIF > 5 were considered for exclusion to avoid multicollinearity. Variables that showed statistical significance in univariate analysis (p < 0.05) were entered into the multivariate logistic regression model using a Forced Entry method. The independent risk factors identified were then input into R 4.3.1 software with the rms package (https://yikeshu.shinyapps.io/inomogram/) to construct a nomogram prediction model. Subsequently, the model’s performance was evaluated using the receiver operating characteristic (ROC) curve and calibration plot, and its clinical utility was further assessed using decision curve analysis (DCA).
Results
Normality test of risk factor data
The Shapiro–Wilk method was used to analyze the normality of the Continuous Data included in the parameters. The results indicated that the data for age, BMI, number of deliveries, vaginal delivery, C-section, neonatal weight (max), RVA (Valsalva), BND, E-a, E-p, and E-a/E-p were non-normally distributed (p < 0.05). By contrast, the data for age of primiparity, URA (Valsalva), and LHA (Valsalva) were normally distributed (p > 0.05; Table 1).
Normality test of data for risk factors.
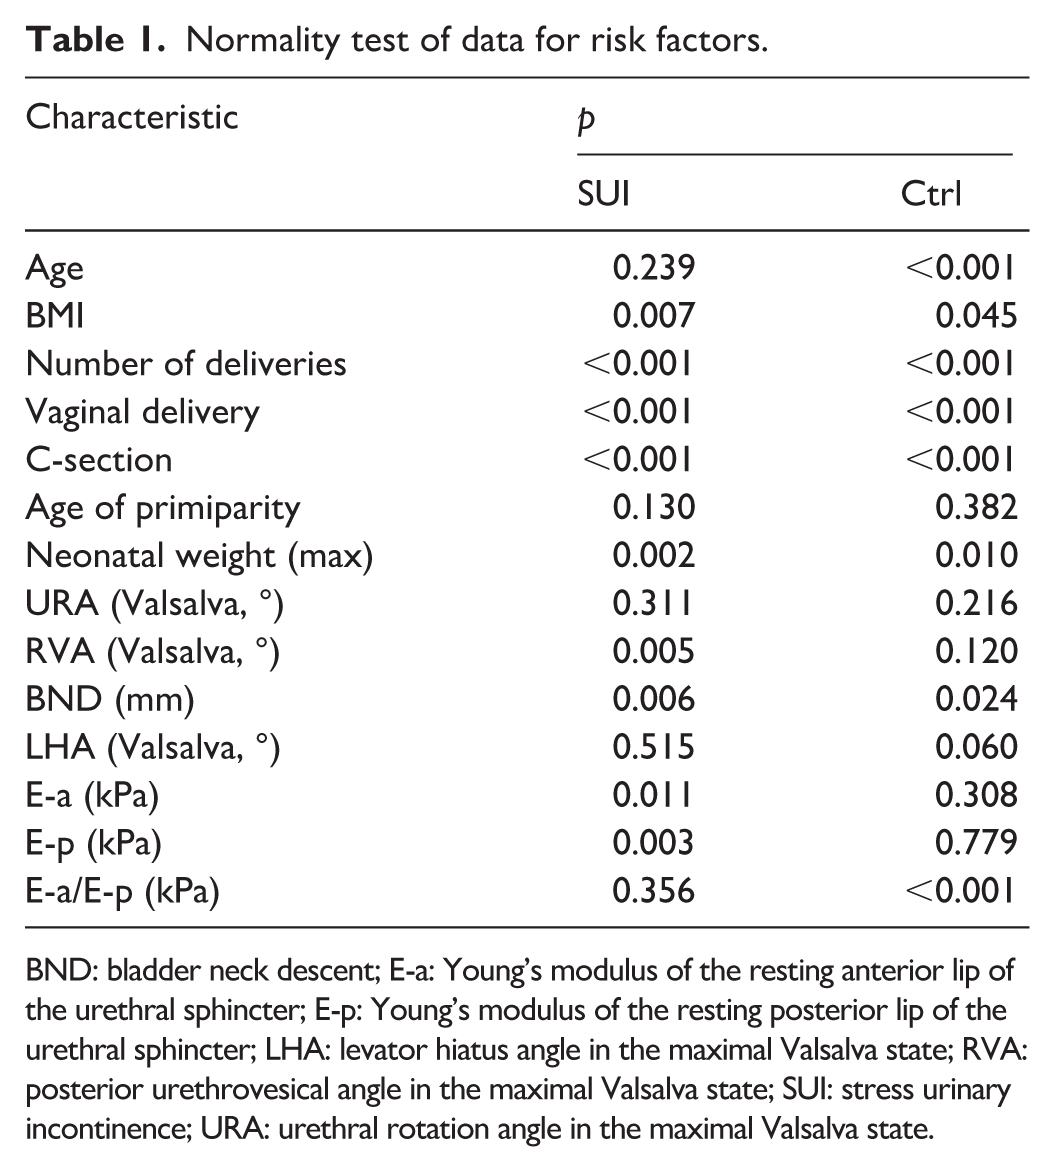
BND: bladder neck descent; E-a: Young’s modulus of the resting anterior lip of the urethral sphincter; E-p: Young’s modulus of the resting posterior lip of the urethral sphincter; LHA: levator hiatus angle in the maximal Valsalva state; RVA: posterior urethrovesical angle in the maximal Valsalva state; SUI: stress urinary incontinence; URA: urethral rotation angle in the maximal Valsalva state.
Univariate analysis to identify factors influencing postpartum SUI
The results indicated that vaginal delivery, C-section, RVA (Valsalva), URA (Valsalva), LHA (Valsalva), BND, E-p, E-a/E-p, and urethral funneling were risk factors for SUI (p < 0.05), while age, BMI, number of deliveries, age of primiparity, neonatal weight (max), and E-a were not significantly related (p > 0.05; Table 2). Table 3 presents the results of the univariate logistic regression analysis for the risk factors associated with SUI mentioned above. All included factors had p < 0.05. The regression coefficients (B) for C-section and E-p were negative, indicating that as they increase, the likelihood of SUI decreases. The B values for the other factors were positive integers, meaning that as they increase, the likelihood of SUI also increases (Table 3).
Univariate analysis of risk factors for postpartum SUI.
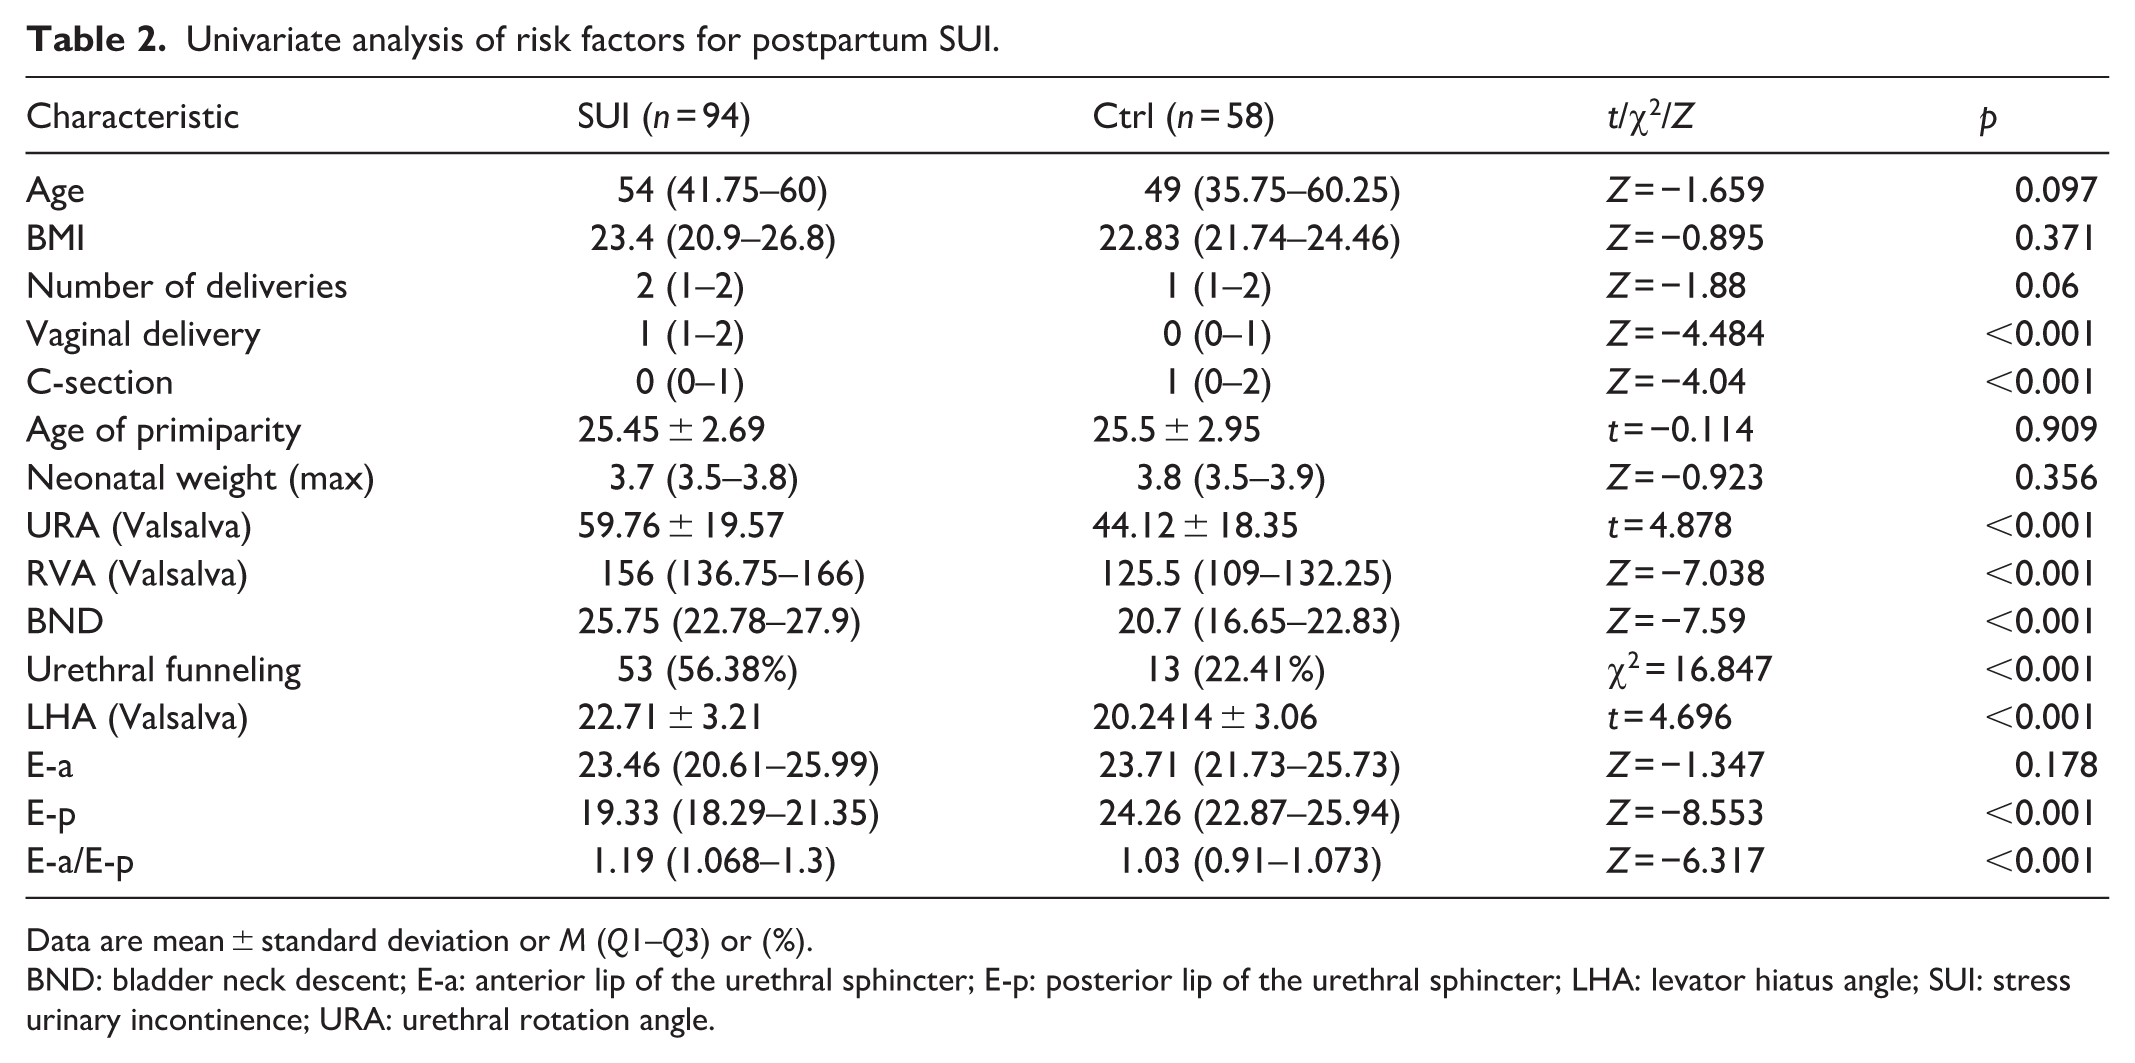
Data are mean ± standard deviation or M (Q1–Q3) or (%).
BND: bladder neck descent; E-a: anterior lip of the urethral sphincter; E-p: posterior lip of the urethral sphincter; LHA: levator hiatus angle; SUI: stress urinary incontinence; URA: urethral rotation angle.
Univariate logistic regression of risk factors for postpartum SUI.

BND: bladder neck descent; E-a: anterior lip of the urethral sphincter; E-p: posterior lip of the urethral sphincter; LHA: levator hiatus angle; SUI: stress urinary incontinence; URA: urethral rotation angle.
Identification of independent risk factors for postpartum SUI through multivariate logistic regression and ROC validation
The parameters that showed statistical significance in the univariate analysis were included in the multivariate logistic regression analysis. The results indicated that RVA (Valsalva), BND, and E-p were independent risk factors for postpartum SUI (P < 0.05; Table 4). The Hosmer–Lemeshow test yielded a p value of 0.99, indicating a high model fit with the included parameters, suggesting that the relationships between the parameters are reliable. As shown in the ROC curve results, the AUC values for RVA (Valsalva), BND, and E-p were 0.840, 0.867, and 0.914, respectively (Figure 2(a)–(c)). This indicates that the three independent risk factors identified for SUI have high diagnostic efficacy.
Identifying independent risk factors for postpartum stress urinary incontinence through multivariate logistic regression analysis.

BND: bladder neck descent; E-a: anterior lip of the urethral sphincter; E-p: posterior lip of the urethral sphincter; LHA: levator hiatus angle; URA: urethral rotation angle.
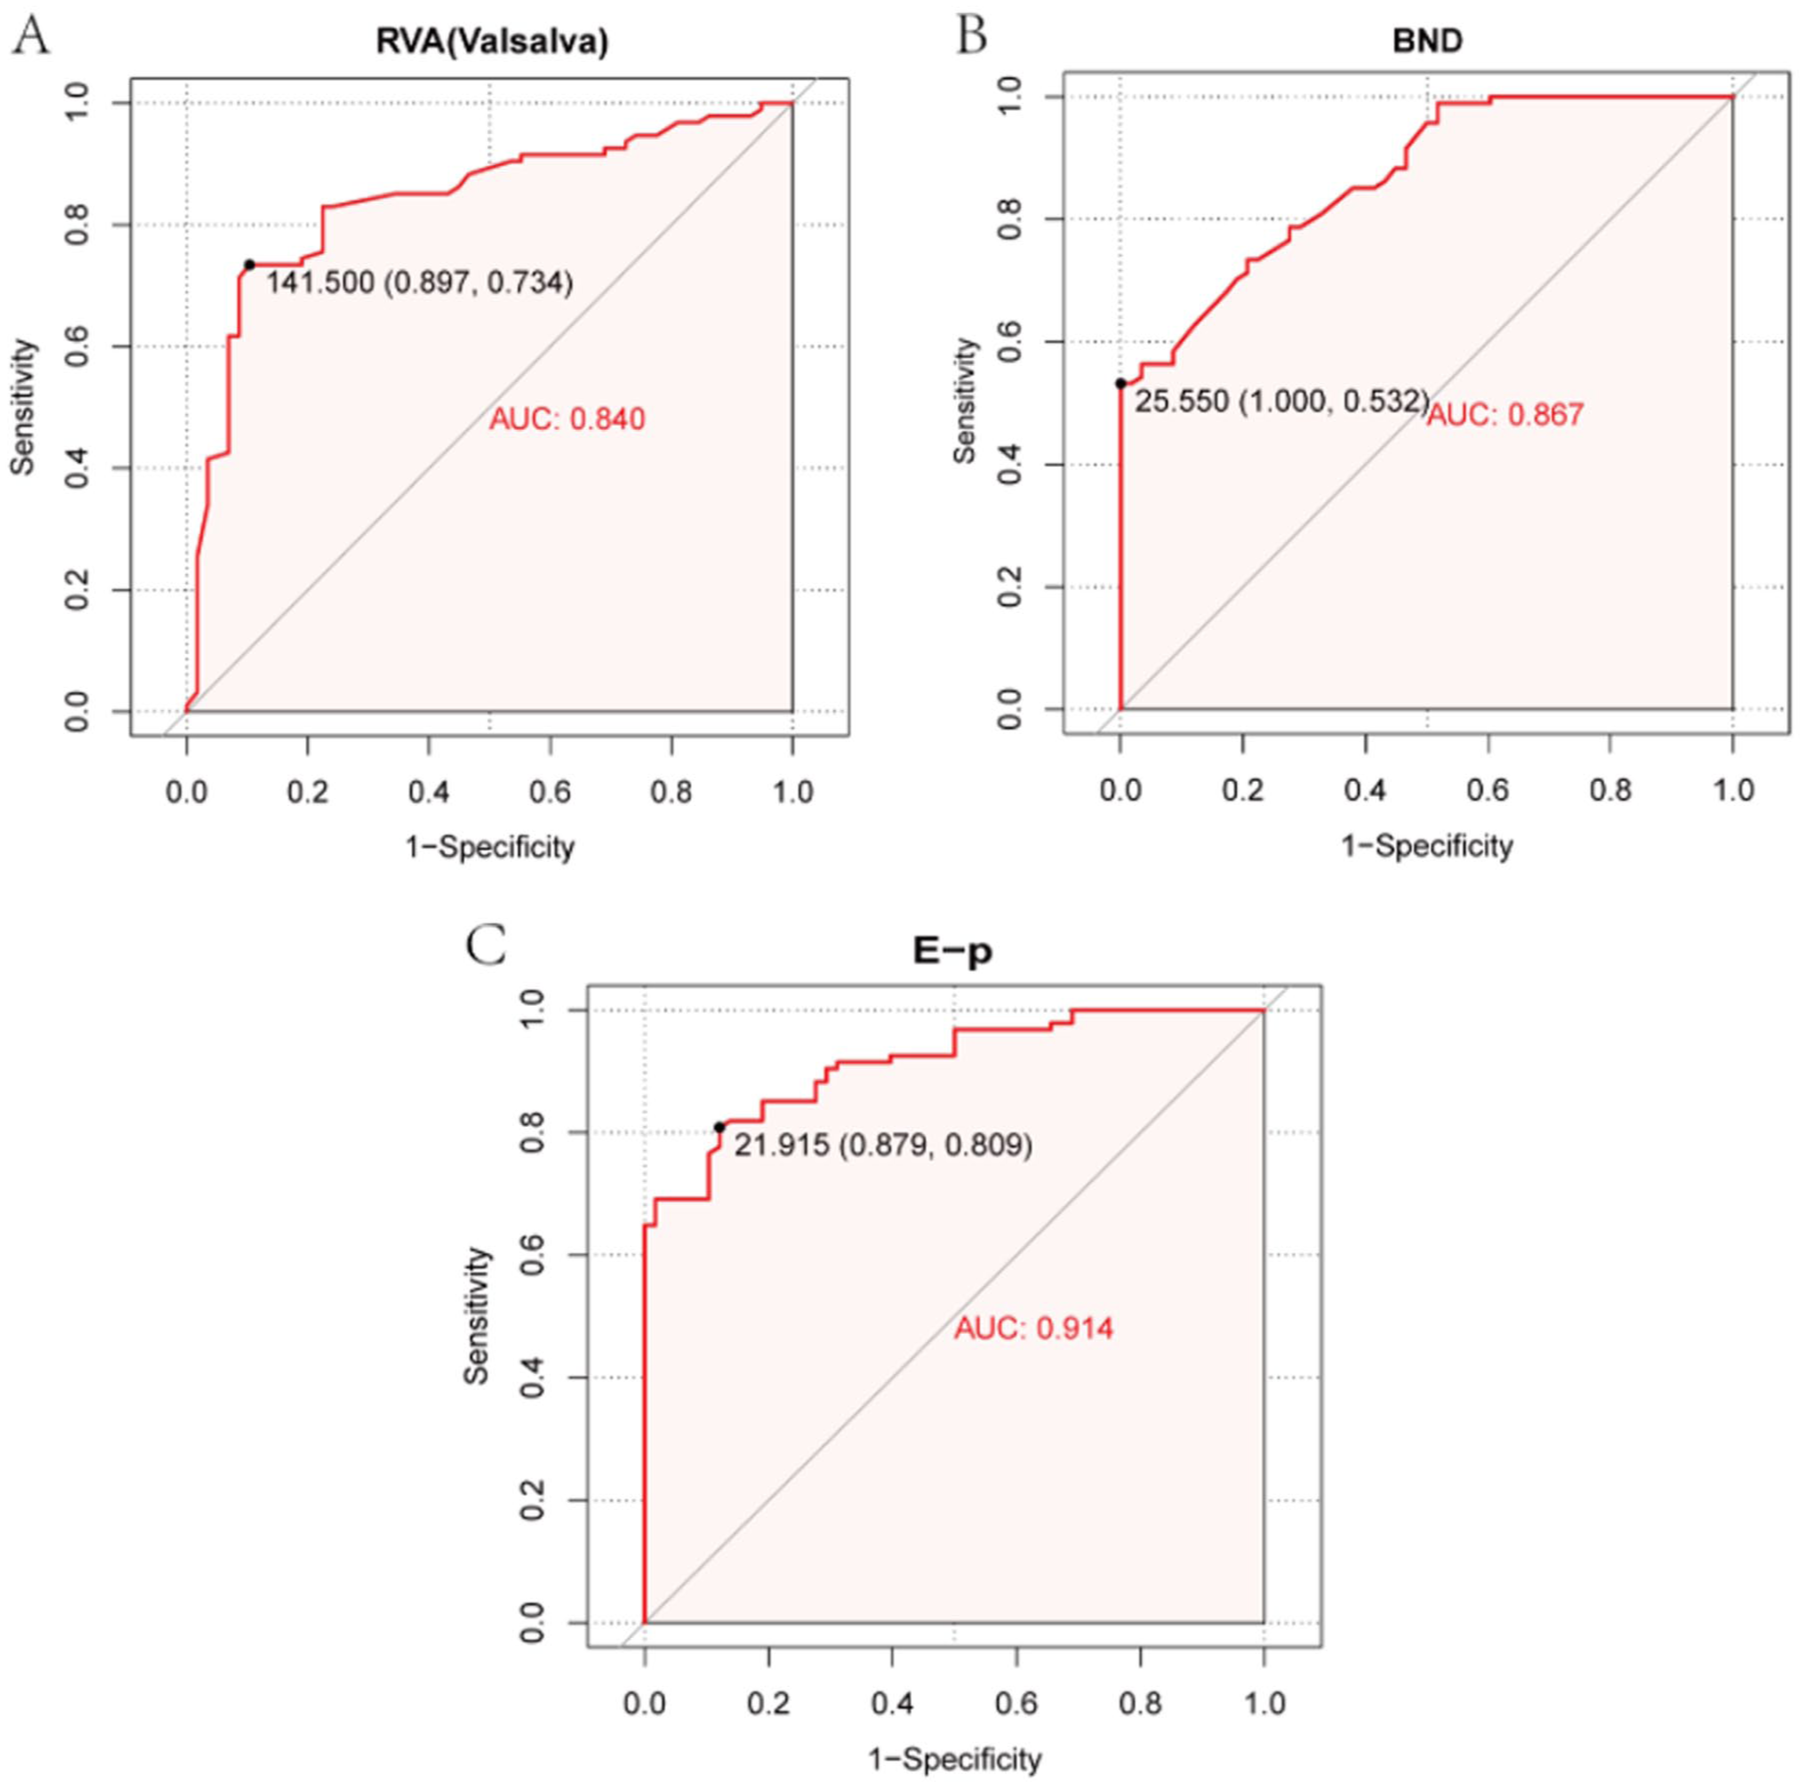
ROC analysis of diagnostic efficacy for independent risk factors. (a) RVA (Valsalva), (b) BND, and (c) E-p.
Nomogram model for independent risk factors of postpartum SUI and validation of model performance using ROC/calibration curve
A nomogram model was constructed based on the three independent risk factors identified through multivariate logistic regression. The results indicated that the risk score for developing SUI increased with higher RVA (Valsalva) and BND values and lower E-p values (Figure 3(a)). Subsequent results of model performance evaluation showed that the ROC curve achieved an AUC of 0.984 (Figure 3(b)), indicating excellent model efficacy. In the Calibration plot, the fitted curve of the model after calibration closely aligned with the ideal curve (Figure 3(c)), further demonstrating optimal model performance. To further validate the performance of the model, we performed fivefold cross-validation as an internal validation of the model. In the fivefold cross-validation process, the model was trained and evaluated on five different subsets of the dataset. The AUC values obtained from the five cross-validation runs were 0.895, 0.912, 0.901, 0.910, and 0.899 (Figure 3(d)). The average AUC was 0.903 with a standard deviation of 0.006. Although these results differ slightly from the AUC of 0.984 reported in our study, all AUC values remained above 0.9, indicating that the model retains strong predictive ability and demonstrates excellent performance. The DCA curve, with net benefit rate on the vertical axis and high-risk threshold probability on the horizontal axis, suggests that this nomogram model has a high clinical value for predicting postpartum SUI when the high-risk threshold probability ranges from 0 to 1 (Figure 3(e)).

Nomogram model for independent risk factors and evaluation of model efficacy. (a) Nomogram model, (b) ROC analysis for model efficacy, (c) calibration plot for model efficacy validation, and (d) DCA curve.
Discussion
This study analyzed data from 152 postpartum women who underwent pelvic floor ultrasound. Initially, univariate analysis was conducted on the patient data. The results indicated that vaginal delivery, C-section, RVA (Valsalva), URA (Valsalva), LHA (Valsalva), BND, E-p, E-a/E-p, and urethral funneling were risk factors for postpartum SUI (p < 0.05), while age, BMI, number of deliveries, age of primiparity, neonatal weight (max), and E-a were not significantly related (p > 0.05). Subsequently, variables showing statistical differences in the univariate analysis were included in the multivariate logistic regression analysis. The results revealed that RVA (Valsalva), BND, and E-p were independent risk factors for postpartum SUI (p < 0.05).
Previous studies have shown that BND, resting bladder neck angle (RVA-R), and bladder neck angle during Valsalva maneuver (RVA-V) are greater in the SUI group than in the non-SUI group, with statistically significant differences (p < 0.05), particularly for BND and RVA-V (p = 0.00). 12 This is highly consistent with the findings of this study. Regarding BND, research by Hans Peter Dietz indicated that BND in women with SUI is significantly greater than in those without SUI, with values of 25 mm or higher defined as “overactive.” 13 In this study, the BND for women in the SUI group was 25.75 (22.78–27.9) mm, aligning closely with this previous research. Young’s modulus (E) can be used to assess tissue elasticity under different biological conditions.14 –17 A higher Young’s modulus value indicates greater tissue stiffness and lower tissue elasticity.18 –20 Previous studies have suggested that the elasticity of the levator ani muscle (LAM) quantified by SWE may serve as a predictive marker for SUI. 21 In addition, research by Liwen Sun’s team found that the elasticity of pelvic floor (PB) tissue in women with SUI was significantly higher than in healthy women. 22 This indicates that the Young’s modulus of pelvic floor tissue has been shown to have a strong correlation with the occurrence and development of SUI. Considering that multiple studies have indicated that increased bladder neck activity is a significant cause of SUI, and that the tissue of the urethral sphincter is softer (with greater tissue elasticity and lower Young’s modulus), this study included the Young’s modulus of the resting E-p as one of the variables studied. The results showed that E-p could serve as an independent risk factor for predicting postpartum SUI (p = 0.013 < 0.05). Currently, research on the correlation between E-p and postpartum SUI is limited, highlighting its potential as a non-invasive indicator worthy of clinical attention for disease prediction.
This study also constructed a nomogram model based on the three independent risk factors to comprehensively assess their correlation with the disease. A nomogram visualizes a multivariable regression model as an easy-to-use clinical tool, helping clinicians and researchers to provide intuitive and quantitative predictions of an individual patient’s risk or prognosis.23,24 The results showed that the risk score for developing SUI increased with higher RVA (Valsalva) and BND values and lower E-p values. Among these, E-p exhibited the strongest diagnostic efficacy, with a maximum risk score of 100, significantly higher than the maximum scores of 54 for RVA (Valsalva) and 62 for BND. This further emphasizes the potential clinical application value of E-p. Previous studies on nomogram models for postpartum SUI have shown that parity, occupation, education level, mode of delivery, use of oxytocin, maternal age, gestational number, second stage of labor, and infant birth weight are independent risk factors for postpartum SUI.25,26 The three risk factors identified in our study provide further complementary evidence to these previous findings. Ultimately, the results of the ROC curve and calibration plot showed high model performance, and the DCA curve indicated that the model has high clinical utility when the high-risk threshold probability is between 0 and 1.
However, this study has several limitations. First, it was a single-center, small-sample study limited to a Chinese population, which restricts the generalizability of the findings. Second, long-term postpartum outcomes were not assessed, and some symptoms may resolve spontaneously within 12 months after delivery. In addition, the predictive model constructed in this study lacks external validation; future studies with multicenter, large-sample cohorts are needed to further validate the model and improve its robustness and applicability.
In summary, RVA (Valsalva), BND, and E-p are independent risk factors for postpartum SUI, and the nomogram model constructed from these factors demonstrates good predictive validity and high clinical application value. A limitation of this study is that the sample data were collected from a single center, and the sample size may not be sufficient to fully substantiate all the conclusions of this study.
Conclusion
RVA (Valsalva), BND, and E-p are independent risk factors for postpartum SUI. The nomogram model based on these factors demonstrated high diagnostic performance (AUC = 0.984), suggesting potential utility for clinical application. However, this model is preliminary and requires validation in larger, multicenter cohorts before widespread use.
Supplemental Material
sj-docx-1-smo-10.1177_20503121251407038 – Supplemental material for Prediction of risk factors for postpartum stress urinary incontinence based on pelvic floor ultrasound combined with clinical information
Supplemental material, sj-docx-1-smo-10.1177_20503121251407038 for Prediction of risk factors for postpartum stress urinary incontinence based on pelvic floor ultrasound combined with clinical information by Yin Chen and Tao Zhang in SAGE Open Medicine
Footnotes
Acknowledgements
We would like to thank Nantong University and Yancheng Third People’s Hospital for providing the platform that ensured the smooth conduct of this study.
Ethical considerations
The experimental procedures involving human ultrasound data were approved by the Ethics Committee of the Third People’s Hospital of Yancheng (Yancheng, China; approval number: 2023-99). This study adheres to the principles of the Declaration of Helsinki.
Consent to participate
All participants were fully informed of the study’s objectives, procedures, and potential risks and benefits. Written informed consent was obtained from all participants prior to their inclusion in the study. All participants voluntarily agreed to take part in the research and explicitly consented to the use of their clinical and ultrasound data for research purposes.
Author contributions
Conceptualization: Y.C. and T.Z. Funding acquisition: T.Z. Methodology: T.Z. Project administration: Y.C. and T.Z. Writing – original draft: Y.C. Writing – review and editing: Y.C. and T.Z.
Funding
The authors disclosed receipt of the following financial support for the research, authorship, and/or publication of this article: The 2022 Clinical College (Yancheng Third People’s Hospital) Special Scientific Research and Development Fund Project (20229155).
Declaration of conflicting interests
The authors declared no potential conflicts of interest with respect to the research, authorship, and/or publication of this article.
Data availability statement
The datasets used and/or analyzed during the current study are available from the corresponding author upon reasonable request.
Supplemental material
Supplemental material for this article is available online.
References
Supplementary Material
Please find the following supplemental material available below.
For Open Access articles published under a Creative Commons License, all supplemental material carries the same license as the article it is associated with.
For non-Open Access articles published, all supplemental material carries a non-exclusive license, and permission requests for re-use of supplemental material or any part of supplemental material shall be sent directly to the copyright owner as specified in the copyright notice associated with the article.