
Abstract
Objective
Medullary thyroid carcinoma is a rare malignancy with heterogenous outcomes, and the existing American Joint Committee on Cancer staging system does not adequately incorporate patient- or treatment-specific prognostic factors.
Methods
Patients with medullary thyroid carcinoma were identified from the Surveillance, Epidemiology, and End Results database and randomly assigned to derivation and validation groups. Five prognostic approaches, including Cox regression, least absolute shrinkage and selection operator-Cox, CoxBoost, random survival forest, and extreme gradient boosting, were evaluated using Harrell’s concordance index. Least absolute shrinkage and selection operator-Cox, which demonstrates optimal performance and simplicity, was selected to develop a nomogram to predict 3- and 5-year mortality.
Results
A total of 4157 patients were included, with 2938 assigned to the derivation group and 1219 to the validation group. The least absolute shrinkage and selection operator-Cox model demonstrated strong predictive performance, yielding Harrell’s concordance indices of 0.813 and 0.852, both exceeding those of American Joint Committee on Cancer staging (0.730 and 0.722). Calibration plots showed close agreement between predicted and observed mortality, and decision curve analysis revealed that the nomogram provided a higher net benefit compared with strategies of treating all or no patients.
Conclusion
A nomogram integrating demographic, clinical, and treatment factors was developed to predict individual survival in medullary thyroid carcinoma, providing complementary information to American Joint Committee on Cancer staging and facilitating personalized risk stratification.
Keywords
Introduction
Medullary thyroid carcinoma (MTC) is a rare but aggressive form of thyroid cancer, accounting for approximately 2%–5% of all thyroid malignancies.1,2 Despite its low prevalence, the incidence and mortality rates of MTC have increased in recent decades. 3 A population-based study using the Surveillance, Epidemiology, and End Results (SEER) database reported average annual percent changes of 1.64% and 3.46% for incidence and mortality, respectively, between 2000 and 2020. 4 Data from the Marne–Ardennes registry indicated that the standardized incidence increased from 0.41 to 0.57 per 100,000 person-years between 1986 and 2018. 5 Survival outcomes for patients with MTC are highly heterogeneous, reflecting differences in tumor biology, stage at diagnosis, and treatment modalities. There is also growing concern regarding overtreatment, including unnecessary extensive surgery or adjuvant therapy. These variations highlight the need to better differentiate patients at low and high risk of poor outcomes, particularly to inform clinical decision-making regarding surgery, lymph node dissection, and adjuvant management. 6
The American Joint Committee on Cancer (AJCC) staging system remains the primary method for prognostic stratification in MTC. However, it predominantly relies on the tumor–node–metastasis (TNM) classification and does not incorporate patient-specific demographic or treatment-related factors that may influence outcomes. Consequently, patients with the same AJCC stage may experience markedly different survival outcomes, suggesting that TNM-based staging alone cannot fully capture prognostic heterogeneity.7,8 Furthermore, the current system does not integrate clinical and therapeutic parameters, including age, sex, surgical extent, and adjuvant therapy, all of which affect outcomes.9–12 These limitations underscore the need for comprehensive, individualized prediction tools that incorporate multiple prognostic domains. Recent advances in statistical and machine learning methods now enable the integration of demographic and treatment-related variables to develop models with enhanced accuracy and clinical interpretability.
Accordingly, this study aimed to develop and validate a personalized prognostic model for patients with MTC using a comprehensive, population-based cohort derived from the SEER database. Multiple statistical and machine learning methods were evaluated to determine the most appropriate approach for this rare malignancy. Based on the final model, a clinically applicable nomogram was constructed to predict 3- and 5-year mortality probabilities. By combining predictive accuracy with clinical interpretability, this model was intended to complement the AJCC staging system and support personalized risk stratification and clinical decision-making in MTC management.
Methods
This study was conducted in accordance with the Transparent Reporting of a Multivariable Prediction Model for Individual Prognosis or Diagnosis guideline for developing and validating prediction models. 13
Study population
Patients diagnosed with MTC were retrospectively identified from the SEER database (2000–2022).The SEER program, a comprehensive, population-based cancer registry administered by the National Cancer Institute, systematically collects data on cancer incidence, patient demographics, tumor characteristics, treatment modalities, and survival outcomes. The Covering approximately 28% of the United States population, the SEER database is widely regarded as a representative source of population-level cancer data. Its standardized data collection protocols and extensive longitudinal follow-up make it an invaluable resource for epidemiological and outcomes studies. 14
Eligible cases were identified based on histological confirmation of MTC and the availability of complete data on demographics, tumor characteristics, treatment modalities, and survival outcomes. The exclusion criteria included patients aged <18 years, those with missing essential clinical data, and those with incomplete follow-up information. After applying the exclusion criteria, 4157 patients were included in the final analysis. To develop and validate the prediction model, the cohort was divided using stratified random sampling by year of diagnosis into a derivation group (n = 2938) and a validation group (n = 1219), maintaining a predefined 7:3 ratio between the two groups.
Variables and outcomes
The demographic variables analyzed in this study included age, sex, race, and marital status. Age was considered a continuous variable. Race was categorized into three groups: White, Black, and Other. The “Other” category comprised individuals identifying as American Indian/Alaska Native, Asian (Chinese, Japanese, Filipino, Korean, Vietnamese, Asian Indian, Pakistani, and other specified Asian subgroups), Pacific Islander (Hawaiian, Samoan, Tongan, Guamanian, and others), and those with unspecified or unknown racial identities. Marital status was dichotomized as married/partnered versus unmarried, with the latter group comprising individuals who were single, divorced, widowed, or of unknown marital status.
Tumor-related variables included histological grade, T stage, N stage, M stage, and tumor size. Tumor grade was classified as I–IV, with unknown values retained as a separate category because of their high frequency. T, N, and M stages were recorded in accordance with the AJCC staging system, with Tx, Nx, and Mx representing unknown status. Tumor size was categorized as ≤1, >1 and ≤2, >2 and ≤4, >4 cm, or unknown.
Treatment-related variables included the type of thyroid surgery, extent of lymph node resection, use of radiotherapy, and surgical procedures for metastatic lesions outside the thyroid. Thyroid surgery was classified as none, partial thyroidectomy (lobectomy and subtotal thyroidectomy as defined in the SEER database), or total thyroidectomy. The extent of lymph node dissection within the thyroid region was categorized according to the SEER variable “Scope of Regional Lymph Node Surgery” as no lymph node surgery, radical dissection, modified dissection, or selective dissection. Radiotherapy was recorded as administered or not administered. Surgical procedures for metastatic lesions outside the thyroid were categorized as none, surgery for distant metastases, surgery for distant lymph nodes (defined in SEER as noncervical nodal sites, such as mediastinal, axillary, retroperitoneal, or inguinal lymph nodes), surgery for other regions, or combined surgery. Metastatic status was determined for the lung, bone, liver, and brain, with each site coded as yes, no, or unknown.
The primary endpoint was overall survival, defined as the time from diagnosis to death from any cause or the last follow-up. Survival time was recorded in months and censored for patients who were alive at the last contact.
Handling of missing data
In the cohort of 4157 patients, most variables were complete, although a few contained missing values. Age was missing in 0.26% of cases, whereas staging variables exhibited a higher proportion of missing data, with approximately 10.6% of records missing T, N, or M classifications. The extent of lymph node dissection was missing in 1.0% of cases, and information on thyroid surgery was missing in 0.01% of cases. Complete data were available for all remaining covariates. The missing data mechanism was assumed to be missing at random. To minimize potential bias arising from incomplete information, multiple imputation by chained equations was performed using the ‘mice’ package in R software. 15 Continuous variables, including age, were imputed using predictive mean matching. Binary variables were imputed using logistic regression, and categorical variables with more than two categories, such as T, N, and M classifications, were imputed using polytomous regression. A total of 5 imputed datasets were generated, each with 20 iterations, and estimates were combined across datasets using Rubin’s rules.
Statistical analysis
Statistical analyses were conducted using R software (version 3.6.2). Continuous variables were presented as mean ± standard deviation (SD) or median with interquartile range, depending on their distribution. Categorical variables were reported as frequencies with corresponding percentages.
Model development
Five methodologies were employed for prognostic modeling: Cox proportional hazards regression, least absolute shrinkage and selection operator-Cox (LASSO-Cox) regression, 16 CoxBoost, 17 random survival forest (RSF), 18 and extreme gradient boosting (XGBoost). 19 Model performance was assessed using Harrell’s concordance index (C-index) in the derivation and validation groups. LASSO-Cox regression was selected for the final model due to its optimal balance between discrimination and simplicity.
In addition to predictive accuracy, model interpretability and clinical usability were considered. The LASSO-Cox method retained the linear structure of the Cox regression model, enabling direct interpretation of coefficients as hazard ratios (HRs). By applying L1 regularization, it eliminated redundant predictors, resulting in a smaller but informative subset of variables and maintaining robust predictive performance. This balance between parsimony and performance makes the model well-suited for constructing a transparent, clinically applicable nomogram.
Model performance evaluation
Model performance was further assessed in the derivation and validation groups. Discrimination was quantified using Harrell’s C-index with 95% confidence intervals (CIs).20,21 Calibration was evaluated by comparing predicted versus observed probabilities of 3- and 5-year mortality using calibration plots derived from 1000 bootstrap resamples. 21 For comparative purposes, the prognostic accuracy of the eighth edition of the AJCC staging system was also assessed using the C-index, and statistical analyses were performed to evaluate differences between models.
Nomogram construction
Independent prognostic factors identified through LASSO-Cox regression were used to develop a nomogram for predicting 3- and 5-year mortality probabilities. Each predictor was assigned a score proportional to its regression coefficient, and the cumulative score was used to determine the predicted probabilities. The nomogram was presented graphically to facilitate individualized survival prediction.
Clinical utility
Decision curve analysis (DCA) 22 was conducted to assess the potential clinical utility of the nomogram. This method evaluated whether the model improves clinical decision-making compared with default strategies over a range of threshold probabilities. In the present study, DCA was performed for 3- and 5-year mortality predictions in the derivation cohort. The net benefit of the nomogram was compared with two reference strategies: one assuming all patients were high risk and managed accordingly (“treat all”) and another assuming no patients were high risk, with no additional intervention implemented (“treat none”).
Results
Study patients
Baseline characteristics of the study population are summarized in Table 1. The derivation cohort comprised 2938 patients, whereas the validation cohort included 1219 patients. Both cohorts demonstrated comparable demographic and clinical profiles. The median age was 56 years (IQR: 44–67) in the derivation cohort and 55 years (IQR: 43–66) in the validation cohort. Males accounted for 58% of patients in each cohort. Racial distribution was comparable between the derivation and validation cohorts, with 68.4% of patients being White in both cohorts, 8.8% and 7.8% being Black, and 22.8% and 23.8% from other races, respectively.
Comparison of characteristics between the derivation and validation groups.
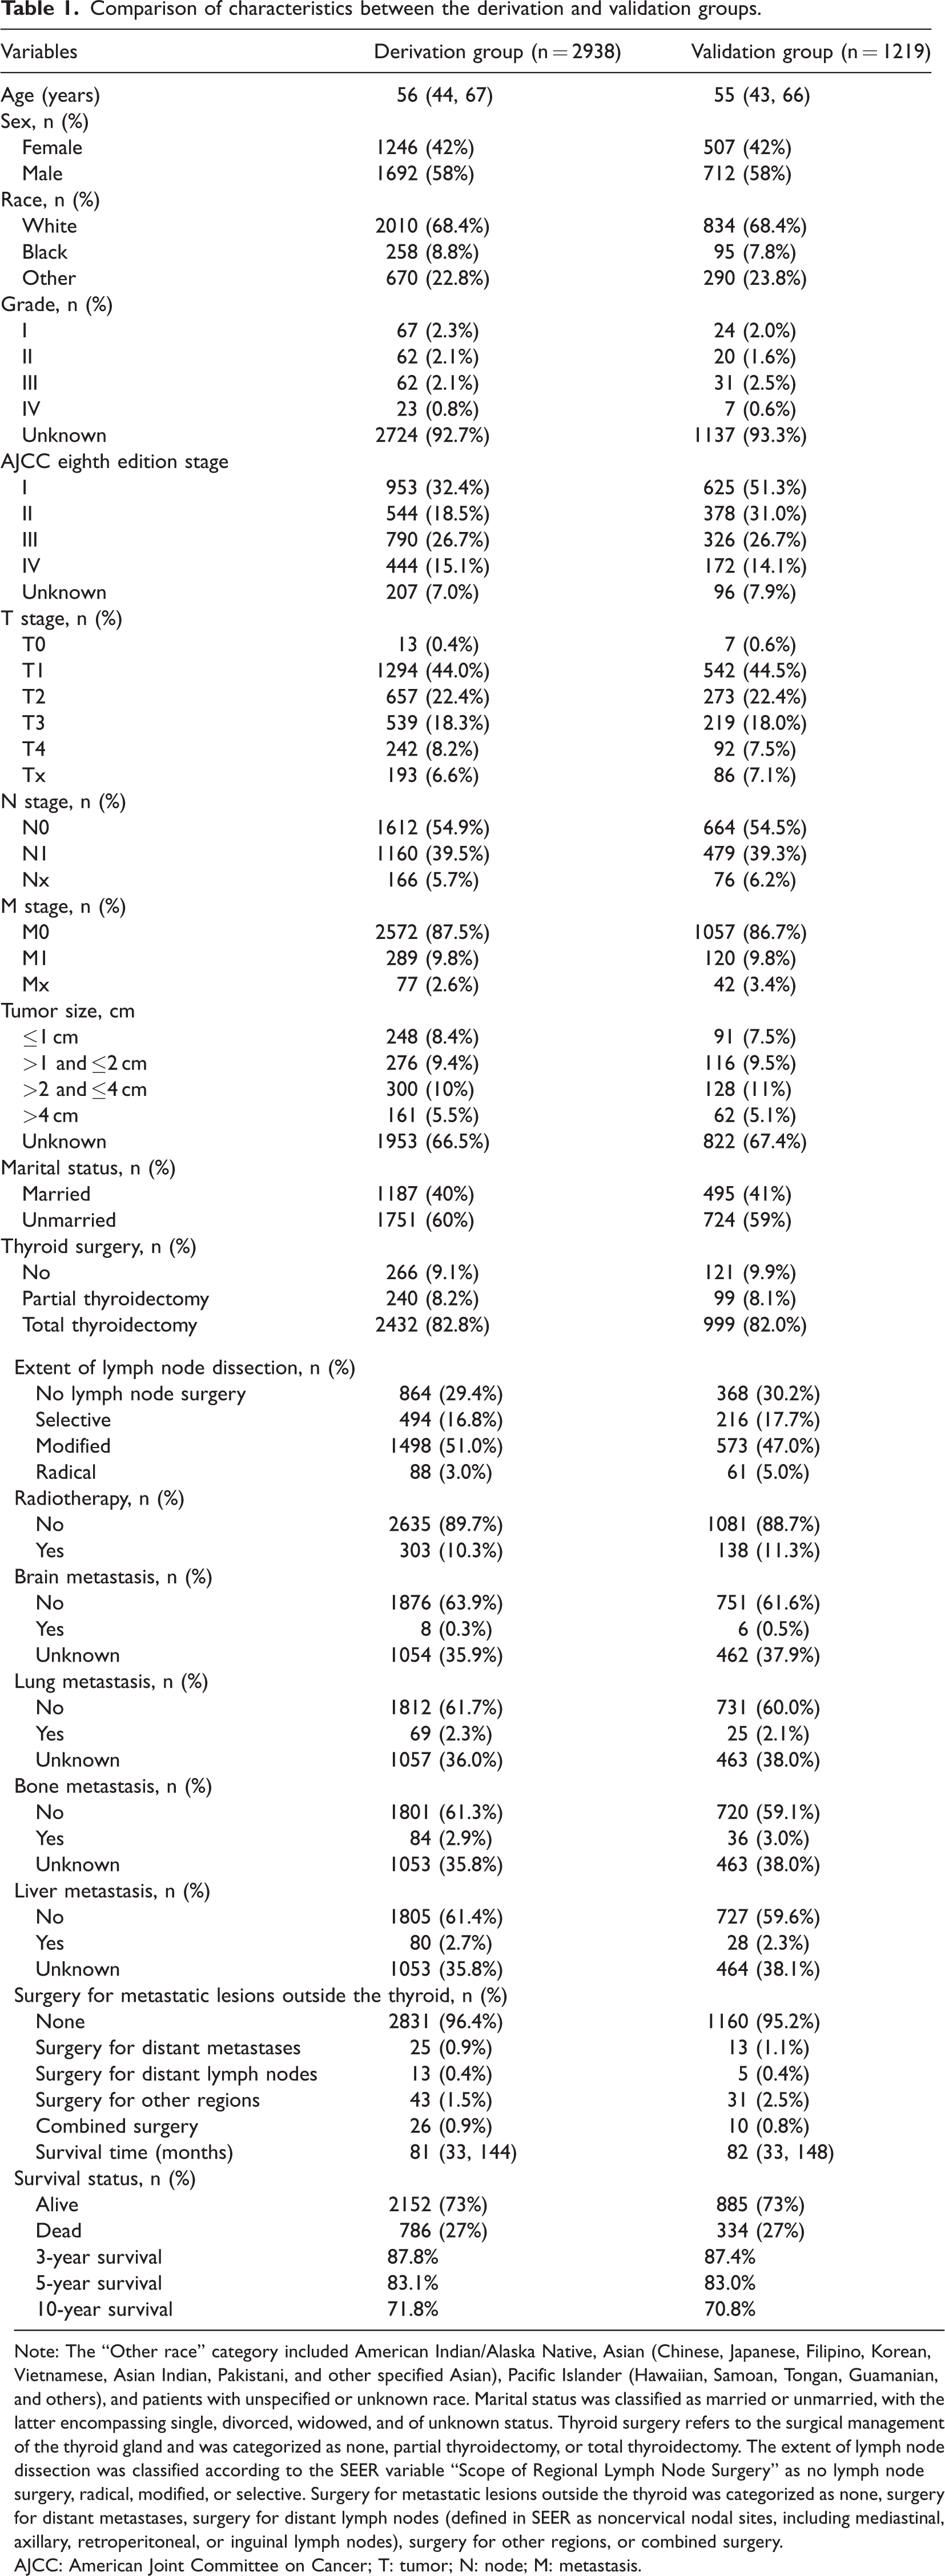
Note: The “Other race” category included American Indian/Alaska Native, Asian (Chinese, Japanese, Filipino, Korean, Vietnamese, Asian Indian, Pakistani, and other specified Asian), Pacific Islander (Hawaiian, Samoan, Tongan, Guamanian, and others), and patients with unspecified or unknown race. Marital status was classified as married or unmarried, with the latter encompassing single, divorced, widowed, and of unknown status. Thyroid surgery refers to the surgical management of the thyroid gland and was categorized as none, partial thyroidectomy, or total thyroidectomy. The extent of lymph node dissection was classified according to the SEER variable “Scope of Regional Lymph Node Surgery” as no lymph node surgery, radical, modified, or selective. Surgery for metastatic lesions outside the thyroid was categorized as none, surgery for distant metastases, surgery for distant lymph nodes (defined in SEER as noncervical nodal sites, including mediastinal, axillary, retroperitoneal, or inguinal lymph nodes), surgery for other regions, or combined surgery.
AJCC: American Joint Committee on Cancer; T: tumor; N: node; M: metastasis.
Regarding tumor characteristics in the derivation and validation cohorts, T1–T2 disease accounted for approximately two-thirds of cases (66.4% vs 66.9%), and nodal involvement was observed in 39.5% and 39.3% of patients, respectively, and distant metastases occurred in 9.8% of cases in both cohorts.
In terms of treatment, total thyroidectomy was performed in 82.8% and 82.0% of patients in the derivation and validation cohorts, respectively; partial thyroidectomy in 8.2% and 8.1%; and no thyroid surgery in 9.1% and 9.9%. Regarding lymph node management, no lymph node surgery was performed in 29.4% and 30.2% of patients, selective dissection in 16.8% and 17.7%, modified dissection in 51.0% and 47.0%, and radical dissection in 3.0% and 5.0%, respectively. Radiotherapy was administered to 10.3% of patients in the derivation cohort and 11.3% in the validation cohort.
Overall survival outcomes were comparable between the cohorts, with a median survival of 81 months. The 3-, 5-, and 10-year overall survival rates were approximately 87%, 83%, and 71%, respectively.
Prediction model construction using LASSO-Cox in the derivation group
Five machine learning–based approaches were evaluated for their efficacy in prognostic modeling: LASSO-Cox, traditional Cox regression, CoxBoost, RSF, and XGBoost. Model performance was assessed using the C-index in the derivation and validation groups (Table 2). In the derivation group, RSF exhibited the highest C-index (0.832), followed by LASSO-Cox (0.813), traditional Cox regression (0.812), and CoxBoost (0.812). XGBoost demonstrated relatively lower discriminative performance, with a C-index of 0.727. In the validation group, LASSO-Cox exhibited superior performance (0.852), marginally outperforming traditional Cox regression (0.849) and CoxBoost (0.849), whereas RSF (0.834) and XGBoost (0.743) were less effective. Pairwise comparisons indicated that the differences were not statistically significant. Based on statistical performance and clinical interpretability, the LASSO-Cox model was selected as the final approach. It provides predictive accuracy comparable to more complex algorithms and uses fewer variables. Its sparse structure reduces overfitting, enhances transparency, enables direct interpretation through HRs, and supports the development of a clinically practical nomogram.
C-indices of different models in the derivation and validation groups.
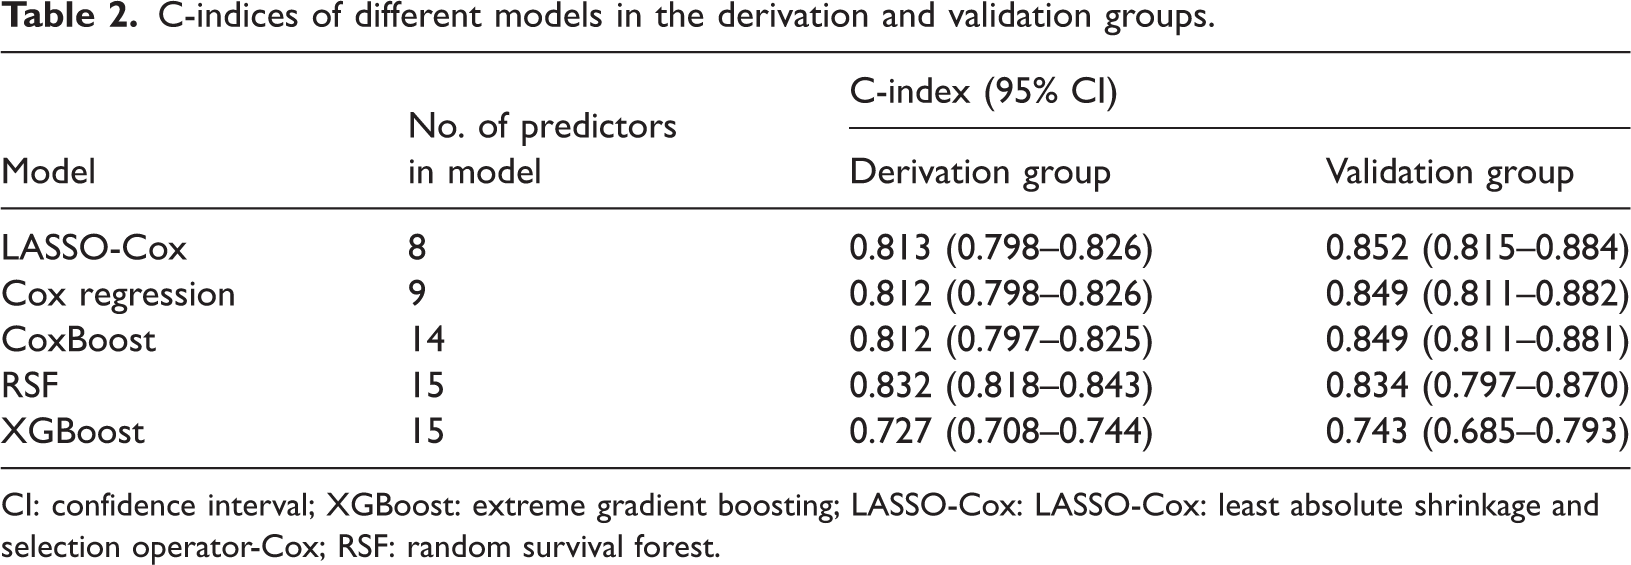
CI: confidence interval; XGBoost: extreme gradient boosting; LASSO-Cox: LASSO-Cox: least absolute shrinkage and selection operator-Cox; RSF: random survival forest.
LASSO-Cox regression analysis in the derivation group
To identify the most informative prognostic variables and minimize overfitting, the LASSO regression technique was initially applied. The optimal penalty parameter (λ) was determined via 10-fold cross-validation. Figure 1 presents the partial likelihood deviance curve and coefficient profiles. Using the minimum deviance criterion, 12 variables were selected for subsequent modeling.
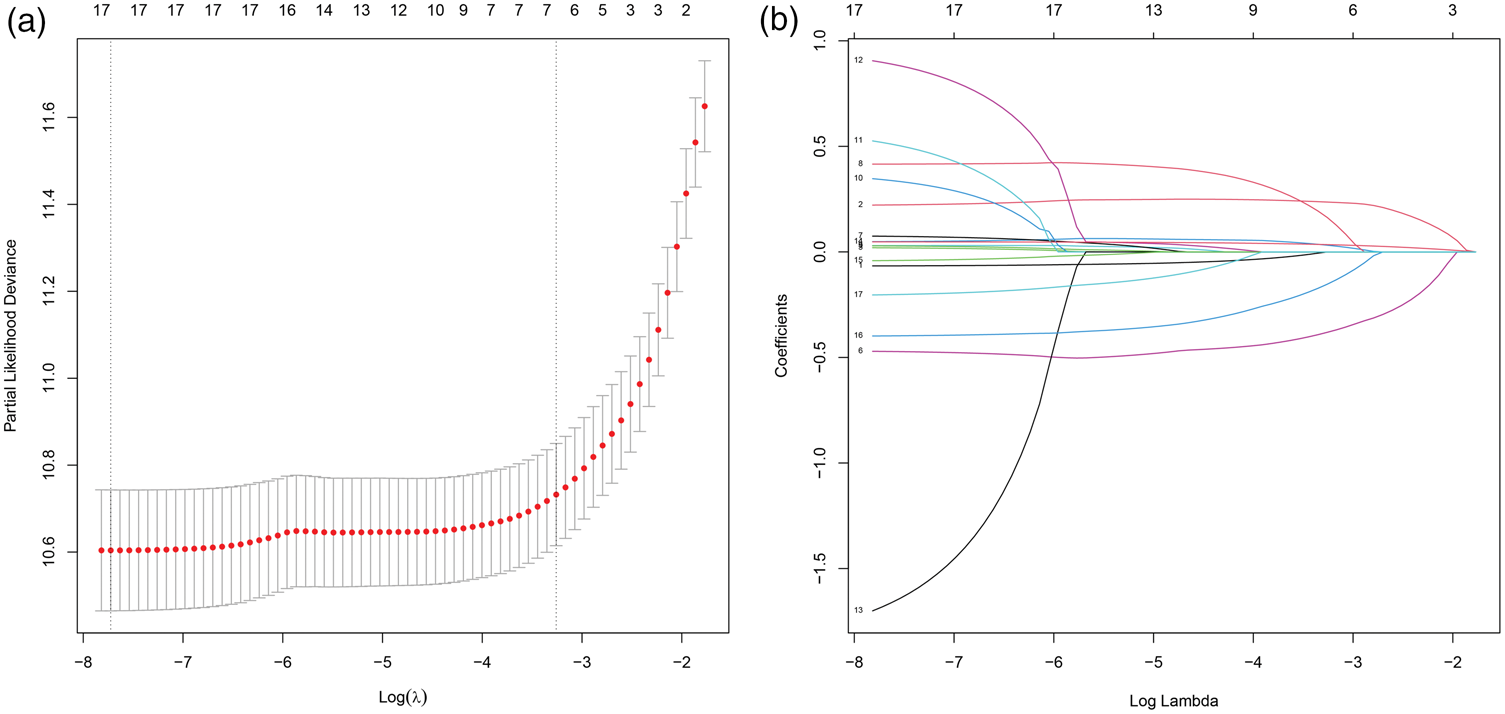
Variable selection using LASSO regression in the derivation group. (a) Selection of the tuning parameter (λ) in the LASSO model using 10-fold cross-validation. Partial likelihood deviance is plotted against log(λ), with red dots indicating mean deviance values and error bars representing SDs. Vertical dashed lines denote the λ values corresponding to the minimum deviance and the one–standard-error criterion. (b) LASSO coefficient profiles of candidate variables as a function of log(λ). Each colored curve represents the coefficient trajectory of an individual variable. At the optimal λ value, 17 predictors were retained and subsequently incorporated into the multivariable Cox regression model. LASSO: least absolute shrinkage and selection operator; SD: standard deviation.
The selected variables were incorporated into a multivariable Cox regression model to identify independent predictors of survival (Table 3). Advancing age was strongly associated with increased mortality risk, with an approximately 5% increase in hazard per additional year (p < 0.001). Male patients experienced significantly poorer outcomes than female patients (HR: 1.44, 95% CI: 1.23–1.69; p < 0.001). Nodal and distant metastases were identified as major prognostic determinants: N1 disease was associated with a 71% higher mortality risk compared with N0 (HR: 1.71, 95% CI: 1.44–2.03; p < 0.001), whereas M1 disease resulted in nearly a 5-fold increase in mortality risk (HR: 4.71, 95% CI: 3.83–5.78; p < 0.001). Treatment-related factors also significantly influenced survival outcomes. Compared with total thyroidectomy, the absence of surgery (HR: 2.39, 95% CI: 1.92–2.98; p < 0.001) and partial thyroidectomy (HR: 1.33, 95% CI: 1.07–1.65; p = 0.009) were associated with inferior outcomes. Radiotherapy was independently linked to reduced survival (HR: 1.62, 95% CI: 1.33–1.96; p < 0.001). Furthermore, marital status emerged as a significant prognostic factor, with unmarried patients exhibiting a higher risk of mortality than their married counterparts (HR: 1.30, 95% CI: 1.11–1.52; p < 0.001). In the analysis of metastatic sites, brain metastasis was identified as an independent adverse prognostic factor (HR: 2.80, 95% CI: 1.22–6.39; p = 0.015), and patients with undetermined brain metastasis status also exhibited an elevated risk (HR: 1.38, 95% CI: 1.17–1.64; p < 0.001). Other tumor- and treatment-related characteristics did not demonstrate independent prognostic significance.
Multivariable Cox analysis of the association between variables and prognosis in the derivation group.
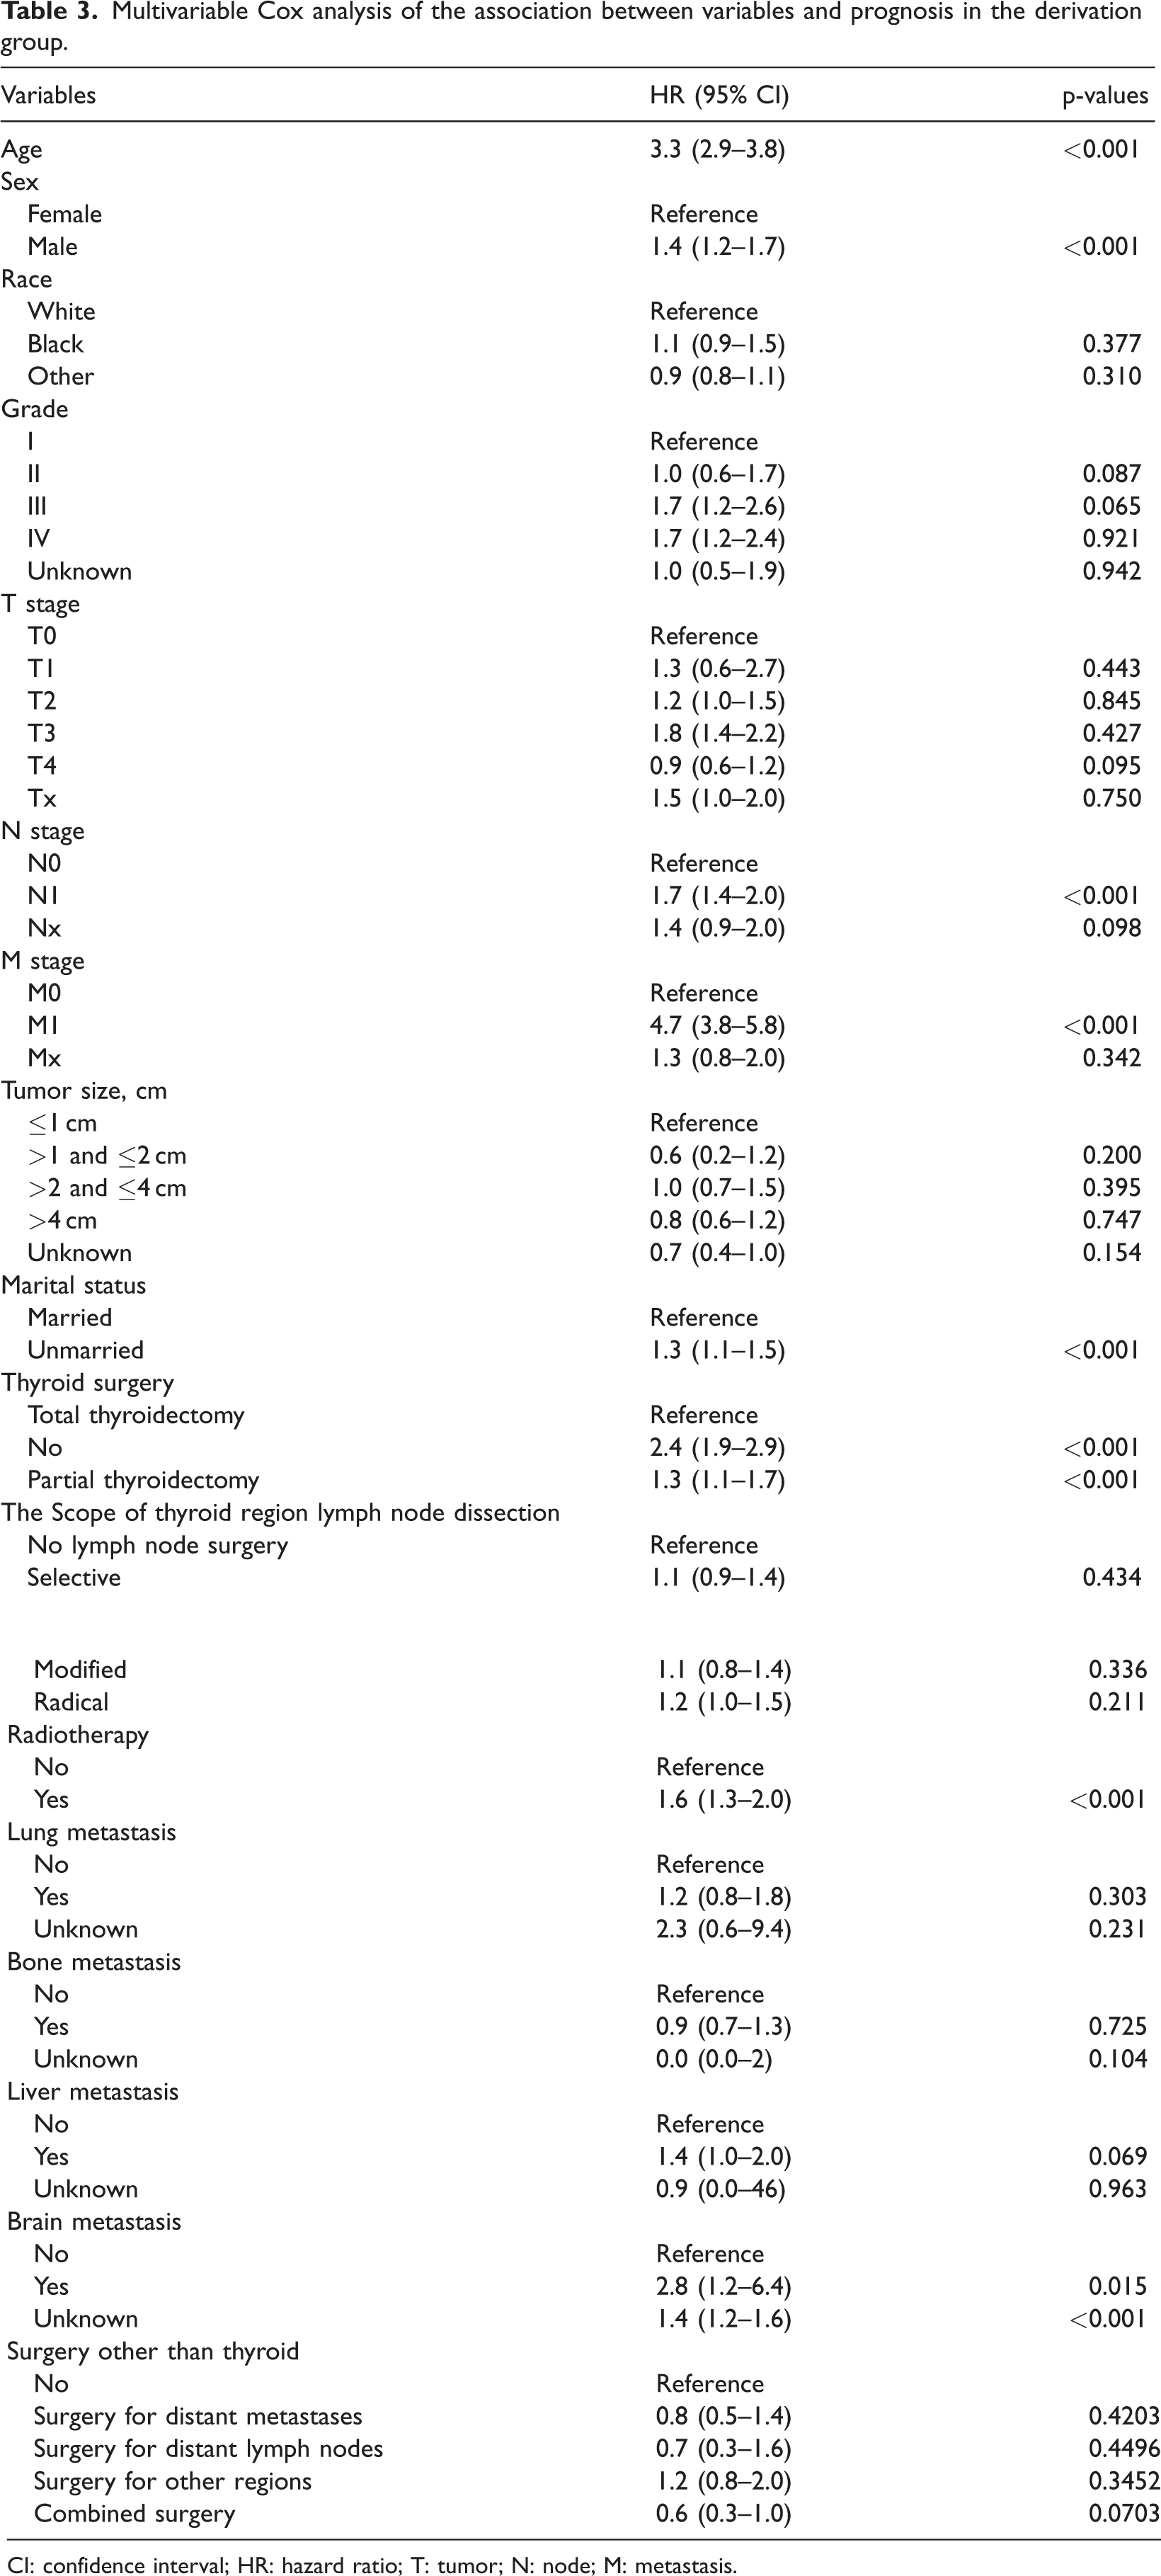
CI: confidence interval; HR: hazard ratio; T: tumor; N: node; M: metastasis.
LASSO-Cox model prediction performance
The discriminative ability of the LASSO-Cox model was evaluated using Harrell’s C-index (Table 2). Consistent with the derivation phase, the model demonstrated discrimination comparable to or exceeding that of other machine learning methods, with stable performance in the derivation and validation groups.
Calibration was evaluated using calibration plots for 3- and 5-year mortality (Figure 2). In the derivation group, the 3-year (Figure 2(a)) and 5-year calibration curves (Figure 2(b)) showed close agreement between predicted and observed probabilities, with minor deviations at higher predicted risk levels. In the validation group, the 3-year (Figure 2(c)) and 5-year (Figure 2(d)) calibration plots demonstrated a similar pattern, with slight overestimation in patients with higher predicted risks. These findings indicate that the LASSO-Cox model achieved satisfactory discrimination and calibration in both groups.

Calibration curves of the LASSO-Cox model for predicting 3- and 5-year mortality in patients with MTC. (a) Calibration plot for 3-year mortality in the derivation group; (b) calibration plot for 5-year mortality in the derivation group; (c) calibration plot for 3-year mortality in the validation group; (d) calibration plot for 5-year mortality in the validation group. The x-axis represents the nomogram-predicted probability of mortality, and the y-axis indicates the observed probability estimated using the Kaplan–Meier method. The diagonal dashed line denotes perfect calibration, indicating complete agreement between predicted and observed outcomes. The solid line represents the performance of the LASSO-Cox model, and vertical bars indicate 95% CIs. CIs: confidence intervals; LASSO-Cox: least absolute shrinkage and selection operator-Cox; MTC: medullary thyroid carcinoma.
Model comparison with AJCC staging
In the derivation group, the eighth edition of the AJCC staging system achieved a C-index of 0.730 (95% CI: 0.705–0.755), significantly lower than that of the LASSO-Cox model (p < 0.001). Similarly, in the validation group, the AJCC system attained a C-index of 0.722 (95% CI: 0.693–0.751), which was significantly lower than the corresponding value of the LASSO-Cox model (p < 0.001).
Construction of the nomogram
Based on the independent prognostic factors identified through multivariable Cox regression analysis, a nomogram was constructed to predict individualized 3- and 5-year mortality probabilities for patients with MTC (Figure 3). The model incorporated variables, including age, sex, nodal status, distant metastasis, marital status, type of thyroid surgery, receipt of radiotherapy, and presence of brain metastasis. Each predictor was assigned a weighted score, and the sum of these scores corresponded to the estimated probability of mortality. For instance, a 70-year-old male patient with N1 and M0 disease who underwent total thyroidectomy without subsequent radiotherapy and is unmarried would have a total score of approximately 498 points, corresponding to an estimated mortality probability of 11.9% at 3 years and 13.5% at 5 years. This graphical tool facilitates intuitive and personalized prognostication, thereby enhancing clinical decision-making and patient counseling.

Nomogram for predicting 3- and 5-year mortality in patients with MTC. The nomogram was constructed using independent prognostic factors identified through multivariable Cox regression, including age, sex, nodal status, distant metastasis, marital status, type of thyroid surgery, receipt of radiotherapy, and brain metastasis. Each variable is assigned a point value on the upper scale, and the total points obtained by summing across predictors are projected onto the lower scales to estimate 3- and 5-year mortality probabilities. For illustration, a male patient aged 70 years with N1 and M0 disease, unmarried status, who underwent total thyroidectomy, and received no radiotherapy obtained a total score of 498 points, corresponding to estimated 3- and 5-year mortality probabilities of 11.9% and 13.5%, respectively. MTC: medullary thyroid carcinoma.
Clinical utility of the nomogram
To evaluate the clinical utility of the nomogram, DCA was performed in the derivation group to predict 3- and 5-year mortality (Figure 4). The nomogram consistently outperformed the “treat all” and “treat none” strategies across a range of threshold probabilities, indicating that its application could yield a greater net benefit in guiding treatment decisions. Particularly, for 3-year (Figure 4(a)) and 5-year (Figure 4(b)) mortality predictions, applying the nomogram to identify high-risk patients may improve clinical outcomes compared with uniformly treating all patients or providing no intervention. These results suggest that the nomogram can enhance risk stratification and support personalized management by helping clinicians identify patients most likely to benefit from intensive therapy or more rigorous follow-up.
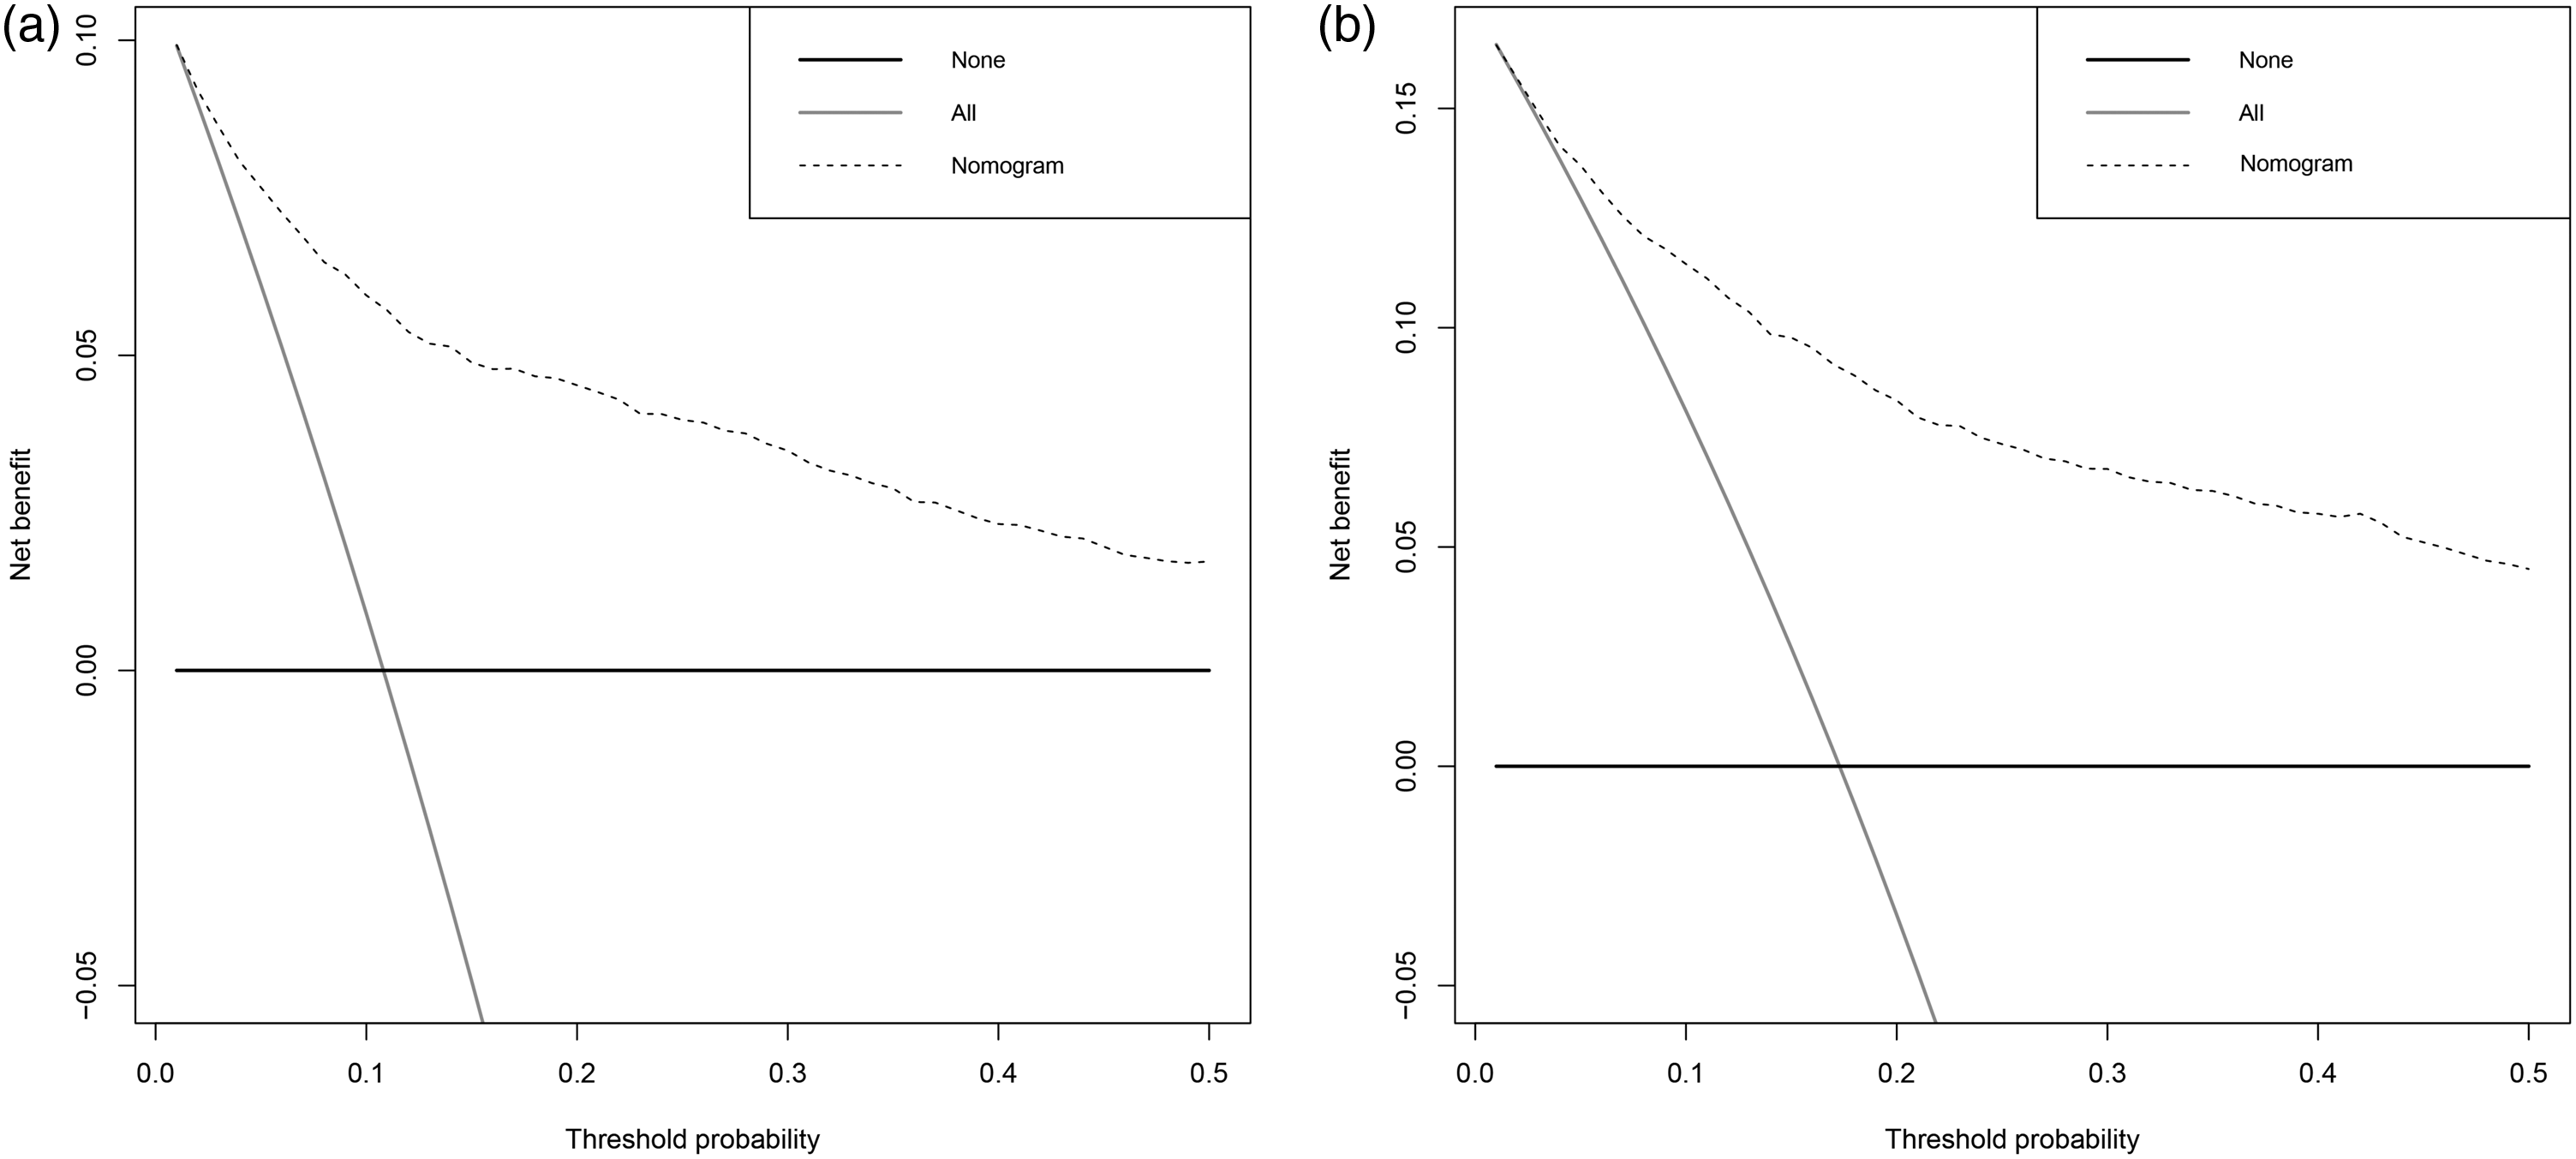
DCA of the nomogram for predicting 3- and 5-year mortality in patients with MTC. (a) Decision curve for 3-year mortality in the derivation group; (b) decision curve for 5-year mortality in the derivation group. The y-axis represents the net benefit, and the x-axis indicates the threshold probability. The horizontal black line labeled “None” represents the assumption that no patients experience the event, whereas the gray line labeled “All” represents the assumption that all patients experience the event. The dotted line represents the nomogram. Across a broad range of threshold probabilities, the nomogram demonstrates greater net benefit than “treat all” and “treat none” strategies, indicating its potential clinical utility in guiding individualized management. DCA: decision curve analysis; MTC: medullary thyroid carcinoma.
Discussion
In this large population-based study, a personalized prognostic model for patients with MTC was developed and validated using data from the SEER database. Comparative analysis of five modeling strategies indicated that the LASSO-Cox approach offered an optimal balance between predictive accuracy and model simplicity, supporting its selection for final model development. Multivariable Cox regression analysis identified several independent prognostic factors for survival, including age, sex, N stage, M stage, marital status, type of thyroid surgery, radiotherapy, and presence of brain metastasis. Using these variables, a nomogram was constructed to generate individualized 3- and 5-year mortality estimates. The model demonstrated strong discrimination and satisfactory calibration in the derivation and validation groups, outperforming the AJCC staging system in prognostic accuracy. DCA further confirmed its potential clinical utility, yielding a higher net benefit across a range of threshold probabilities compared with default strategies.
This study identified several clinical and treatment-related factors that substantially influenced prognosis in MTC, many of which align with previous findings. Older age23,24 and male sex25,26 were associated with poorer outcomes, consistent with the broader thyroid cancer literature, reflecting increased biological aggressiveness and reduced treatment tolerance in these subgroups. Nodal and distant metastases remained major survival determinants, underscoring the central role of tumor dissemination in MTC progression and highlighting the need for meticulous staging at diagnosis.27,28 The extent of thyroid surgery was also a critical factor, with patients undergoing total thyroidectomy exhibiting superior survival than those undergoing partial resection or no surgery, highlighting the importance of achieving complete disease clearance when feasible.28,29 Radiotherapy emerged as an independent factor associated with poorer survival outcomes, likely reflecting underlying clinical and biological characteristics. Patients receiving radiotherapy often present with advanced, residual, or recurrent disease, which inherently carries a worse prognosis. Compared with other thyroid cancers, MTC demonstrates relative resistance to radiation due to its C-cell origin and lack of iodine uptake, reducing the efficacy of radiotherapy. Consequently, the observed negative association may indicate that radiotherapy acts more as a marker of aggressive disease rather than a direct cause of poorer outcomes, highlighting the need for careful patient selection when considering adjuvant radiotherapy for MTC.30,31 Although rare, brain metastases were identified as a significant adverse prognostic factor, consistent with the clinical observation that patients with central nervous system involvement generally have limited therapeutic options and poor survival. Marital status independently influenced prognosis, with unmarried patients exhibiting higher mortality than married patients. This association reflects psychosocial and behavioral factors, as married individuals often benefit from stronger social support, greater psychological resilience, and better adherence to treatment. Conversely, unmarried patients may have reduced healthcare engagement and support, which can adversely affect survival. These findings emphasize the impact of social determinants on cancer prognosis and highlight the need for enhancing psychosocial support and patient-centered care to improve outcomes.32–34
The rising incidence of thyroid cancer without a corresponding decline in mortality has raised concerns regarding potential overdiagnosis and overtreatment in clinical practice.35,36 This trend underscores the need for advanced prognostic tools that extend beyond conventional stage-based systems. Although the AJCC staging system is widely used, it predominantly relies on the TNM classification and does not incorporate important clinical and treatment-related factors, thereby limiting its ability to capture individual variability in outcomes. In contrast, the nomogram developed in this study combines multiple prognostic factors to generate quantitative estimates of 3- and 5-year mortality risk. By offering individualized risk assessments rather than relying solely on categorical staging, it improves prognostic precision, facilitates nuanced patient counseling, and informs the appropriate intensity of follow-up care. Although external validation remains necessary, DCA in the derivation group indicated that implementing the nomogram can provide a greater net clinical benefit compared with AJCC staging or uniform management strategies, highlighting its potential as a tool for personalized patient care.
The primary objective of a prognostic model is not only to achieve statistical precision but also to offer actionable guidance for the management of individual patients. Traditional metrics, such as discrimination and calibration, are informative but do not fully reflect the clinical consequences of errors in risk prediction.37–39 To overcome this limitation, this study employed DCA to quantify the net benefit of model-guided decisions across a range of threshold probabilities. 40 DCA demonstrated that the nomogram consistently conferred greater net benefit than “treat all” or “treat none” strategies for predicting 3- and 5-year mortality. These findings suggest that the model can help clinicians identify patients likely to benefit from more intensive treatment or monitoring and sparing lower-risk patients from unnecessary interventions. In contrast to the AJCC staging system, which categorizes patients into broad groups, the nomogram provides a more detailed and individualized risk assessment, thereby enhancing its applicability to real-world clinical decision-making.
This study has several limitations that warrant consideration. First, the retrospective design may have inherently introduced potential selection bias and unmeasured confounding. Second, although the SEER database provides a large and representative dataset, it lacks critical information on biochemical markers, such as calcitonin and carcinoembryonic antigen, as well as molecular alterations, including RET and RAS mutations, which are known to influence prognosis in MTC. The absence of these variables may have limited the comprehensiveness of our model. Third, data regarding systemic therapies, including the use of tyrosine kinase inhibitors, were unavailable, which may have influenced survival outcomes for a subset of patients. Fourth, external validation in independent populations was not conducted; instead, a derivation–validation split within SEER was employed, leaving the model’s generalizability to other settings unverified. Finally, although DCA indicated potential clinical utility, prospective studies are necessary to confirm the nomogram’s real-world impact on guiding patient management.
Conclusion
This study developed a prognostic nomogram integrating key demographic, clinical, and treatment-related factors to predict individualized survival in patients with MTC. The model has the potential to complement conventional staging systems and facilitate personalized risk stratification. Future studies should focus on external validation and prospective assessment to establish the nomogram’s clinical utility and support its use in clinical decision-making for patient care.
Footnotes
Acknowledgments
Not applicable.
Author contributions
Zexu Zhan, Xiaolong Gui, and Jiehua Li participated in study concept, design, and drafting of the manuscript; Wenlong Cao, Shulin Huang, and Zexu Zhan participated in acquisition, analysis and interpretation of data; Zexu Zhan and Jiehua Li participated in critical revision of the manuscript for important intellectual content.
Funding
This work was supported by grants from the National Natural Science Foundation of China (No. 82460569 and No. 82560717) and the ‘Medical Excellence Award’ Funded by the Creative Research Development Grant from the First Affiliated Hospital of Guangxi Medical University.