
Abstract
Objective
Reimbursement trends for common procedures have persistently declined over the past 2 decades. Spinal instrumentational and fusion procedures are increasingly utilized and have increased in clinical complexity, yet longitudinal inflation-adjusted data for Medicare reimbursements of these procedures have not been evaluated.
Methods
The Centers for Medicare and Medicaid Services (CMS) Physician Fee Schedule Look-Up Tool was used to extract Medicare reimbursements for the 5 most common spinal procedures and associated instrumentations from 2000-2020. Current Procedural Terminology (CPT) codes include 22551, 22600, 22633, 63030, and 63047 as well as instrumentation CPT codes 22840 and 22842-6. The nominal values were adjusted for inflation according to the latest consumer price index (U.S. Bureau of Labor Statistics; reported as 2020 USD) and used to calculate average annual percent changes and compound annual growth rates (CAGRs) in reimbursements.
Results
After inflation adjustment, the physician fee reimbursement decreased by 11.05% ± 8.46% (mean ± s.d., from $2,009.89 in 2011 to $1,787.85 in 2020) for anterior cervical discectomy and fusion (ACDF), 28.38% ± 8.42% (from $1,889.38 in 2000 to $1,353.14 in 2020) for posterior cervical fusion, 7.85% ± 8.20% (from $2,111.20 in 2012 to $1,945.49 in 2020) for transforaminal lumbar interbody fusion (TLIF), 28.17% ± 13.88% (from $1,421.78 in 2000 to $1,021.22 in 2020) for lower back disc surgery, and 31.88% ± 8.22% (from $1,700.38 in 2000 to $1,158.25 in 2020) for lumbar laminectomy. Instrumentation reimbursements showed an average decrease of 33.43% ± 8.4% over this period. Average CAGR was −1.7% ± .41% for procedures and −2.02% ± .14% for instrumentation.
Conclusion
Our analysis reveals a persistent decline in reimbursement rates of the most common spine procedures and instrumentation since the year 2000. If unaddressed, this trend can serve as a substantial disincentive for physicians to perform these procedures and can significantly limit access to spinal care at the population level.
Introduction
Annualized health care spending growth rate in the United States (US) is estimated at 2.5-3% for both private and public insurance payments, after adjustment for population size and age. 1 According to a recent US health care spending report, among 154 conditions, low back and neck pain have the highest spending levels ($134.5 billion). 1 The breakdown of private vs public insurance coverage of these costs was estimated at 57% vs 33%, respectively. 1 This ratio deserves attention because these conditions are more prevalent in the elderly population, whose primary insurance coverage is Medicare.2,3 Additionally, an examination of billing vs reimbursements for inpatient spine surgical care suggests that the average collection for hospital billing is near 85%. In comparison, the average collection for physician fees for the same set of procedures is about 23% for Medicare insurance. 4
Despite this continued increase in spending and disproportionate allocation of fees to hospital costs,1,4 the inflation-adjusted Medicare physician reimbursements have shown a persistent decline over the past 2 decades in various age-related health conditions.5-7 Earlier studies showed that Medicare and non-Medicare reimbursement trends can vary, 8 highlighting the need to investigate reimbursement trends based on insurance status. This gap in the analysis is further emphasized with recent work demonstrating an association between insurance status and social determinants of health with spine surgery outcomes, including patient safety, prolonged length of stay (LOS), and post-operative emergency department visits.9-11 Specifically, Medicare patients had higher rates of prolonged LOS compared with commercial patients after controlling for age, sex, American Society of Anesthesiology Physical Status Classification (ASA Class), the Elixhauser Comorbidity Index, and the number of segments fused. 10 With respect to outpatient neurosurgical patient care, a recent analysis of Medicare reimbursement for neurosurgery office visits has shown a significant decrease over the past decade. 12 However, a similar inflation-adjusted analysis for the most common surgical spinal procedures and instrumentation has not been performed. This analysis is clinically relevant given the predicted large growth in spine surgical volume in the upcoming decade from its current statistics of 200,000 or more spinal fusions per year, 80% of whom are estimated to be over 50.2,13,14 This predicted growth is primarily driven by the fact that the US population continues to age and that degenerative spinal disorders are significantly more prevalent in the elderly.2,3,13 Other factors such as societal demands and expectations for improved quality of life into the advanced age also contribute to a foreseeable increase in spine procedures.
We sought to investigate the temporal reimbursement trends for the most common spine surgeries and their corresponding instrumentations from the year 2000 until 2020. Additionally, we examined the effect of bundling CPT codes over the study period. Given the predicted increase in surgical technology in spine surgery, 14 we also included instrumentation codes, which should remain an important consideration for future similar analyses.
Methods
Data Source
Current Procedural Terminology Codes, Descriptions, Time Window of Data Availability.
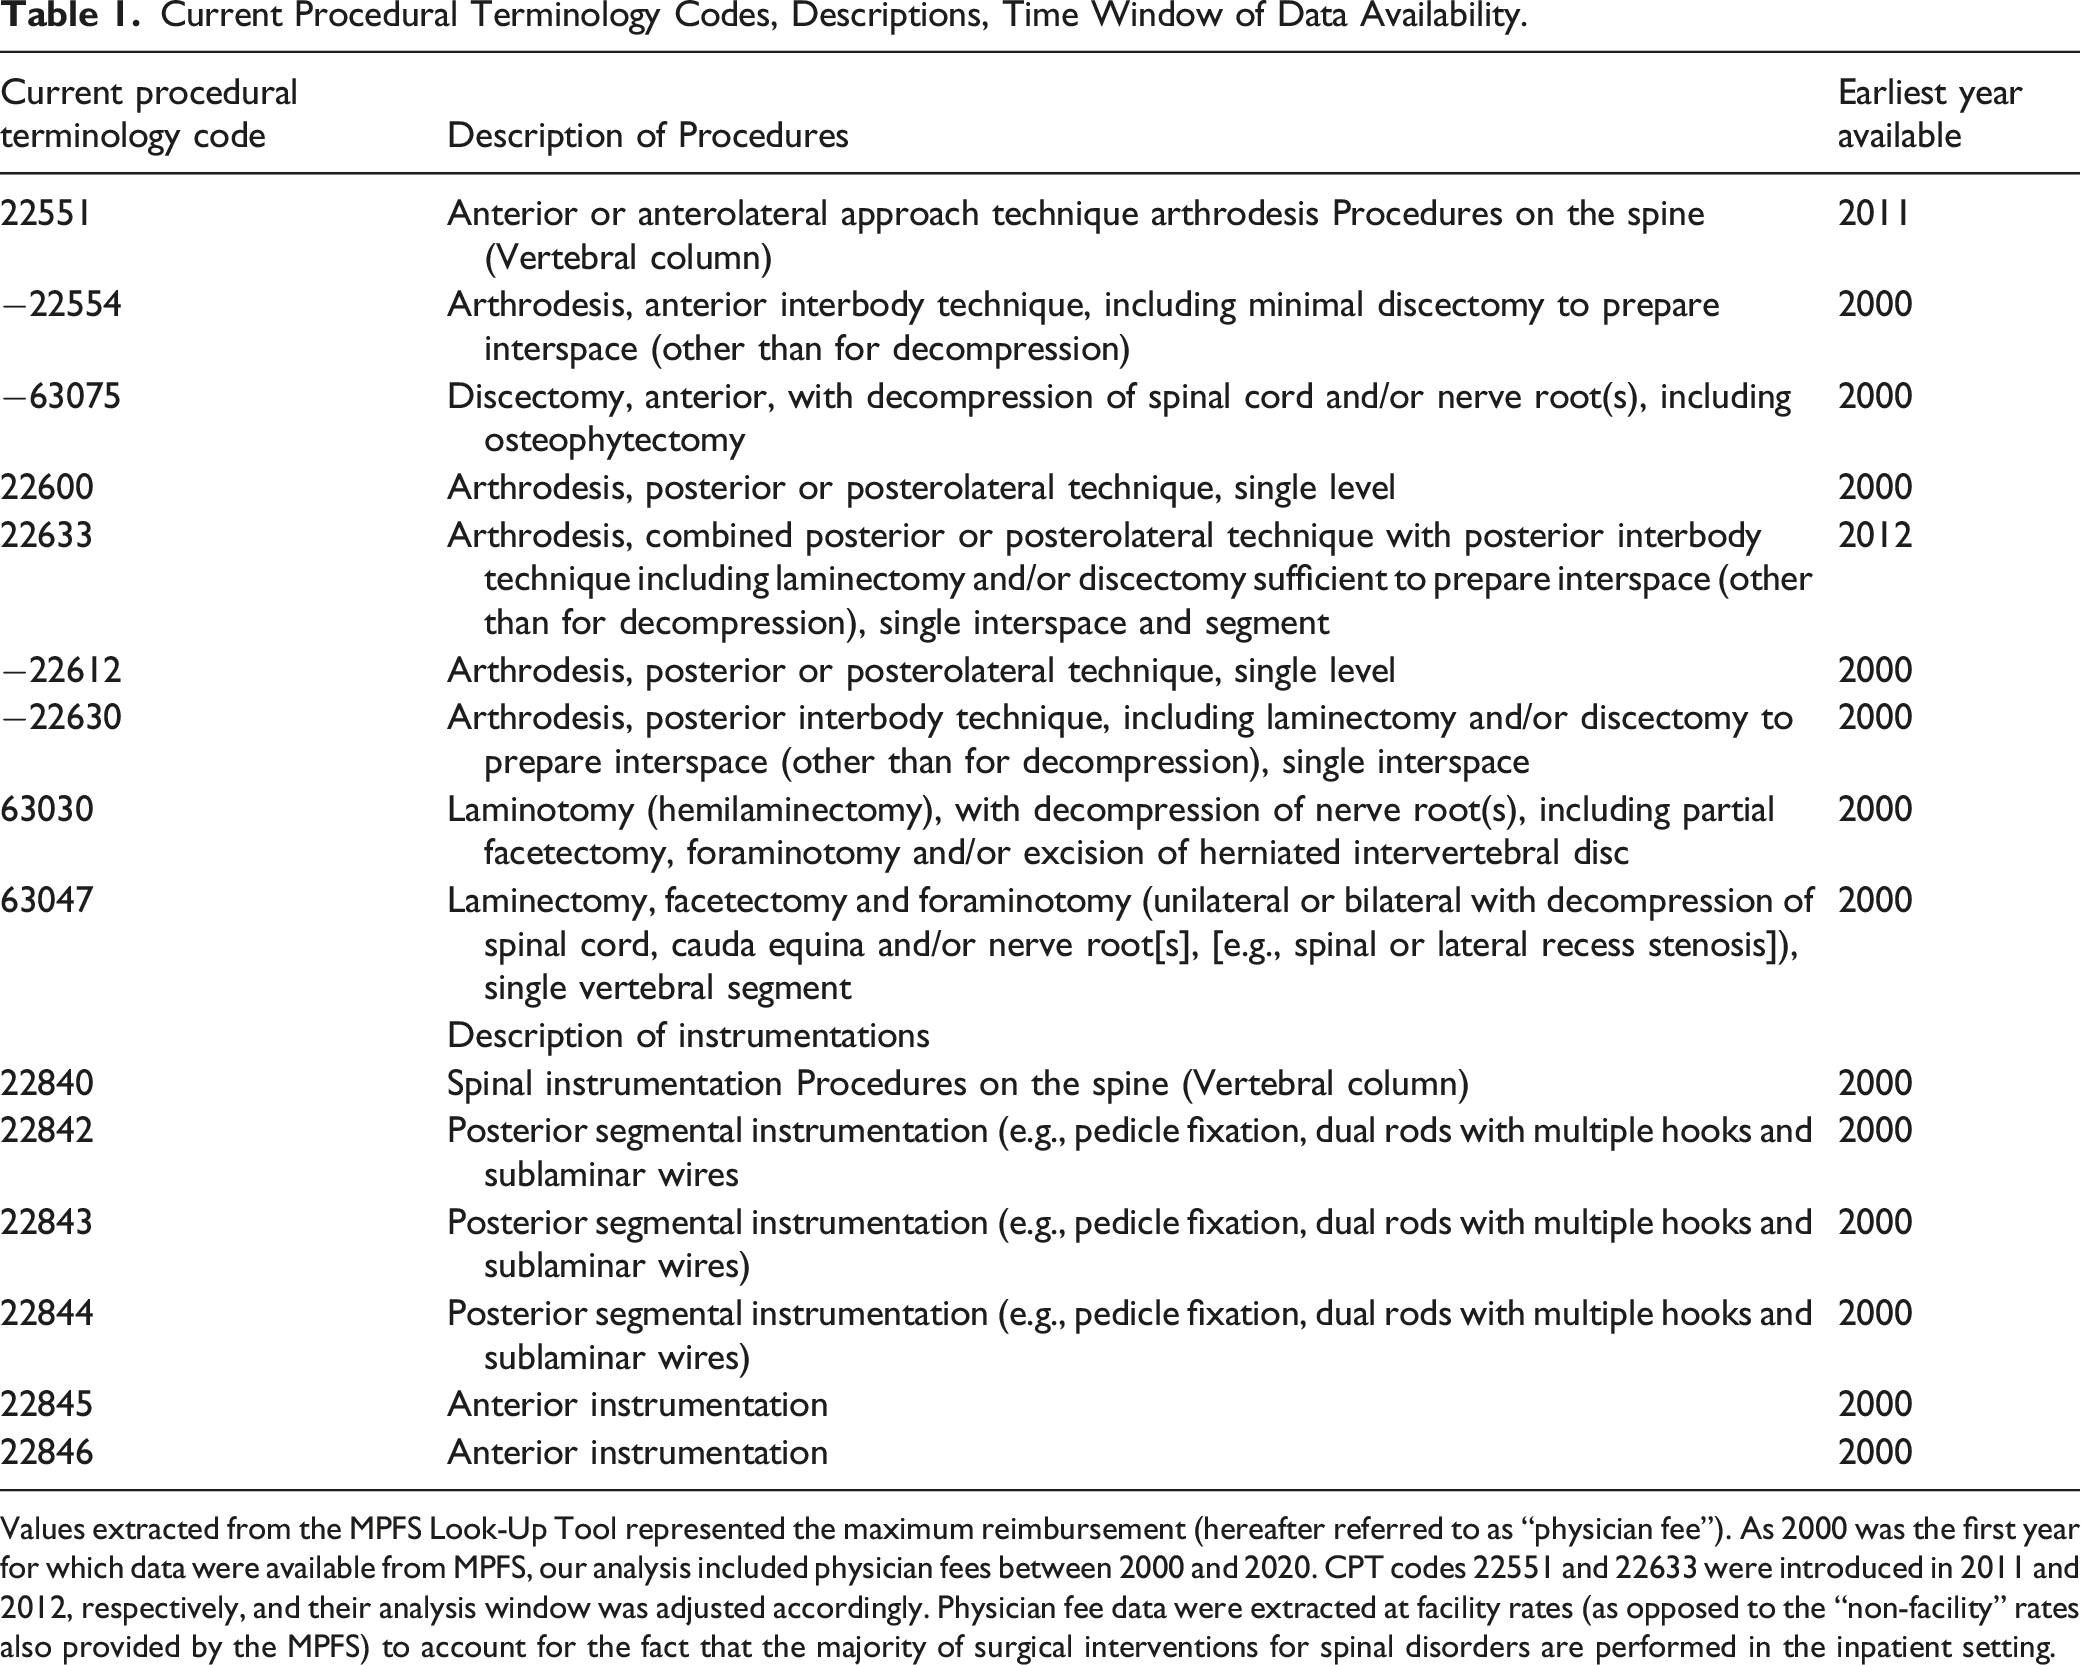
Values extracted from the MPFS Look-Up Tool represented the maximum reimbursement (hereafter referred to as “physician fee”). As 2000 was the first year for which data were available from MPFS, our analysis included physician fees between 2000 and 2020. CPT codes 22551 and 22633 were introduced in 2011 and 2012, respectively, and their analysis window was adjusted accordingly. Physician fee data were extracted at facility rates (as opposed to the “non-facility” rates also provided by the MPFS) to account for the fact that the majority of surgical interventions for spinal disorders are performed in the inpatient setting.
Data Collection
The CPT codes used in the present analysis are summarized in Table 1. Values extracted from the MPFS Look-Up Tool represented the maximum reimbursement (hereafter referred to as “physician fee”) and nominal (unadjusted for inflation) values are summarized in Supplemental Figure S1. As 2000 was the first year for which data were available from MPFS, our analysis included physician fees between 2000 and 2020. CPT codes 22551 and 22633 were introduced in 2011 and 2012, respectively, and their analysis window was adjusted accordingly. Physician fee data were extracted at facility rates (as opposed to the “non-facility” rates also provided by the MPFS) to account for the fact that the majority of surgical interventions for spinal disorders are performed in the inpatient setting.
Data Analysis
Physician fees were extracted from all Medicare Administrative Contractors (MACs) dispersed around the country and annual national averages (and standard deviations) for each year between 2000 and 2020 were calculated. Annual national averages for were adjusted to 2020 U.S. dollars (USD) using the most recent Consumer Price Index for All Urban Consumers (CPI-U) from the U.S. Bureau of Labor Statistics.
15
For each CPT code, the percentage change over the specified period and compound annual growth rate (CAGR) were calculated as follows5,16-19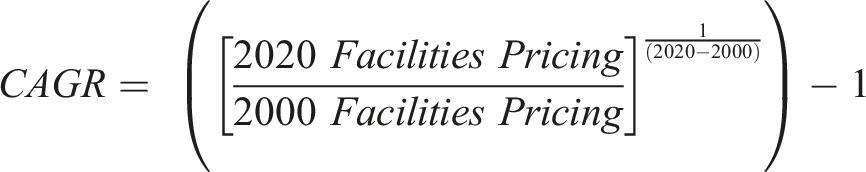
All statistical analyses including inflation-adjustments, CAGR tables, and generation of graphs were performed using Microsoft Excel (version 16.59). All continuous variables were reported as mean ± standard deviation. No statical analyses were performed between categorical variables (e.g., between different CPT codes) were reported in this study.
Results
Nominal Values for Medicare Physician Fee Reimbursement* for Spine Procedures by Current Procedural Terminology Code from 2000 to 2020.
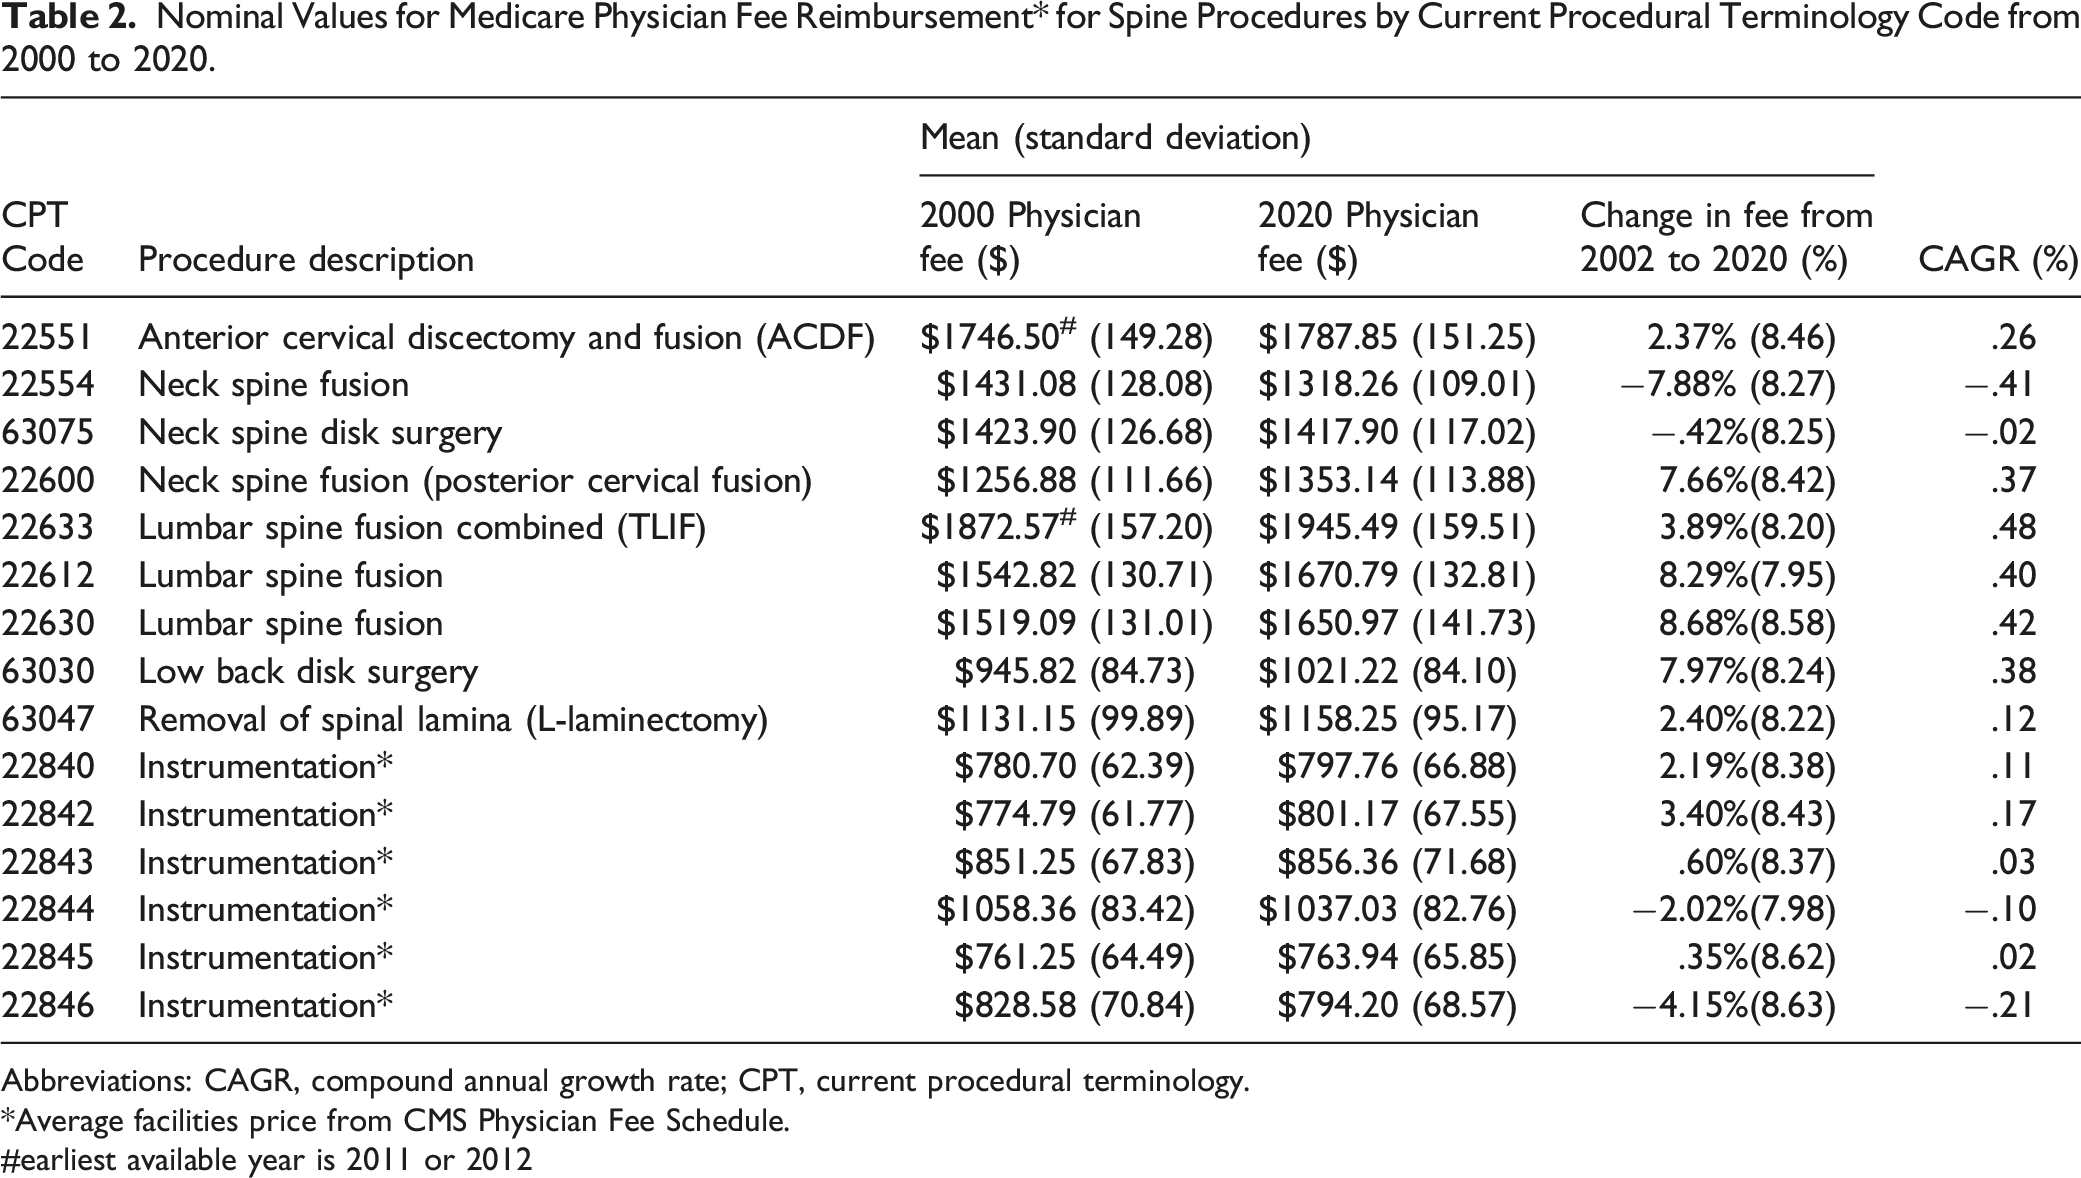
Abbreviations: CAGR, compound annual growth rate; CPT, current procedural terminology.
*Average facilities price from CMS Physician Fee Schedule.
#earliest available year is 2011 or 2012
Inflation-Adjusted Values for Medicare Physician Fee Reimbursement for Spine Procedures by current Procedural Terminology Code from 2000-2020.
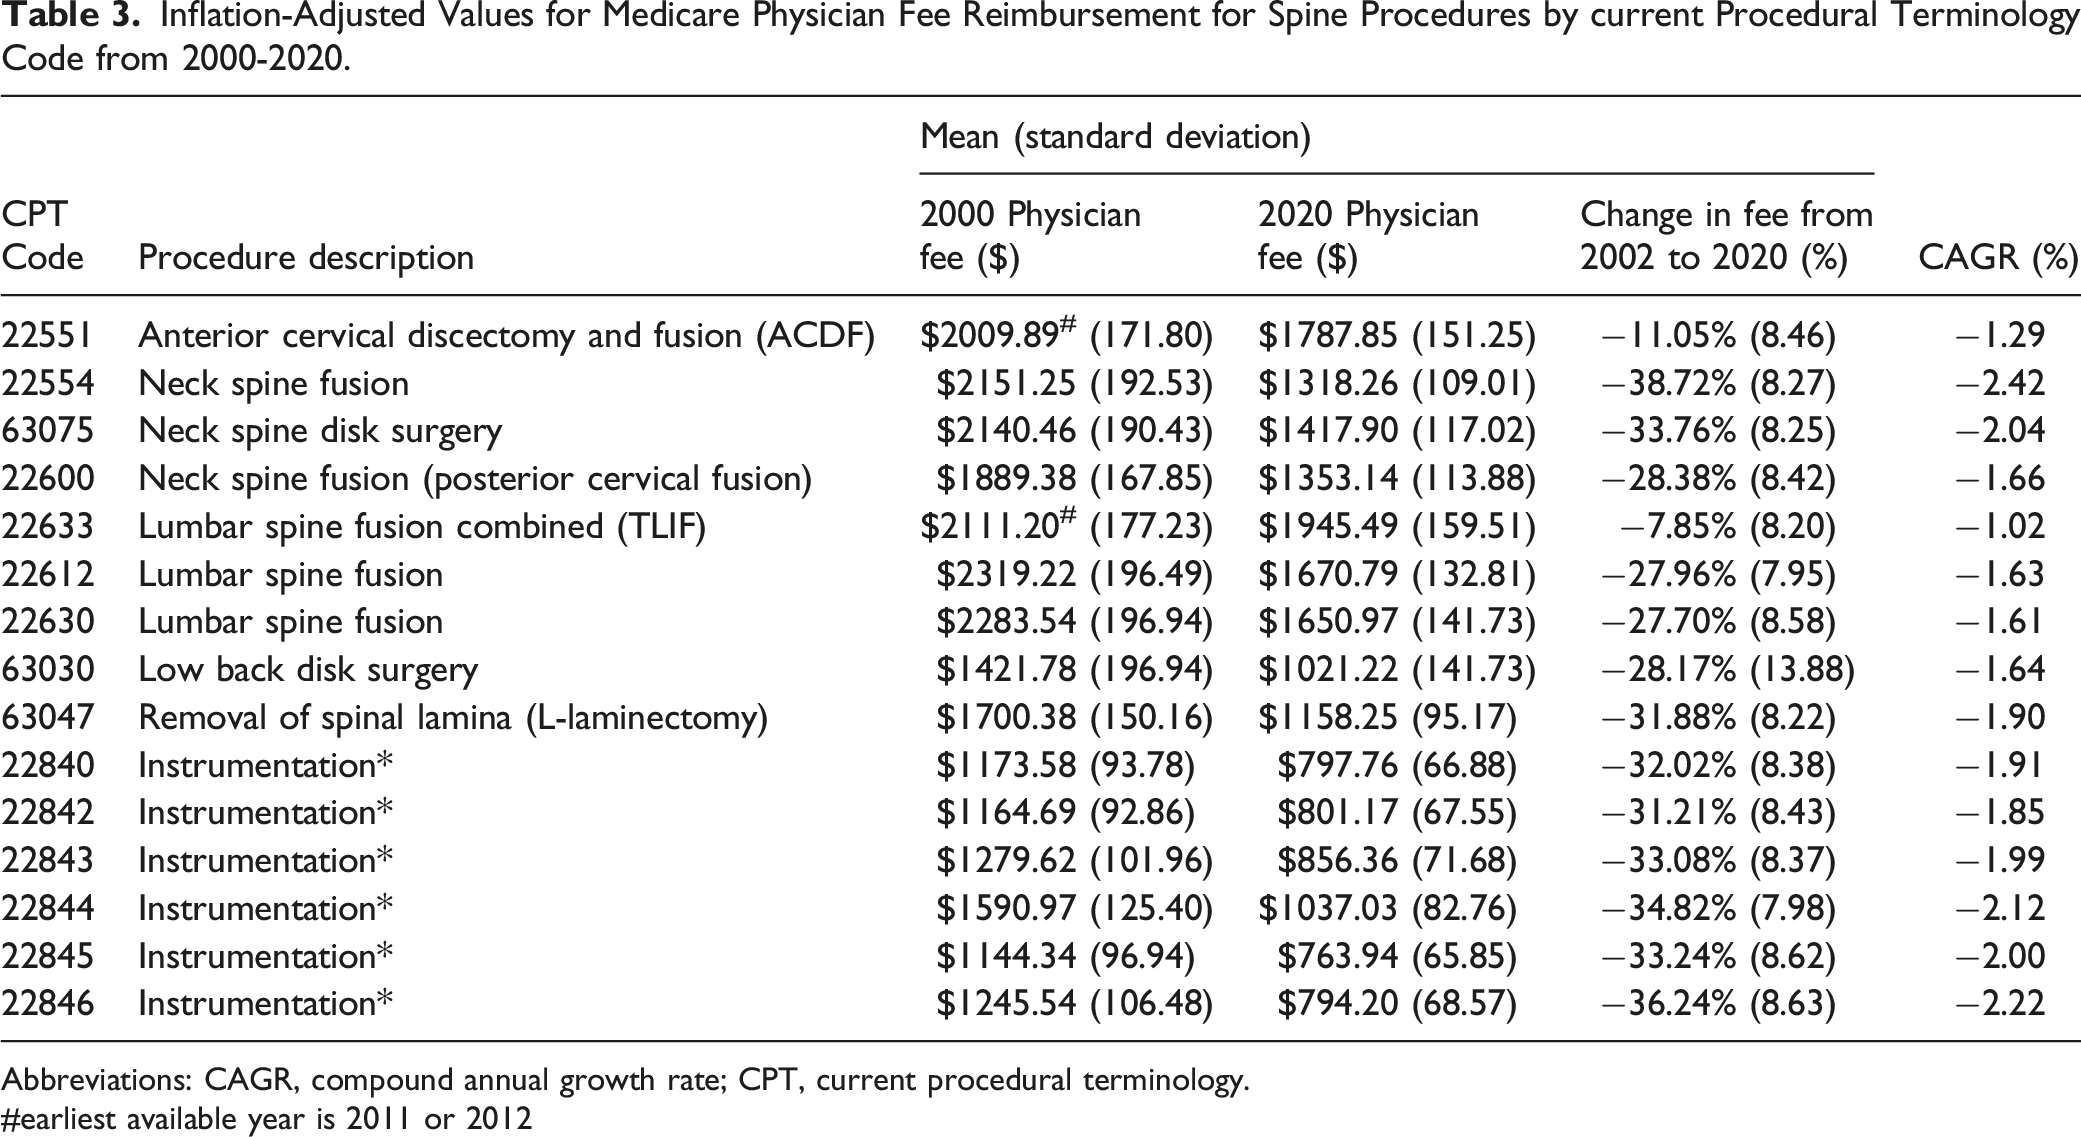
Abbreviations: CAGR, compound annual growth rate; CPT, current procedural terminology.
#earliest available year is 2011 or 2012
During the 20-year study period, the inflation adjusted reimbursements declined by $616.49 or an average of −26.16% for the selected spine procedures (Figure 1A) and declined by $424.71 or an average of −33.43% for the corresponding instrumentation codes (Figure 1B). The most noticeable decline rates were during 2001-03 and 2007-09 periods. 20-year, inflation adjusted reimbursements trends for the selected spine procedures (A) and for the corresponding instrumentation codes (B). See Table 1 for description of current procedural terminology codes.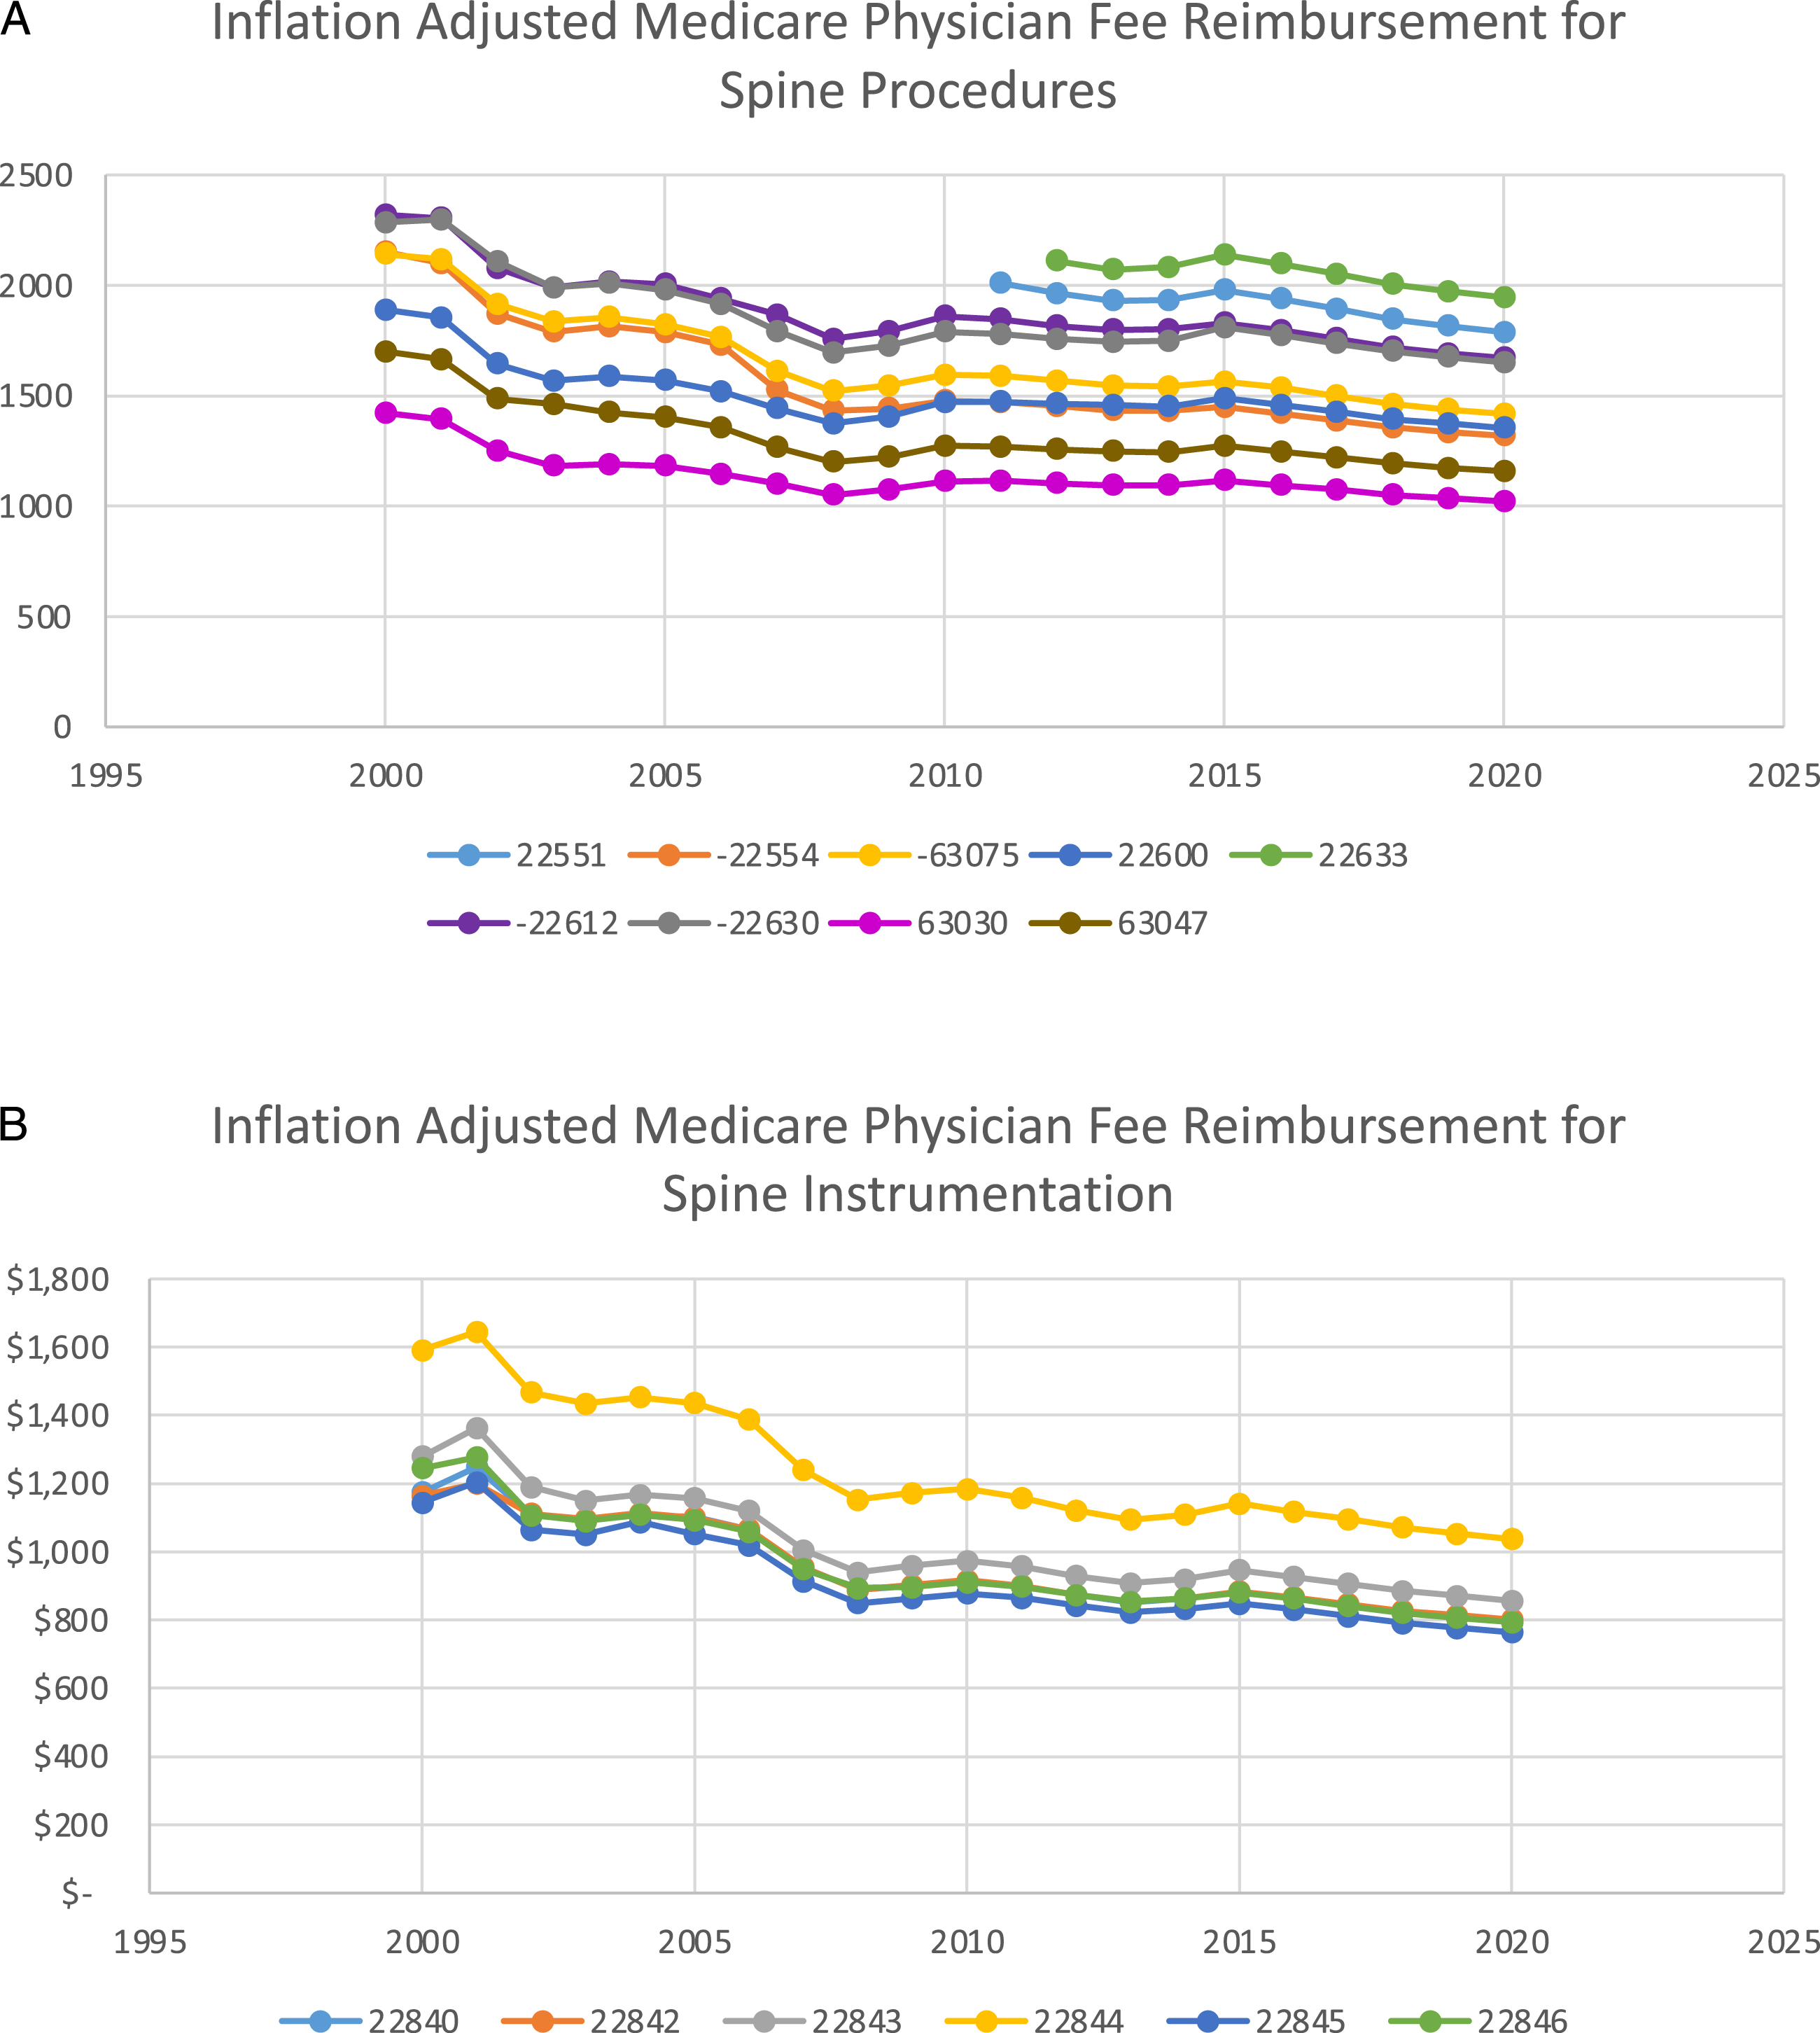
Effect of CPT code bundling - During the period selected for this study, codes 22554 and 63075 were combined into code 22551 for ACDF in 2011 and codes 22612 and 22630 were combined into code 22633 for TLIF in 2012. We found that the average decrease in reimbursements for codes 22554 and 63075 (−36.24% ± 8.26%) was significantly higher than the decline for code 22551 (−11.05% ± 8.46%) (Figure 2A). Similarly, the average decrease in reimbursements for codes 22612 and 22630 (−27.83% ± 8.27%) was significantly higher than the decline for code 22633 (−7.85% ± 8.20) (Figure 2B). CAGR changes for these 2 code bundling sets showed a similar pattern (Table 3). Effect of current procedural terminology code bundling during the period for this study. Codes 22554 and 63075 were combined into code 22551 for ACDF in 2011 (A) and codes 22612 and 22630 were combined into code 22633 for TLIF in 2012 (B). See Table 1 for description of current procedural terminology codes.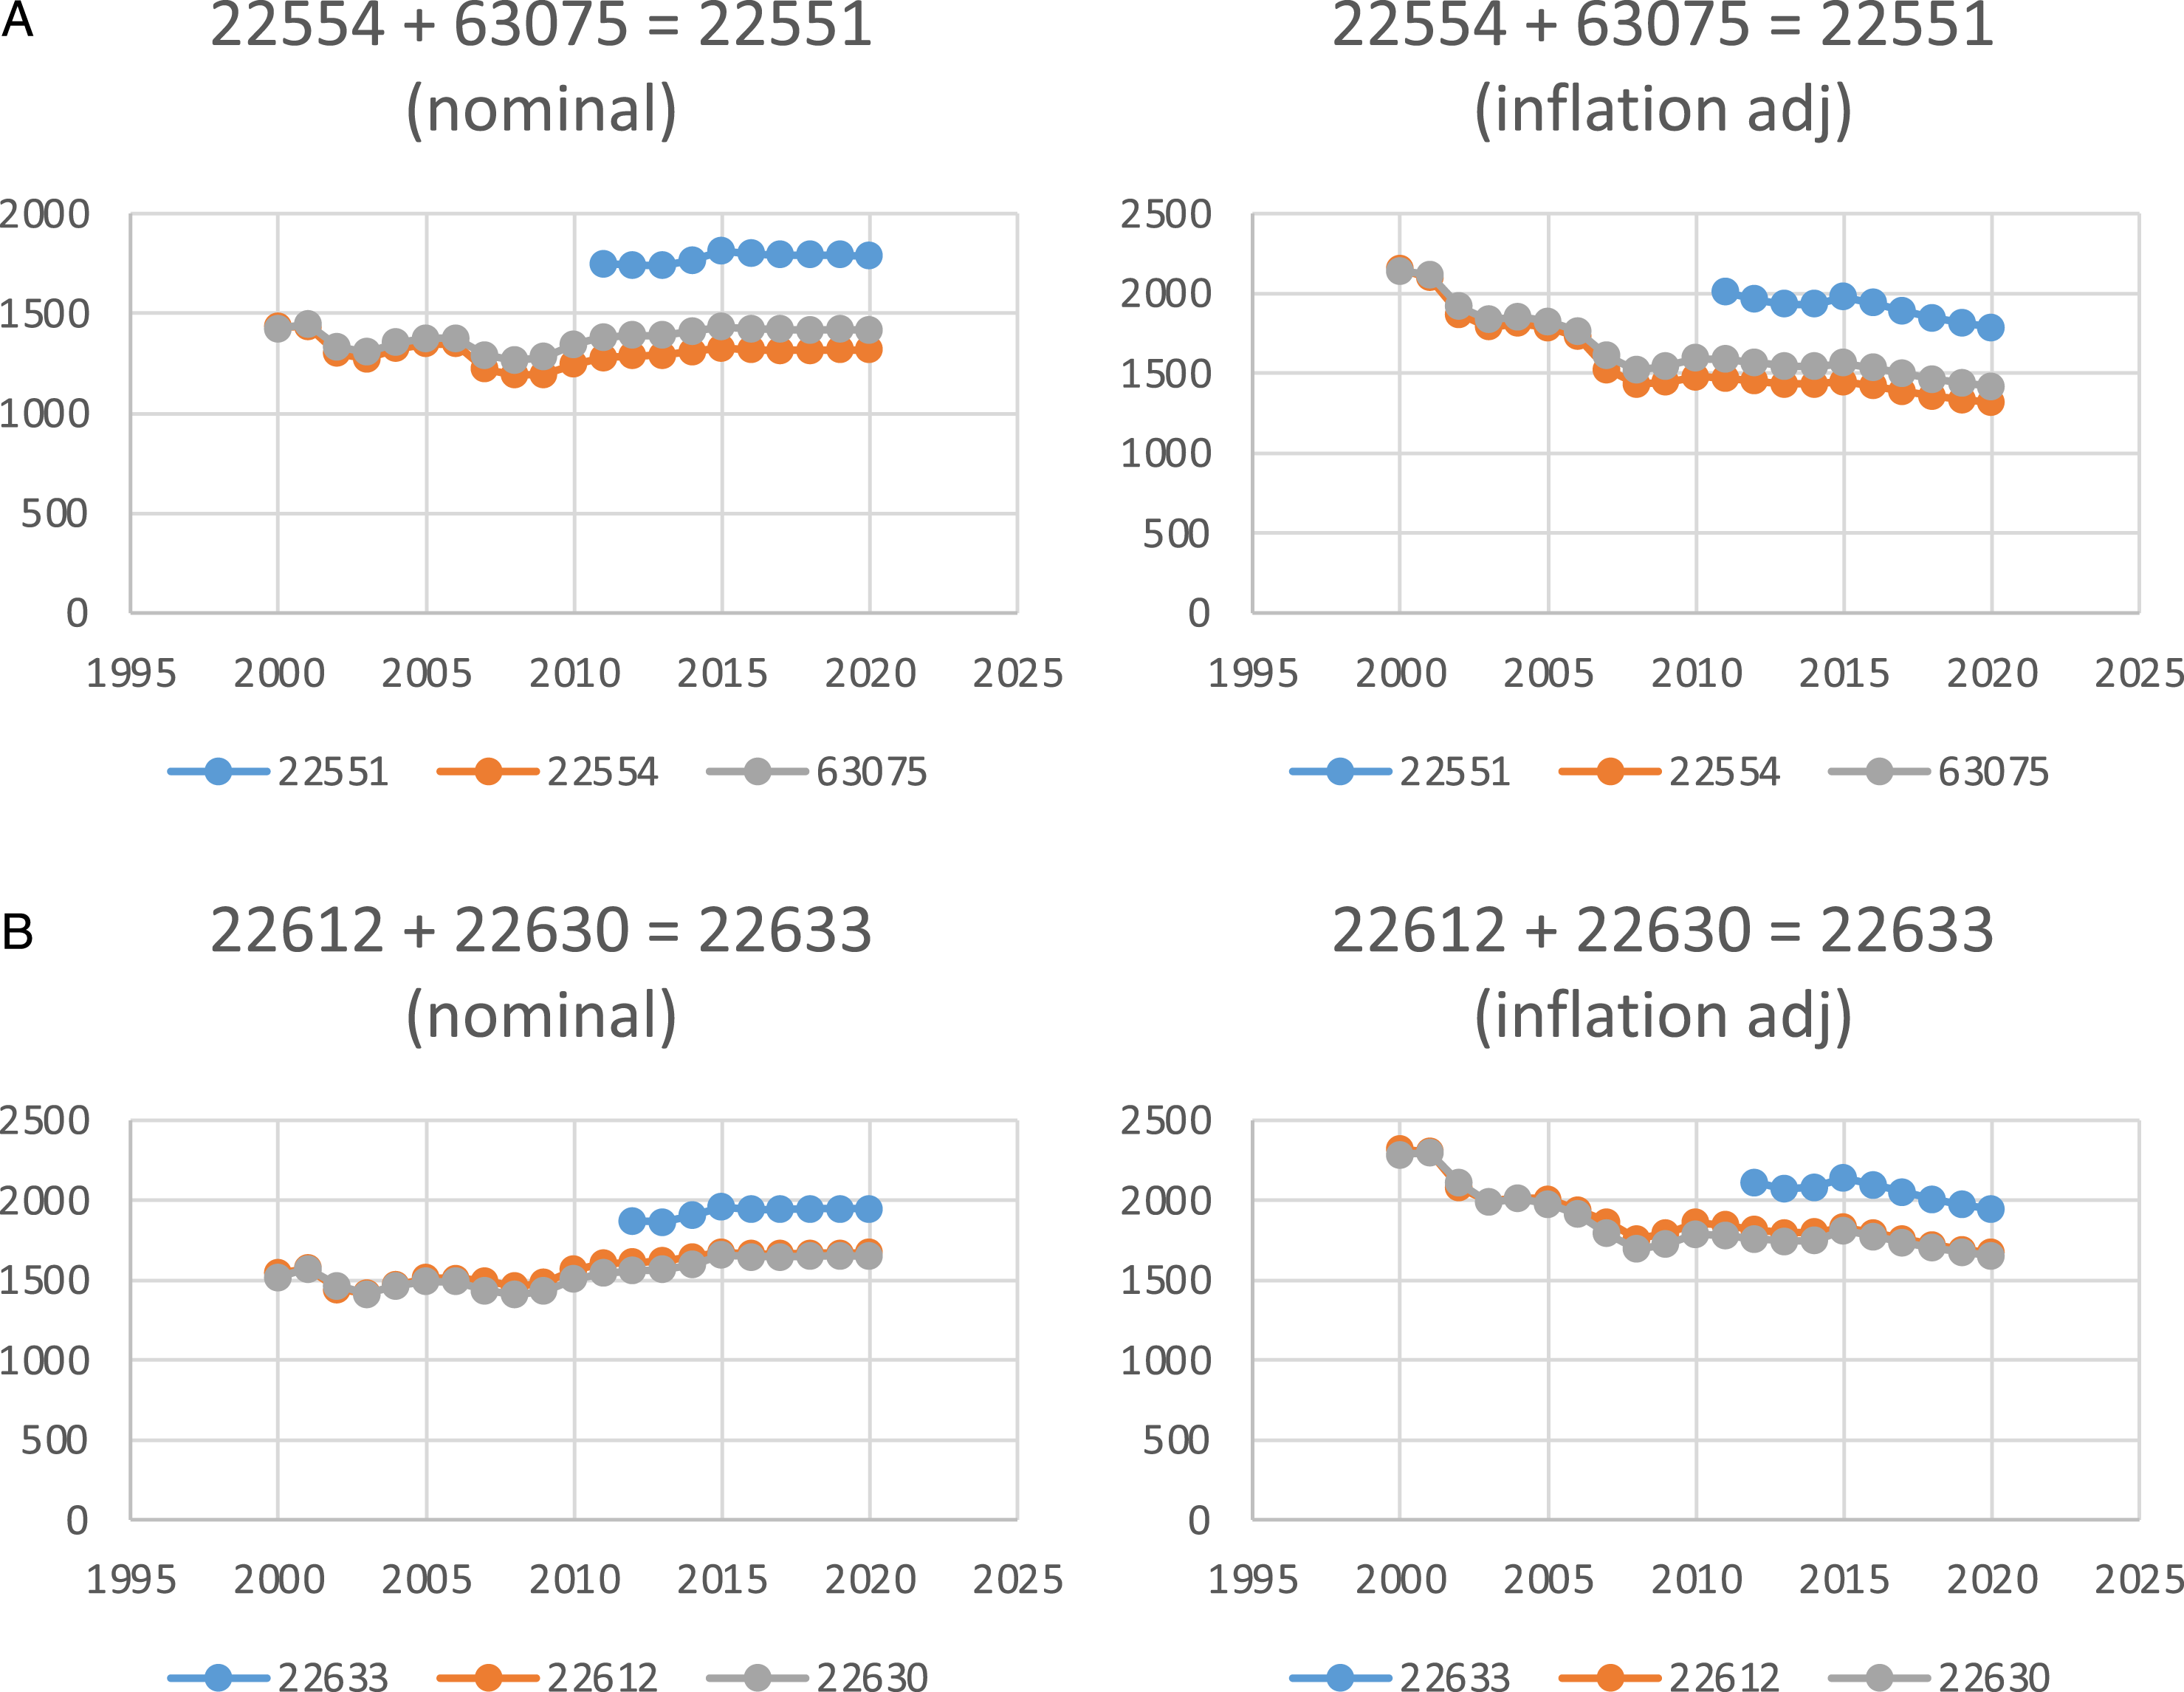
Discussion
Continued increases in US health care spending and cost-control efforts by the CMS have sparked interest in examining physician fees. However, it is unclear whether trends in reimbursements reflect the increase in complexity and resource demands of surgical care for spinal disorders. Despite the projected increase in spine procedures, 13 our analysis demonstrates a persistent decline in reimbursed physician fees for the most common spine surgeries over the past 2 decades. The most noticeable decline rates were during the 2001-03 and 2007-09 periods, likely corresponding to economic downturns due to the September 11th attacks and the Great Recession, respectively. Further, the period of 2011-14, which corresponds to the years immediately following the implementation of the Affordable Care Act, showed minimal rates of decline in Medicare reimbursements.
Utilization of Technology and Instrumentation
An exponential increase in the utilization of technology in spine surgeries has been reported and remains foreseeable. 14 Despite this, the reimbursement decline for spinal instrumentation (−33.43% on average) was greater than that of physician fees (−26.16% on average). The utilization of new technologies such as navigations or robotics has the potential to improve perioperative outcomes.20,21 For example, a comparative study of conventional, open robotic-guided and percutaneous robotic-guided pedicle screw placement showed that the use of robotic guidance increased accuracy of screw positioning and reduced the X-ray exposure but did not reduce the operating time.21,22 A comprehensive cost-benefit examination of the increasing operating room time due to utilization of new technologies is beyond the scope of this work and has been attempted by others. 23
Recent studies regarding the addition of lumbar spinal fusion to laminectomy have been inconsistent. In a randomized, controlled trial of 66 patients with lumbar spinal stenosis and stable degenerative spondylolisthesis, Ghogawala et al. 24 reported that laminectomy with fusion offered a “slightly greater but clinically meaningful improvement in overall physical health-related quality of life vs laminectomy alone.” Another randomized clinical trial of 247 patients with lumbar spinal stenosis at 1 or 2 adjacent vertebral levels by Försth et al. 25 reported that “decompression surgery plus fusion surgery did not result in better clinical outcomes at 2 years and 5 years than did decompression surgery alone.” These inconsistencies from clinical studies can also influence both surgeon attitudes and Medicare’s evaluation of the reimbursement requests for spinal instrumentation.
CPT Code Bundling
We found that CPT code bundling could mask the inflation-adjusted longitudinal trends. Two CPT code bundling effects in this study showed pre-bundling decline rates of approximately −30%, while post-bundling decline rates were around −8%. This “masking effect” of CPT code bundling can hide the overall trends of lack of fair physician reimbursement over time.
Study Limitations
A limitation of our study is the absence of similar datasets from private insurers or other third-party payers. However, it has been well-documented that these non-Medicare providers align their reimbursement schedules with Medicare. 26 An appropriate extension of our analysis, while beyond the scope of this work, will be to incorporate the conversion factors for Relative Value Units (RVUs) of each CPT code into the longitudinal analysis. The conversion factor is determined each year by Congress and is 1 of the determinants of physician reimbursement for performed surgeries. Additionally, geographical factors can impact reimbursement trends. However, analysis of geography-dependent confounders such as socioeconomic status, education, level of access to different hospital systems is beyond the scope of our study.
Conclusion
These declining Medicare reimbursement trends, if continued, can serve as a non-negligible disincentive for spine surgeons and could limit access to or increase the wait time for spine-related surgical care to a vulnerable patient population, the elderly. Alternatively, declining trends of reimbursements may indirectly favor an increase in the number of corresponding procedures. Predictive examination of the effects of declining reimbursement trends on the future performance of surgeons and their institutions is a complex, multi-factorial concept and beyond the scope of this work. We wish to emphasize that the inflation-adjusted analyses of reimbursement trends can reveal opportunities for improving access to spine care at a population level.
Supplemental Material
Supplemental Material for - 20-year Inflation-Adjusted Medicare Reimbursements (Years: 2000-2020) For Common Lumbar and Cervical Degenerative Disc Disease Procedures
Supplemental Material for 20-year Inflation-Adjusted Medicare Reimbursements (Years: 2000-2020) For Common Lumbar and Cervical Degenerative Disc Disease Procedures by Pedram Honarpisheh, Samantha L. Parker, Christopher R. Conner, Sami Anjum, Jessica R. Stark, John C. Quinn, and John M. Caridi in Global Spine Journal
Footnotes
Declaration of Conflicting Interests
The author(s) declared no potential conflicts of interest with respect to the research, authorship, and/or publication of this article.
Funding
The author(s) received no financial support for the research, authorship, and/or publication of this article.
Supplemental Material
Supplemental material for this article is available online.
References
Supplementary Material
Please find the following supplemental material available below.
For Open Access articles published under a Creative Commons License, all supplemental material carries the same license as the article it is associated with.
For non-Open Access articles published, all supplemental material carries a non-exclusive license, and permission requests for re-use of supplemental material or any part of supplemental material shall be sent directly to the copyright owner as specified in the copyright notice associated with the article.