
Abstract
Study Design:
Cross-sectional study.
Objective:
To provide the age- and pelvic incidence-related variations of sagittal alignment in asymptomatic Chinese population.
Methods:
This study recruited asymptomatic adult subjects. All subjects undertook the standing whole spinal radiograph and the sagittal parameters were measured: sagittal vertical axis (SVA), T1 pelvic angle (TPA), lumbar lordosis (LL), thoracic kyphosis (TK), pelvic incidence (PI) and pelvic tilt (PT). All subjects were divided into young, middle aged and elderly groups, then each age group was further divided into 5 subgroups (very low, low, average, high and very high) based on PI values. The relations between PI, age and other parameters were evaluated. The differences in sagittal parameters of each PI subgroup were compared.
Results:
546 subjects were included with an average age of 38.6 years (18 to 81). The number of subjects over 70 years and with very low PI was relatively small. The average of PI, TPA, PT and LL were 45.9° ± 8.4°, 6.4° ± 6.2°, 11.9° ± 6.6° and 49.2° ± 10.1°, respectively. SVA, TPA, TK and PT increased with age (P < 0.05), while SVA, TPA, PT, PI-LL also increased with PI (P < 0.05). LL, PT, TPA, PI-LL and LL-TK were different among the 5 PI subgroups (P < 0.05). However, the values of LL in elderly subjects with high and very high PI were similar.
Conclusion:
The age- and PI-related variations in sagittal alignment of Chinese population were provided. The sagittal parameters were significantly influenced by age and PI. The individual pelvic morphology should be carefully considered during the assessment and restoration of sagittal balance.
Introduction
Sagittal spinopelvic alignment, referring to the normal alignment in the sagittal profile of spine and pelvis, has drawn more attention with the in-depth research on spinal function and pathology. 1 It has been demonstrated that the sagittal alignment highly correlates to the health-related quality of life (HRQOL) in patients with spinal deformity2-4 and other spinal degenerative diseases.5,6 Thus, assessing and restoring sagittal alignment are of critical importance on the treatment of these patients, 7 which should be modeled by a typical normal spine.
Recent studies have reported the normal range of sagittal spinopelvic parameters, including pelvic incidence (PI), lumbar lordosis (LL), pelvic tilt (PT), sagittal vertical axis (SVA) and so on, in the healthy population as a guidance for correction surgery.8,9 Although these studies provide a good overview for the ideal sagittal profile in people with different age and race,10,11 how the individual pelvic morphology may influence the optimal sagittal parameters hasn’t been well documented. Little is known about the characteristic of population with different pelvic incidence (PI), while the average normal sagittal alignment may be mismatched for patients with extreme PI values. 12
The patients with a higher PI can have higher PT and T1 pelvic angle (TPA), but these does not represent sagittal imbalance. In the same way, the patients with PT, LL and TPA in the normal range can also be malalignment. To better understand the sagittal alignment especially for the patients with extreme PI values, it is necessary to characterize the normal range of sagittal parameters in healthy people with stratified PI values.
Therefore, the present study is aimed to explore the PI-stratified normal sagittal alignment of Chinese asymptomatic population with different age groups, and we hypothesize that these results can attribute to the improvement of current correction strategy.
Materials and Methods
Study Design
This cross-sectional study was approved by the relevant institutional Ethics Committee and proceed. The IRB approval number is IRB00006761-2 012 066. All the subjects were fully informed about the purposes, methods and risks of the study and then provided their informed consents before the enrollment.
Subject Recruitment
Before participating in this study, every subject underwent a physical examination and detailed history taking. Based on the following inclusion and exclusion criteria, 546 healthy subjects were recruited in the present study.
Inclusion criteria Age ≥ 18 years. No coronal deformity (Cobb angle < 10°) or sagittal imbalance (SVA < 5 cm). Without complaints of neck or back pain in previous 6 months (Neck Disability Index, NDI < 10 and Oswestry Disability Index, ODI <10). Without history of prior spinal disease and surgery. Without neuromuscular disorders.
Exclusion criteria Pregnancy. With hip or knee arthroplasty. With other realignment surgery of the lower extremities.
Radiographic Measurements
All the subjects undertook the whole-spine anteroposterior and lateral standing radiograph including their hip joints. Then the following sagittal parameters were measured in the PACS system (Picture Archiving and Communication System, USA).
Whole spinal parameters: sagittal vertical axis (SVA) and T1 pelvic angle (TPA: the angle formed by the line from the center of T1 to the femoral head axis and the line from the center of sacral endplate to the femoral head axis 13 ).
regional parameters: lumbar lordosis (LL), lordosis of L4-S1 (L4-S1, the angle formed by the upper endplate of L4 and sacral endplate) and thoracic kyphosis (TK: the angle formed by the upper endplate of T4 and the lower endplate of T12).
pelvic parameters: pelvic incidence (PI), pelvic tilt (PT) and sacral slope (SS).
Statistical Analysis
All the data was collected in the Microsoft Excel 2016, and SPSS version 19.0 (SPSS, USA) was used to perform the analysis. The variables were described as mean and standard deviation. The Pearson and Spearman correlation coefficient was used to analyze the relations between the variations. The differences in subjects with various PI groups were compared by performing One-way ANOVA, and P < 0.05 was set as the statistical significance.
Results
Demographics
This study included 546 healthy subjects (239 males and 307 females), with an average age of 38.6 years (from 18 to 81). The subjects were divided into 3 groups according to their age including young group (age < 40 years), middle aged group (40 years ≤ age < 60 years) and elderly group (age ≥ 60 years). The average height, weight and body mass index were 1.67 meters (m), 63.2 kilograms (kg) and 22.6 kg/m2, respectively.
Young group contained 141 males and 167 females with an average age of 23.1 years (from 18 to 39). Middle aged group contained 47 males and 80 females with an average age of 52.8 years (from 41 to 59). Elderly group contained 51 males and 60 females with an average age of 65.0 years (from 60 to 81).
General Sagittal Profile
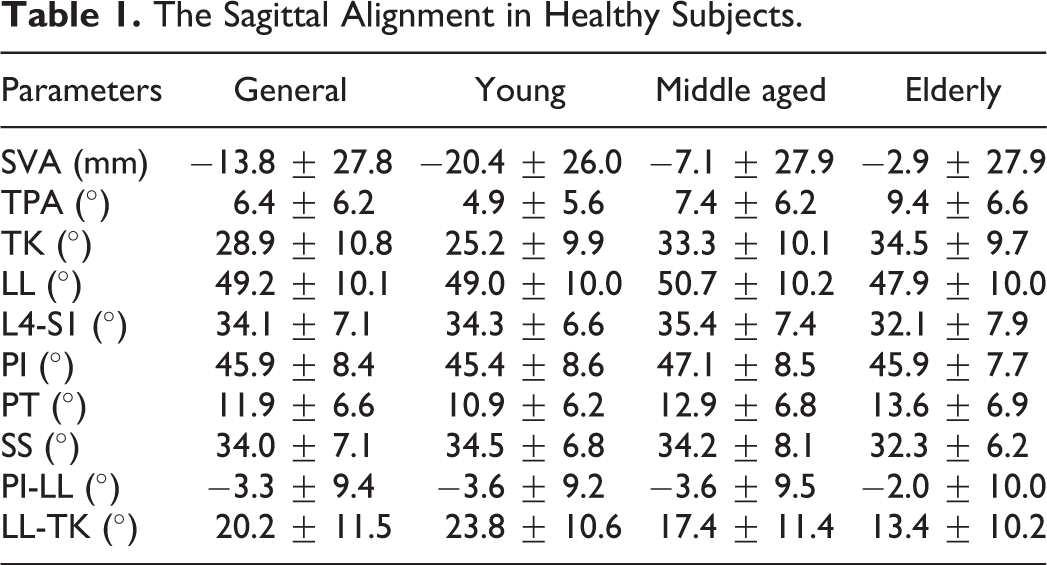
The average values for the whole included subjects group and different age groups were recorded in Table 1. The average PI was 45.9 ± 8.4. When exploring the change in parameters with age, we found that SVA, TPA, TK and PT increased with age while LL-TK decreased with age. PI and LL did not correlate to age (P > 0.05). Meanwhile, as shown in Table 2, PI positively correlated with SVA, TPA, LL, L4-S1, PT, SS, PI-LL and LL-TK.
The Sagittal Alignment in Healthy Subjects.
The Correlation Between PI, Age and Other Parameters.
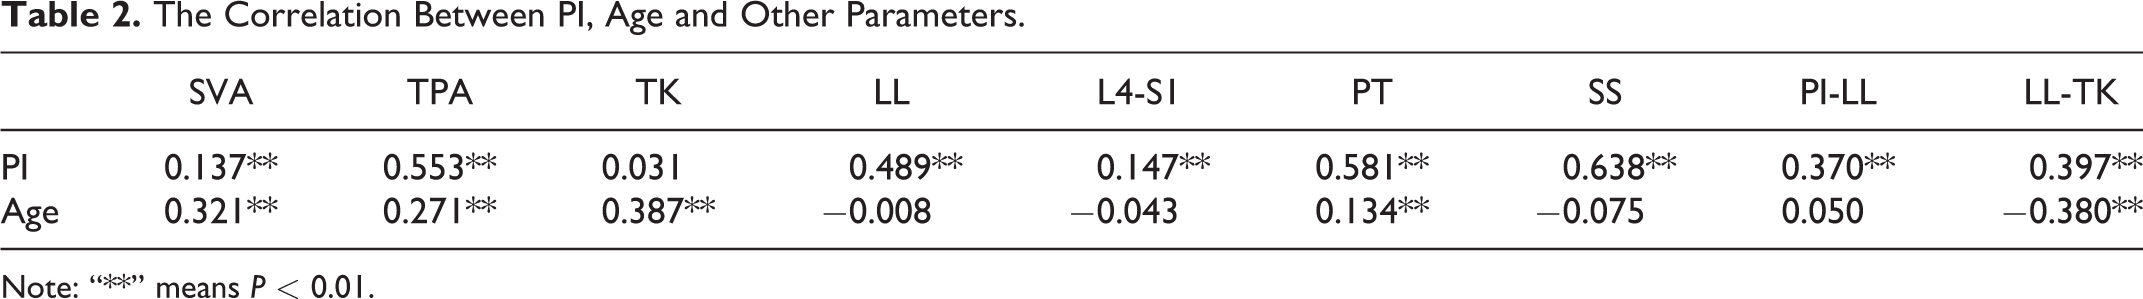
Note: “**” means P < 0.01.
PI-Stratified Normal Sagittal Alignment
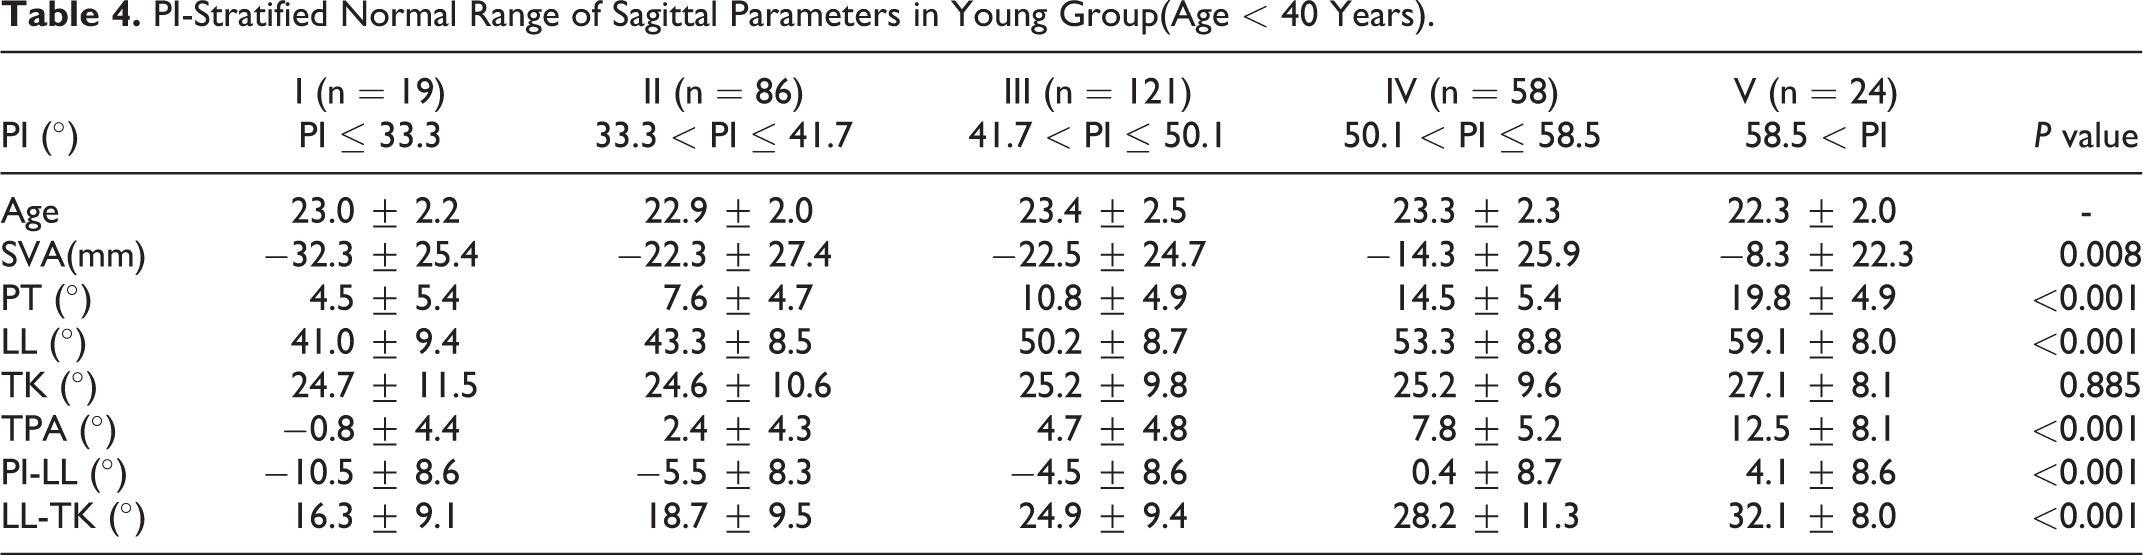
Then each age group was further divided into 5 subgroups based on the PI including I (very low PI: PI ≤ Mean PI—1.5σ, PI ≤ 33.3°), II (low PI: Mean PI—1.5σ < PI ≤ Mean PI—0.5σ, 33.3° < PI ≤ 41.7°), III (average PI: Mean PI—0.5σ < PI ≤ Mean PI + 0.5σ,41.7° < PI ≤ 50.1°), IV (high PI: Mean PI + 0.5σ < PI ≤ Mean PI + 1.5σ, 50.1° < PI ≤ 58.5°) and V (very high PI: Mean PI + 1.5σ < PI, 58.5° < PI).
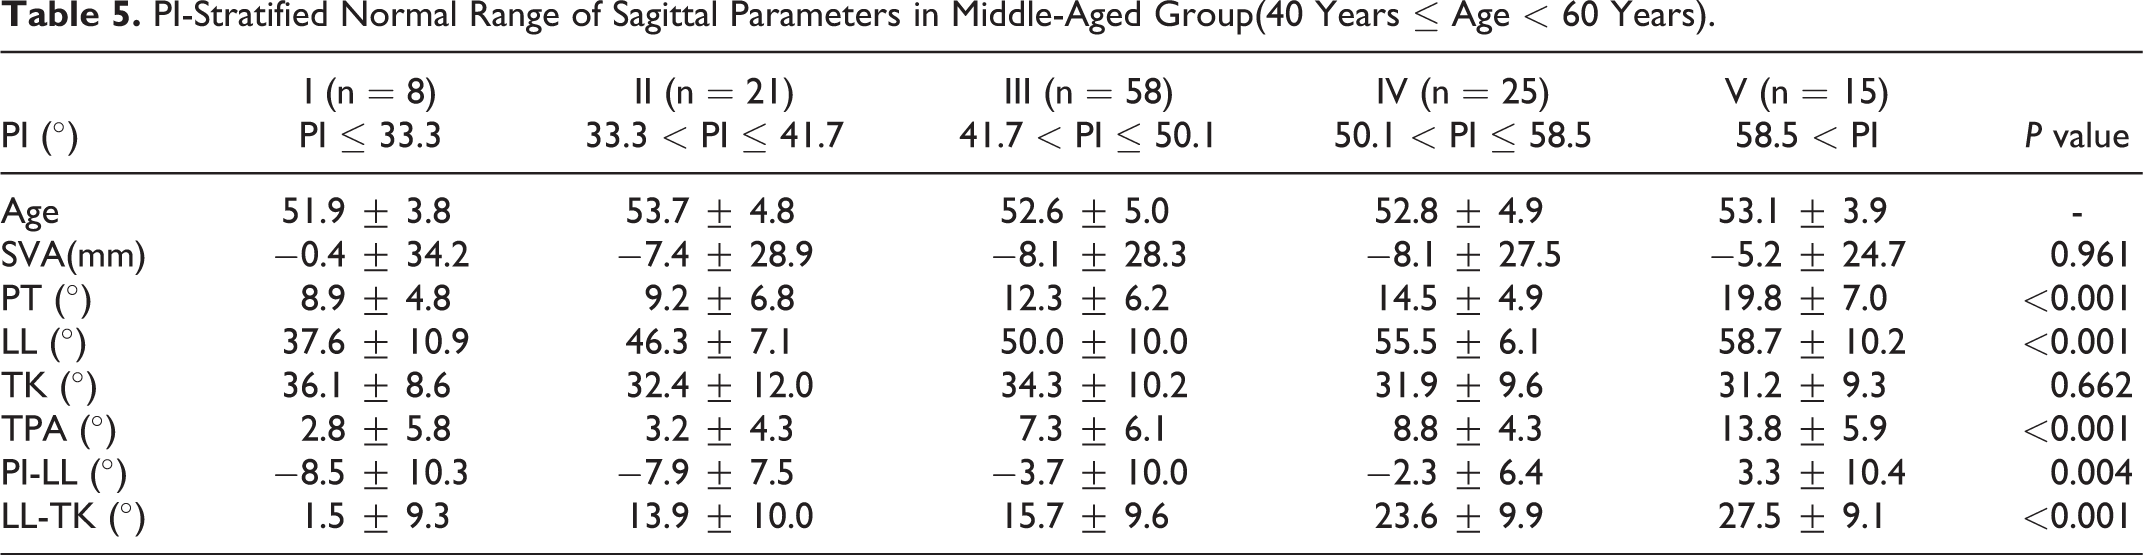
In all 3 age groups, LL, PT, TPA, PI-LL and LL-TK were significantly different among the 5 PI subgroups, which meant the normal values of these parameters increased with the increase of PI values. For subjects with very high PI (V subgroup), the average values of PT reached 19.8° in young group and 24.0° in elderly group, while the values of PT were only around 7.6° in young group and 9.3° in elderly group for subjects with low PI (II subgroup). Meanwhile, the average values of TPA were 12.5°, 13.8° and 18.6° for young, middle-aged and elderly subjects with very high PI. The normal values of PI-LL ranged from −10.5° to 4.1° in young group, from −8.5° to 3.3° in middle-aged group and from −14.2° to 9.6° in elderly group with different PI values.
As shown in Table 3, although the normal values of LL increased with PI in most subgroups, the elderly subjects with high PI and very high PI presented the similar LL (52.9° vs 51.4°).
PI-Stratified Normal Range of Sagittal Parameters in Elderly Group(Age ≥ 60 Years).
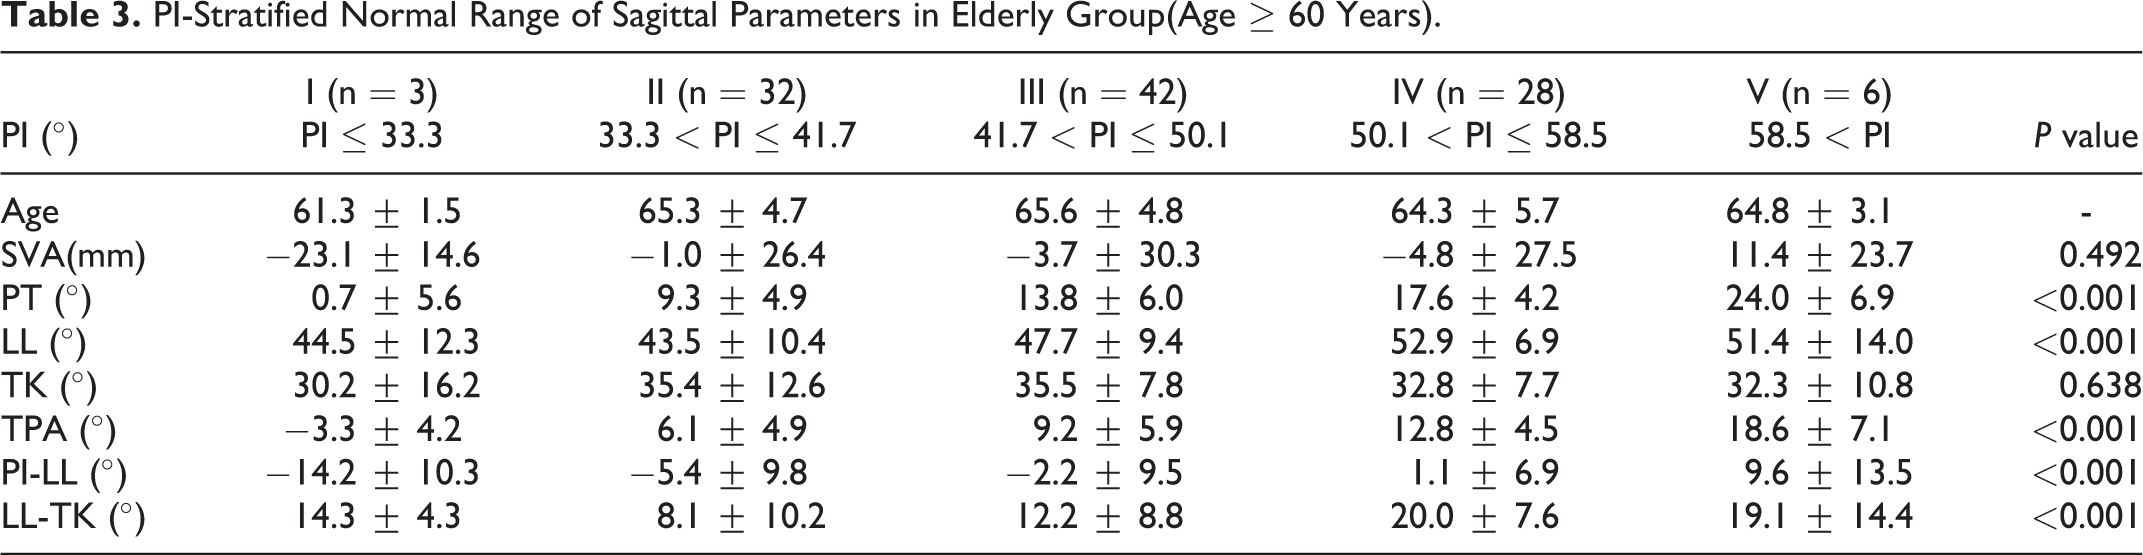
TK were not different among different PI subgroups for all age groups (P > 0.05). In young group, SVA was different among PI-stratified subgroups (P < 0.01), but this difference was not significant in middle aged and elderly groups (P > 0.05).
Discussion
The incidence of spinal deformity has risen with the growth of elderly population, which has potential impact on the quality of life and requires more medical attention.14,15 For the symptomatic cases whose conservative treatment has failed, surgical correction to restore the sagittal alignment is required, which has been reported to improve patient’s HRQOL. 16 The recent correction goal is based on the normative radiographic spinopelvic values, referring to a typical normal spine.17,18 However, a typical normal spine cannot represent the variations in clinical application, and an overview of normative sagittal alignment in healthy population may be useful but not that applicable when given an individual patient with spinal deformity.
Due to primary deformity and corresponding compensatory mechanism, the spinal sagittal parameters in patients usually have been different from the initial status19,20 except for PI, which remains a constant after skeletal maturation. 21 PI, as an anatomic parameter of pelvis, highly correlated with the spinal sagittal curves, 22 so it can provide the primary information of the pathological spine for surgeons. Based on this conception, Schwab et al proposed that LL should be reconstructed in relation to PI, and they recommended PI-LL < 10°, PT < 25° and SVA < 5 cm as the correction goals. 23 However, recent studies found that applying a definite value of parameter to evaluate the sagittal alignment for patients with the whole spectrum of PI values might be misleading. 24 For patients with extreme PI, applying the fixed average values of TPA, PT and PI-LL to judge their balance is unsuitable since the normal values of these parameters are significantly influenced by PI. Therefore, it is necessary to characterize the PI-stratified normal values of sagittal parameters in the healthy population, which contributes to the better understanding of sagittal balance.
In the present study, we evaluate the relation between age and sagittal parameters, then we find that SVA, TPA, TK PT increased with age, but PI remains constant among different age groups, which is in good agreement with previous studies.10,21 Meanwhile, the correlations between PI and other parameters are also explored and the results show that LL, TPA, PT and PI-LL all positively correlate with PI, which remind us the importance of evaluating these parameters in relation to PI. Therefore, to provide the PI-stratified sagittal alignment in a healthy population, the subjects are divided into 5 subgroups based on their values of PI. As we can see from Tables 3, 4 and 5, the normal values of LL, PT, TPA and PI-LL vary widely with the increase of PI values in all 3 age groups. According to our results, previous concept that setting an absolute numeric value to judge the sagittal balance may be wrong especially for patients with PI around the lower-normal and upper-normal limits.
PI-Stratified Normal Range of Sagittal Parameters in Young Group(Age < 40 Years).
PI-Stratified Normal Range of Sagittal Parameters in Middle-Aged Group(40 Years ≤ Age < 60 Years).
For instance, Protopsaltis et al 13 proposed to restore sagittal balance with a target TPA < 14° for ASD patients. However, our study shows that the average TPA is 18.6° for elderly subjects with very high PI (>58.5°), so for these patients, keeping TPA < 14° may be overcorrected. Lafage et al 25 reported that for patients aging from 65 to 74 years, the suitable values of PT, PI-LL and TPA were 25.2°, 7.5° and 22.8°, but as shown in Table 3, the average values were 9.3° for PT, −5.4° for PI-LL and 6.1° for TPA in elderly population with low PI. For these patients, neglecting the individual pelvic morphology may lead to insufficient correction. Therefore, individual pelvic morphology accompanied with age should be both considered when assessing sagittal balance and making surgical plan.
Some researchers also noticed this limitation in recent evaluation system of sagittal balance, and they proposed that low PI patients required LL in excess of PI (LL = PI+10°) while large PI patients fitted a LL smaller than PI (LL = PI-10°). 26 In addition, further studies came up with the linear regression formulas to estimate the ideal lumbar lordosis to be restored based on PI.12,27 However, it should be noticed that the predictive effects of these formulas are not that good, and it may neglect some important information. As we could see from the Table 3, subjects with high and very high PI in elderly group presented a similar LL (52.9° vs 51.4°). Although LL should increase with PI as shown in young and middle aged groups, for elderly subjects, their degenerative muscle system couldn’t support such lordotic lumbar curve. Thus, for elderly patients with high or very high PI, restoring the LL around 50° could be already enough, and this information would be ignored by linear regression formula. As reported by Cho et al, 28 patients with high PI were more easily to develop sagittal decompensation after surgery. According to our study, unsuitable sagittal correction neglecting the characteristic of these high PI patients might be responsible for the postoperative sagittal decompensation.
There are still some limitations in the present study. First, the number of elderly subjects with very low PI is small, so applying the sagittal alignment of this subgroup should be careful. Meanwhile, due to the strict inclusion and exclusion criteria, only 16 subjects older than 70 were included in the study and this should also be noticed. Despite these limitations, this is the first cross-sectional study describing the age- and PI-related variations in sagittal alignment for a large sample of healthy Chinese population, which can provide a simple and clear tool when assessing sagittal balance and making surgical plan.
Conclusion
This study has presented the PI-stratified normal range of sagittal alignment parameters in a large sample of asymptomatic Chinese population, and the data can serve as a good reference for spine surgeons to make an accurate and personalized corrective plan.
Footnotes
Declaration of Conflicting Interests
The author(s) declared no potential conflicts of interest with respect to the research, authorship, and/or publication of this article.
Funding
The author(s) disclosed receipt of the following financial support for the research, authorship, and/or publication of this article: This study was funded by National Natural Science Foundation of China (Grant No.81 871 807).