
Abstract
Study Design:
Cross-sectional study.
Objective:
To compare handgrip strength (HGS), paraspinal muscles’ (PSM) volume, and their effects on clinical symptom severity between the patients with sagittal imbalance (SI) and symptomatic lumbar spinal stenosis (LSS).
Methods:
A total of 54 paired consecutive patients with SI and LSS were enrolled after propensity score matching. Preoperative HGS, cross-sectional area (CSA) of psoas (PS) and multifidus (MF) muscles, and patient-reported measures, including visual analog scale (VAS) for back/ leg pain, Oswestry Disability Index (ODI), and EuroQOL (EQ-5D) were compared between both groups. Within each SI and LSS group, patient-reported measures were compared between high and low HGS subgroups. The correlation of HGS and CSA of PSMs to patient-reported measures was evaluated.
Results:
There was no difference in HGS between 2 groups, however, the CSA of PS and MF muscles in SI group was significantly lower than those in LSS group. Patients with low HGS showed inferior results for ODI and EQ-5D, compared to those with high HGS subgroup in both SI and LSS groups. HGS and CSA of MF muscle were correlated with ODI in both groups.
Conclusions:
There was no significant difference between the SI and LSS groups in HGS, however, PSMs’ volume in SI group were significantly lower than those in LSS group. Therefore SI would be associated with loss of localized muscle mass in back area, rather than global skeletal muscle weakness. HGS and PSMs’ volume were adversely associated with functional status in SI and LSS patients.
Introduction
With the aging process, disc degeneration, facet arthrosis, and weakness of back muscles would result in various pathologies of lumbar spine, including herniated lumbar disc, spondylolisthesis, lumbar spinal stenosis (LSS) and spinal deformity. As one of them, Sagittal plane deformity in terms of spinal sagittal imbalance (SI) is one of complex spinal disorders causing a high level of disability and significant back pain with muscle fatigue.1,2 Among the various contributing factors, reduced muscle mass and strength would be potentially associated with sagittal spinal deformity.3,4 Given that this patho-mechanism, not only weakness of back muscles, but also generalized muscle weakness might also be associated with the development and symptoms severity in SI patents.
However, the relationship between back muscles and/or generalized muscle weakness and clinical manifestation of SI patients is still unknown. We hypothesized that patients with severe SI would be associated with generalized muscle weakness and/or loss of back muscle, which could be compared to those in LSS patients. LSS is a common condition contributing severe pain and decreased quality of life in the elderly population.5,6 Previous studies have demonstrated that the structural changes of back muscles and/or generalized muscle weakness would influence the clinical outcomes adversely in patients with LSS.7-11 As a measure of voluntary muscle function, hand grip strength (HGS), which is simple, cost-effective, easy to determine, has often been used as an indicator of global muscle strength. While as representative back muscles, the paraspinal muscles are considered the most important in motion and stabilization of the lumbar spine.12,13
The purpose of this study was firstly to compare the HGS and PSMs’ volume between patients with severe SI and symptomatic LSS. The second purpose was to investigate the influence of HGS and PSMs’ volume on clinical symptoms and functional status in patients with SI and LSS.
Materials and Methods
Study Design and Patients
This is a cross-sectional matched cohort study, which was approved by the institutional review board (IRB) of Seoul National University Bundang Hospital (IRB approval number: B–1809/490–105). All data was obtained from medical records, magnetic resonance (MR) images, and radiographs.
A total of 373 consecutive patients who were scheduled to undergo spine surgery for severe SI and LSS between October 2016 and May 2018 were included in the study. The inclusion criteria for the SI group were as follows: (1) age of 60-80 years and (2) patients with positive sagittal imbalance and planned corrective surgery, defined as sagittal vertical axis (SVA) > 5 cm or pelvic tilt (PT) > 20° or pelvic incidence (PI)—lumbar lordosis (LL) > 20 on lateral radiographs in standing position. The inclusion criteria for the LSS group included the following: (1) age of 60-80 years and (2) patients planned to undergo surgery for LSS defined by a stenotic lesion on MR images of lumbar spine, corresponding neurogenic claudication, and one or more corresponding symptoms, such as pain, numbness, neurological deficits in the legs and buttocks, and/or bladder/bowel dysfunction.14,15 The exclusion criteria for both groups were as follows: (1)
According to the criteria, 54 and 261patients with SI and LSS, respectively, were enrolled in the study. To match with the SI cohort, 54 patients were selected from the LSS cohort after propensity score matching for age, gender, body mass index (BMI) and comorbidities including diabetes mellitus (DM), hypertension, mental disorder, cancer, kidney disease and heart disease (Figure 1).
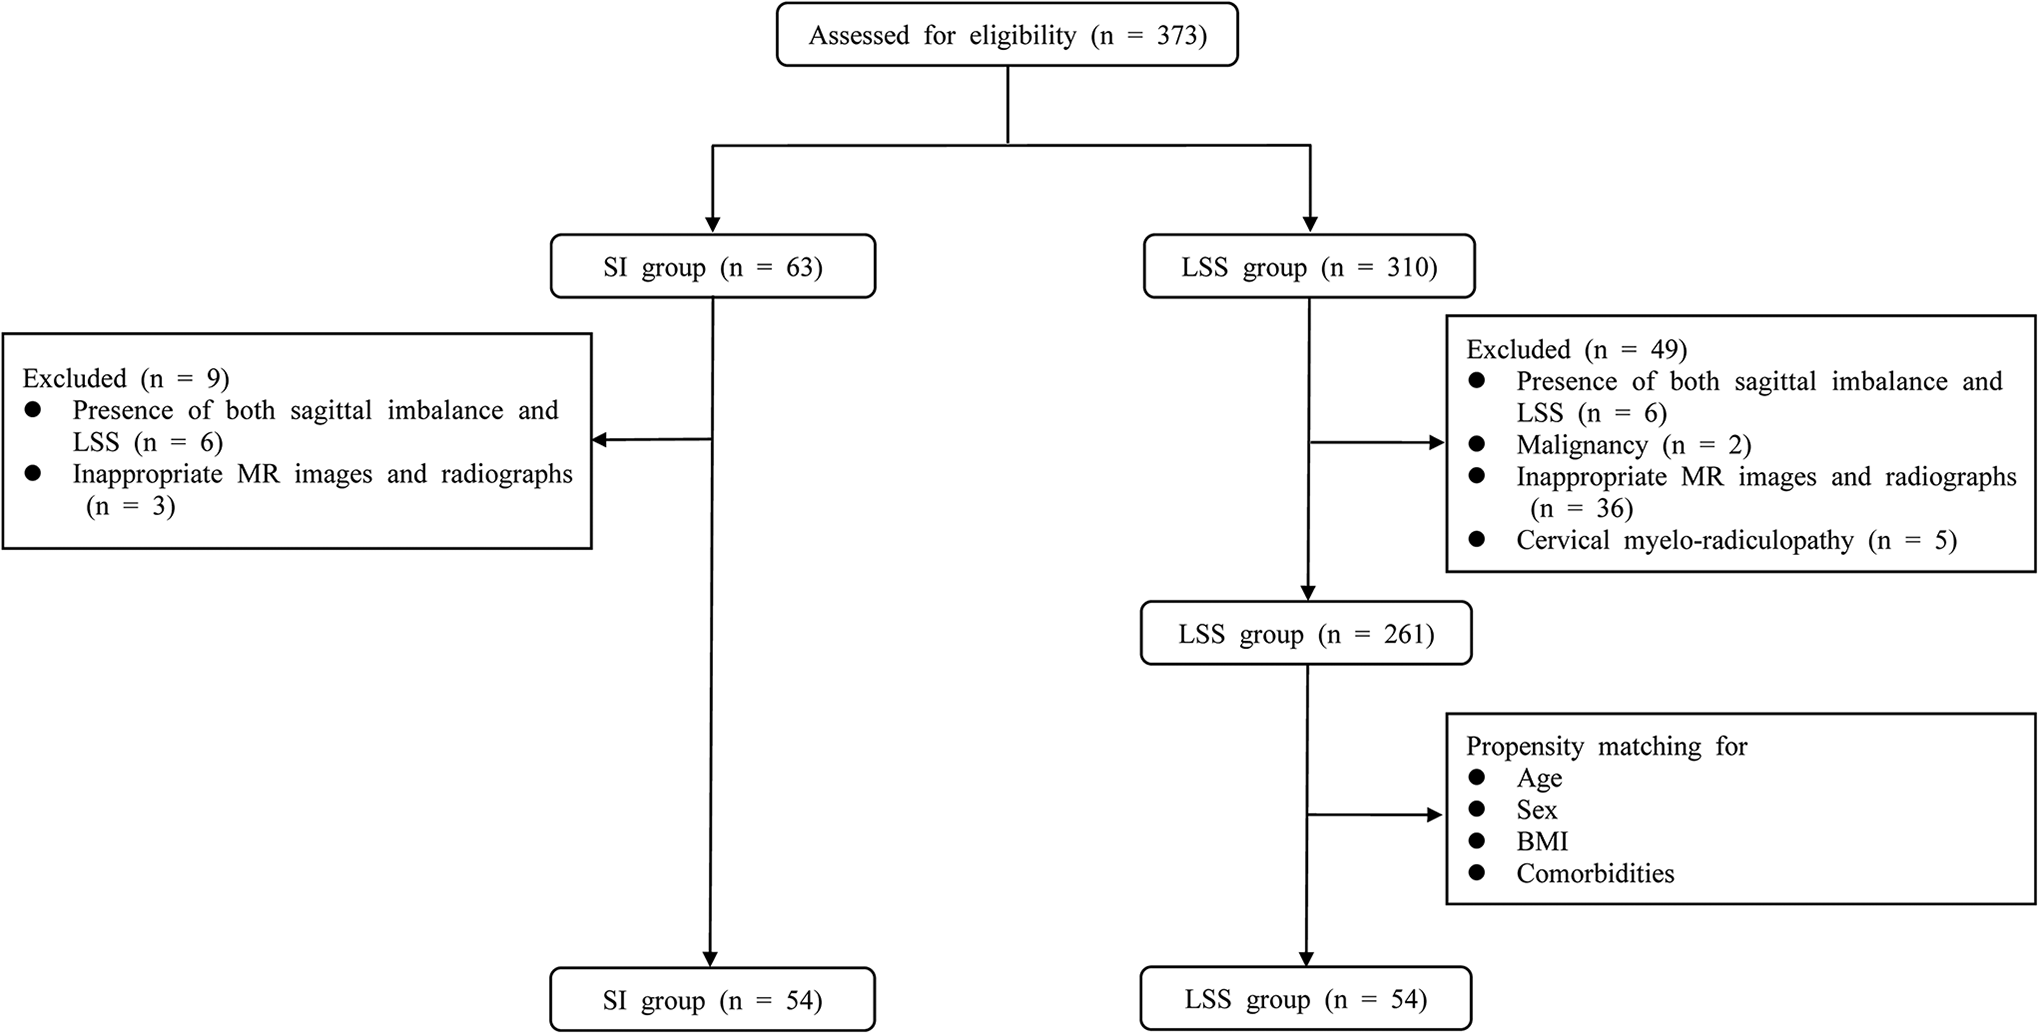
Flow diagram of enrollment, randomization and follow-up of the study participants.
Measurement of HGS
HGS, which is a routine preoperative examination in our department, was measured on both hands using a hand dynamometer (GRIP-D5101, Takei, Niigata, Japan). The patients were asked to hold the dynamometer between the fingers and palm at the base of the thumb with the elbow extended to the side, and squeeze it with maximum strength. After a brief rest, the measurement was repeated twice on both right and left hands. 16 The best performance of these efforts was recorded by kilograms and used for analysis. Within each SI and LSS group, the patients were divided into 2 subgroups, high HGS (≥ 26 kg for men and ≥ 18 kg for women) and low HGS (<26 kg for men and <18 kg for women), based on the cut-off values suggested by the Asian Working Group for Sarcopenia. 17
Measurement of PSMs’ Cross-Sectional Area
Preoperative lumbar spine MRI exams were performed for all patients using a 1.5 T MR scanner (Gyroscan Intera Achieva, Philips Healthcare) with a Synergy Spine Coil (Philips Healthcare) at our hospital. Quantitative measurement of PSM, including the psoas (PS) and multifidus (MF) muscle, was obtained from T2-weighted axial images using PACS software (Infinitt, Bracknell, Berkshire, UK).
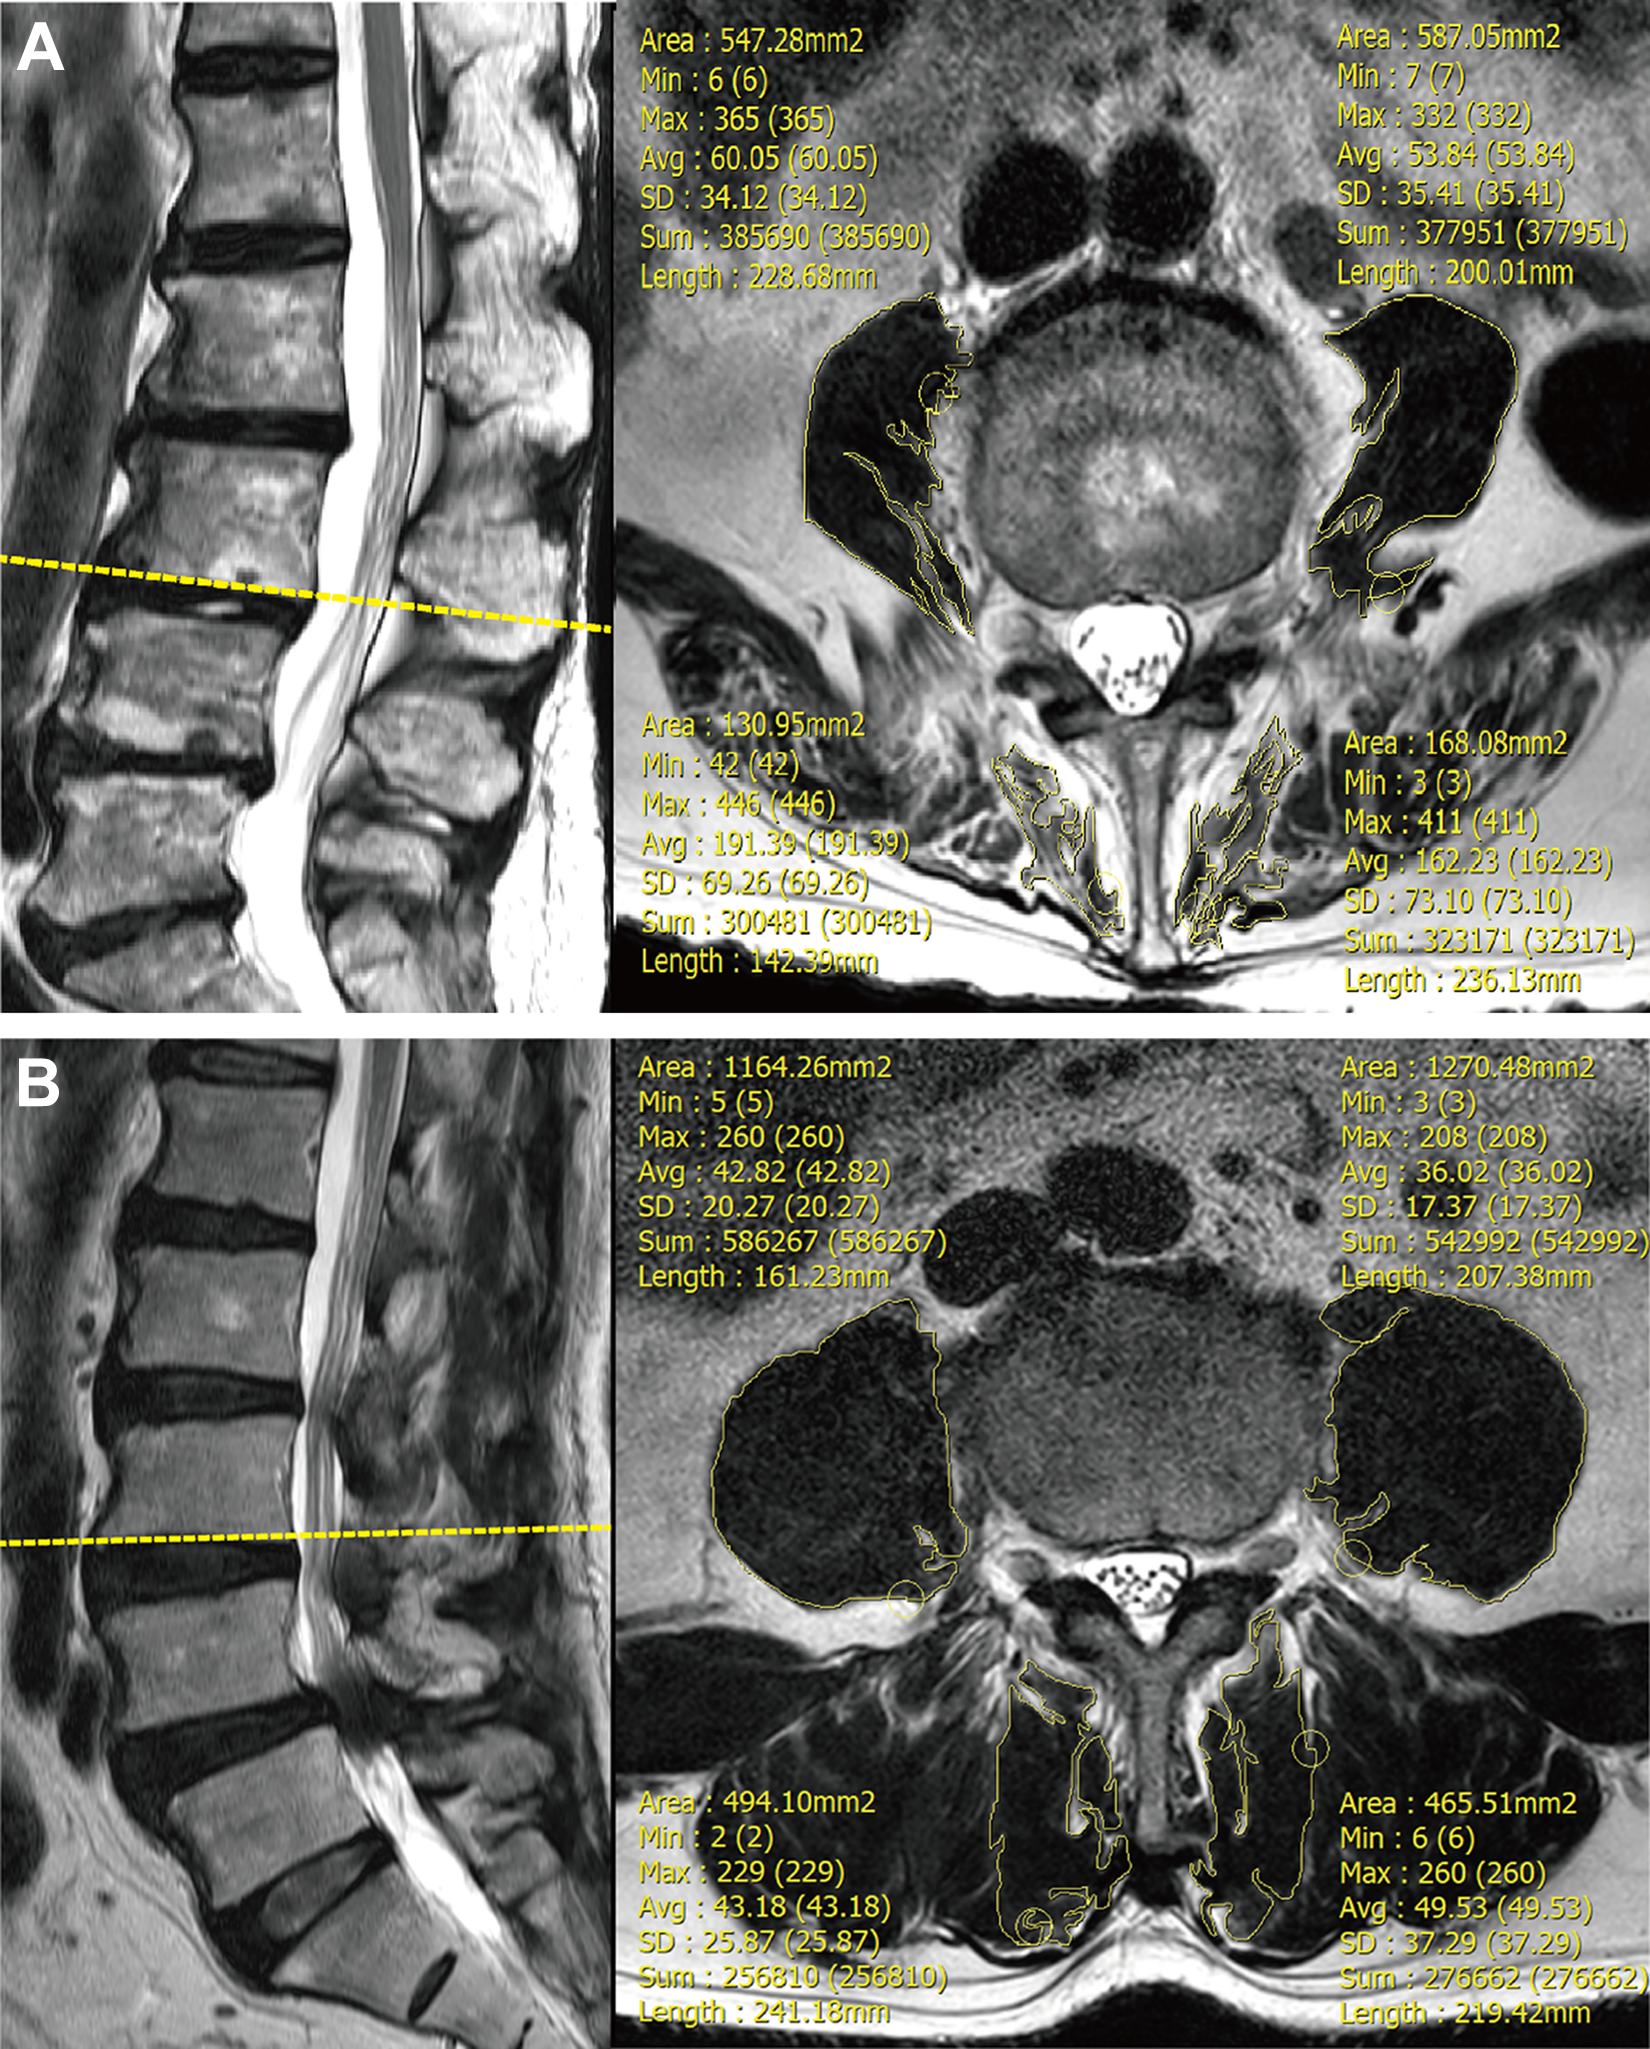
A, Measurement of cross-sectional area (CSA) of bilateral psoas (PS) and multifidus (MF) muscles using T2-weighted MR image in one of the sagittal imbalance (SI) patients. B, Measurement of cross-sectional area (CSA) of bilateral psoas (PS) and multifidus (MF) muscles using T2-weighted axial MR image in one of the lumbar spinal stenosis (LSS) patients.
Patient-Reported Measures
Patient-reported measures
Statistical Analysis
All statistical analyses were performed using the Statistical Package for the Social Sciences (SPSS, version 20.0, SPSS, Inc, Chicago, IL, USA). P-value < .05 was considered statistically significant. Continuous variables are presented as mean ± standard deviation (SD). To perform propensity score matching, logistic regression analysis was conducted to estimate the propensity scores of the patients in both groups. The demographic data, spinopelvic parameters, preoperative VAS for back and leg pain, ODI scores, EQ-5D scores and prevalence of sarcopenia were compared between the 2 groups using independent t-tests. In addition, the HGS and CSA of PSM, as primary outcomes, were compared between the 2 groups using independent t-tests.
Results
Demographic Data Analysis
Demographic data analysis showed no significant differences between the 54 paired patients in 2 groups after propensity score matching (Table 1). Spinopelvic parameters, including SS, PT, SVA, LL, PI-LL, were significantly different between the 2 groups, except for PI (Table 1). Among patient-reported measures, mean VAS score for back pain was significant higher in the SI group (
Descriptive Statistics of Patients After Propensity Score Matching.
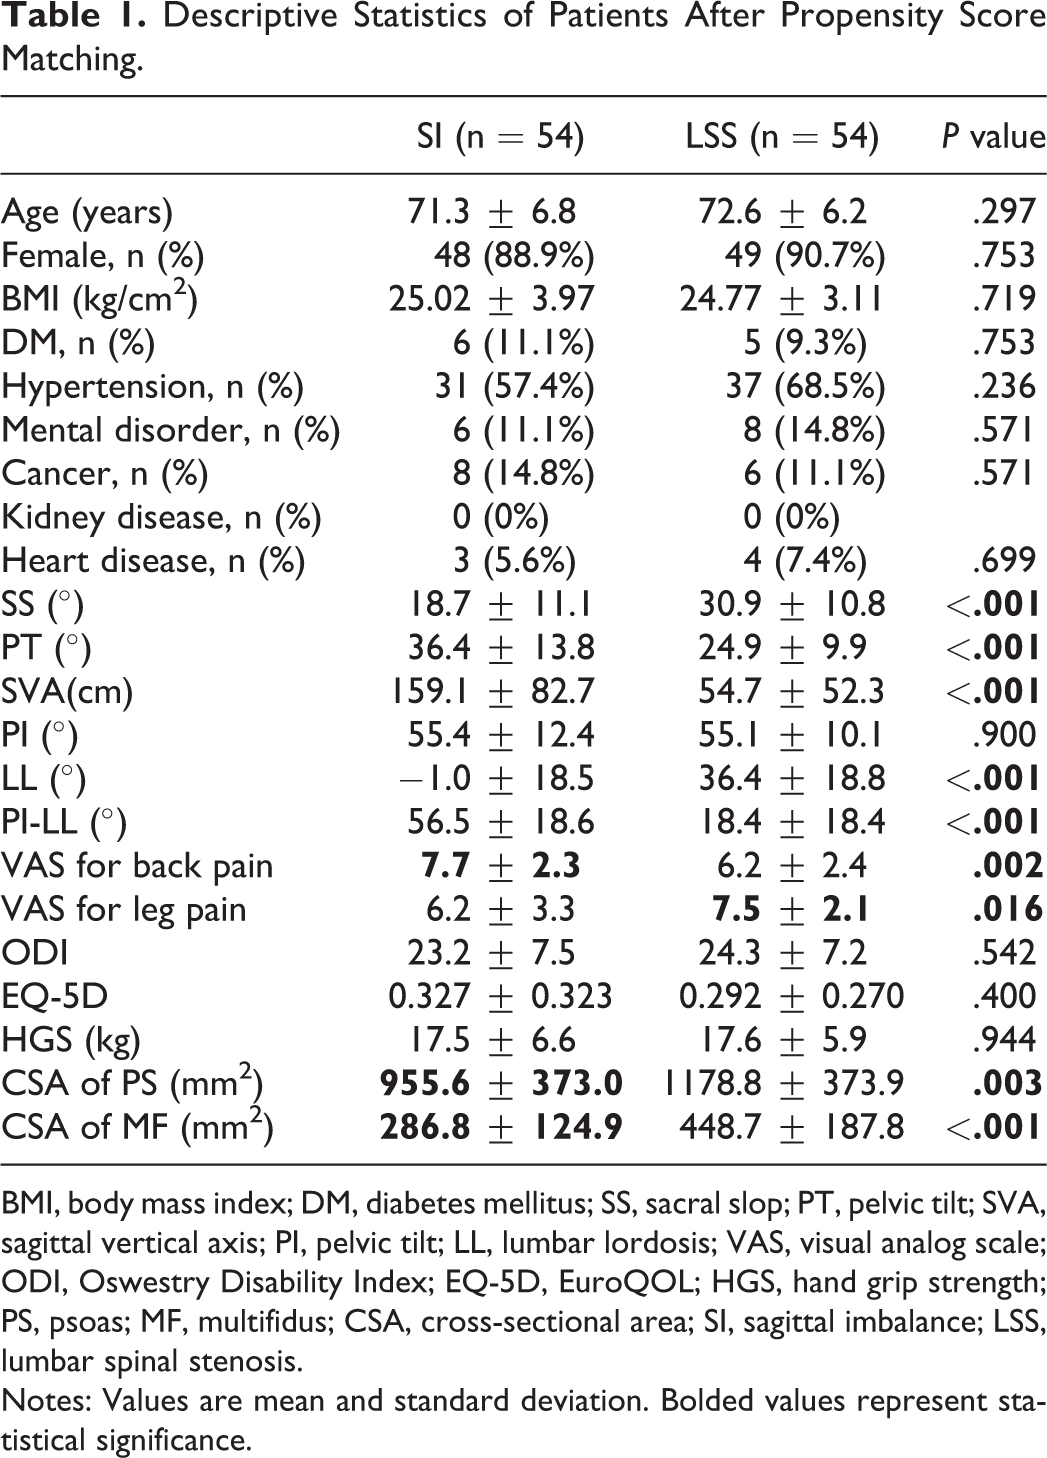
BMI, body mass index; DM, diabetes mellitus; SS, sacral slop; PT, pelvic tilt; SVA, sagittal vertical axis; PI, pelvic tilt; LL, lumbar lordosis; VAS, visual analog scale; ODI, Oswestry Disability Index; EQ-5D, EuroQOL; HGS, hand grip strength; PS, psoas; MF, multifidus; CSA, cross-sectional area; SI, sagittal imbalance; LSS, lumbar spinal stenosis.
Notes: Values are mean and standard deviation. Bolded values represent statistical significance.
Influence of HGS on Patient-Reported Measures, Spinopelvic Parameters and PSMs’ Volume in Both Groups
Within SI and LSS groups, 30 and 31 patients were placed in high HGS group, respectively, while, 24 and 23 patients were divided into low HGS group, respectively (Table 2). Patient-reported measures and CSA of PSM were assessed in both subgroups. There was no significant difference in VAS score for back and leg pain between high and low HGS subgroups in both SI and LSS groups (Table 2). However, patients in low HGS subgroup showed significant higher ODI and lower EQ-5D scores, respectively, compared to those in high HGS subgroup in both SI and LSS groups (Table 2).
Influence of HGS on Clinical Outcomes and PSMs’ Volume in Each Group.
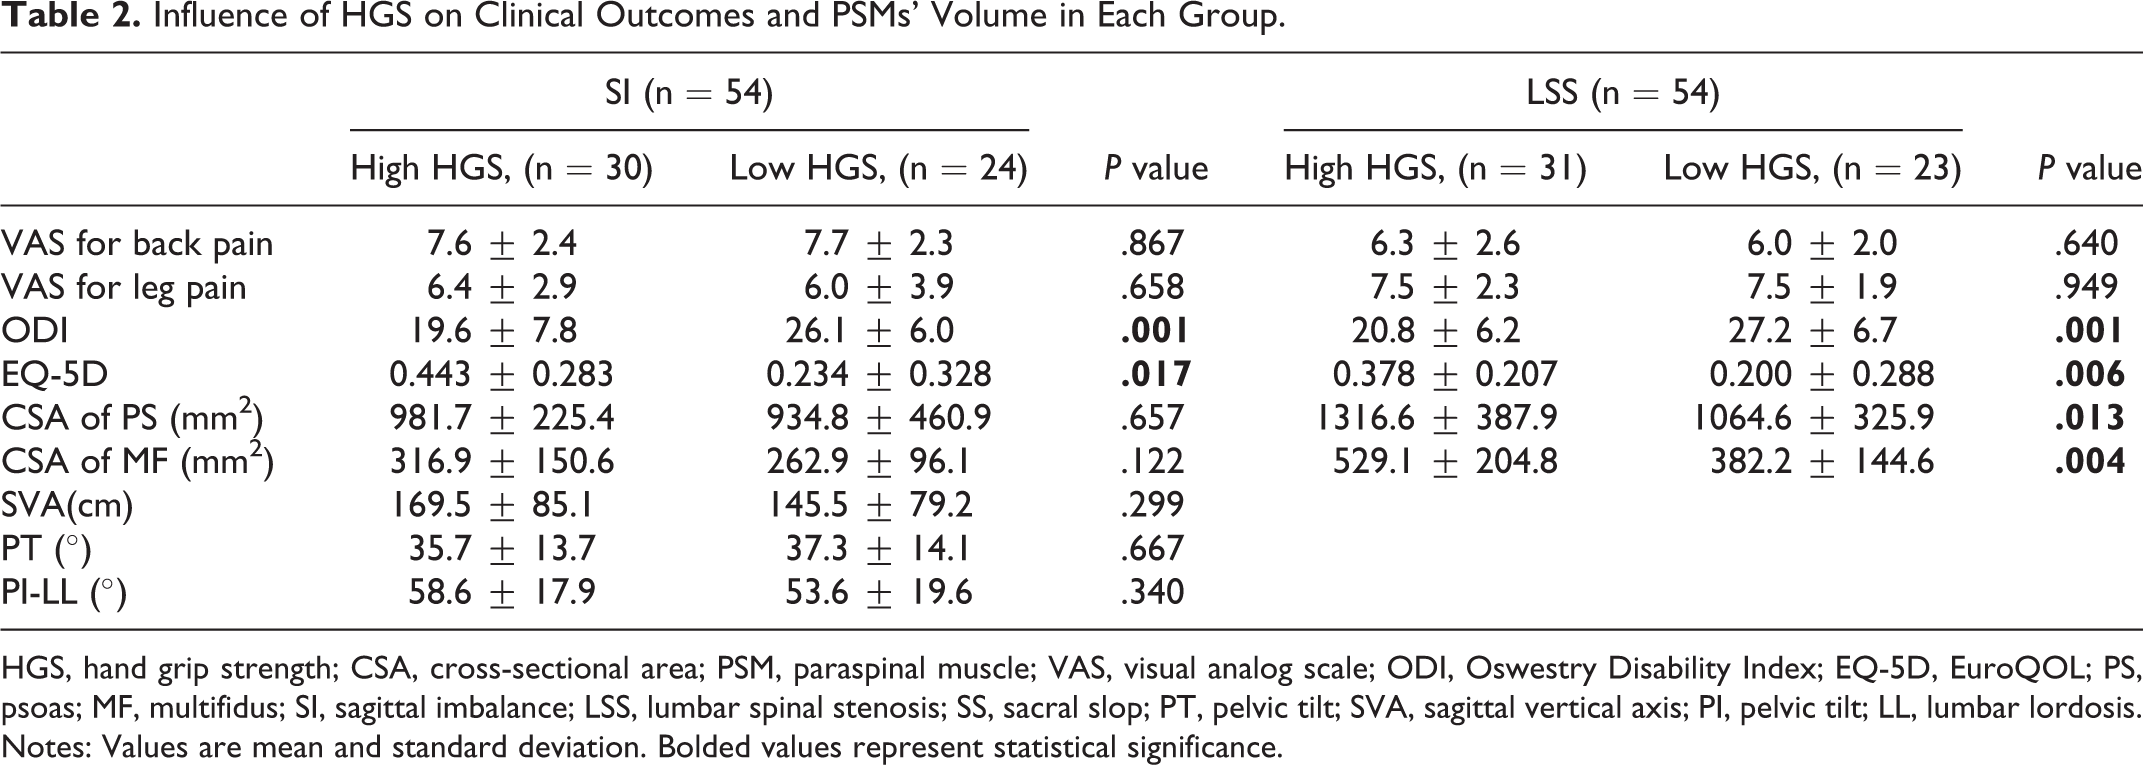
HGS, hand grip strength; CSA, cross-sectional area; PSM, paraspinal muscle; VAS, visual analog scale; ODI, Oswestry Disability Index; EQ-5D, EuroQOL; PS, psoas; MF, multifidus; SI, sagittal imbalance; LSS, lumbar spinal stenosis; SS, sacral slop; PT, pelvic tilt; SVA, sagittal vertical axis; PI, pelvic tilt; LL, lumbar lordosis.
Notes: Values are mean and standard deviation. Bolded values represent statistical significance.
The CSA of PS an MF muscles in low HGS subgroup were significantly lower than those in high HGS subgroup in the LSS group (
Correlation Between HGS, CSA of PSM, and Clinical Outcome
Multiple regression analysis confirmed that HGS and CSA of MF showed significant correlation with ODI in both SI and LSS groups (
Multiple Regression Analysis for Correlation Between Variables and Clinical Outcomes.
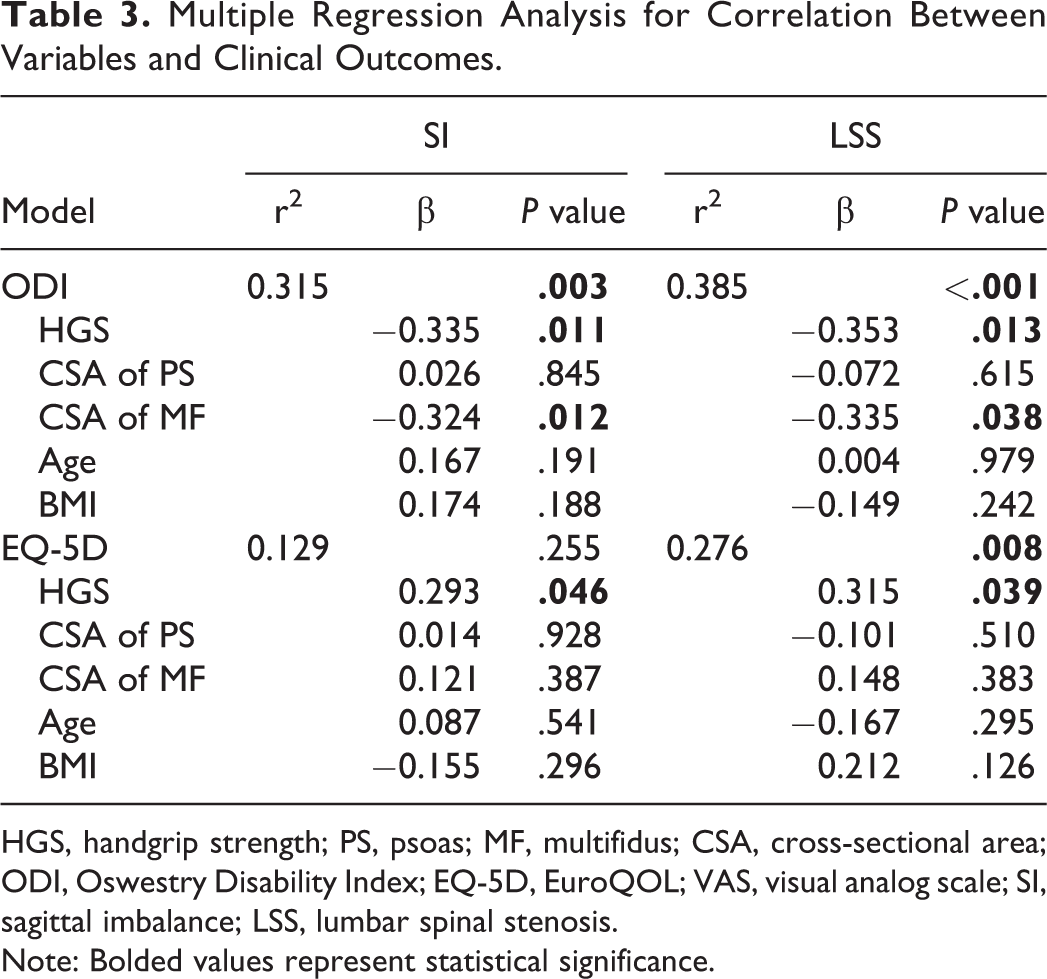
HGS, handgrip strength; PS, psoas; MF, multifidus; CSA, cross-sectional area; ODI, Oswestry Disability Index; EQ-5D, EuroQOL; VAS, visual analog scale; SI, sagittal imbalance; LSS, lumbar spinal stenosis.
Note: Bolded values represent statistical significance.
Discussion
In this cross-sectional study, we found that there was no significant difference between the SI and LSS groups in HGS, however, PSMs’ volume in the SI group were significantly lower than those in the LSS group. These findings indicated that SI would be associated with loss of localized muscle in mass back area, rather than HGS. However, HGS was related to disability and health status in terms of ODI and EQ-5D in patients with both SI and LSS.
The present findings revealed that the ratio of low HGS (30/54, 55.6%) in patients with severe SI was similar to that (31/54, 57.4%) in patients with LSS. Previous studies have demonstrated the high predictive value of HGS for neuromuscular status and sarcopenia.20,21 The similar ratio of low HGS between both SI and LSS groups indicate that there would be similar prevalence of sarcopenia in patients with SI and LSS. Sarcopenia is an age-related syndrome with progressive and generalized loss of skeletal muscle mass and strength. A growing number of factors are demonstrated to be contributors to sarcopenia or results from sarcopenia, including nutritional status, declined hormonal change, physical inactivity and inflammatory pathway activation.22-24 As a potential mechanism, both SI and LSS conditions cause physical inactivity owing to functional disability and back/or leg pain, which may result in loss of muscle mass and strength, leading to sarcopenia. 25 A previous study is in concordance with the present results, which have reported that osteoarthritis at the hip or lower limbs is associated with sarcopenia condition, because of physical inactivity from pain and joint stiffness. 26
While the mean HGS were not different between the SI and LSS groups, CSA of PS and MF muscles were significantly lower in the SI group than those in the LSS group. This result was similar with a previous study addressing scoliosis, another type of spinal malalignment, by Yagi et al. 27 They found that a significantly smaller CSA of MF and PS muscles was noted in patients with degenerative lumbar scoliosis than those with LSS, while there were no significant differences in grip strength between patients with degenerative lumbar scoliosis and those with LSS. 27 Furthermore, multiple studies have suggested that back extensor weakness and decreased volume of MF muscle were correlated with severity of positive sagittal imbalance.3,4,28 These findings mean that loss of degenerative muscle mass localized in the trunk or back area would be associated with the pathomechanism of positive SI, rather than global muscle weakness representing sarcopenic state. Interestingly, patients with low HGS showed significant lower volumes of PSM than those with high HGS in the LSS group, while there was no difference of PSM volumes between low and high HGS in the SI group. This finding seems to mean that decrease of back muscle is a very common finding regardless of sarcopenic condition in the SI group. In addition, we also found that there was no significant difference in spinopelvic parameters, including SVA, PT and PP-LL between high and low HGS subgroups within SI group, which indicates that HGS, regarding as one of the sarcopenia-related parameters, is not correlated with the radiological severity of SI.
The patients with low HGS showed inferior functional and health status in terms of ODI and EQ-5D in both SI and LSS groups in present study. This can be explained by the fact that lower HGS is associated with loss of physical activity and functional mobility, which may contribute to decreased functional and health status. As well documented, HGS is a reliable marker in assessing patients’ physiologic status, and it was associated with global muscle strength, nutrition status, frailty and sarcopenia.13,29,30 Furthermore, previous studies have demonstrated the negative effect of HGS on length of hospital stay, cognitive decline and mortality rate.31-33
The results of regression analysis in current study showed that HGS and the CSA of MF muscle were correlated with ODI in both groups. Although the CSA of MF muscle was not significantly different according to HGS within SI group, it was reasonable to confirm that MF muscle’s volume was associated with ODI, because of the negative impact of MF muscle on the severity of SI.3,4,28 Previous studies support these findings, in which decreased volume of the MF muscle is associated with disability. 9 In addition, HGS is a well-known indicator of sarcopenia, and sarcopenia is correlated with an increased risk of adverse outcomes such as physical disability, poor quality of life, and mortality. 23 Therefore, both generalized muscle weakness and localized muscle loss were associated with functional disability in patients with SI and LSS independently.
The management for elderly patients with SI and LSS still remains complex. Although both surgical and non-surgical approaches are commonly used treatment strategies, it usually begins with conservative treatment with the goals of reduction of pain and improving functional status. For alleviation of pain symptom, medications and injection therapies are commonly employed approaches.35-37 While for improving functional status, we recommend exercise therapy on generalized muscle and localized back muscle would be potentially helpful and necessary, as HGS and PSMs’ volumes were adversely associated with functional disability in both SI and LSS patients, according to the results of the present study. However, few studies have reported the effectiveness of these therapies described above. Further studies are needed to investigate the effects of those conservative approaches on relieve of clinical symptoms and functional status for both SI and LSS patients.
There are several limitations in this study. First, this study was of a relatively small sample size in the SI group, and there might be potential selection bias when performing propensity score matching in the LSS group. Second, we used the inferior endplate of L3 lumbar vertebra to evaluate CSA of the PS and MF muscles in this study, because L3 skeletal muscle index was well known as a measurement to indicate sarcopenia. 38 However, this one level CSA of muscle value does not likely represent global PSM volume. Finally, the causal relationship between the lower volumes of back muscles and SI could not be confirmed from the present study, because this study reflects only cross-sectional relationship. Therefore, the future longitudinal study would be necessary to know the causal relationship among the variables in the patients with LSS and/or SI.
Conclusion
In conclusion, there was no significant difference in HGS between the SI and LSS groups, while PSMs’ volume in the SI group were significantly lower than those in the LSS group. These findings indicated that kyphosis would be associated with loss of localized muscle mass back area, rather than global skeletal muscle weakness. We also found that HGS and PSMs’ volume were adversely associated with functional status in both SI and LSS patients. Therefore, we recommend exercise therapy would be an effective conservative treatment for improving functional disability in patients with SI or LSS.
Footnotes
Declaration of Conflicting Interests
The author(s) declared no potential conflicts of interest with respect to the research, authorship, and/or publication of this article.
Funding
The author(s) disclosed receipt of the following financial support for the research, authorship, and/or publication of this article: This research was supported by research grants from Je-il Pharm and Basic Science Research Program through the National Research Foundation of Korea (NRF) funded by the Ministry of Education, Science and Technology (2016R1A2B3012850).