
Abstract
Study Design:
Retrospective study.
Objective:
Lumbar magnetic resonance imaging (MRI) findings are believed to be associated with low back pain (LBP). This study sought to develop a new predictive classification system for low back pain.
Method:
Normal subjects with repeated lumbar MRI scans were retrospectively enrolled. A new classification system, based on the radiological features on MRI, was developed using an unsupervised clustering method.
Results:
One hundred and fifty-nine subjects were included. Three distinguishable clusters were identified with unsupervised clustering that were significantly correlated with LBP (P = .017). The incidence of LBP was highest in cluster 3 (57.14%), nearly twice the incidence in cluster 1 (30.11%). There were obvious differences in the sagittal parameters among the 3 clusters. Cluster 3 had the smallest intervertebral height. Based on follow-up findings, 27% of subjects changed clusters. More subjects changed from cluster 1 to clusters 2 or 3 (14.5%) than changed from cluster 2 or cluster 3 to cluster 1 (5%). Participation in sport was more frequent in subjects who changed from cluster 3 to cluster 1.
Conclusion:
Using an unsupervised clustering method, we developed a new classification system comprising 3 clusters, which were significantly correlated with LBP. The prediction of LBP is independent of age and better than that based on individual sagittal parameters derived from MRI. A change in cluster during follow-up may partially predict lumbar degeneration. This study provides a new system for the prediction of LBP that should be useful for its diagnosis and treatment.
Background
With an aging population, low back pain (LBP) has become one of the diseases with significant effects on quality of life and also causes disability.1,2 Lumbar degeneration is well accepted as a major cause of LBP. 3 Magnetic resonance imaging (MRI) is widely used to evaluate lumbar degenerative diseases because of its advantages, including absence of radiation, ability to perform multiplanar imaging, provides excellent spinal soft-tissue contrast, and allows the radiologist to determine the precise location of intervertebral disc changes.4-7 Lumbar degeneration is frequently detected on MRI scans. Although there is no firm evidence for the presence or absence of a causal relationship between radiological findings and LBP, many studies have suggested that there should be such a relationship.8-12
Machine learning with artificial intelligence (AI) can be used to analyze data without supervision, so that information can be obtained that has not been available with the traditional method of image analysis in the past. Therefore, we developed an AI strategy to rapidly evaluate the characteristics of lumbar degeneration on MRI. This strategy analyzed the data by unsupervised machine learning and developed a new classification system based on the radiological features on MRI in an unsupervised manner, in a process called ‘unsupervised clustering’. This study sought to develop a new predictive classification system for LBP using a sample of the general population with repeated lumbar MRI scans with an unsupervised clustering method.
Methods
Patient Selection
To investigate lumbar degeneration in a relatively normal population over time, subjects underwent repeated lumbar MRI scans (which are a routine part of a value-added health package) over a 10-year period at the Health Consultation Department of Zhongshan Hospital (Shanghai, China) and for whom we had contact information were retrospectively enrolled in this study. The interval between the first and last scans was > 3 years in each subject. The study was approved by the Ethical Committee of Zhongshan Hospital affiliated with Fudan University (Shanghai, China) (B2019-220 R), which provided exemption for the requirement to obtain written informed consent. Data was anonymized before their transmission and analysis.
Radiographic and Clinical Assessments
All radiographic assessments were performed with the automatic spine measure system based on U-Net. 13 (For the detailed method, see the Appendix). The lumbar lordosis angle (LL) was defined as the angle between the superior endplates of L1 and S1. The lumbosacral angle (LS) was calculated as the angle between the horizontal line and the upper endplate of S1. The medial disc height (MDH) was calculated as the distance between the 2 intersections of the medial curve with the inferior and superior endplates of consecutive vertebral bodies. MDH was adjusted to the height of the upper vertebra, and expressed as L12M/L1 M, L23M/L2 M, L34M/L3 M, L45M/L5 M, or L5S1M/L5 M. The mean disc signal intensity and the variance of the disc intensity were computed. The disc signal intensity (DI) was adjusted by the signal intensity of the cerebrospinal fluid (CSF), as DI/CSF%.
Subjects were followed-up by telephone. Information on the subjects’ demographics, including their sex, age (years) at the time of the MRI assessments, bodyweight (kg), height (cm), smoking status, participation in sport, occupation, sedentary lifestyle, and pain status were collected using a standardized questionnaire. Body mass index (BMI: kg/m2) of the subject was calculated (kg/m2) according to the guidelines for Asians proposed by the World Health Organization. 14 Smoking status was defined as ‘current smoker’ or not. ‘Drinking’ was defined as the consumption of ≥ 3 alcoholic drinks/day and ‘nondrinking’ as < 3 drinks/per. Participation in sport was defined as regular engagement in any kind of routine exercise, with a minimum frequency of twice per week. Occupation was categorized as sedentary or a light, medium, heavy, or very heavy workload, according to a scheme for the classification of jobs based on workload. However, because the occupations of only eight subjects were classified as ‘heavy’ or ‘very heavy’, the subjects were regrouped into the categories ‘light’ (subjects with a sedentary job) and ‘not light’ (subjects with a medium, heavy, or very heavy physical workload) for subsequent analyses. A sedentary lifestyle was defined as sitting for > 8 h per day. The presence of LBP was defined as continuous localized pain for ≥ 2 weeks between MRI scans.
Clustering
Curve clustering was based on MDH and DI. First, rigid registration was used to adjust the intersubject nuisance variation (e.g., posture, curve length). Based on the registered results, MDH and DI were refitted according to the procedure described above. The MDH and DI features were clustered by hierarchical clustering with complete linkage. A dendrogram of cluster agglomeration from k = number of subjects through to k = 1 cluster(s) was visualized, and from incremental candidate selections of 1 to 15 clusters, cluster groupings were performed at the similarity levels that allowed exactly k clusters. This clustering algorithm is a variant of the traditional k-means clustering algorithm, which integrates a probabilistic seeding initialization method. The selection of the right number of clusters k is based on the validity ratio, which minimizes the intracluster distance and maximizes the intercluster distance. In this study, the clustering threshold distance for clustering was chosen to be 70% of the maximum linkage distance that resulted in 3 clusters, as shown in Figure 1.
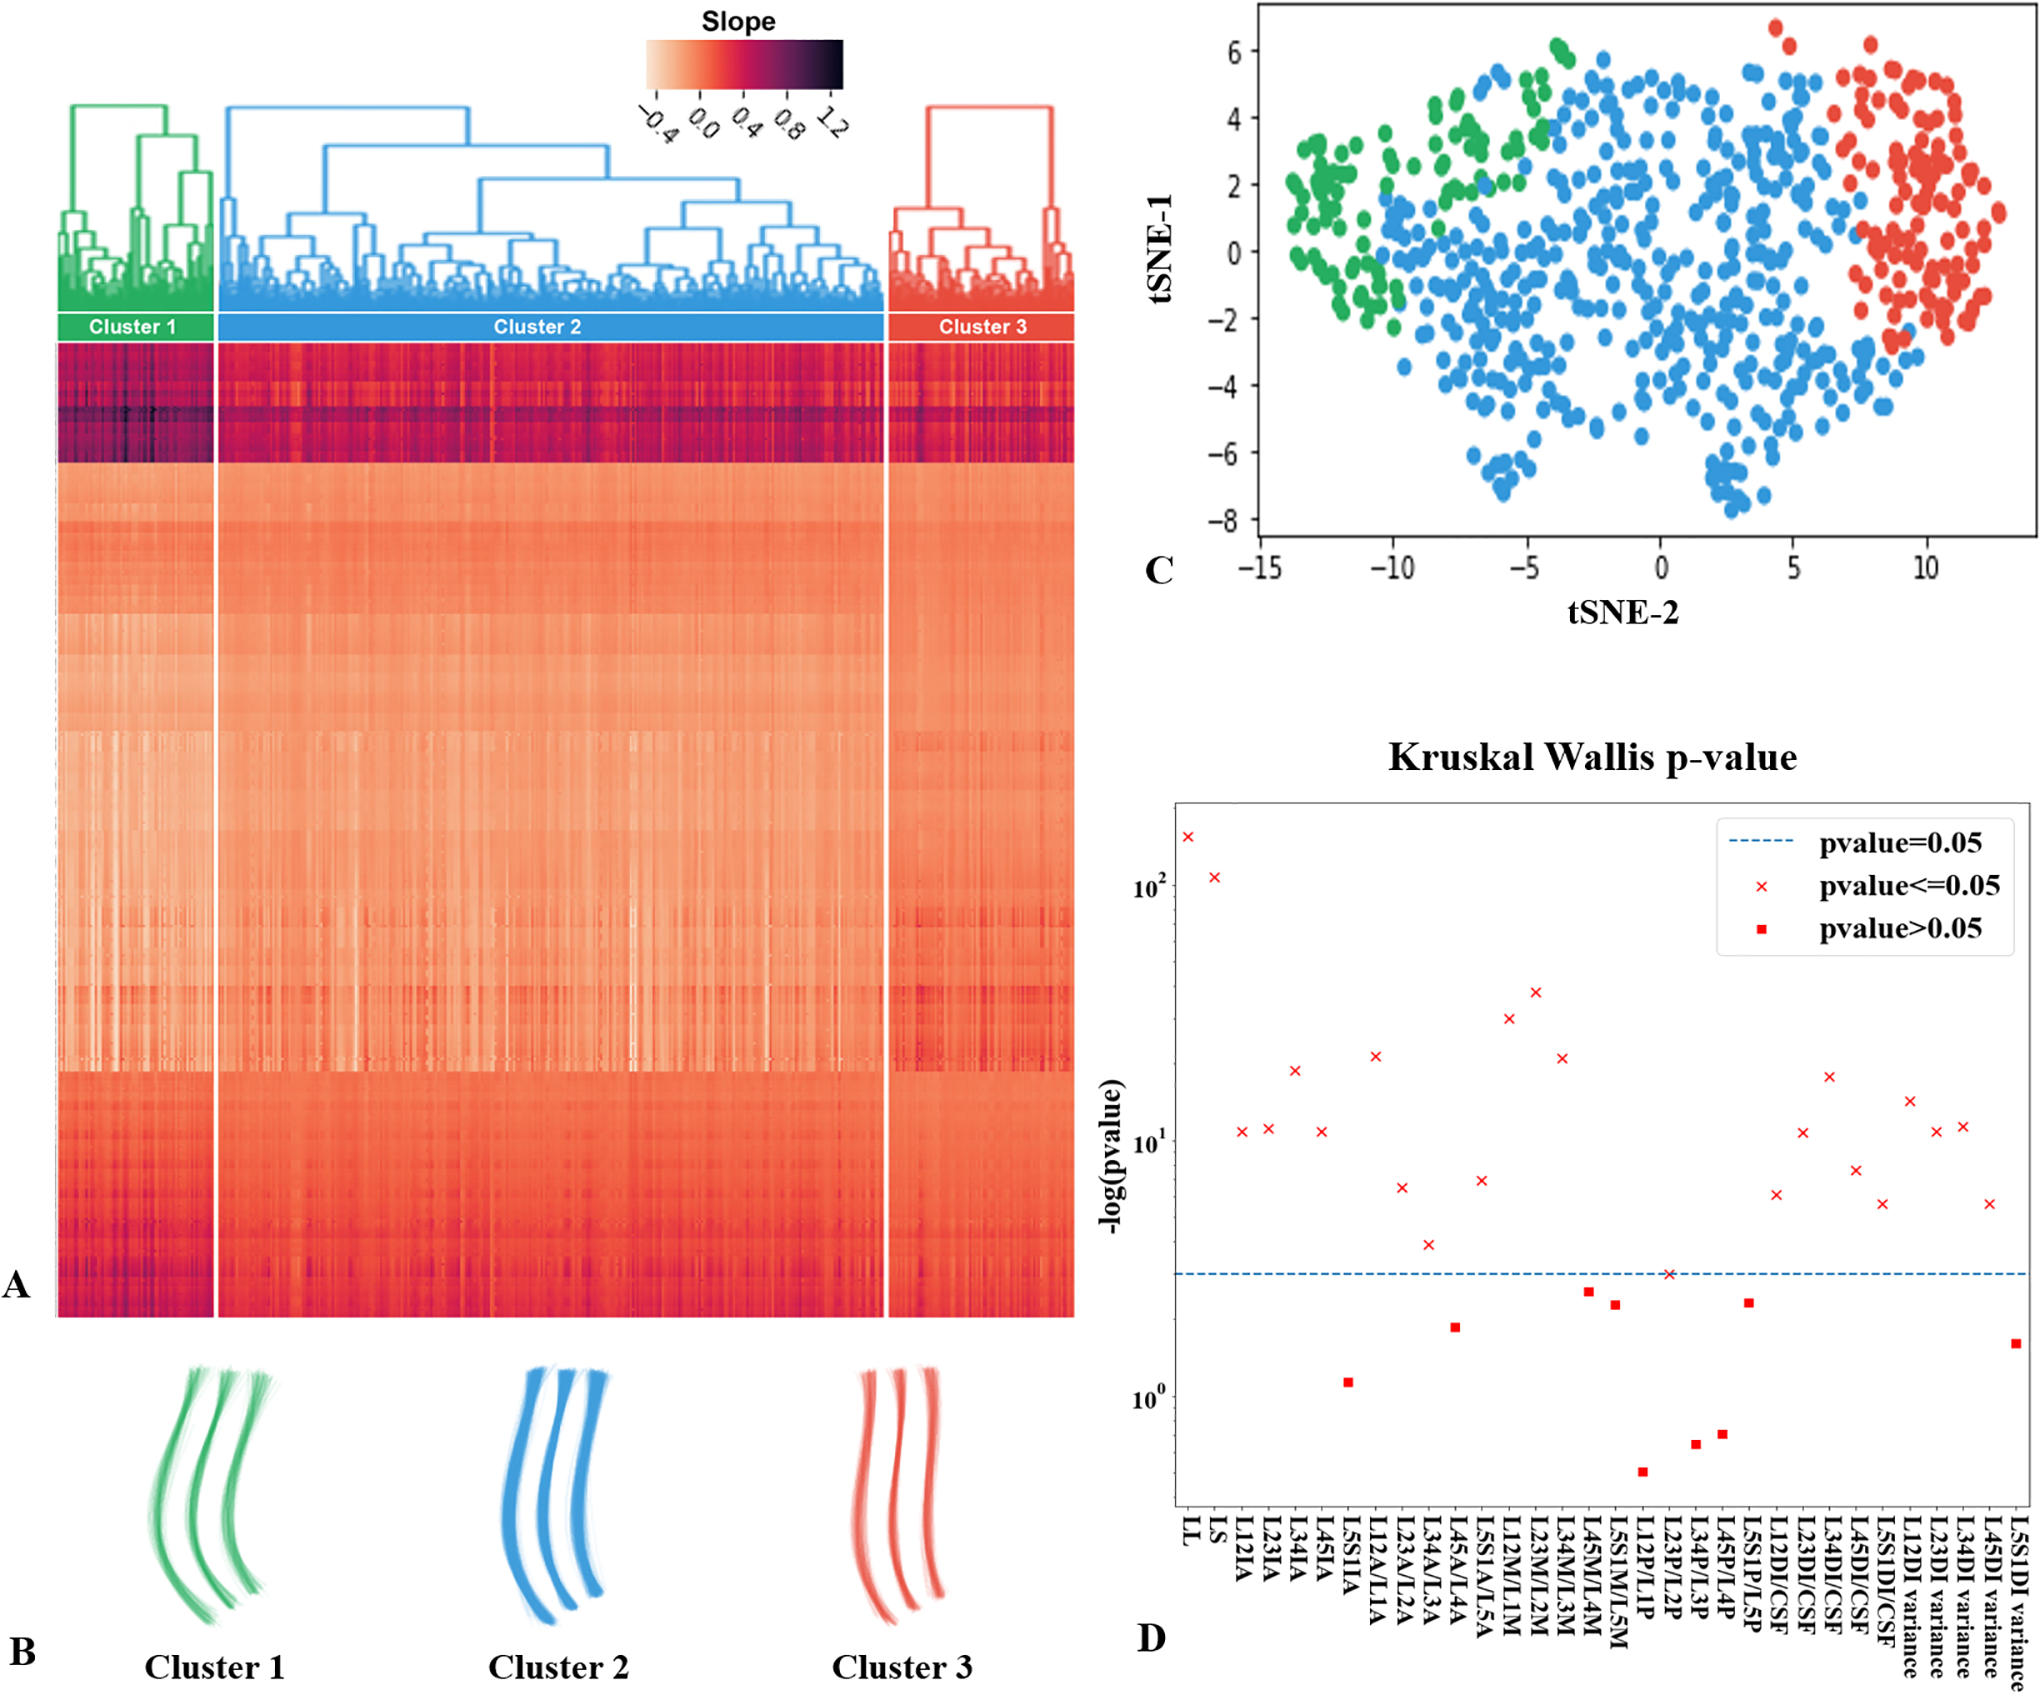
Clustering is done by hierarchical clustering and is plotted in (A), where each column is a sample and row is a feature. The rows represent the slopes of the curves at each pixel and the columns represent the samples. The bright color represents the slope in the anterior direction and the dark color represents the slope in the posterior direction. Three clusters are visualized by curves (B) and tSNE scatter plot (C). Many radiology features are associated with the cluster as indicated by Kruskal Wallis test (D), where the crosses denote significant features.
Statistical Analysis
Data was analyzed with SPSS software version 20.0 (IBM Corp., Armonk, NY, USA). Descriptive statistics were summarized as frequencies and percentages for categorical variables and as means ± standard deviations (SD) for continuous variables. Analysis of variance (ANOVA) and Pearson’s correlation coefficient were used to compare the differences among clusters. A P value of < .05 was considered statistically significant.
Results
General Characteristics of the Subjects
One hundred and fifty-nine subjects who underwent at least 2 lumbar MRI scans were included in this study. The interval between the first and last scans was > 3 years (mean = 4.6). Overall, 96 (60.4%) subjects were male and 63 (39.6%) were female. The mean age was 45.22 ± 8.70 years, with a range of 24–67 years.
Investigation of Clusters and their Change During Follow-up
Using the method described in the “Clustering” section, 3 distinguishable clusters of patterns were identified. Intuitively, it was observed that the curvatures were different among these 3 clusters. The curves of Cluster 1 and 2 were C-shaped, while Cluster 1 with a larger lordosis and Cluster 2 was straighter. Cluster 3 presented a reverse S-shaped curve, with a kyphosis at the junction of thoracolumbar. The apex of the lumbar lordosis was also lower than the of Cluster 1 and 2. Then we analyzed the curve characteristics of each cluster, including lordosis angle, disc height and DI. The results indicated that the curve clusters were significantly associated with disc height and DI (Table 1). The intervertebral height was largest in cluster 1 and smallest in cluster 3. The DI was lowest in cluster 2, but was not significantly different between clusters 1 and 3. LL and LS were largest in cluster 2, followed by cluster 1 and cluster 3.
The Distinguishable Features of Clusters.a
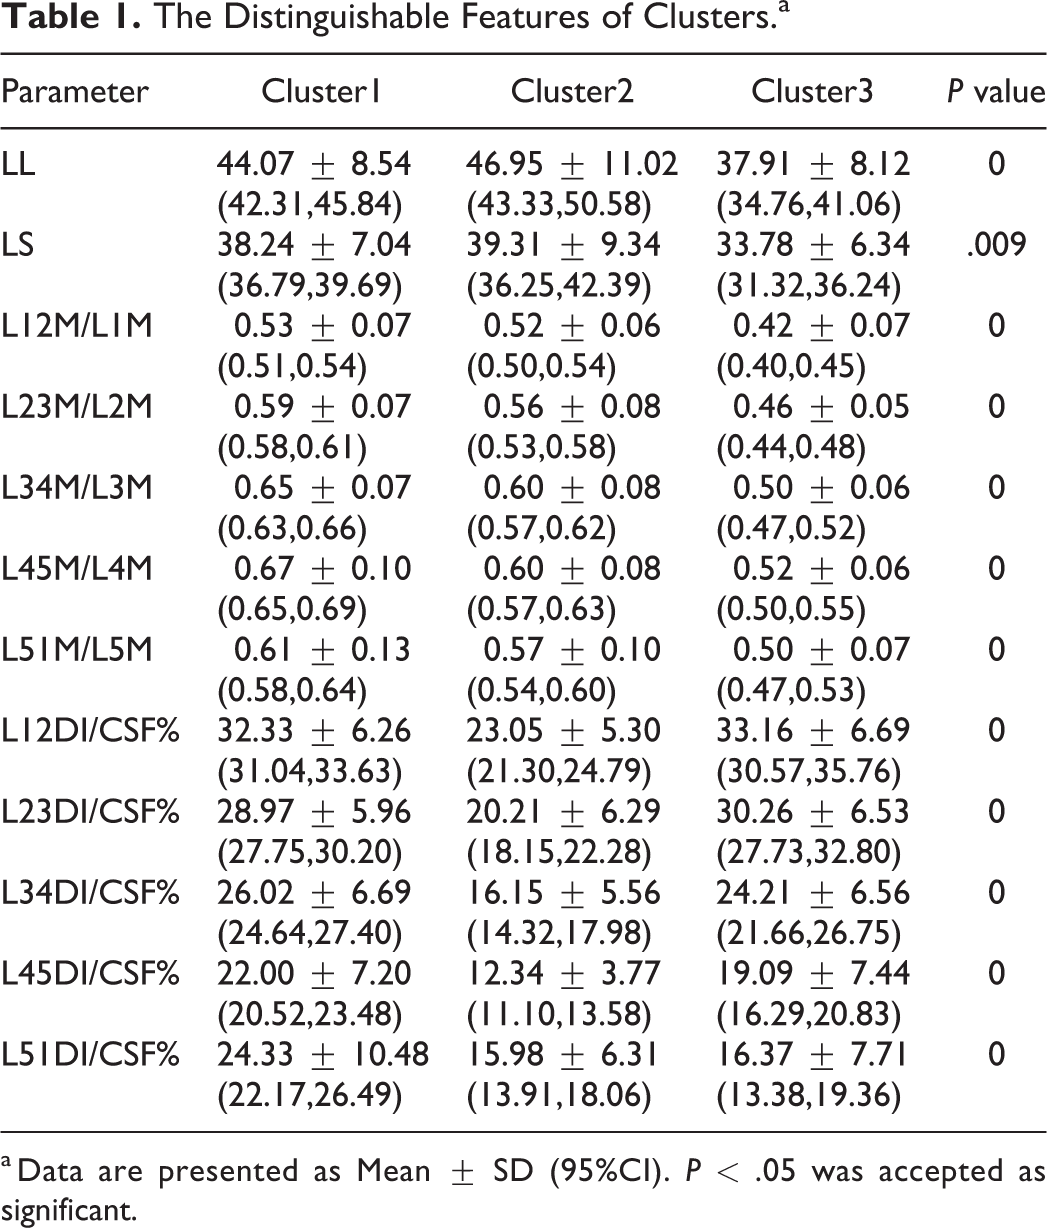
a Data are presented as Mean ± SD (95%CI). P < .05 was accepted as significant.
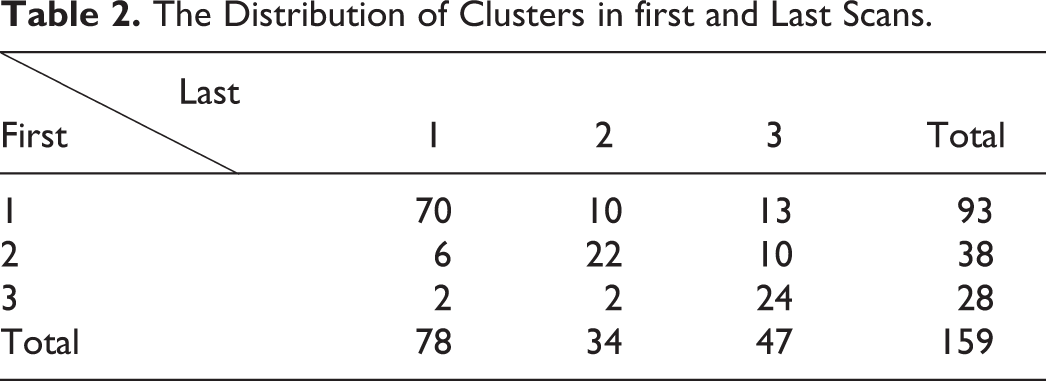
There were 93 subjects included in cluster 1, with a mean age of 43.9 years; 38 in cluster 2, with a mean age of 51.0 years; and 28 in cluster 3, with a mean age of 41.8 years. At the last follow-up, 78 subjects were included in cluster 1, 34 in cluster 2, and 47 in cluster 3. Forty-three (27%) subjects were moved to a different cluster during the follow-up (Table 2).
The Distribution of Clusters in first and Last Scans.
New Classification Method and Clinical Outcomes
Sixty-two (39%) subjects had LBP. During the follow-up, the incidence of LBP was greatest in cluster 3 (16/28, 57.14%), nearly twice that in cluster 1 (28/93, 30.11%). Cluster 2 had a moderate incidence of LBP (18/38, 47.37%), which was close to that of cluster 3. The incidence of LBP differed significantly between cluster 1 and cluster 3 (P = .017; Table 3).
Custers and LBP.a
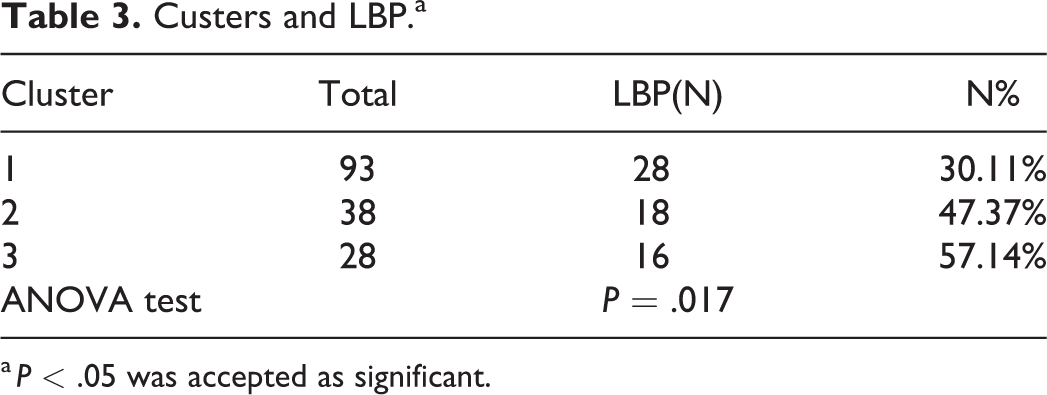
a P < .05 was accepted as significant.
Cluster Change During Follow-Up
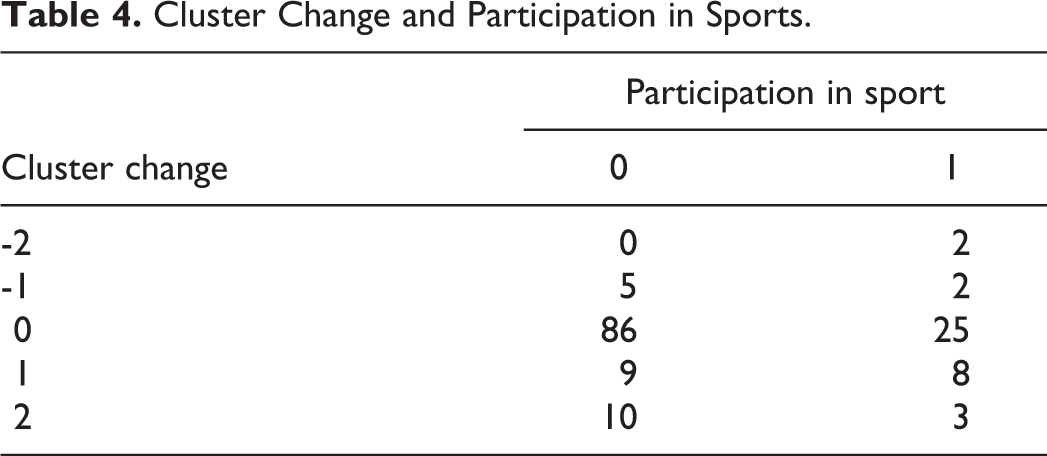
Among the 43 subjects (27%) whose cluster was changed during the follow-up, 23 were moved from cluster 1 to clusters 2 or 3, while just 8 subjects were moved from clusters 2 or 3 to cluster 1. Two subjects were moved from cluster 3 to cluster 1; both subjects exercised regularly. Among the subjects who moved from cluster 1 to cluster 3, only 3 exercised regularly (Table 4). However, the association between Cluster change and sport was not significant.
Cluster Change and Participation in Sports.
Further analysis detected the correlation between participation in sport and LBP in univariate analysis (Pearson’s correlation coefficient r = 0.03), and did not reveal a significant association between LBP and sport participation.
Discussion
This study was based on a relatively normal population of subjects. The prevalence of LBP (39%) in this study was similar to the prevalence in previous studies. 1 The prediction of LBP is difficult and there is currently no classification system for predicting LBP. 15 In this study, using unsupervised clustering, we developed a new classification system with 3 clusters that was significantly correlated with LBP (P = .017). The incidence of LBP was greatest (57.14%) in cluster 3, nearly double that in cluster 1 (30.11%), a statistically significant difference. The subjects in cluster 3 were younger (41.8 years) than those in cluster 1 (43.9 years), which suggests that the difference in LBP was not caused by age.
There were clear differences in the sagittal parameters among the 3 clusters. Cluster 3 contained subjects with the smallest intervertebral height, but not the lowest DI. Previous studies have shown that MRI findings, such as disc herniation and reduced disc height, are associated with LBP. 16 Therefore, we analyzed the relationships between intervertebral height, DI, and LBP separately, but found no significant correlation between any individual factors. Therefore, this classification system better predicts LBP than sagittal plane parameters alone.
During the follow-up period, 27% of subjects were moved to a different cluster. A greater proportion of subjects were moved from cluster 1 to clusters 2 or 3 (14.5%) than from clusters 2 or 3 to cluster 1 (5%). Lumbar degeneration is a continuous process, and we assume that this classification system can help to predict lumbar degeneration. Participation in sport was more frequent in those subjects who were moved from cluster 3 to cluster 1, although there was no significant correlation. Although we identified no direct relationship between participation in sport and LBP, other studies have reported that subjects who regularly participated in sport had less LBP. 17 Therefore, participation in sport may reverse or prevent lumbar degeneration and reduce the incidence of LBP. With a larger sample, more predictive factors associated with LBP should be identified.
We believe that this classification system can predict LBP and that this prediction is independent of age and better than that achieved with individual sagittal parameters. This is a good attempt to provide a new method of predicting LBP that could be implemented in medical practice. This AI algorithm made it possible that an effective tool can be developed with the function of automatic identification and classification of lumbar MRI at clinic. By this tool, doctors and their patients can easily obtain the key sagittal plane parameters and predict the risk of LBP in the future. It could also be an efficient and stable measurement for the analysis of medical big data, thereby conduct risk factor analysis in a larger population, discovering more high-risk populations, conducting health interventions for this population, and promoting population health and reducing social and personal costs.
Conclusion
Using unsupervised clustering of data from a relatively normal population, we have developed a new classification system of 3 clusters that was based on radiological features. This new classification system was significantly correlated with LBP (P = .017). The system was independent of age, and better than that achieved with individual sagittal parameters on MRI. A proportion of subjects (27%) were moved among the clusters during follow-up, predominantly from cluster 1 to clusters 2 or 3. This movement among clusters may help explain how the classification system can predict lumbar degeneration. This study is a successful attempt to provide a new way to predict LBP that can be implemented in medical practice, and should be helpful in the diagnosis and treatment of LBP.
Supplemental Material
Supplemental Material, sj-docx-1-gsj-10.1177_21925682211001813 - Predictive Classification System for Low Back Pain Based on Unsupervised Clustering
Supplemental Material, sj-docx-1-gsj-10.1177_21925682211001813 for Predictive Classification System for Low Back Pain Based on Unsupervised Clustering by Lixia Jin, Chang Jiang, Lishu Gu, Mengying Jiang, Yuanlu Shi, Qixun Qu, Na Shen, Weibin Shi, Yuanwu Cao, Zixian Chen, Chun Jiang, Zhenzhou Feng, Linghao Shen and Xiaoxing Jiang in Global Spine Journal
Footnotes
Authors' Note
The development of AI was performed in Shenzhen Digital Life Institute, and other work was performed at Shanghai Zhongshan Hospital, Fudan University, Shanghai, People's Republic of China.
Author Contributions
The first three authors contributed equally to this manuscript as the first author. The last three authors contributed equally to this manuscript as the correspondent author.
Declaration of Conflicting Interests
The author(s) declared no potential conflicts of interest with respect to the research, authorship, and/or publication of this article.
Funding
The author(s) disclosed receipt of the following financial support for the research, authorship, and/or publication of this article: Each author certifies that neither he, nor any member of his or her immediate family, has funding or commercial associations (consultancies, stock ownership, equity interest, patent/licensing arrangements, etc.) that might pose a conflict of interest in connection with the submitted article. This study was funded by National Natural Science Foundation of China (81 801 375), Youth. The recipient is Yuanwu Cao. This study also supported by the National Key Research and Development Program of China (No. 2018YFC2000701). The funding source had not been involved in the design of the study and collection, analysis, and interpretation of data or in writing the manuscript.
Ethical Approval
This study was approved by the Ethical Committee of Zhongshan hospital affiliated to Fudan university (B2019-220 R), and exemption was granted for obtaining written informed consent.
Supplemental Material
Supplemental material for this article is available online.
References
Supplementary Material
Please find the following supplemental material available below.
For Open Access articles published under a Creative Commons License, all supplemental material carries the same license as the article it is associated with.
For non-Open Access articles published, all supplemental material carries a non-exclusive license, and permission requests for re-use of supplemental material or any part of supplemental material shall be sent directly to the copyright owner as specified in the copyright notice associated with the article.