
Abstract
Study Design:
Retrospective evaluation of prospectively collected data.
Objective:
Analyzing time course and stages of interbody fusion of a uniformly operated cohort, defining a grading system and establishing diagnosis-dependent periods of bone healing.
Methods:
Sequential lateral radiographs of 238 patients (313 levels) with interbody fusion operated thoracoscopically were analyzed.
Results:
Evaluation of 1696 radiographs with a mean follow-up of 65.19 months and average numbers of 5.42 (2-18) images per level was performed. Diagnoses were Pyogenic Spondylitis (74), Fracture (96), Ankylosing Spondylitis (38) and Degenerative Disease (105). No case with Grade 2 deteriorated to Grade 5. On average, Grade 4 persisted for 113 days, Grade 3 for 197 days, Grade 2 for 286 days and Grade 1 for 316 days. The first 95% of levels (“Green Zone”, ≤ Grade 2) fused at 1 year, the remaining 4% levels fused between 12 and 17 months (“Yellow Zone”) and the last 1% (“Red Zone”) fused after 510 days.
Conclusion:
Sequential lateral radiographs permit evaluation of interbody fusion. Grade 2 is the threshold point for fusion; once accomplished, failure is unlikely. If fusion (Grade 2,1 or 0) is not reached within 510 days, it should be regarded as failed. The 510-day-threshold could reduce the necessity of CT scanning for assessing fusion.
Keywords
Introduction
Bony fusion of vertebrae is the most common reason for spinal surgery worldwide. As such, it would be expected that a number of sound methods for determining treatment success have been established. This, however, is not the case and open exploration is still regarded as the – hypothetical though impractical – gold standard. Of the non-invasive techniques, static conventional radiographs have been studied extensively for evaluation of postero-lateral fusions (PLF). Since several authors found sensitivity at 89%, specificity at 60% and correlations to surgical exploration in the range of 45 - 69% for predicting solid fusion, it was concluded that plain x-ray is not adequate to assess fusion status.1-4 Fine-cut axial and multiplanar CT reconstruction views were therefore widely advocated as the method of choice not only for posterior but also for anterior fusion of the lumbar spine.5-8 The superiority of CT-based evaluation of fusion status, however, might not be justified7,8: “X-ray and CT methods performed very similarly in evaluating lumbar fusion with no significant differences in accuracy between the 2 methods.” Some authors have even concluded that CT overestimates fusion.4,9,10 Beyond the costs and infrastructural requirements, it would seem unethical to apply radiation of any kind after a clinically uneventful course in a relatively pain-free patient just for confirmation of bony union.
The goal of this work is to establish a threshold time for spinal interbody fusion in thoracic and thoracolumbar spine and to analyze whether routine follow-up radiographs are sufficient for assessment of the process of bony union. To the best of our knowledge this is the first paper studying the time a level spends in each fusion grade.
Materials and Methods
A retrospective evaluation of prospectively collected data of 238 patients operated thoracoscopically at a single center from 1994 to 1997 and 2002 to 2005 was performed. The patients operated between 1998 to 2001 were not included as digitized images for these patients were not available on the system. Approval for the study was granted by the Ethics Committee. A total of 313 levels were analyzed. All the surgeries were performed by 2 experienced thoracoscopic spine surgeons. The inclusion criteria were interbody fusion surgeries and a final follow-up evidence of radiological bony healing (minimum of 1 year). Tumor surgeries, corpectomies and interbody fusions for anterior scoliosis correction were excluded. Video-assisted thoracoscopic spinal interbody fusion surgery and segmental pedicle screw instrumentation in prone position in a single stage were carried out on patients with the following diagnoses: Fractures (96), Spondylitis (74), Ankylosing Spondylitis (39) and degenerative conditions such as thoracic degenerative disc disease, thoracic ossified posterior longitudinal ligament, adjacent segment disease and thoracic myelopathy due to discogenic stenosis (105). In 205 levels a cortico-cancellous graft (iliac crest) was used, and in 108 levels a cage filled and surrounded with cancellous bone graft was applied. BMP was not used in any levels. Repeat thoracoscopic surgery and interbody fusion was performed for 11 levels with pseudoarthrosis. Although all patients had been encouraged to adhere to a routine schedule for follow-up controls at 3 months, 6 months, and 1, 2.5, 5, 10 and 20 years, the actual visits varied substantially. However, no attempt was made to entice additional x-ray controls for study reasons. Routinely radiographs of operated levels were performed in supine position to achieve best image quality for accurate evaluation of bony fusion. In order to limit X-ray exposure in uneventful courses of ankylosing spondylitis, the standing radiographs for sagittal alignment assessment were taken.
Surgical technique and detailed analysis of the results achieved in different indication groups are dealt with in a separate paper. 11 The radiographs were graded by the N.P, H.A and H.B according to a new algorithm to assess bony fusion (Figure 1) (Figure 2). The first post-operative X-ray was marked; while for all other patient data, the 3 observers were blinded. Each author independently evaluated every follow-up radiograph by comparing it to the immediate post-operative radiograph. Those follow-up radiographs that could not be classified were marked as NC.
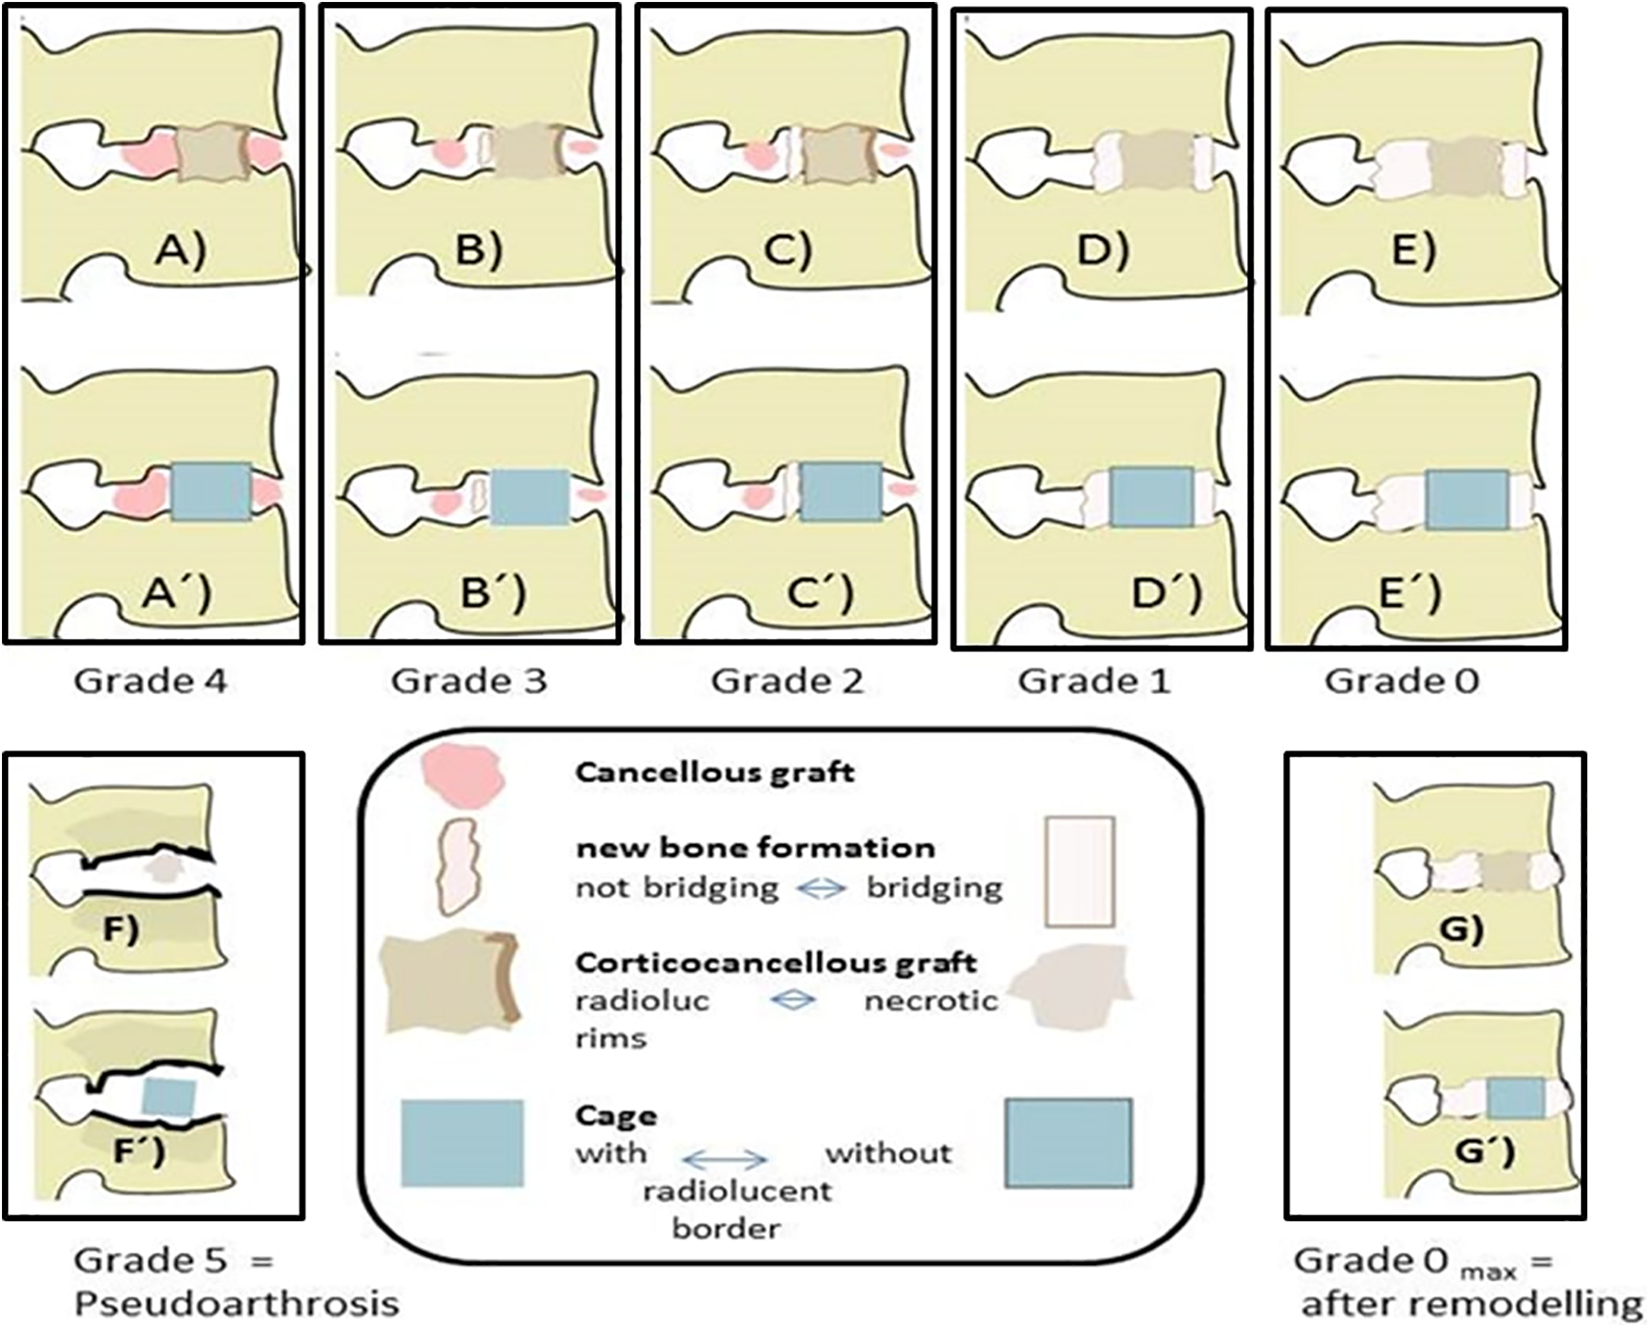
Schematic representation of the grading system from directly postoperative = Grade 4 = (A) to solid fusion = Grade 0 = (E) for structural graft or cage ( ´ ). Pseudoarthrosis = Grade 5 is depicted in (F). (G) and (G´) show a Grade 0 after long-term fusion and remodeling.
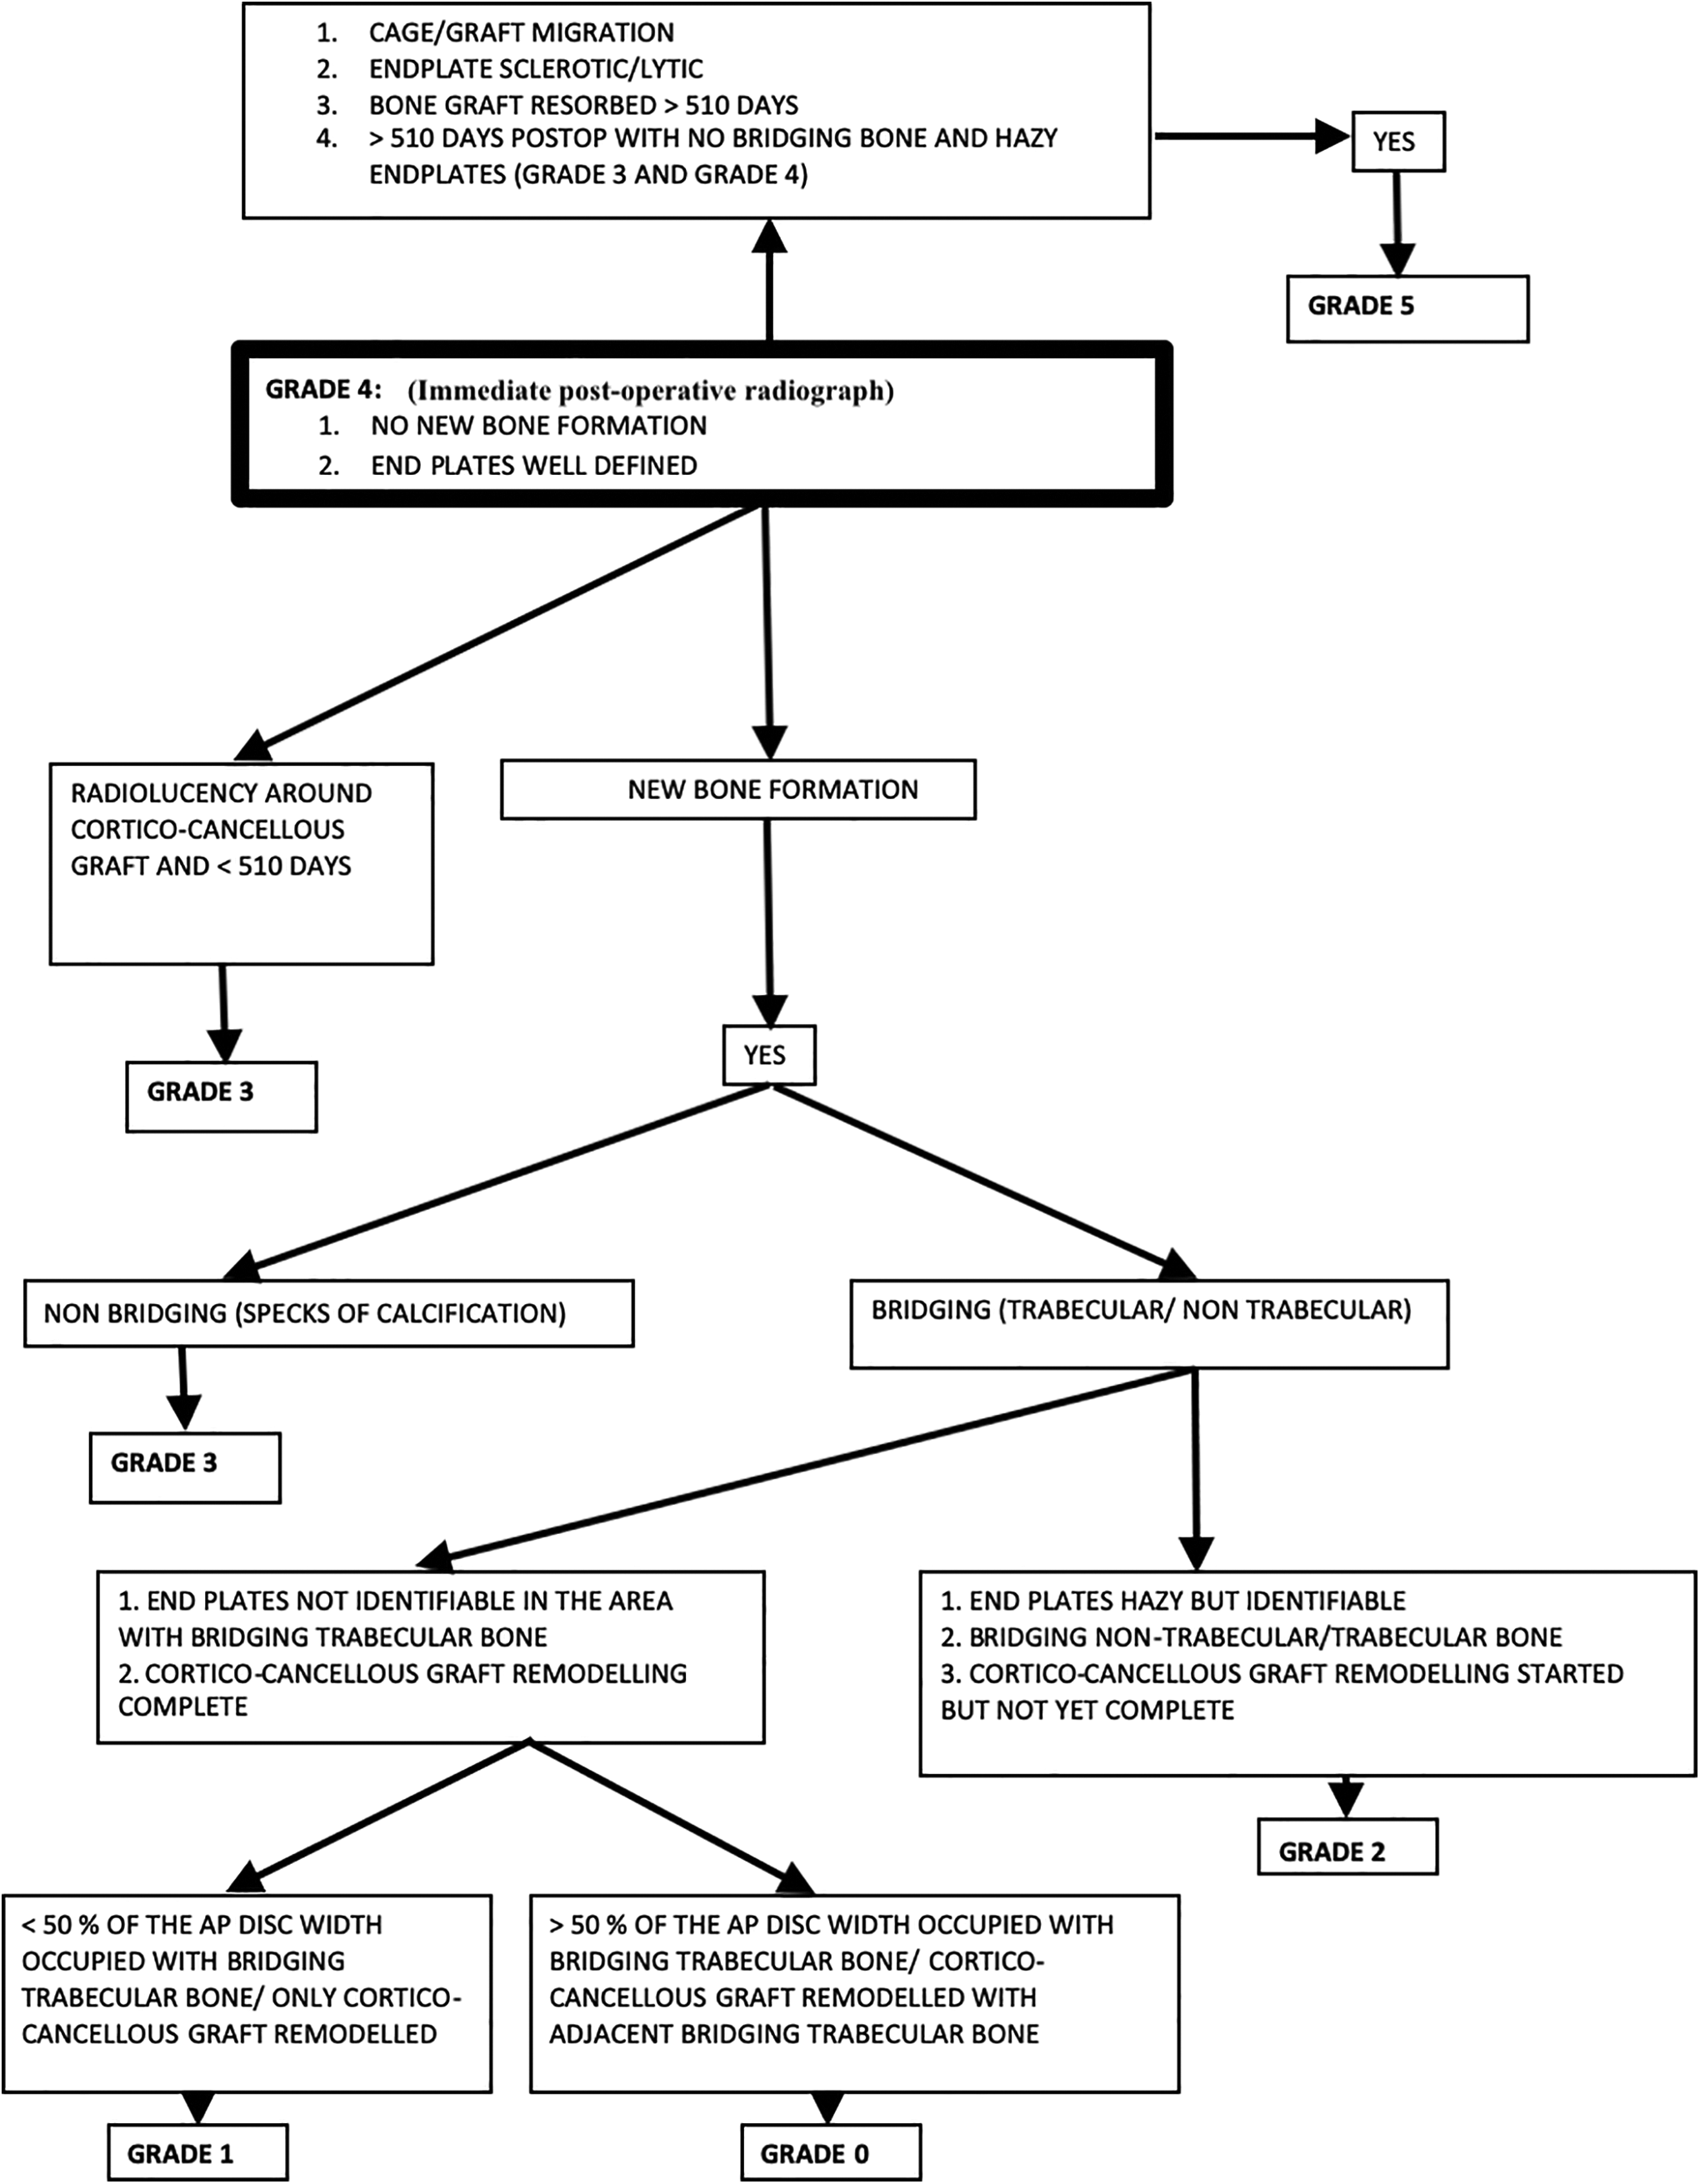
Algorithm for grading of fusion on standard lateral X-rays.
It was difficult to determine an exact time when the patients reached grade 2 (fusion state) as it is impossible to enforce identical time periods in long term follow-up. For calculating this threshold we therefore studied 194 operated levels that met the criteria of (1) having reached Grade 0, 1 or 2, and (2) having a 2nd follow-up within 6 months post-operatively and a maximum of 1 year interval between the subsequent follow-ups. The patients were divided into 2 groups: 1) last data point (follow-up radiograph) post-operatively not fused (= grade 3 and 4) vs. 2) first data point post-operatively fused (Grade 2, 1 and 0). The aim was to determine the time for the 95th and 99th percentiles of patients that reached fusion state (Grade 2, 1 or 0). This data was plotted as a line graph in a chronological order. We then took an average of the values of group (1) and of group (2) for the 95th and the 99th percentiles of patients to calculate the thresholds. The patients were then allotted a traffic light color scheme reflecting their fusion status at their last follow-up date: Green (0-95 percentile), Yellow (95-99 percentile) and Red (> 99 percentile) (Figure 3). These values were then extrapolated to the patients that remained grade 3 at final follow-up.
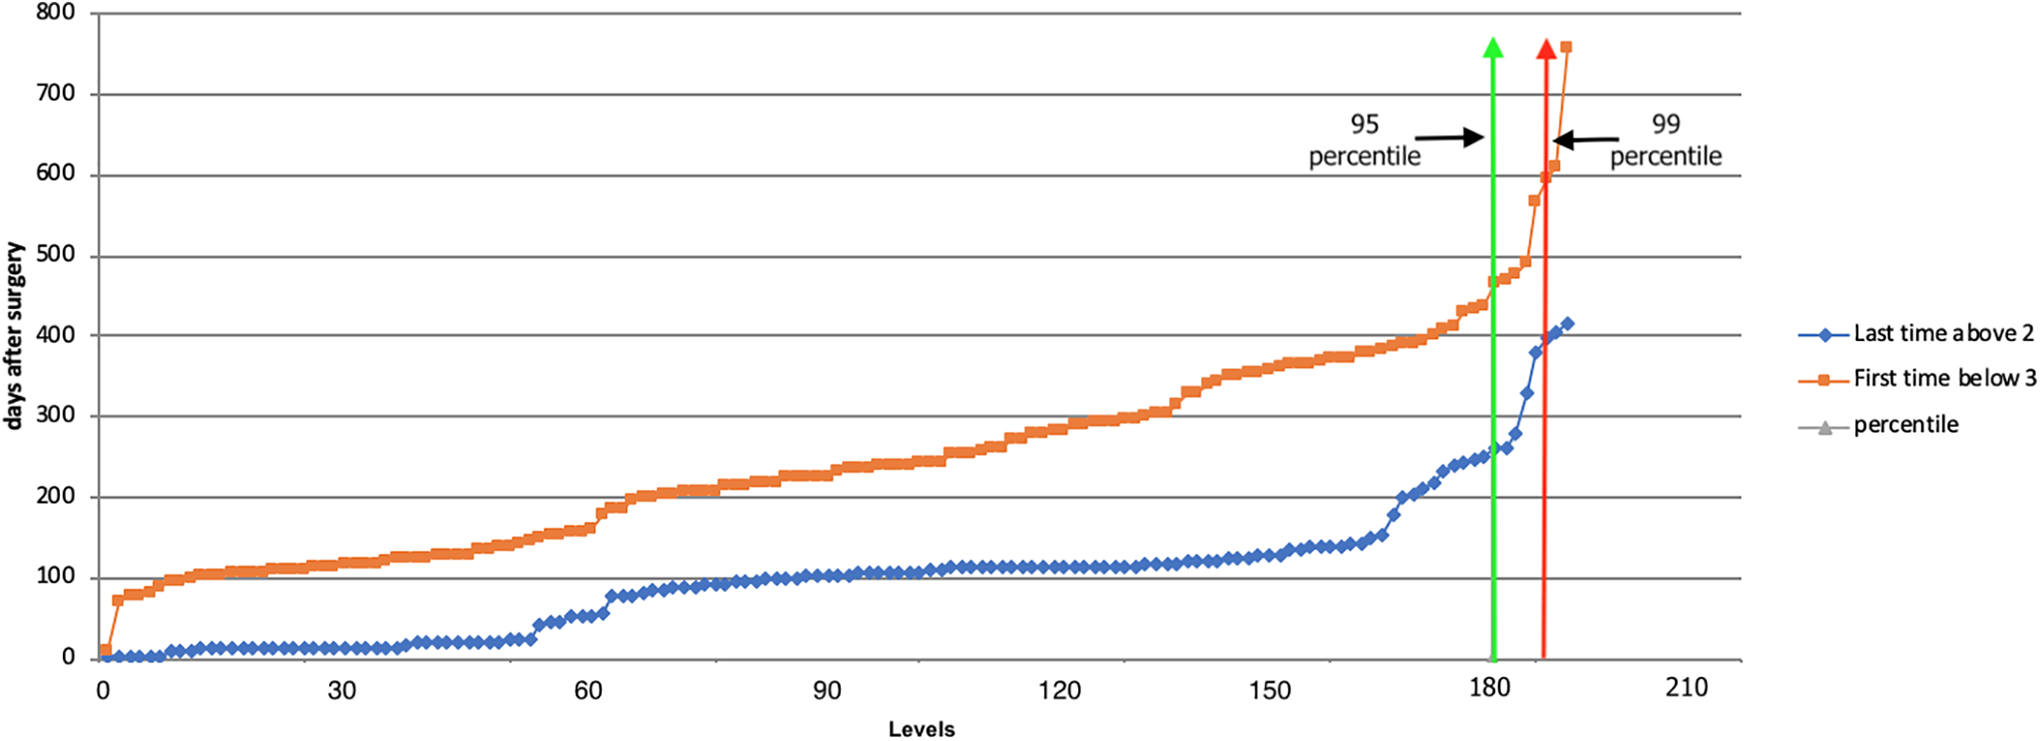
Line graph showing the days post-op after which the operated level reaches fusion state (0, 1 and 2). The levels are selected by applying the 180/365 filter for the follow-up. The green and the red line represent the 95th and 99th centile of the patients reaching fusion. The orange line represents group (2) = the first time when patients reached fusion state. The blue line depicts group (1) = the last time a patient was not fused. The maximum interval between the 2 lines is 365 days.
Statistical Analysis
Statistical analysis was performed using SPSS statistics (v 19). Descriptive statistics including mean, median and standard deviation of the results were calculated. ANOVA was used in the comparison between the different diagnosis for fusion rates. Chi squared test was used in the comparison between the levels (thoracic and thoracolumbar), type of graft (cortical vs cage) and sex for fusion rates. Fleiss and weighted kappa analyses were performed for inter and intra observer agreements. A post-hoc power analysis was performed to determine the threshold grade for fusion. Statistical results at P < 0.05 were considered significant.
Results
In total, 313 levels of 238 patients with a mean follow-up of 1991 days (180 days to 7830 days) were analyzed according to a newly developed algorithm for assessing bony fusion (Tables 1–4). Altogether, 1696 follow-up radiographs were studied with an average of 5.4 follow-ups (2-18) for every level. We examined levels belonging to 173 males and 140 females who had an average age at the time of surgery of 48.8 ± 16.57 years. Thoracic vertebrae 2 to 10 contained the operated area in 116 levels, thoraco-lumbar (D10-L2) in 195 levels and L2-L3 in 2 levels. Seventy follow-up radiographs (4.13%) were non-gradable and excluded from the study; 32 were from the ankylosing spondylitis group. The fleiss kappa coefficient for the inter-rater agreement was 0.91 ± 0.04 while the weighted kappa coefficient for the intra-rater agreement ranged from 0.8 ± 0.05 to 0.93 ± 0.04. The number of levels at each specific point in the postoperative follow-up period for all the levels and the patients fulfilling the 180/365 filter rule is shown in Figure 4.
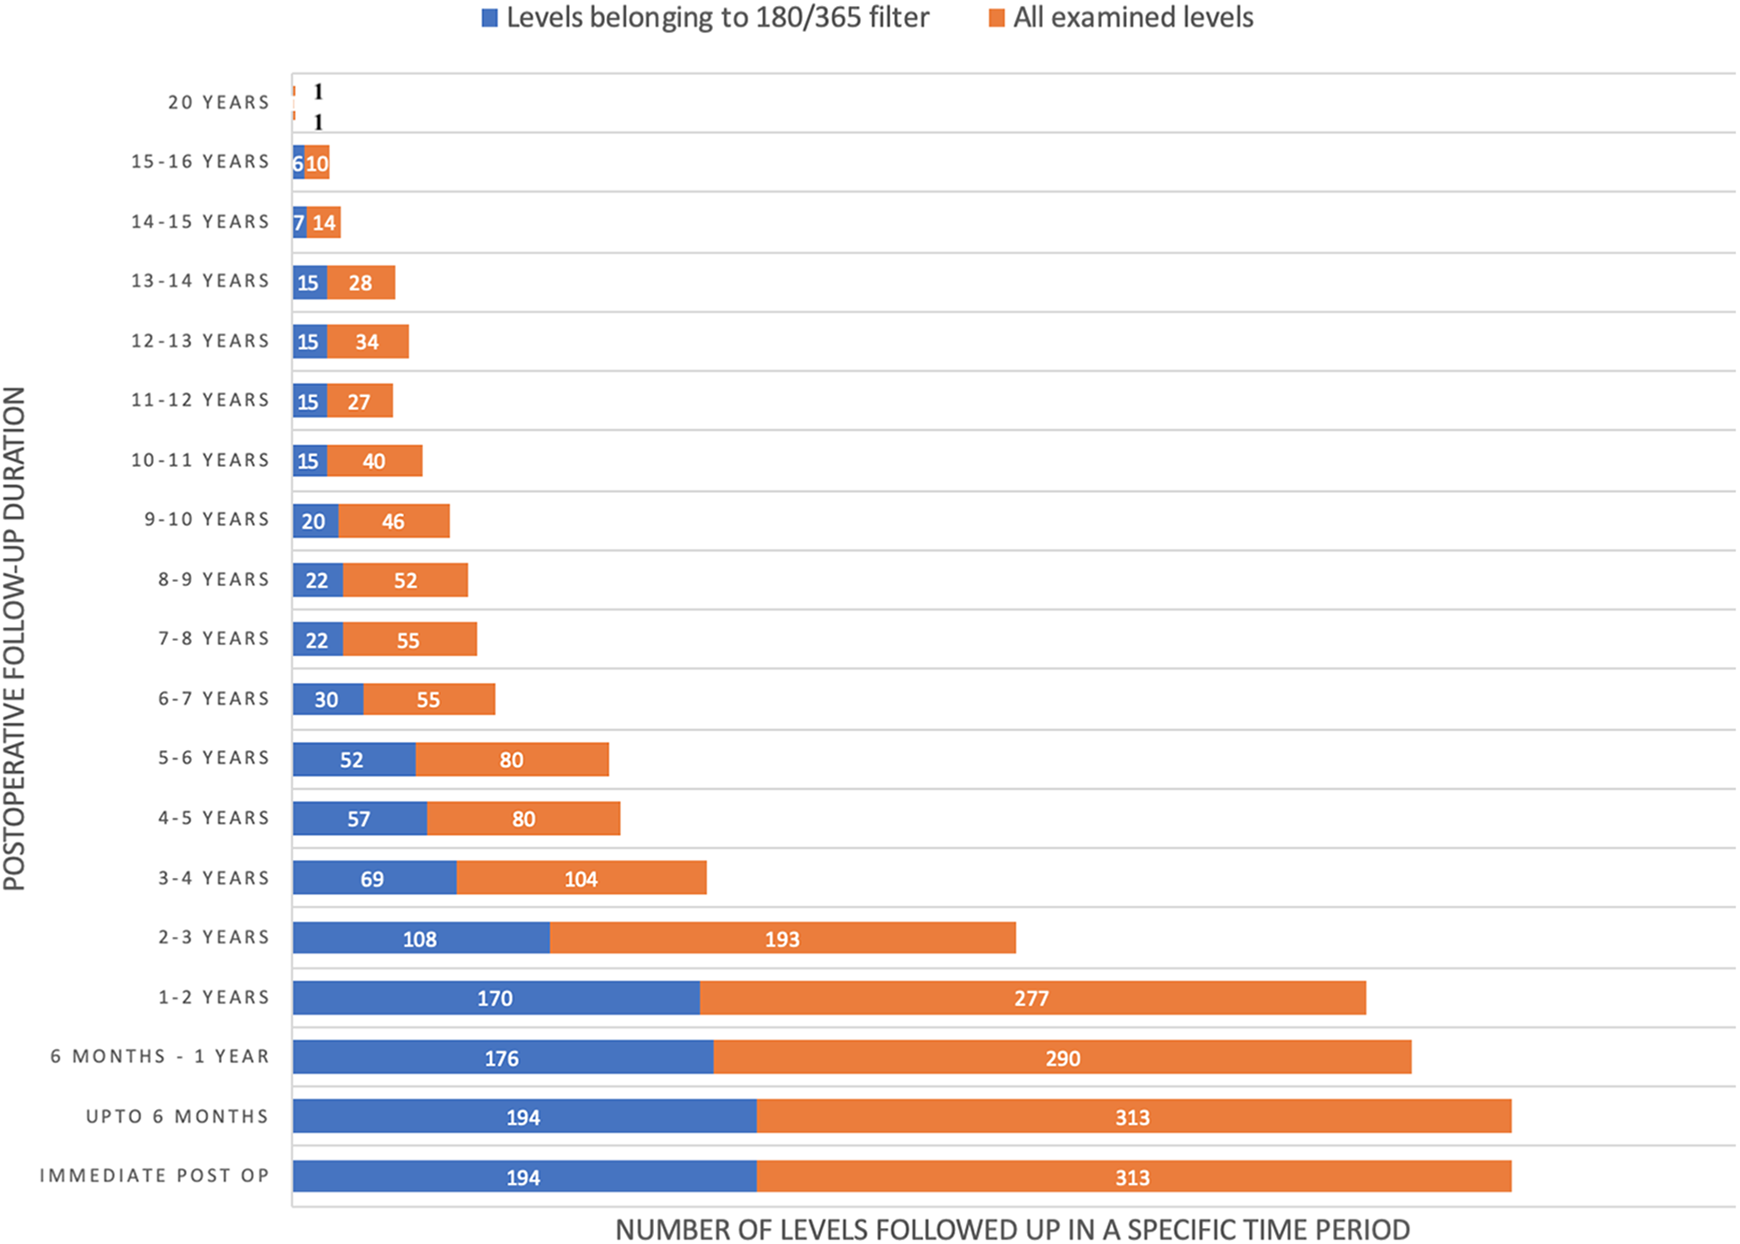
The number of levels (all examined levels and those examined using the 180/365 filter rule) that were analyzed at specific a time in the postoperative follow-up period.
Grades of Fusion on Standard Lateral X-Rays.
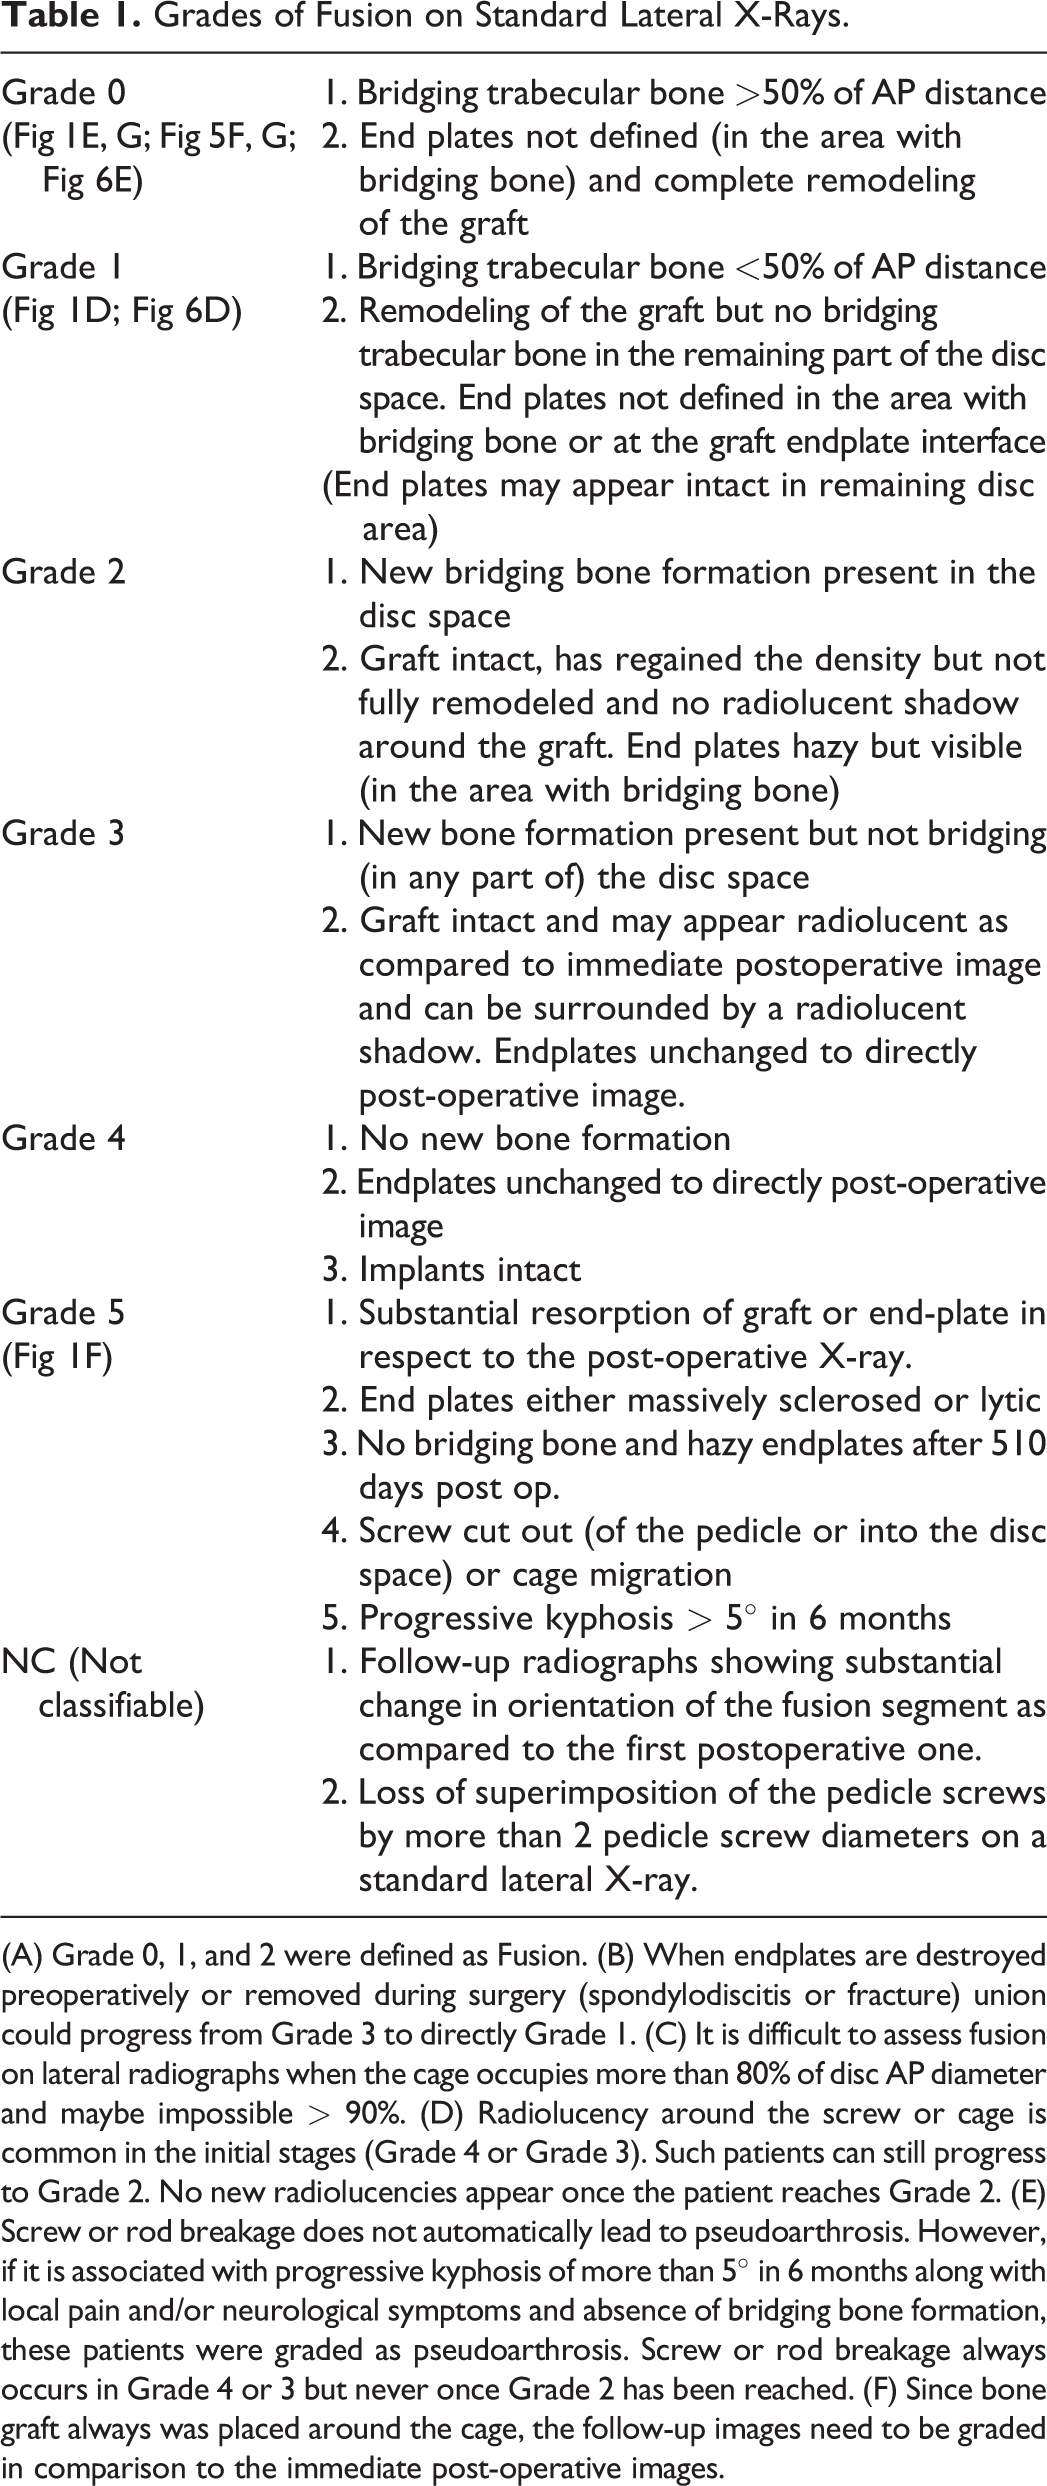
(A) Grade 0, 1, and 2 were defined as Fusion. (B) When endplates are destroyed preoperatively or removed during surgery (spondylodiscitis or fracture) union could progress from Grade 3 to directly Grade 1. (C) It is difficult to assess fusion on lateral radiographs when the cage occupies more than 80% of disc AP diameter and maybe impossible > 90%. (D) Radiolucency around the screw or cage is common in the initial stages (Grade 4 or Grade 3). Such patients can still progress to Grade 2. No new radiolucencies appear once the patient reaches Grade 2. (E) Screw or rod breakage does not automatically lead to pseudoarthrosis. However, if it is associated with progressive kyphosis of more than 5° in 6 months along with local pain and/or neurological symptoms and absence of bridging bone formation, these patients were graded as pseudoarthrosis. Screw or rod breakage always occurs in Grade 4 or 3 but never once Grade 2 has been reached. (F) Since bone graft always was placed around the cage, the follow-up images need to be graded in comparison to the immediate post-operative images.
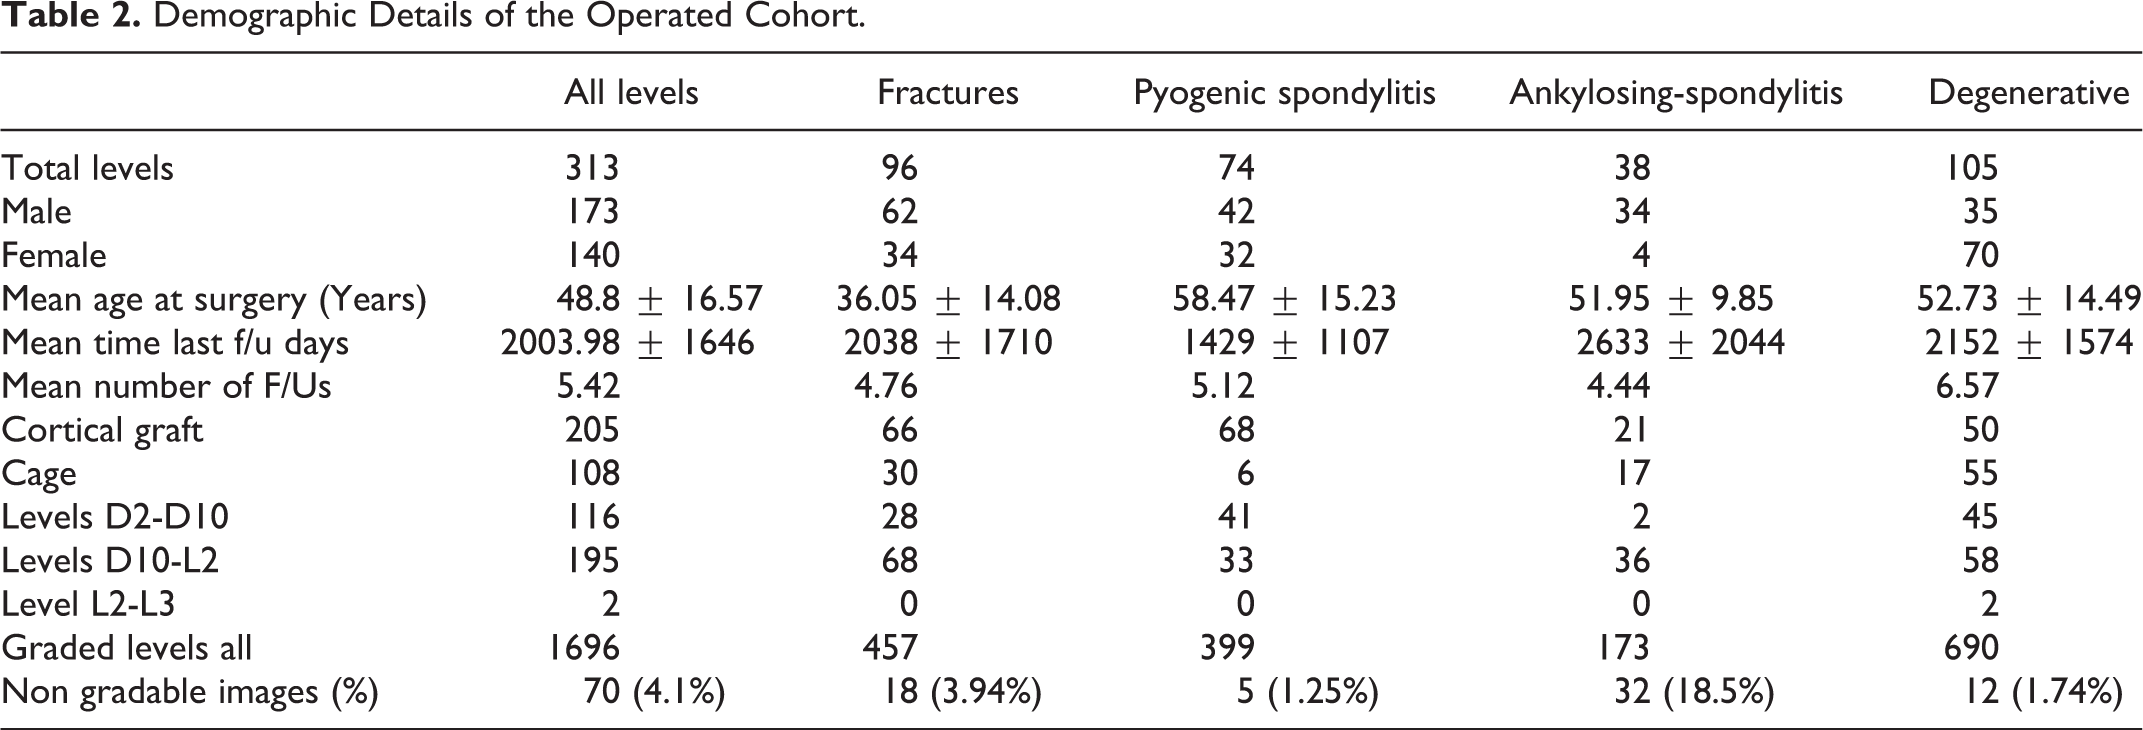
Demographic Details of the Operated Cohort.
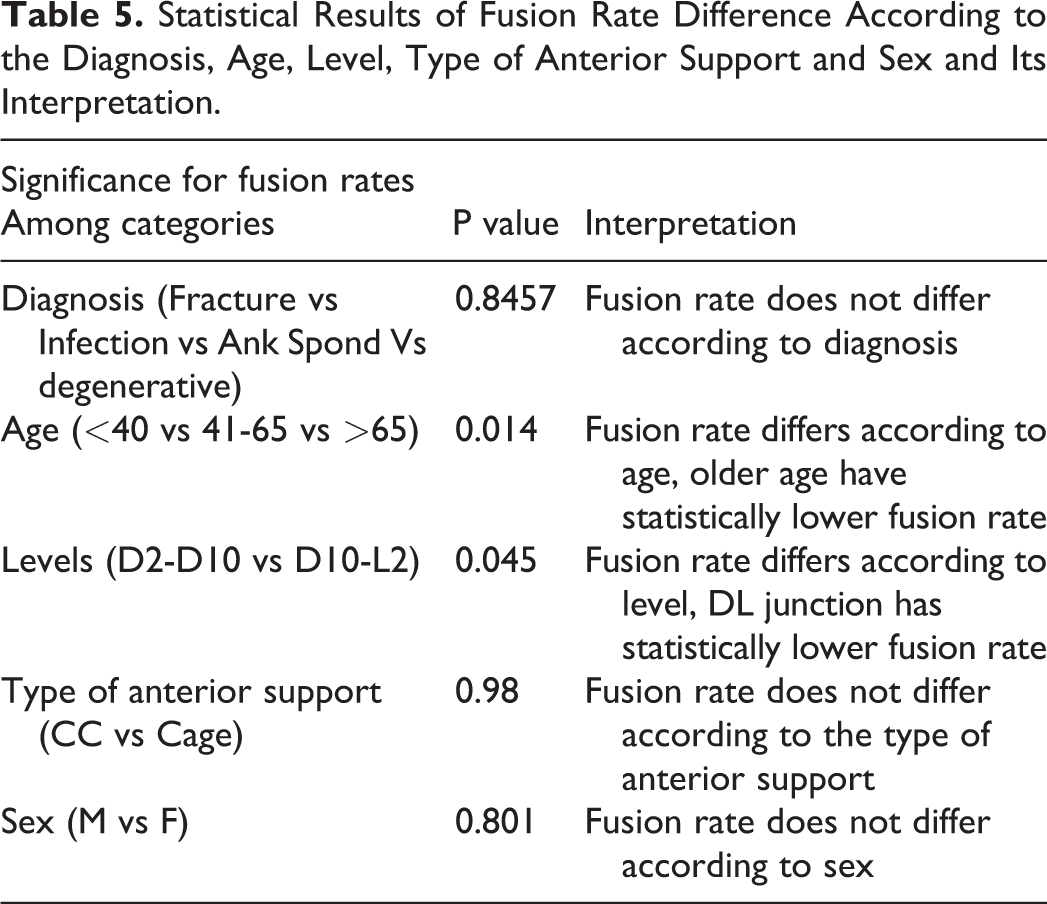
Since none of the patients deteriorated after reaching grade 2, this suggests that fusion process at this stage is irreversible. There were 7 levels that broke this rule and showed a temporary setback of one grade [Grade 2 to Grade 3 (3), Grade 1 to Grade 2 (2) and Grade 0 to Grade 1 (2)] in the successive follow-up radiographs (Table 1). However, all of these levels subsequently reached Grade 0 at final follow-up. We therefore defined Grade 2 as the earliest radiologically identifiable point of fusion. Bony fusion (Grade 0, 1 and 2) was achieved in 88.81% of cases (Figure 5) (Figure 6). Overall, ankylosing spondylitis had the lowest fusion rate of 84.2% and pyogenic spondylitis had the highest fusion rate of 90.5% (Figure 7). This difference in fusion rate, however, did not reach statistical significance (p = 0.8457). Lower fusion rates were seen in the junctional area (D10-L2), amounting to only 85.64% as compared to 93.96% in the thoracic spine (D2-D10) reaching statistical significance (p = 0.045). Old age group (>65 years) had a lower fusion rate in contrast to the younger age group (<40 years): 79.24% and 96.5% respectively (p = 0.014). The type of anterior support (p = 0.98) and sex (p = 0.801) of the patient did not have an effect on the fusion rate (Table 5).
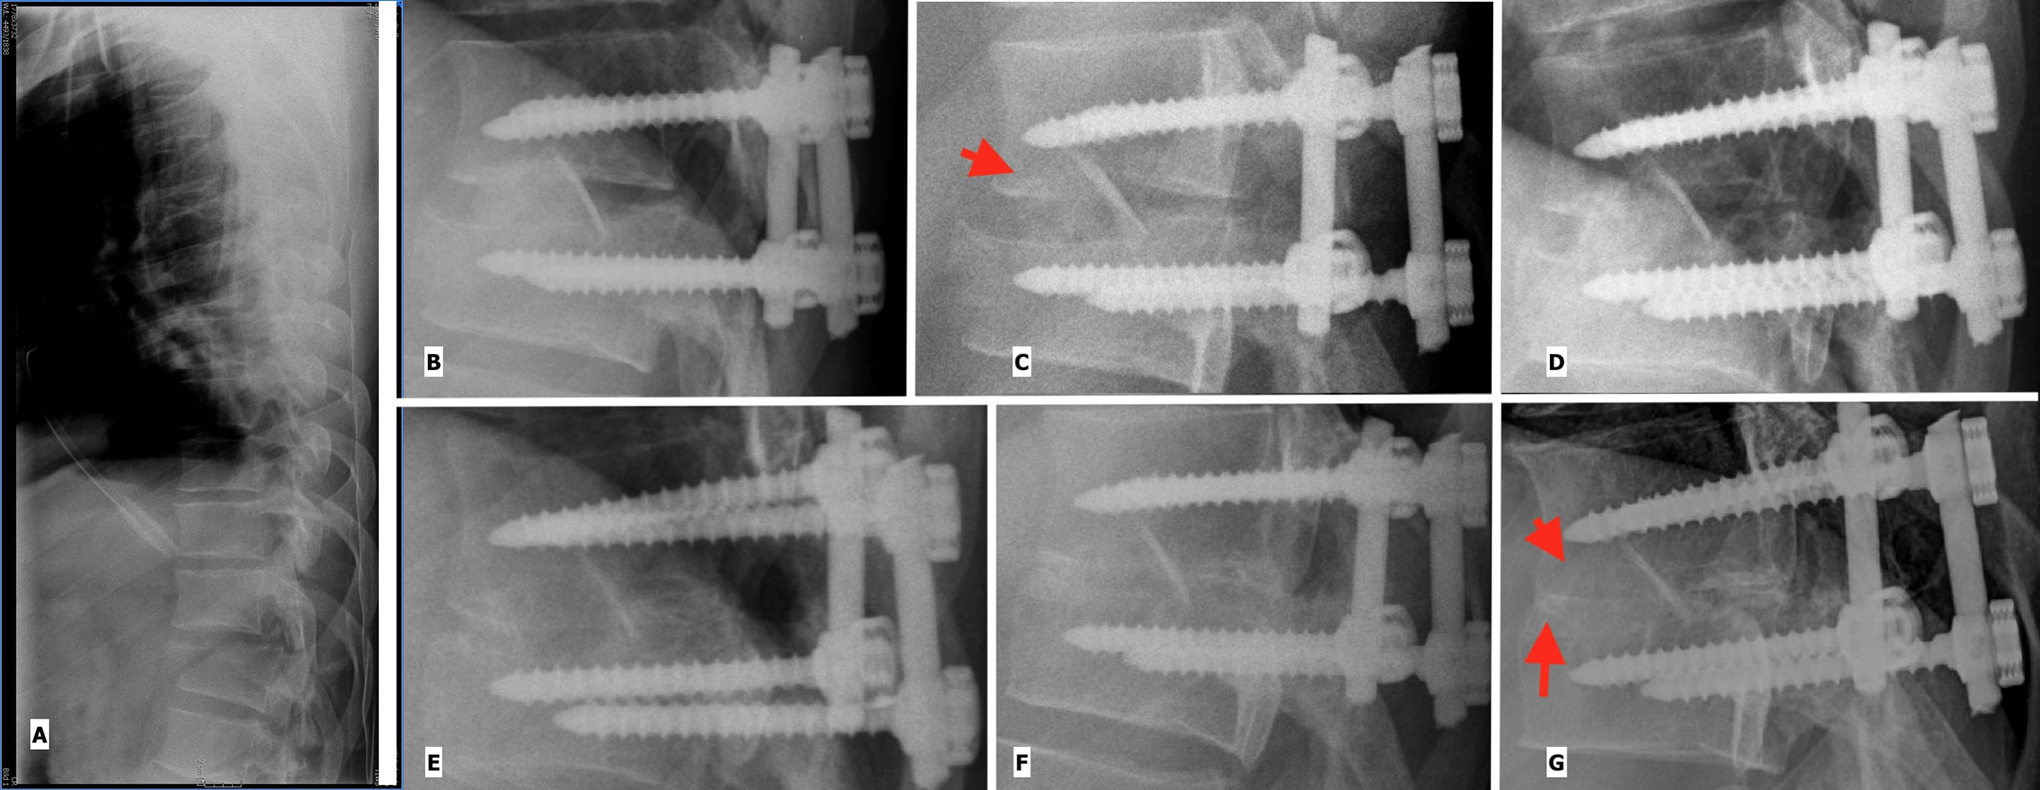
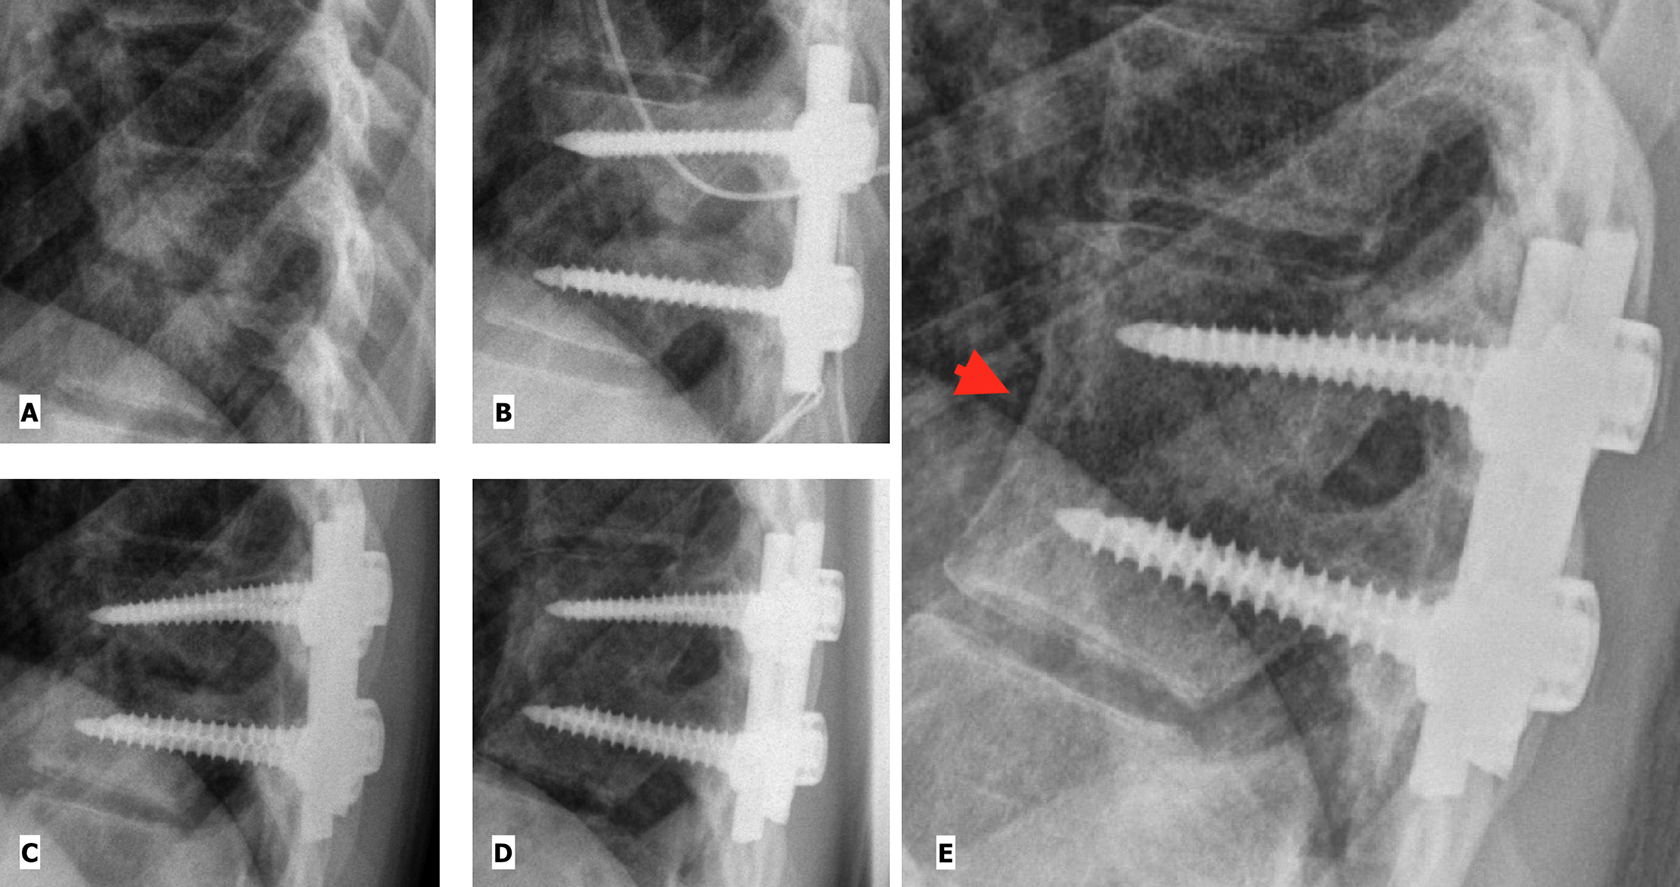
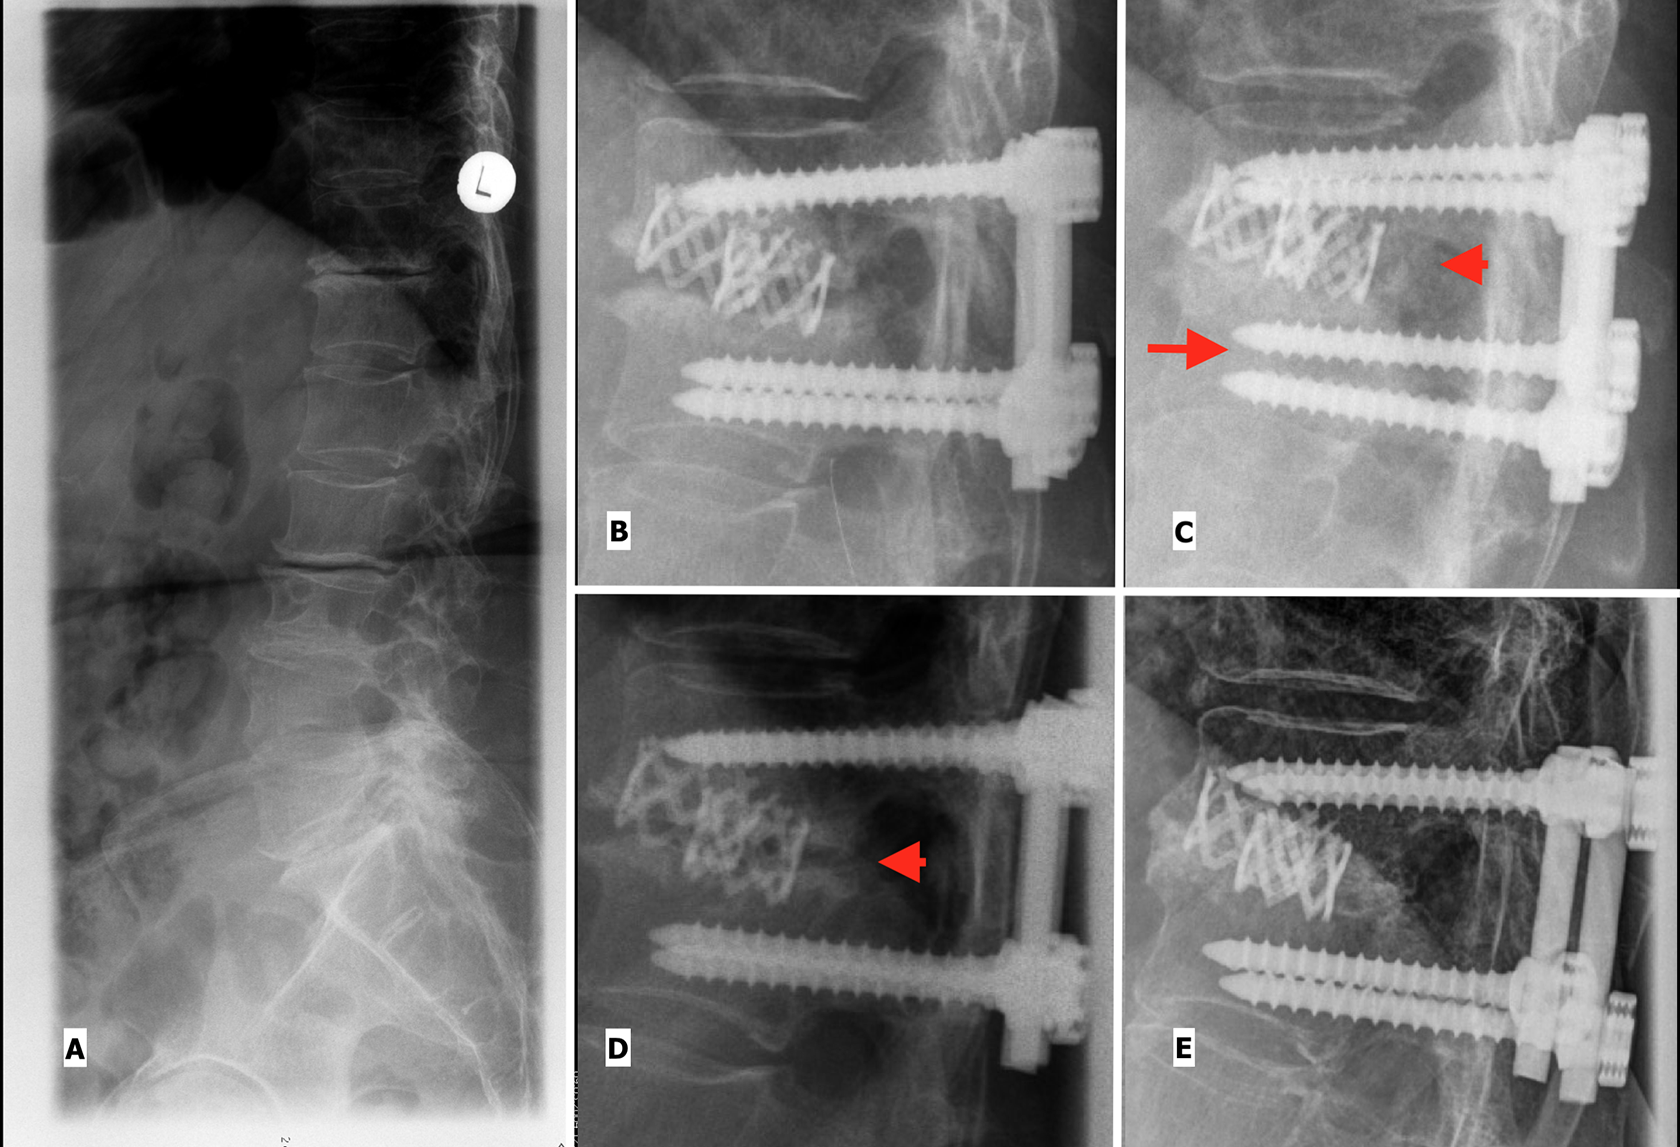
Example for structural graft: Fracture of D12 vertebra in a 26 year old male who was stabilized by thoracoscopically assisted interbody fusion with a cortico-cancellous graft and segmental pedicle screw For Peer Review fixation. (A): Pre-op (B): Immediate Post-op, Grade 4. (C): 2 months postoperatively, Grade 3 (arrow head showing radiolucency of the graft) (D): At 5 months Grade 2 is reached. (E): At 33 months Grade 1 and (F): 52 months after surgery Grade 0 is achieved. (G) Depicts Grade 0 in a long-term follow-up after 175 months: (arrow head showing complete remodeling of the graft and arrow showing disappearance of the end plates).
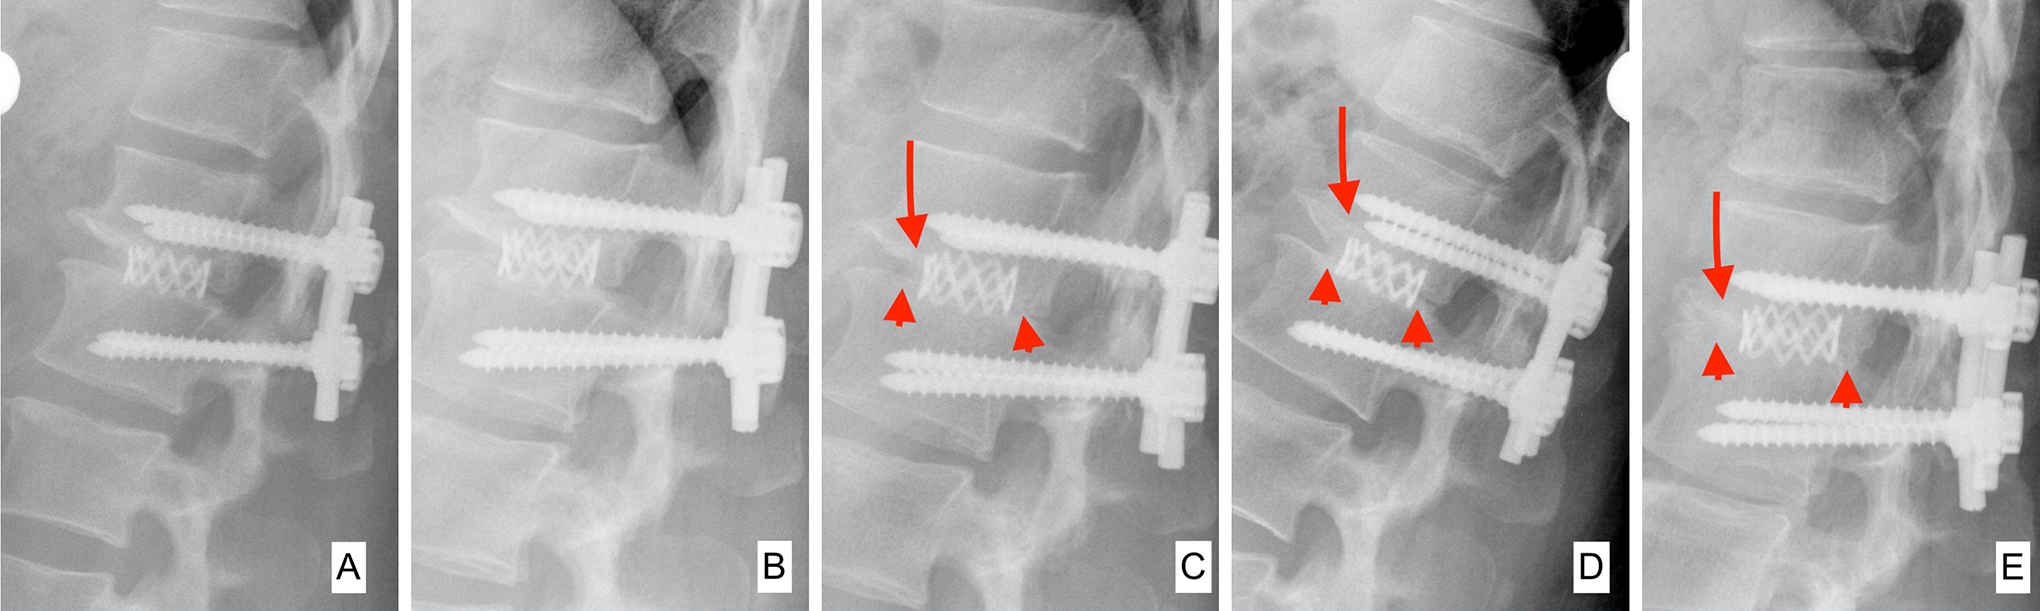
Example for cage-assisted fusion: Degenerative stenosis of D11-D12 with myelopathy in a 48 year old female for whom thoracoscopically assisted decompression and interbody fusion with a mesh cage filled and surrounded by cancellous graft and segmental pedicle screw fixation was done. (A): Immediate post-op, thus Grade 4; (B) at 2 months Grade 3 is present; (C): by 9 months Grade 2 is reached. (D): After 14 months, Grade 1 and (E): after 133 months the interbody fusion has ripened to Grade 0. The arrow heads show bridging bone; the arrows depict disappearance of the end plates.
Spondylodiscitis of D9-D10 in a 18 year old female. Thoracoscope assisted anterior debridement and posterior pedicle screw fixation was performed. (A) Pre-op (B) Immediate Post-op, Grade 4 (C) At 4 Month, Grade 3, (D) At 41 months, Grade 0 (E): At 132 months, Grade 0 showing remodeling of the fusion mass with development of anterior cortical border (arrow head).
Final Fusion Grade, Traffic Color Coding for Grade 3 Levels at Final Follow-Up and Reoperation Rate According to the Diagnosis.
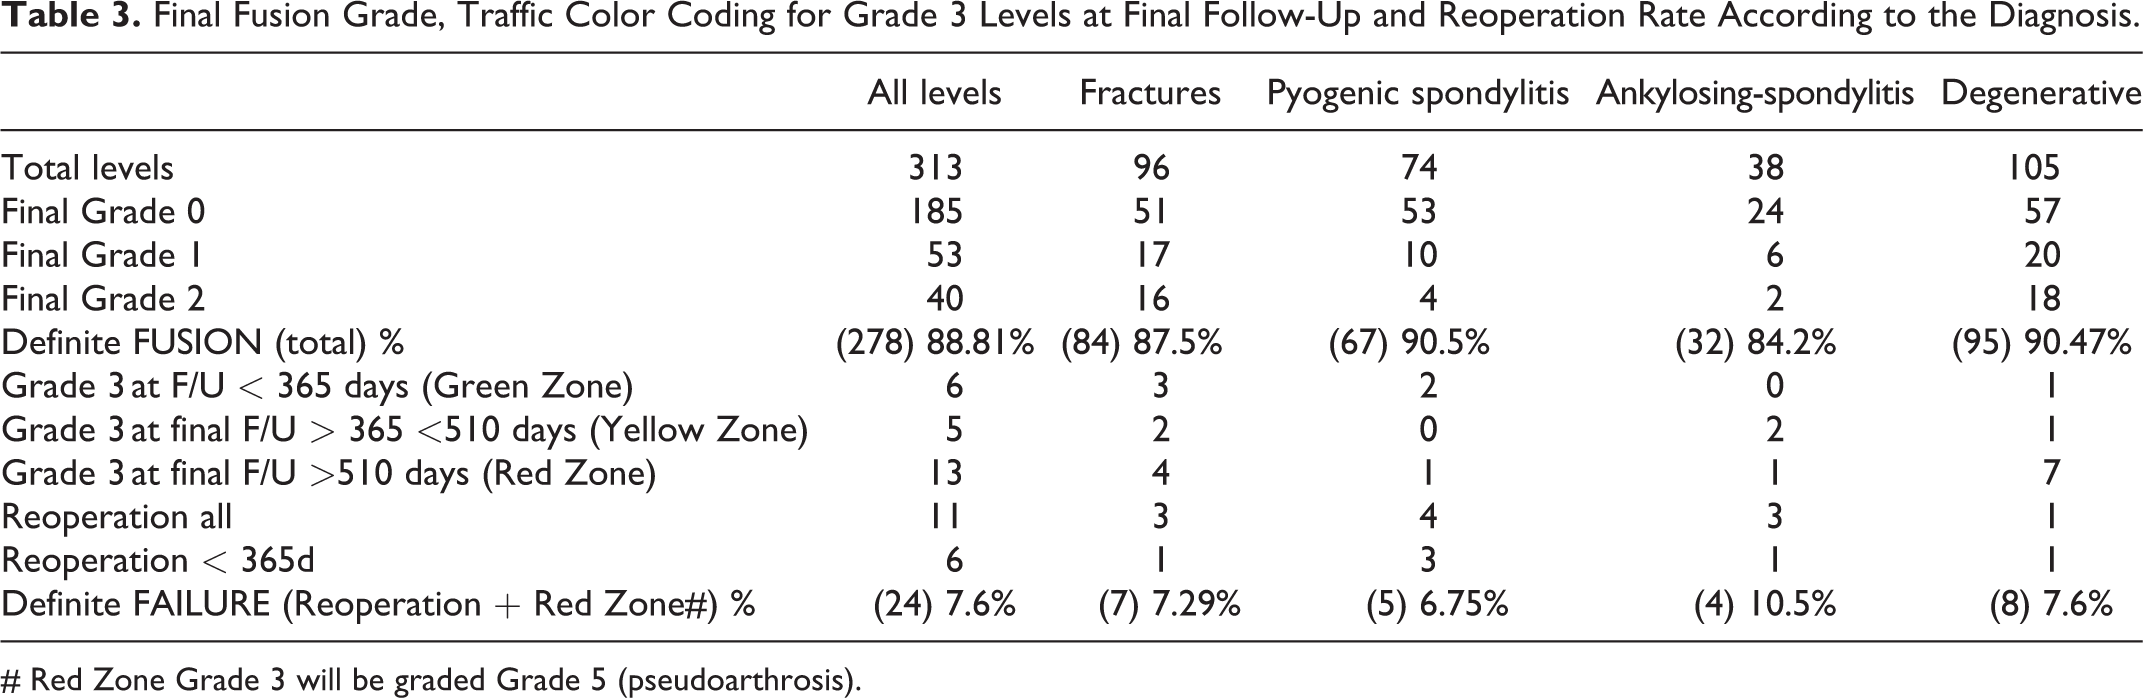
# Red Zone Grade 3 will be graded Grade 5 (pseudoarthrosis).
Analyzing the average of the last data point not fused and first data point fused, the top 50% of cases fused in 232 days (reaching Grade 0, 1 or 2). Around one third (the top 31.8%), half and 3/4th of the levels fused in 180 days, 232 days and 365 days post-operative, respectively. Pyogenic spondylitis had the highest percentage of patients that fused in 6 months (42.85%) and 1 year (83.67%). Fractures had a fusion rate of 76.4% at 1 year. The degenerative patients had a low rate of fusion (only 19.56%) in the first 6 months, but it increased drastically in the next 6 months to reach 78.26% at the end of 1-year follow-up. Figure 8 shows median time periods for each fusion grade (180/365 rule) (Table 1):
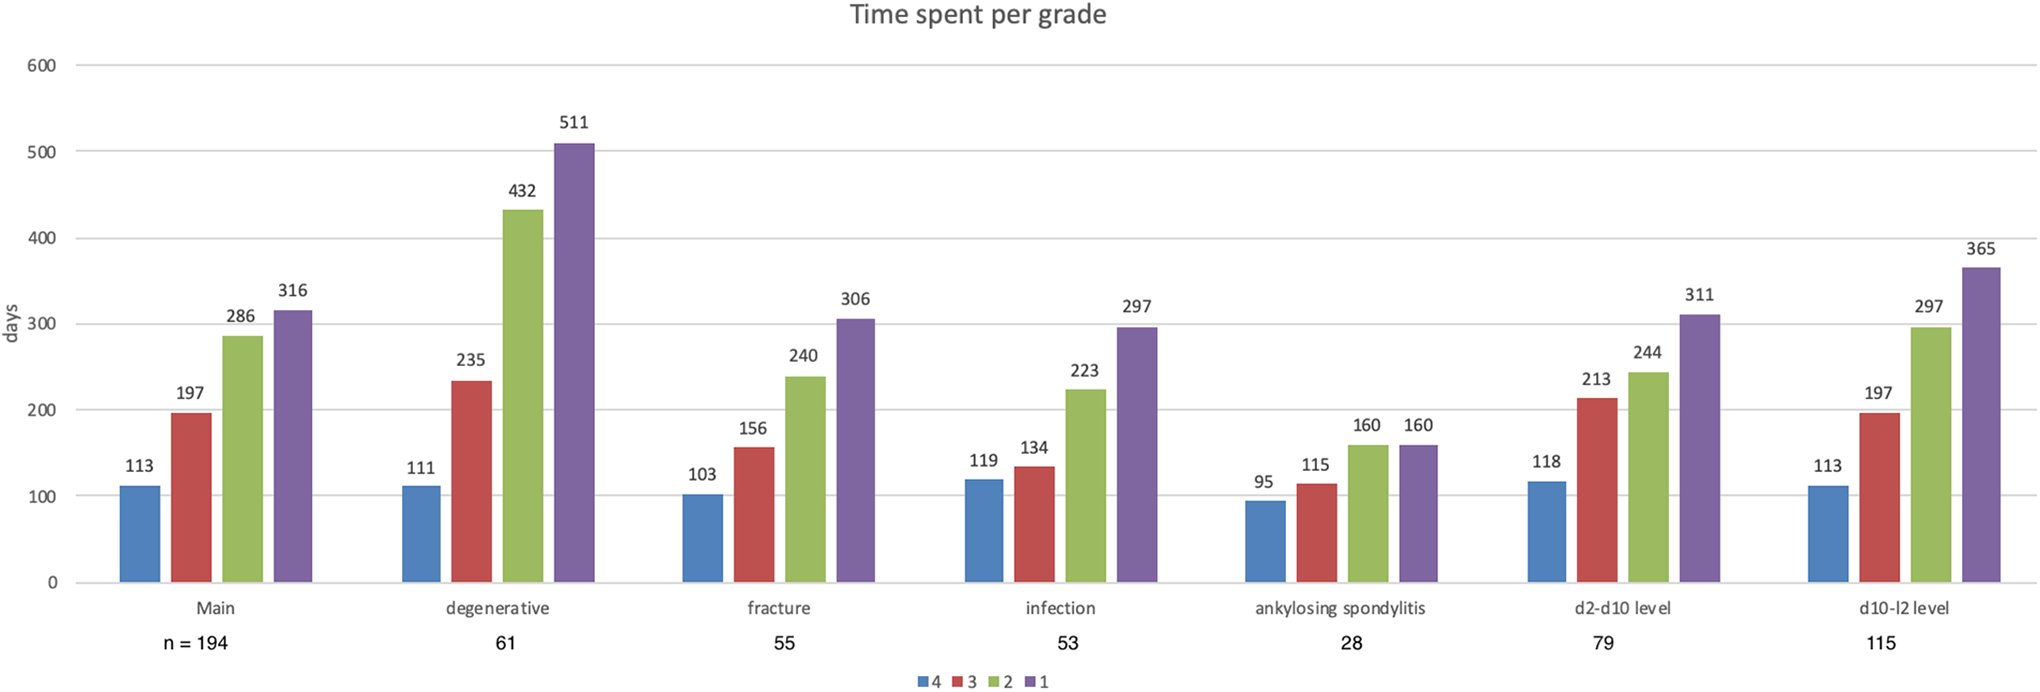
Median time spent per grade according to diagnosis.
On average, Grade 4 persisted for 113 days until signs of (partial) graft resorption or new bone formation (the criteria of Grade 3) were detectable. This period did not differ much across the subgroups of different pathologies (95-119 days). Regarding the period in Grade 3, the entire cohort required 197 days; this was prolonged to 235 days in degenerative and 156 days in fracture cases while shortened to 134 days in pyogenic and 115 days in ankylosing spondylitis. Grade 2 lasted for 286 days (for subgroups refer to graph 2). For grade 1 the whole sample required 316 days; this was again prolonged to 511 days in degenerative while for fracture cases and pyogenic cases it was 306 days and 297 days, respectively. The ankylosing spondylitis group spent 160 days in Grade 1. Reasons for such a stark difference in the days spent per grade in the ankylosing spondylitis group as compared to others could be due to small sample size (28) and large number of unclassifiable images (Table 4).
Final Fusion State According to Diagnosis and Breakdown of the Time to Reach Fusion State.
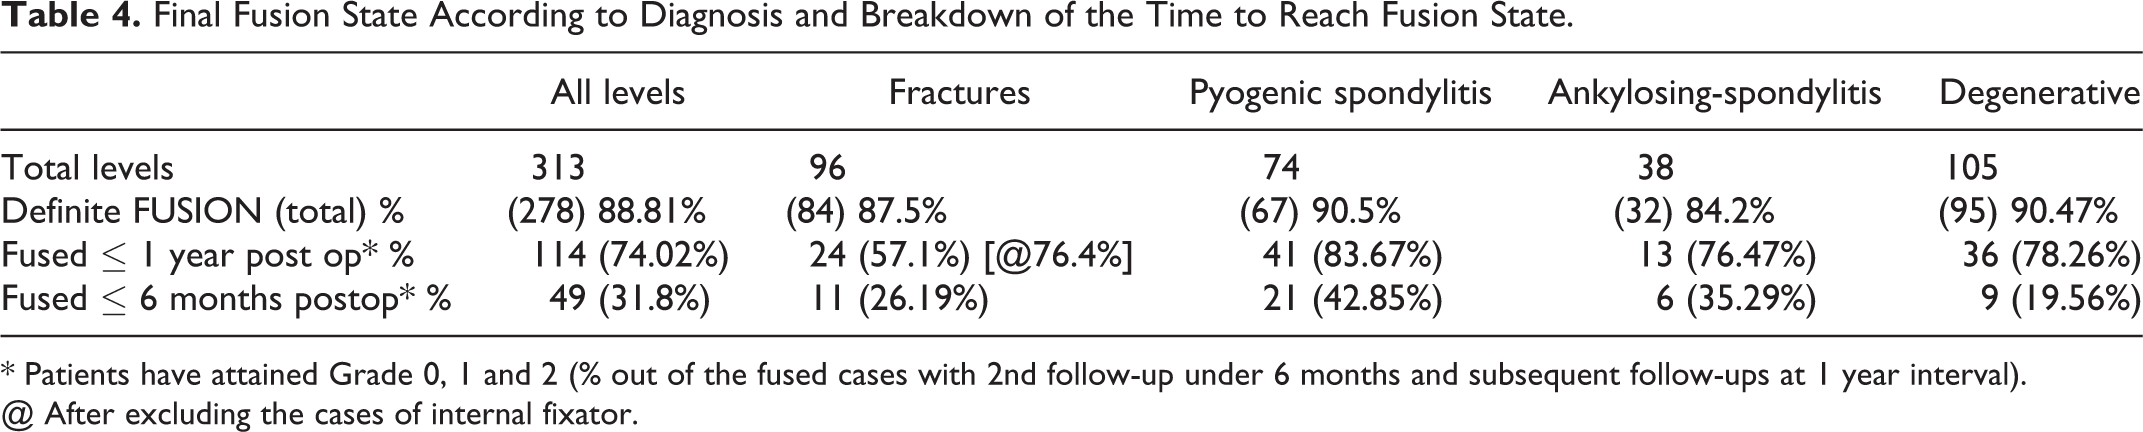
* Patients have attained Grade 0, 1 and 2 (% out of the fused cases with 2nd follow-up under 6 months and subsequent follow-ups at 1 year interval).
@ After excluding the cases of internal fixator.
Statistical Results of Fusion Rate Difference According to the Diagnosis, Age, Level, Type of Anterior Support and Sex and Its Interpretation.
The 95th and 99th Percentile of Last Data Point (number of days post-surgery) Not Fused (Grade 3,4) and First Data Point (number of days post-surgery) Fused (Grade 2,1 and 0) in Levels With 2nd Follow-Up with in 180 Days and Subsequent Follow-Up Interval of Less Than 1 Year According to the Diagnosis and Operated Anatomical Levels (total sample size 194 levels).
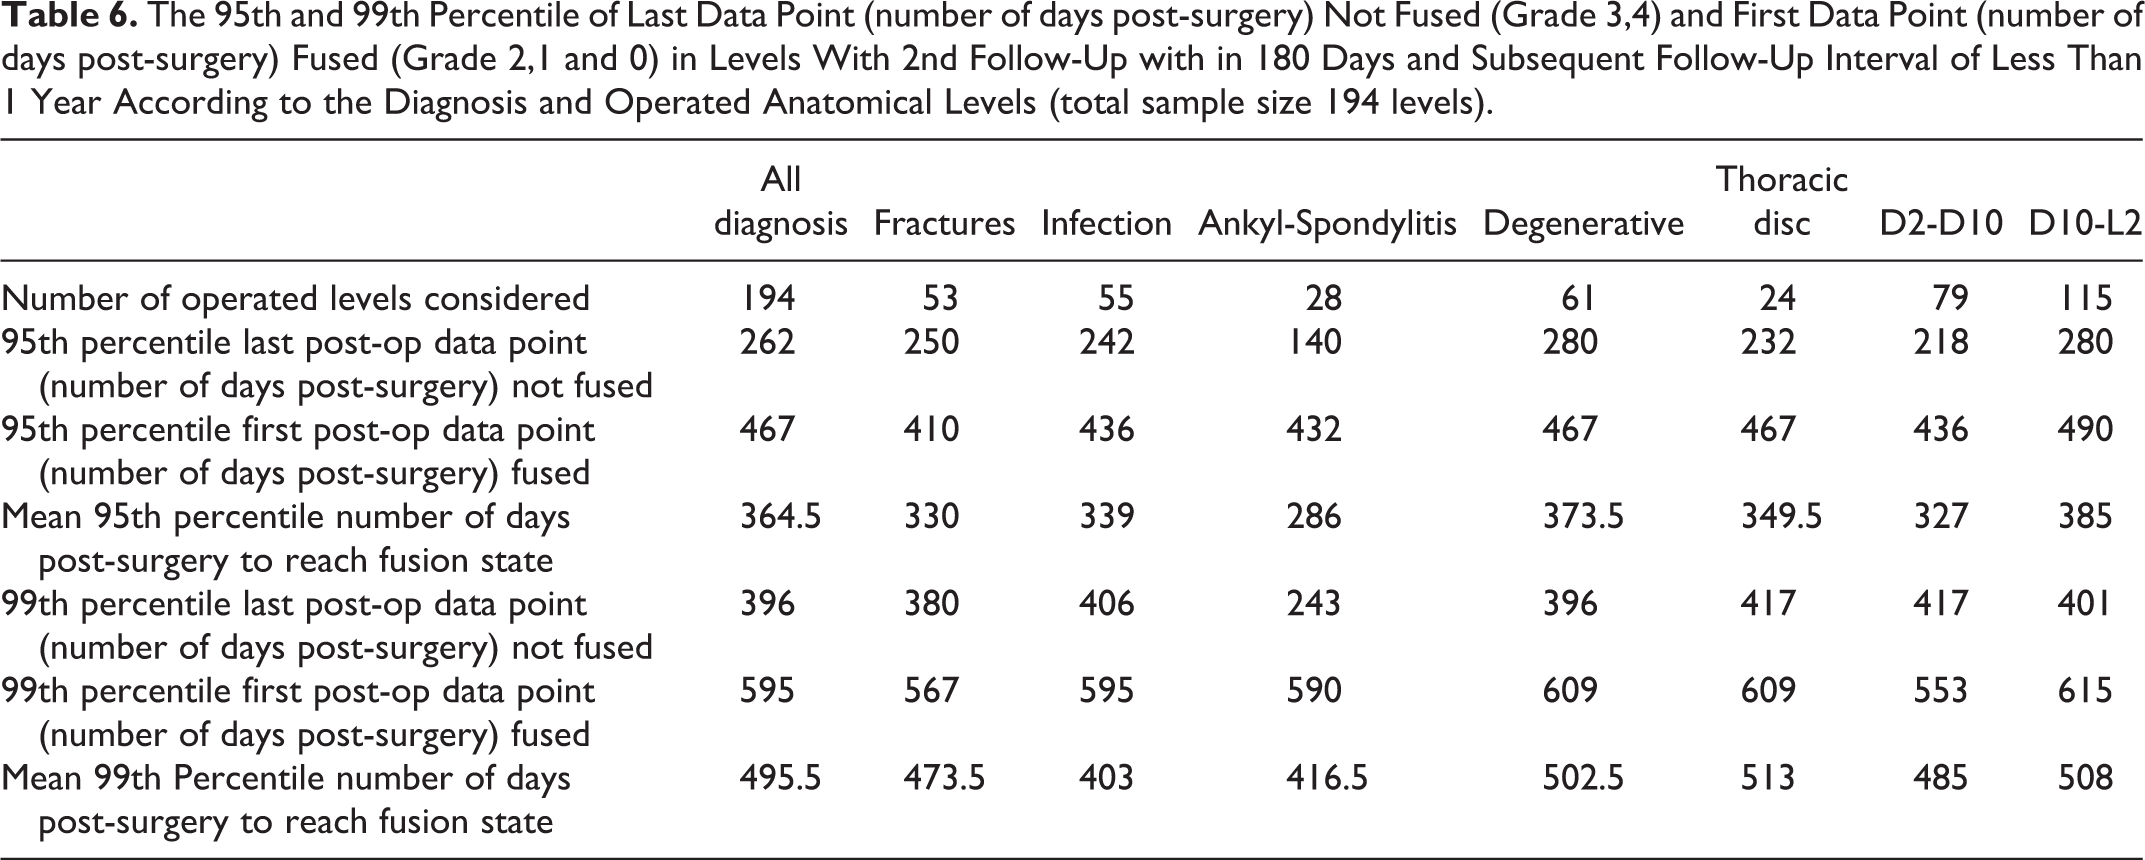
The 95th percentile for fusion of cases of all the diagnoses except for ankylosing spondylitis was around the 1-year mark (330 days – 373.5 days) (Table 6). Ankylosing spondylitis had 286 days as the 95th percentile. A reason for this discrepancy could be due to smaller number of cases (28) that met the follow-up criteria as compared to other groups. In analogy to the 95th percentile, the 99th percentile for all the groups was similar: around 500 days; while the ankylosing spondylitis group was at 403 days. Using this data, we divided the post-operative course into 3 zones. The Green Zone (< 95 percentile) is below 365 days in which 95 percent of patients reach at least Grade 2. The Yellow Zone (95 – 99 percentile) is between 365 days and 510 days. The main idea in establishing the Yellow and Red Zones is to provide surgeons with a timeline of progression to fusion state. Therefore, the highest 99th percentile (days post-operative) of all the diagnoses was considered for the Red Zone threshold. If the patient does not reach fusion state (Grade 2, 1 or 0) within 510 days irrespective of the implant status, they could be regarded as potential pseudoarthrosis. Such cases need further in-depth clinical and radiological evaluation and possibly intervention. By extrapolating the 510-day-cut-off to the patients that remained Grade 3 at final follow-up, 13 levels fell in the Red Zone and were regarded as pseudoarthrosis. The 6 levels (3 patients) of the Red Zone that belonged to the degenerative subgroup were proximal levels of a long anterior fusion (>3 fusion levels). It is interesting that these levels did not show any signs of implant loosening even at their final follow-up ranging from 618 to 4143 days. One case of thoracic disc prolapse that belonged to the Red Zone had been exceptionally operated without posterior stabilization (due to history of lumbar infection). All the fracture cases in the Red Zone were stabilized via an internal fixator. The number of patients belonging to these subgroups was too small to draw any meaningful conclusion.
There were 11 patients requiring reoperation (Grade 5) of the anterior fusion area for the following reasons: Implant failure (4), graft failure (2), pseudoarthrosis (3) infection (1) and progressive kyphosis (1). Fracture and spondylitis accounted for 63.63% of the reoperation cases (7/11). Six out of 11 cases failed with-in 1 year post-surgery and required reoperation. Majority of the revisions encompassed the dorso-lumbar junction (90.9%). The reoperation percentage was similar irrespective of the type of anterior support and sex of the patient. 17 levels had implant failures, out of which 4 levels required reoperations. 3/17 levels remained grade 3 at > 510 days (red zone) but had no symptoms. 10/17 levels had implant failure and still progressed to grade 2 and then all of them went on to grade 0. These levels were not operated as the patients had no symptoms related to it. All the 17 implant failures occurred while the patients were in grade 3 (absence of bridging trabecular bone and no endplate changes). We found 23 levels with radiolucent zones around screws/implants, out of which 8 required reoperations, while the remaining 15 progressed to fusion. None of the patients in grade 2 had new onset implant failure or radiolucency’s. We defined failure as patients requiring repeat surgery for pseudoarthrosis (Grade 5) or patients with Grade 3 fusion state after 510 days (Red Zone). There were 24 cases (7.6%) that were regarded as failure. Ankylosing spondylitis had the highest failure rate (10.5%), while infection had the lowest (6.75%).
Discussion
An ideal classification system should be undemanding regarding costs and availability, should be highly reproducible, easily applicable in clinical routines and provide a rapid answer regarding the success of a fusion procedure. In clinical practice, it would already be a step forward if the vast majority of arthrodesis patients could be counselled regarding a safe but quick return to unrestricted physical activities. In this study of prospectively collected patients undergoing anterior thoracic and thoracolumbar fusion, we retrospectively analyzed consecutive series of post-operative standard lateral x-rays and searched for visual discriminators in up to 18 images per patient obtained over a course of up to 20+ years.
How Valid Is Evaluation of Plain X-Rays?
Many authors have attempted to assess fusion status on plain AP and lateral X-rays and have found it to be inadequate. However, the majority of them have evaluated fusion status not in interbody fusion but in cases of posterolateral fusion.1,2,12-15 To the best of our knowledge there are only 4 papers on comparison of radiological (standard X-rays) fusion with surgical exploration.1-4 Discovering mobility in the operated level either surgically or on dynamic films was the main criterion for diagnosis of pseudoarthrosis. The term ‘open exploration’ is often used uncritically: A revision from posterior allows no visual exploration of the interbody fusion mass but only allows direct mechanical testing on interlaminar/interpedicular distraction. A short follow-up (ranging from 16 weeks to 9 months),3,4 lack of posterior tension band instrumentation 16 and extrapolation of posterolateral (PLF) fusion classifications to interbody fusion were few shortcomings of the papers attempting to study bony fusion. Fogel et al 7 presented the only paper in recent times that performed evaluation using specific definition at a longer end follow-up (24 months) in interbody fusion surgeries. They found that standard lateral X-rays and CT scans have equal accuracy for assessing the fusion status when cross-checked with surgical exploration. A few authors have studied lumbar interbody fusion on lateral x-rays and derived proposals of classifications from these investigations.17-24 However, no classification to date has dealt with the bony fusion process to establish the time a fusion segment spends in each grade. Their classifications do not give the surgeon or the patient valuable information about the progression of bony healing.
Unclassifiable Images
Substantial shortcomings of standard Roentgen technique encompass structures attenuating the x-rays (superimposing ribs, scapula, diaphragm), or mal-alignment of beam vs target. Thus 70 images were rendered non-classifiable. Whereas superimposition rarely disabled the grading, non-orthogonal X-ray beam direction, be it rotation or cranio-caudal deviation (Figure 9C), mostly prevented an evaluation. A pragmatic rule would be to relate all relevant images to the first post-operative one and exclude all that in comparison showing substantial change of position. The latter can be easily detected by loss of superimposition of the pedicle screws by more than 2 pedicle screw diameters on a standard lateral X-ray.
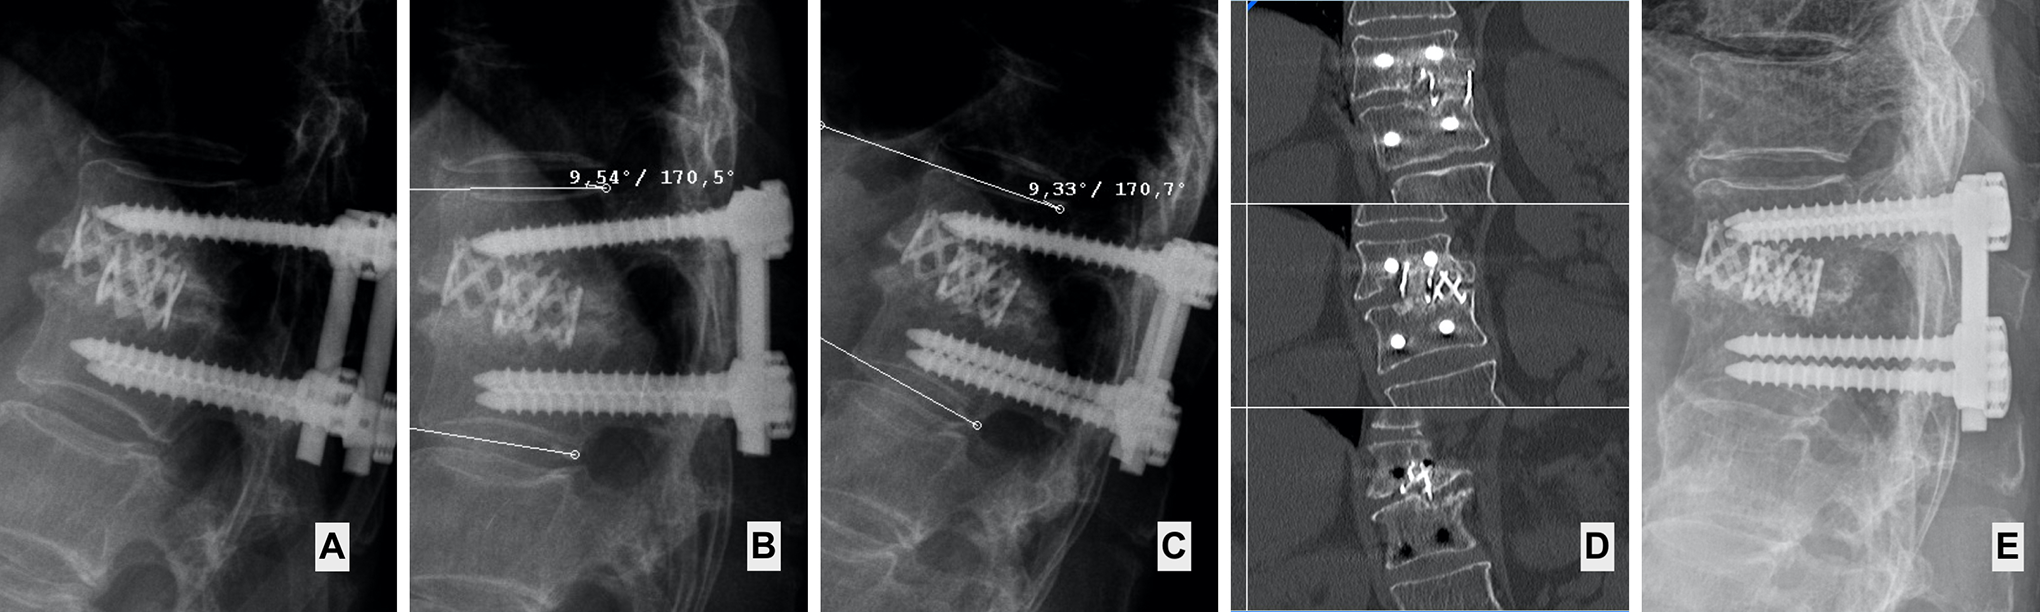
False positives due to x-ray beam projection: Female of 70 years, thoracic disc prolapse operated by thoracoscopically assisted anterior decompression, interbody fusion with Harms cages and segmental pedicle screw fixation. (A) Pre-op (B) Immediate post-op, Grade 4 (C) At 9 months, appears Grade 2 due to orientation of the X-ray beam (arrow head pointing to seemingly bridging bone). However there is malprojection represented by > 2 pedicle-screw-diameters distance between the screws leading to false impression of bridging bone (arrow). (D) At 25 months, Grade 3. The next follow-up image showing absence of bridging bone in the disc space (arrow head showing absence of bridging bone). (E) After 146 months, Grade 0. The final follow-up image shows that inspite of absence of bridging bone for a long time, the patient ultimately fuses.
Filter for Homogenous Data
Since the data points reflect the non-regular pattern of follow-up visits, measures had to be taken to exclude patients with too few or highly irregular visits. As the most appropriate filter we found 180 days to be the maximum time interval for the 2nd post-operative follow-up plus 365 days as the maximum interval between follow-up visits until the final grade was reached for the first time (180/365-filter). Applying this filter regarding the time course, a homogenous group of 230 levels could be established. This subgroup was used for evaluation of median time periods for fusion grades and the transition between non-fusion and fusion. This transition is reflected in the data points: “last time above Grade 2 (Grade 3 and 4)” and “first time below Grade 3” (Grade 2, 1 and 0) where 194 levels that reached fusion grade could be evaluated (Figure 3).
Median Time Spent Per Grade and Its Clinical Significance: (Figure 8)
One might speculate on a higher activity of the osteoclasts and subsequently osteoblasts due to the inflammatory process in pyogenic spondylitis and ankylosing spondylitis patients accounting for lower time spent in Grades 4 and 3. The median time spent per grade in the degenerative case exceeds that of the other subgroups by at least 79 days in Grade 3, 192 days in Grade 2 and 205 days in Grade 1. The subchondral bone of the endplates is the main barrier to healing.25,26 In degenerative levels, sclerotic endplates and reduced blood supply could be one explanation for prolonged healing time. In pyogenic spondylitis, the endplates are often destroyed and this could hasten the fusion rate.
Why Grade 2 Is the Fusion Point? Threshold to Fusion
We have observed that there were no new onset implant failures or radiolucencies around the screw once the grading reached 2. This indicates that after the crucial transition from 3 to 2 is reached, osteogenesis takes a more uniform course and pace. A post-hoc power analysis revealed a power of 96% to support the statement that grade 2 is the threshold point of fusion. 27 A few cases, especially those with spondylitis, progressed directly from Grade 3 to Grade 1. This was not only due to fusion progress but to some extent as well as on the radicality of decortication or damage of the endplate by the pathology treated (fracture or discitis). The strength of this paper lies in the long follow-up of patients as compared to other papers dealing with fusion on radiographs and CT scans. When the patients have followed-up in the long run once they reach Grade 2, they did not fail. For all diagnoses the median time to fusion amounted to 310 days, varying from 210 days in ankylosing spondylitis to 346 days in degenerative cases. To the best of our knowledge there is no research data of anterior fusions in the thoracic or thoracolumbar spine to compare our results. Tuli et al. examined trabecular bridging at either ends of fibular grafts to the anchoring vertebrae after corpectomy in the cervical spine. 28 Thus, neither the biology of this type of bridging nor the grading criteria are comparable to the situation in the thoracic or thoracolumbar spine. It is interesting, however, that they found remarkably shorter median values of 80 to 90 days for trabecular bridging in their setup.
Threshold to Pseudoarthrosis and Clinical Implications of the Traffic Light Zones
Raizman et al 29 defines pseudoarthrosis as no evidence of solid bony union up to 12 months post-surgery. Surprisingly, there are no long-term sequential follow-up studies on time to interbody fusion to verify this data. It is well known that non-union can be asymptomatic.30,31 Reviewing the literature one question definitely arises: Could these patients have been declared as non-union on the basis of the definition at 1 year post-surgery but never followed up to see if they unite subsequently? (Figure 10) Many of these patients are surgically explored at 1 year follow-up and branded as pseudoarthrosis. Among the 278 levels that fused in this series, 44 patients (15.5%) were either Grade 3 or 4 at their 1 year follow-up but subsequently went on to fusion (Figure 11). 16.3% of spondylitis cases, 24% of fracture cases and 22% of degenerative levels were not fused at 1 year post-surgery follow-up but subsequently went on to fusion. Around 10% of the levels reached fusion state between 365 and 510 days (Yellow Zone) (Figure 11). Thus, absence of bridging bone at a year’s follow-up without adverse radiological findings of screw/rod breakage in an asymptomatic patient should not be regarded as failed fusion (Figure 10). In such cases, documenting a progress of healing (change of Grade from 4 to 3) gives reassurance to the patient as well as the surgeon. In evaluation of post-operative fusion periods a traffic light color coding of the post-operative course can be of great value in our clinical practice. In this evaluation of fusion periods, only 2 patients exceeded the 99th percentile mark (510 days): the Red Zone (Figure 3) (Table 4). This is practically the time point after which progress to fusion is no longer likely. After 510 days the patients should be informed that the goal of bony fusion may not be reached and they should return for clinical and radiological re-evaluation in advent of new complaints. Many surgeons follow a protocol of CT scan at 6 monthly intervals in asymptomatic patients to determine their fusion status.32,33 Following a traffic light signal, recognizing progress of fusion and signs of loosening on standard lateral radiographs will limit the necessity of CT scanning earlier than 510 days post-surgery (Figure 10). This can cut down the exposure to radiation and cost of treatment dramatically.
False pseudoarthrosis. (A) 36 months follow-up image showing absence of bridging bone (B) and (C): functional X-ray shows absence of significant movement at the operated level and the patient is asymptomatic (D) Coronal CT images showing presence of bridging bone in only one of the many cuts. This proves the utility of CT to help with assessing fusion status in the Red Zone (>510 days) estimates the fusion (arrow head shows bridging bone). (E) 12 years and 6 months follow-up showing solid fusion (Grade 0).
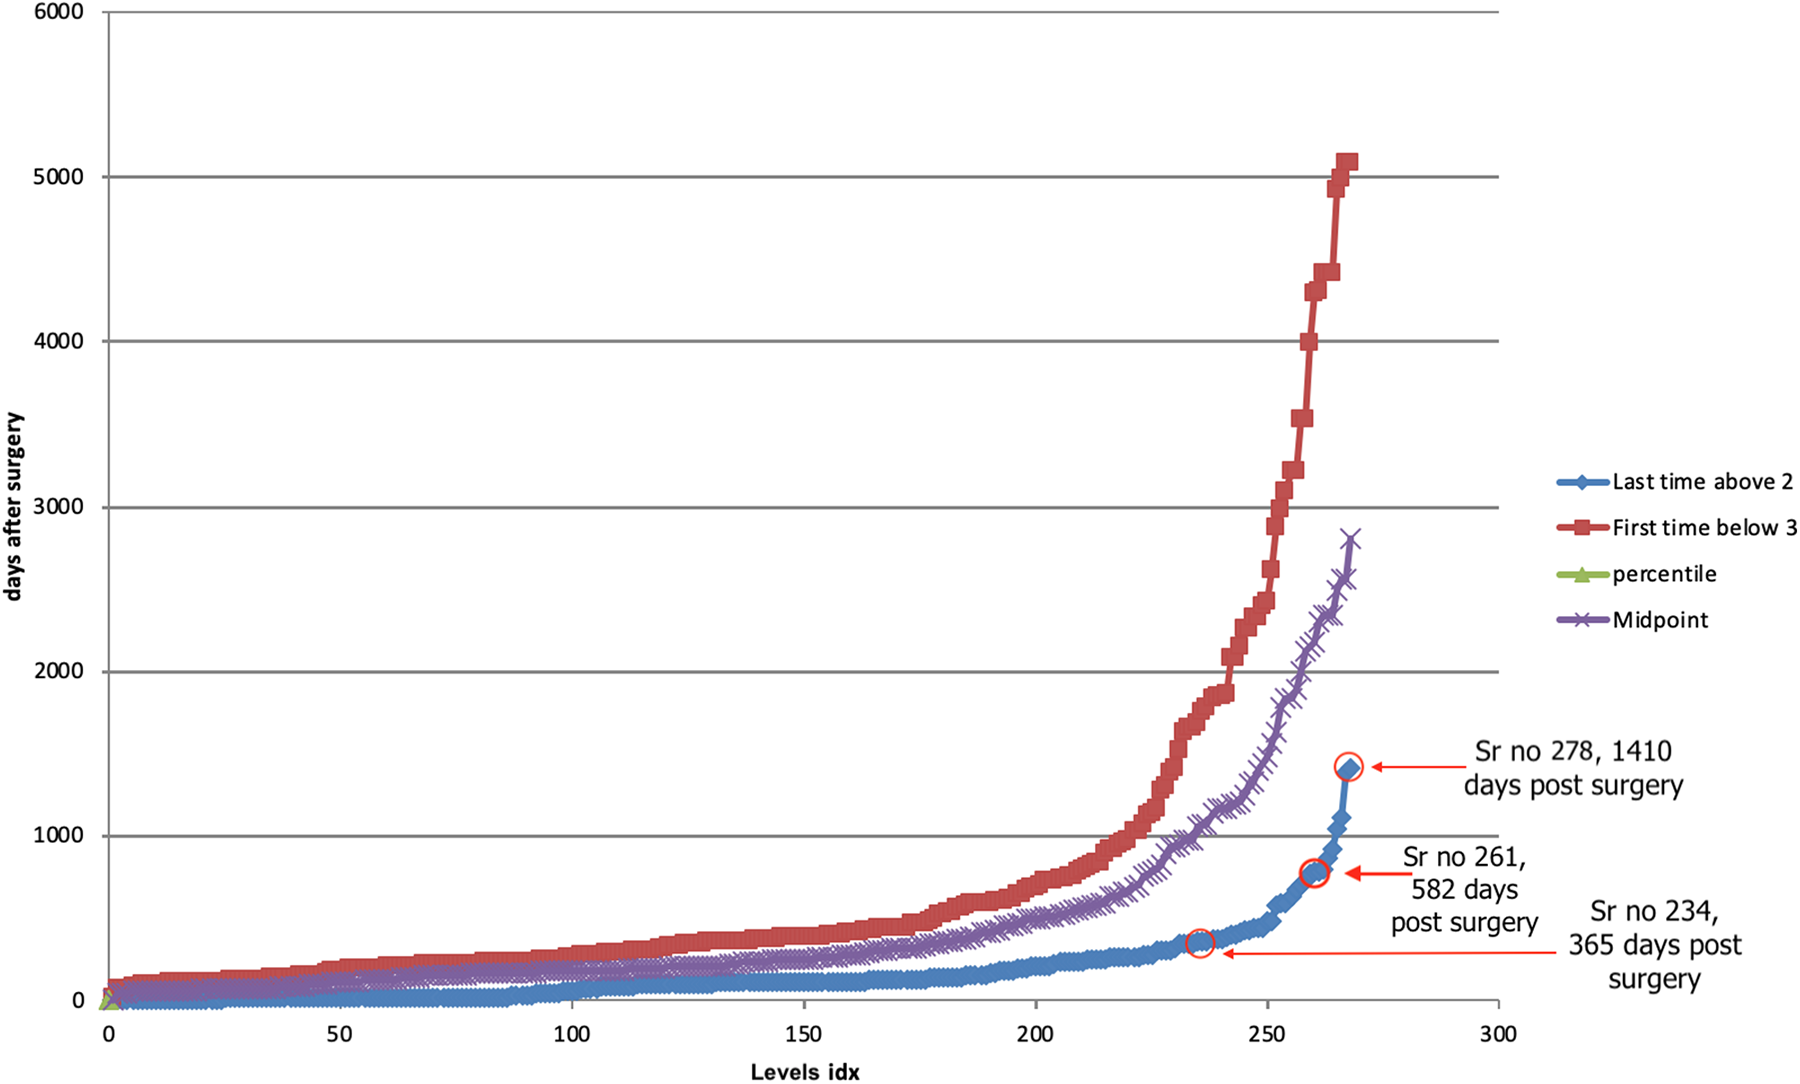
The time plot of all the levels that reached fusion state. The red line shows the follow-up date that first reached fusion state. The blue line represents the last follow-up date of the level that was not fused. The purple line is the plot of the average of first follow-up date fused and last follow-up date not fused. 44 levels were not fused at 1 year or more post-surgery but ultimately reached fusion. 17 levels fused even after showing no signs of fusion at 510 days post-surgery.
Findings on Lateral Radiographs That May Indicate Failure
Radiolucent zones around screws or implants can be the first indicators of pseudoarthrosis. However, they may as well represent an intermediate status en route to fusion. Similar to the findings of Kanemura et al 34 where two-thirds of seemingly pseudoarthrotic levels eventually fused, 15 of 23 levels with initial radiolucencies around the implants or cages subsequently fused. In the current study radiolucencies appeared when the levels were either in Grade 3 or 4. No new zone of radiolucency appeared once Grade 2 was reached and the earlier radiolucent zones would eventually fade out. Progressive zone of radiolucency, implant breakage and sclerotic zones covering the fusion bed were the main indication for reoperations. Since 6 of 11 patients were re-operated within 1 year post-surgery, the radiographs should be scrutinized for widening of the radiolucent zones and implant breakage.
Limitations of the Study
The patient operated between 1998 to 2001 were not included as digitized images for these patients were not available on the system. This could be a possible source of selection bias.
It is difficult to evaluate radiographs for fusion when the >90% AP diameter of the disc space is obscured by an implant. In such cases, advanced imaging in the form of CT scan should be performed.
While follow-ups up to 7000 days increase the strength of the study, the retrospective analysis remains a disadvantage.
The applicability to cervical and lumbar spine still needs to be proven.
Conclusion
Evaluation of fusion based on standard lateral x-rays alone is possible in over 95% of images. CT-controls seem not to be necessary for evaluation of fusion in uncomplicated cases. In general, the time spans required for interbody fusions to get solid are longer than most authors claim. A major difference in the fusion process could be verified between pyogenic spondylitis and degenerative conditions. A traffic light scheme with 365 days for normal fusion (green) and 510 days for delayed/hampered fusion process (yellow) and more than 510 days (red) for pseudoathrosis seems a valuable guideline. The following 4 observations should trigger in-depth evaluation/reoperation: a) rod or screw breakage associated with progressive kyphosis of more than 5° in 6 months along with local pain and/or neurological symptoms; b) new onset radiolucency around the screw or cage and/or screw breakage once the patient reaches Grade 2 (false positive Grade 2); c) substantial resorption of graft >70% with patient in Grades 3 or 4 fusion status; d) endplates sclerotic or lytic > 510 days post-op. Implant removal, if considered necessary, should only be done once the patient reaches Grade 2.
Footnotes
Declaration of Conflicting Interests
The author(s) declared no potential conflicts of interest with respect to the research, authorship, and/or publication of this article.
Funding
The author(s) received no financial support for the research, authorship, and/or publication of this article.