
Abstract
Study Design:
Retrospective database study.
Objective:
Low back and neck pain are among the top leading causes of disability worldwide. The aim of our study was to report the current trends on spine degenerative disorders and their treatments.
Methods:
Patients diagnosed with lumbar or cervical spine conditions within the orthopedic subset of Medicare and Humana databases (PearlDiver). From the initial cohorts we identified subgroups based on the treatment: fusion or nonoperative within 1 year from diagnosis. Poisson regression was used to determine demographic differences in diagnosis and treatment approaches.
Results:
Within the Medicare database there were 6 206 578 patients diagnosed with lumbar and 3 156 215 patients diagnosed with cervical degenerative conditions between 2006 and 2012, representing a 16.5% (lumbar) decrease and 11% (cervical) increase in the number of diagnosed patients. There was an increase of 18.5% in the incidence of fusion among lumbar patients. For the Humana data sets there were 1 160 495 patients diagnosed with lumbar and 660 721 patients diagnosed with cervical degenerative disorders from 2008 to 2014. There was a 33% (lumbar) and 42% (cervical) increases in the number of diagnosed patients. However, in both lumbar and cervical groups there was a decrease in the number of surgical and nonoperative treatments.
Conclusions:
There was an overall increase in both lumbar and cervical conditions, followed by an increase in lumbar fusion procedures within the Medicare database. There is still a burning need to optimize the spine care for the elderly and people in their prime work age to lessen the current national economic burden.
Keywords
Introduction
Cervical and lumbar spine disorders represent the most common medical problems worldwide. The recent Global Burden of Disease Study 2013 reported that low back pain was the top cause for years lived with disability (YLD) in 1990 and 2013, with a 56.75% increase from 1990 to 2013. 1 Neck pain was the fourth leading cause, with a 54% increase from 1990 to 2013. Back pain was the leading cause in 45 developed and 94 developing countries. Aging maybe the main cause for the increase, and current treatments have not demonstrated a reduction of YLD with spinal disorders, making them one of the biggest driving causes in health care expenditures worldwide.
Degenerative changes within intervertebral discs and endplates alter the loading patterns on vertebral bodies and associated spinal structures, introducing increased stress on the facet joints, spinal ligaments and tendons, and traversing neurological tissues, contributing to further deterioration. Choosing the correct or most optimal treatment is very challenging due to the various comorbidities and psychosocial conditions. Nonoperative options were, and often are, the treatment of choice, especially in the older population. 2 At the same time, improvements in surgical techniques; development of new cages, instrumentation, and biologics; and advancements in imaging and magnetic resonance imaging use along with higher patient demands have contributed to an increase in the rate of surgical treatments for spinal conditions. 2 –6
Increasing rates of diagnosed spinal degenerative conditions and treatments were accompanied by a hike in medical costs and health care use. A survey following the population of the United States from 1997 to 2005 reported an increase of 4% in the number of people with reported neck or back problems (20.7% in 1997 and 24.7% in 2005) and a 65% increase in neck and back expenditures between 1997 and 2005. 7 In another US national survey, 26.4% of respondents had low back pain and that percentage was strongly related to the participant’s educational attainment. 8 Just within Medicare, lumbar spine surgery costs doubled from 1992 to 2003, reaching 1 billion dollars. 9 A recent study found that among patients with adult spine deformities, only 40.7% were below the threshold for cost-effectiveness per quality adjusted life year over a 5-year time period. 10 In the current wake of legislative changes in health care models (value-based purchasing and pay-per-performance) there is a need to provide spine treatments that are cost-effective and provide long-term favorable outcomes.
The aim of our study was to provide the most current trends on spinal degenerative disorders and treatments within the United States.
Materials and Methods
Orthopedic records within the PearlDiver (PearlDiver Inc, Warsaw, IN) Medicare and Humana private insurance databases were used in this study. The Medicare database spans from 2005 to 2012 with, on average, 25 million tracked patients per year and is derived from Medicare Parts A and B. The Humana database spans from 2007 to 2014 with, on average, 7.5 million patients entered per year, a private insurance provider including part of Medicare/Medicare Advantage plans. Patients diagnosed with lumbar or cervical spine conditions were isolated using the International Classification of Diseases, Ninth Edition (ICD-9) diagnosis codes (Table 1). Degenerative conditions included intervertebral disc degeneration, intervertebral disc disorder with myelopathy, displacement of intervertebral disc with myelopathy, stenosis, and spondylosis with and without myelopathy. From the initial cohorts, we identified subgroups based on the treatment: fusion surgery or nonoperative within 1 year from diagnosis. This was achieved using Current Procedural Terminology (CPT) and ICD-9 procedural codes (Table 1). For both diagnosis and treatment options, we collected annual trends, and patients were further stratified by age, gender, and region. Both databases have 5-year age increments, with Medicare age groups ranging from <65 to ≥85 and Humana 10 to ≥90 years of age. Regions within the United States were broken down into the South, Midwest, West, and Northeast. Patient distribution among those 4 regions was uneven: 52.8% were in the South, 26.9% in the Midwest, 13.6% in the West, and 6.6% in the Northeast. Institutional review board approval was unnecessary since all the patient information was de-identified prior to release for this study.
ICD-9 and CPT codes for Lumbar and Cervical Degenerative Conditions and Treatments.
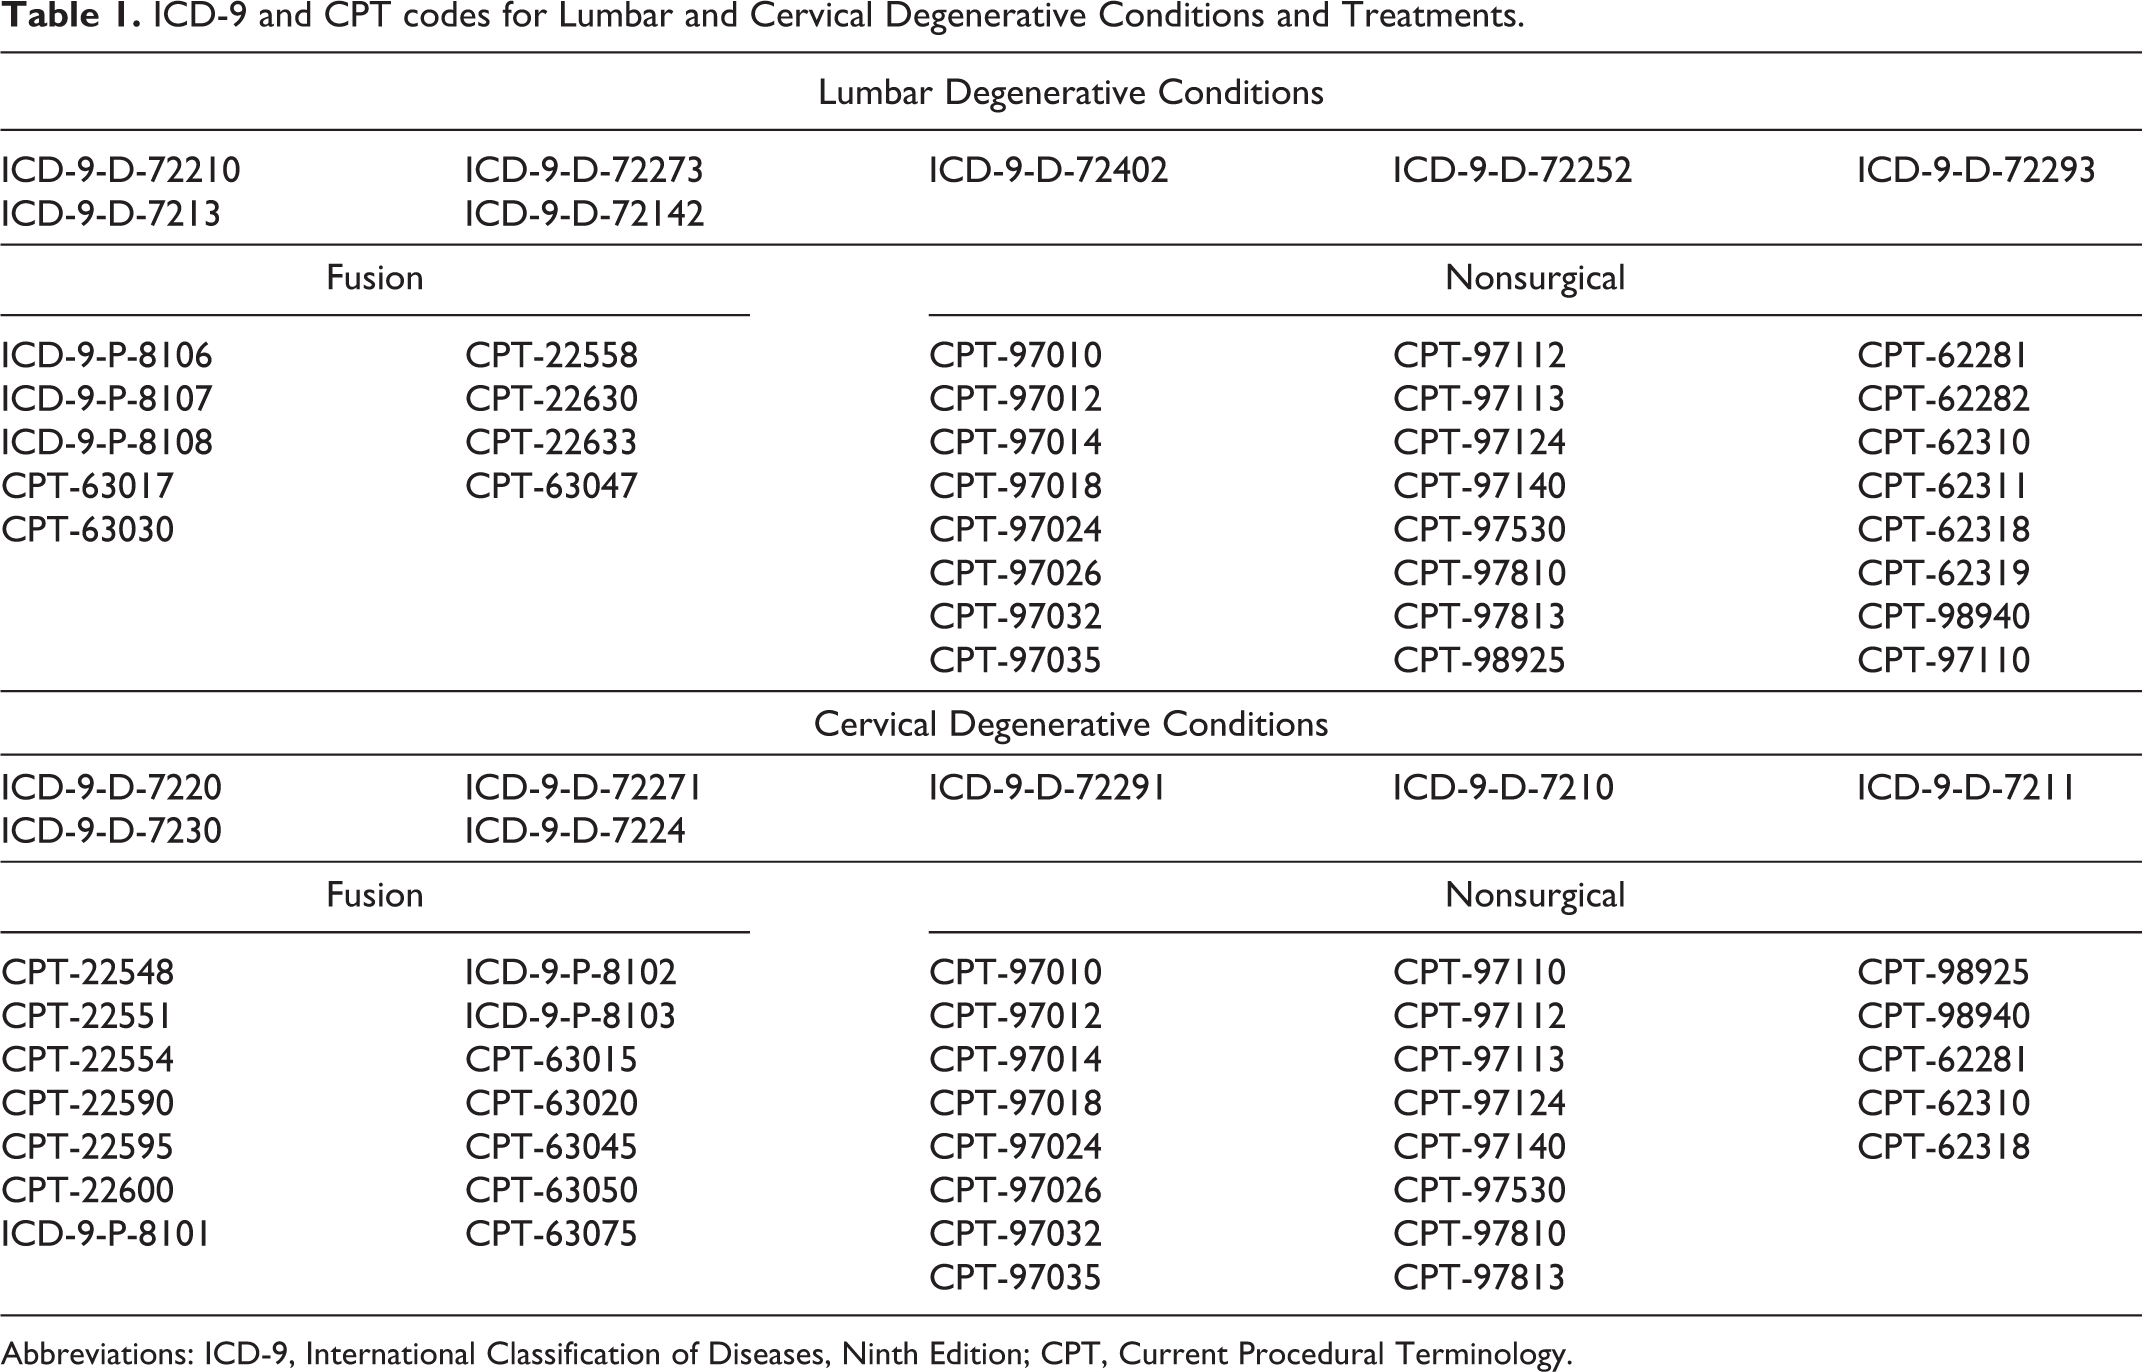
Abbreviations: ICD-9, International Classification of Diseases, Ninth Edition; CPT, Current Procedural Terminology.
Poisson regressions were used to analyze degeneration, fusion, and nonoperative treatment rates for both cervical and lumbar disease. Year, gender, age, and region were included in each model to control for variable interactions. Data for patients with cervical or lumbar degeneration was analyzed using an exposure variable to control for demographic differences in database totals. Data for fusion and nonoperative treatment rates was analyzed using an exposure variable to control for differences in rates for cervical or lumbar degeneration by demographics. Model fit was tested using McFadden’s R 2, and models were checked for overdispersion using the α value in a negative binomial regression. Significance was set at P < .05.
Results
Medicare Database
Lumbar Region
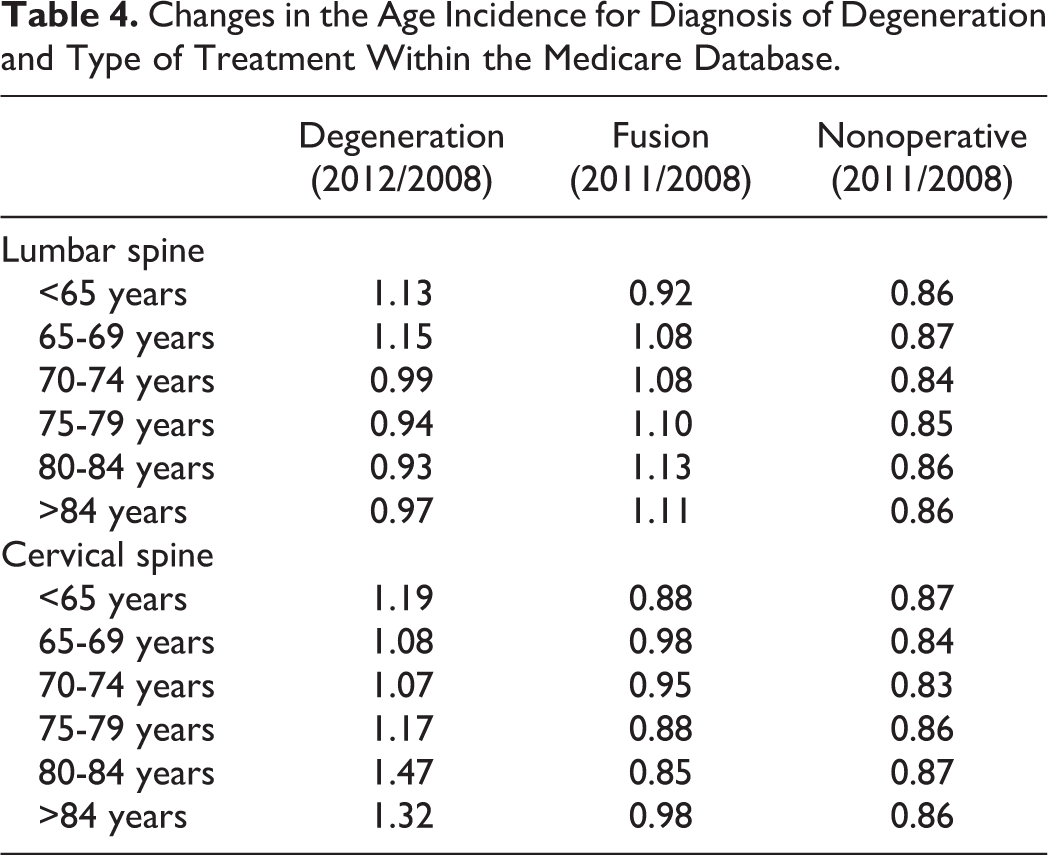
Within the Medicare database there were 6 206 578 patients (32 per 1000 patients) between 2006 and 2012 diagnosed with lumbar degenerative conditions. The incidence of patients decreased from 2006 (36 per 1000 patients) to 2008 (29 per 1000 patients), followed by a slight increase in 2011 (Table 2). From the patients diagnosed with lumbar degeneration, 5.9 per 100 patients progressed to lumbar fusion within 1 year and 35 per 100 patients had nonoperative treatment within 1 year between 2006 and 2011 (Table 3). There was an increase of 18.5% in the incidence of fusion procedures within 1 year of diagnosis between 2006 and 2011. The incidence of nonoperative procedures decreased from 2006 (38 per 100 patients) to 2011 (32 per 100 patients; Table 3). Females were diagnosed with lumbar degeneration more frequently compared with males (38 vs 25 per 1000 patients); however, males were more likely to undergo a fusion procedure compared with females (6.5 vs 5.6 per 1000 patients). The highest incidence of lumbar degeneration was observed in the South (52 per 100 patients) and the lowest in the West (19 per 100 patients; Table 2). The South also had the highest incidence of fusions (6.8 per 100 patients), whereas the Midwest had the highest incidence of nonoperative treatments (41 per 100 patients). Looking at age, the 65 to 69 years age group had the highest incidence of patients diagnosed with lumbar degeneration as well as the highest incidence of patients that underwent fusion within 1 year of diagnosis (Tables 2 and 3). Furthermore, this age group had a 15% increase in the incidence of a degeneration-related diagnosis between 2008 and 2012 (Table 4). Patients 80 to 84 and >85 years of age had the greatest relative increase in fusion incidence between 2008 and 2011 (13% and 11%, respectively). Patients in groups 70 to 74 and 75 to 79 years of age had the highest incidence of nonoperative treatments. However, the overall incidence of nonoperative treatment decreased from 2008 to 2011 for all age groups (Table 4).
Patient Demographics for Cervical and Lumbar Degenerative Conditions Within the Medicare Databasea.
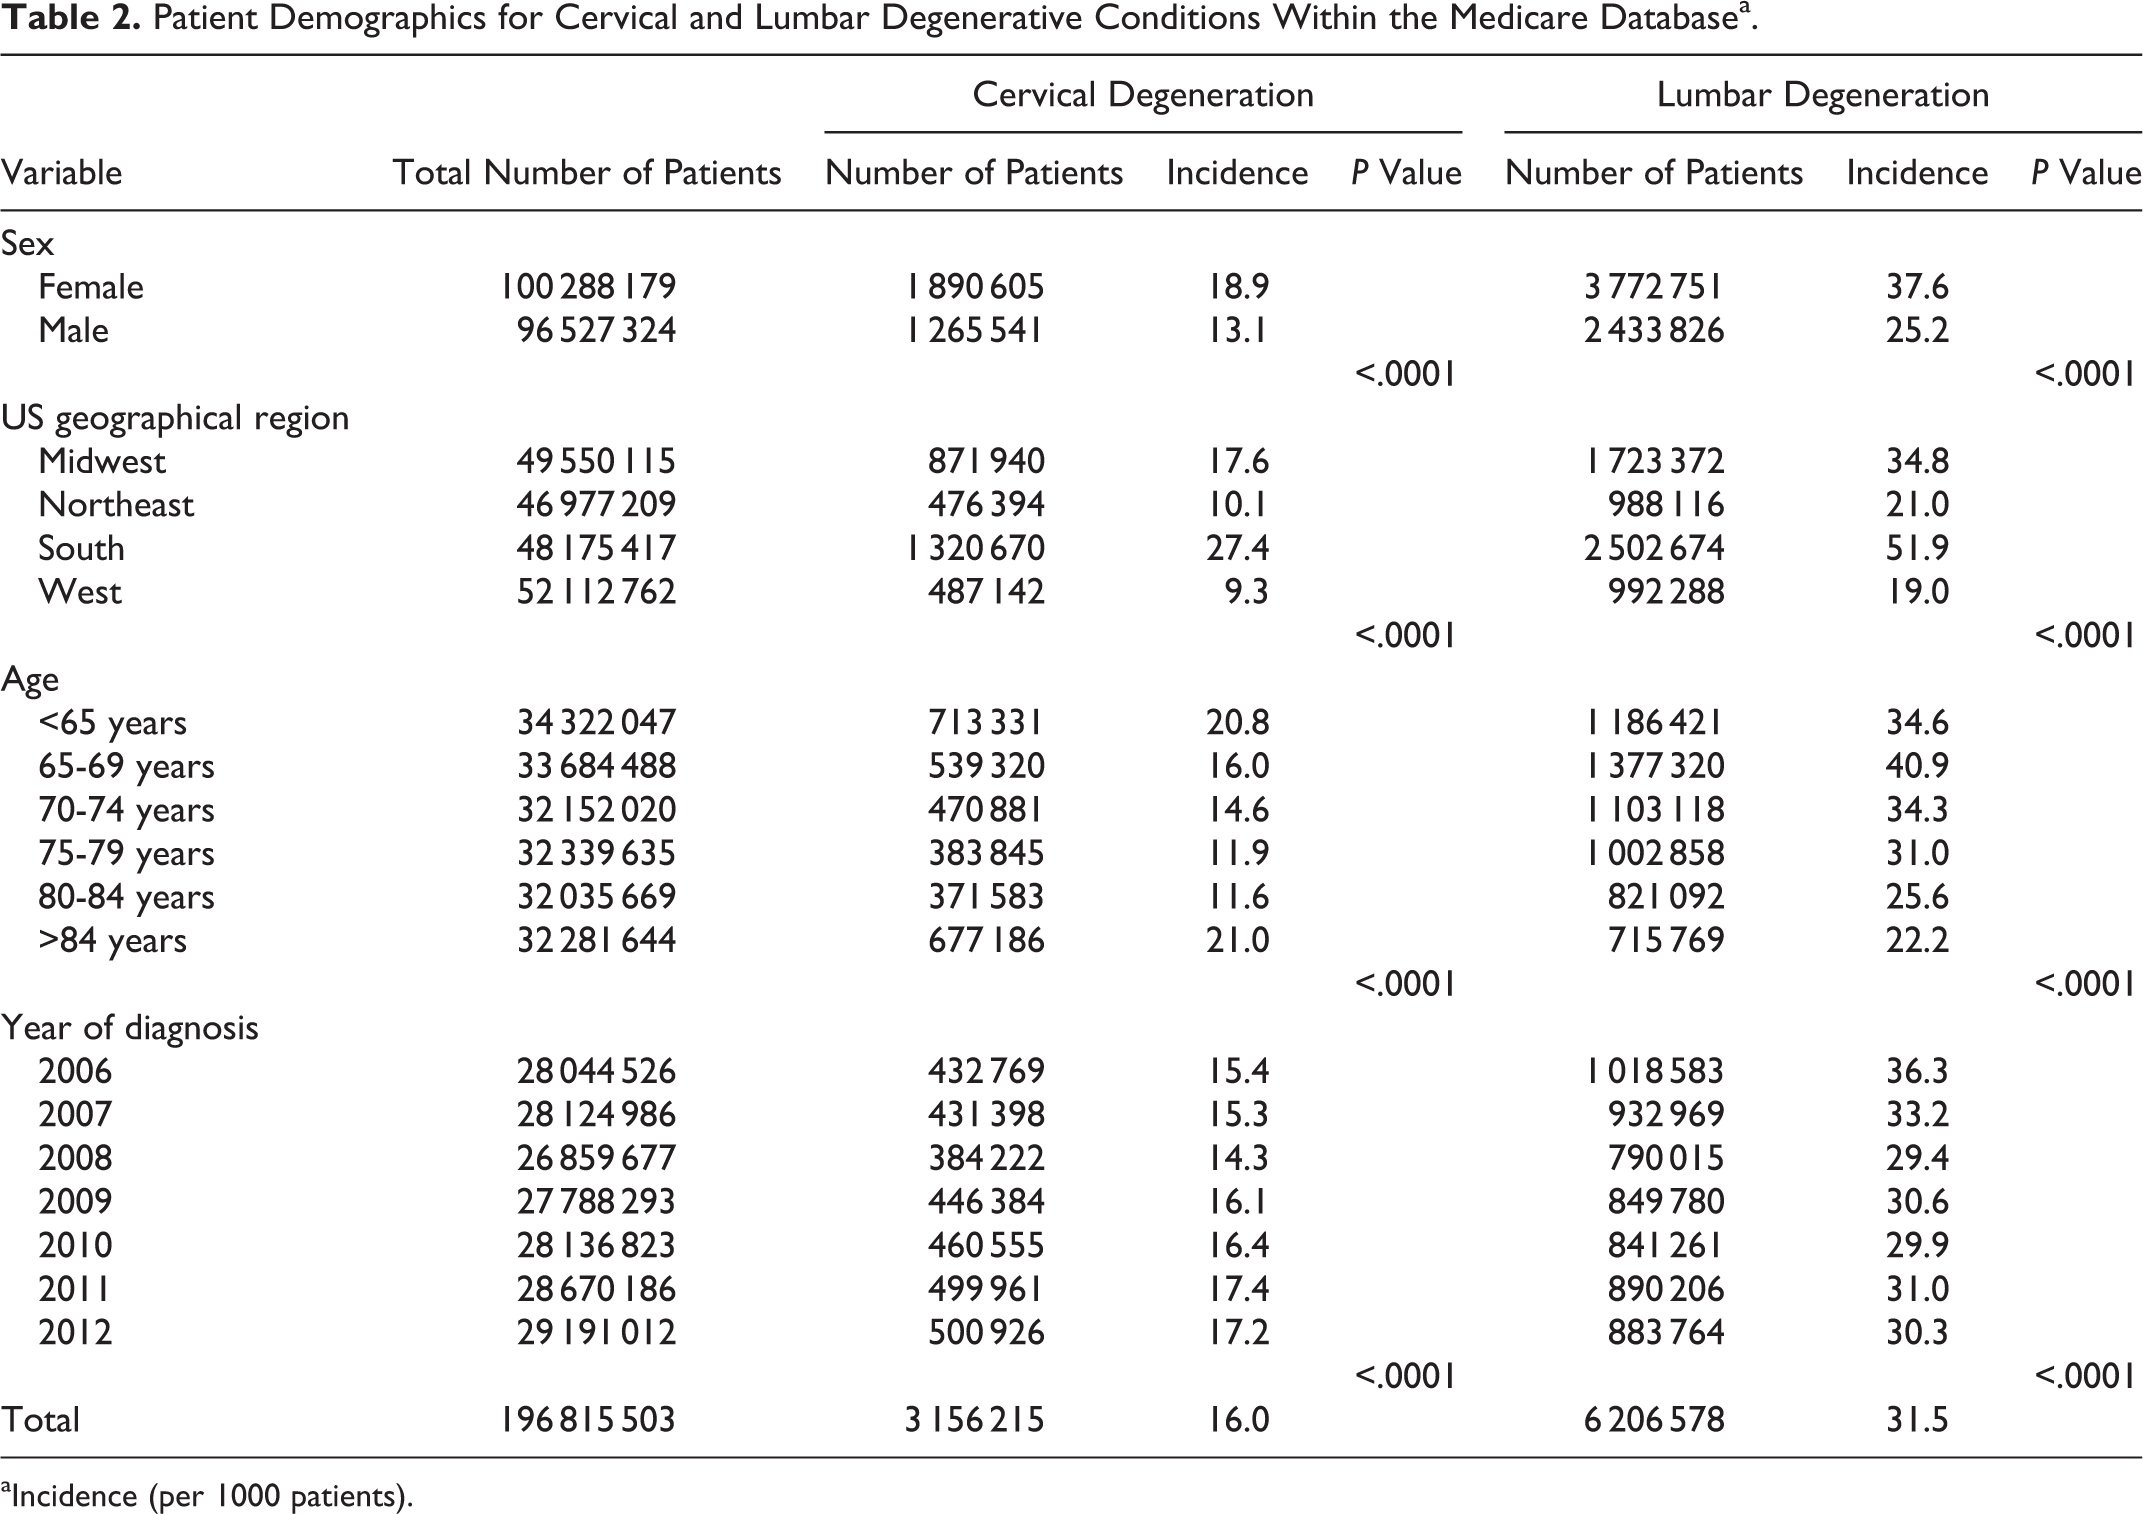
aIncidence (per 1000 patients).
Demographics of Patients Undergoing Lumbar Fusion or Nonoperative Treatment Within the Medicare Databasea.
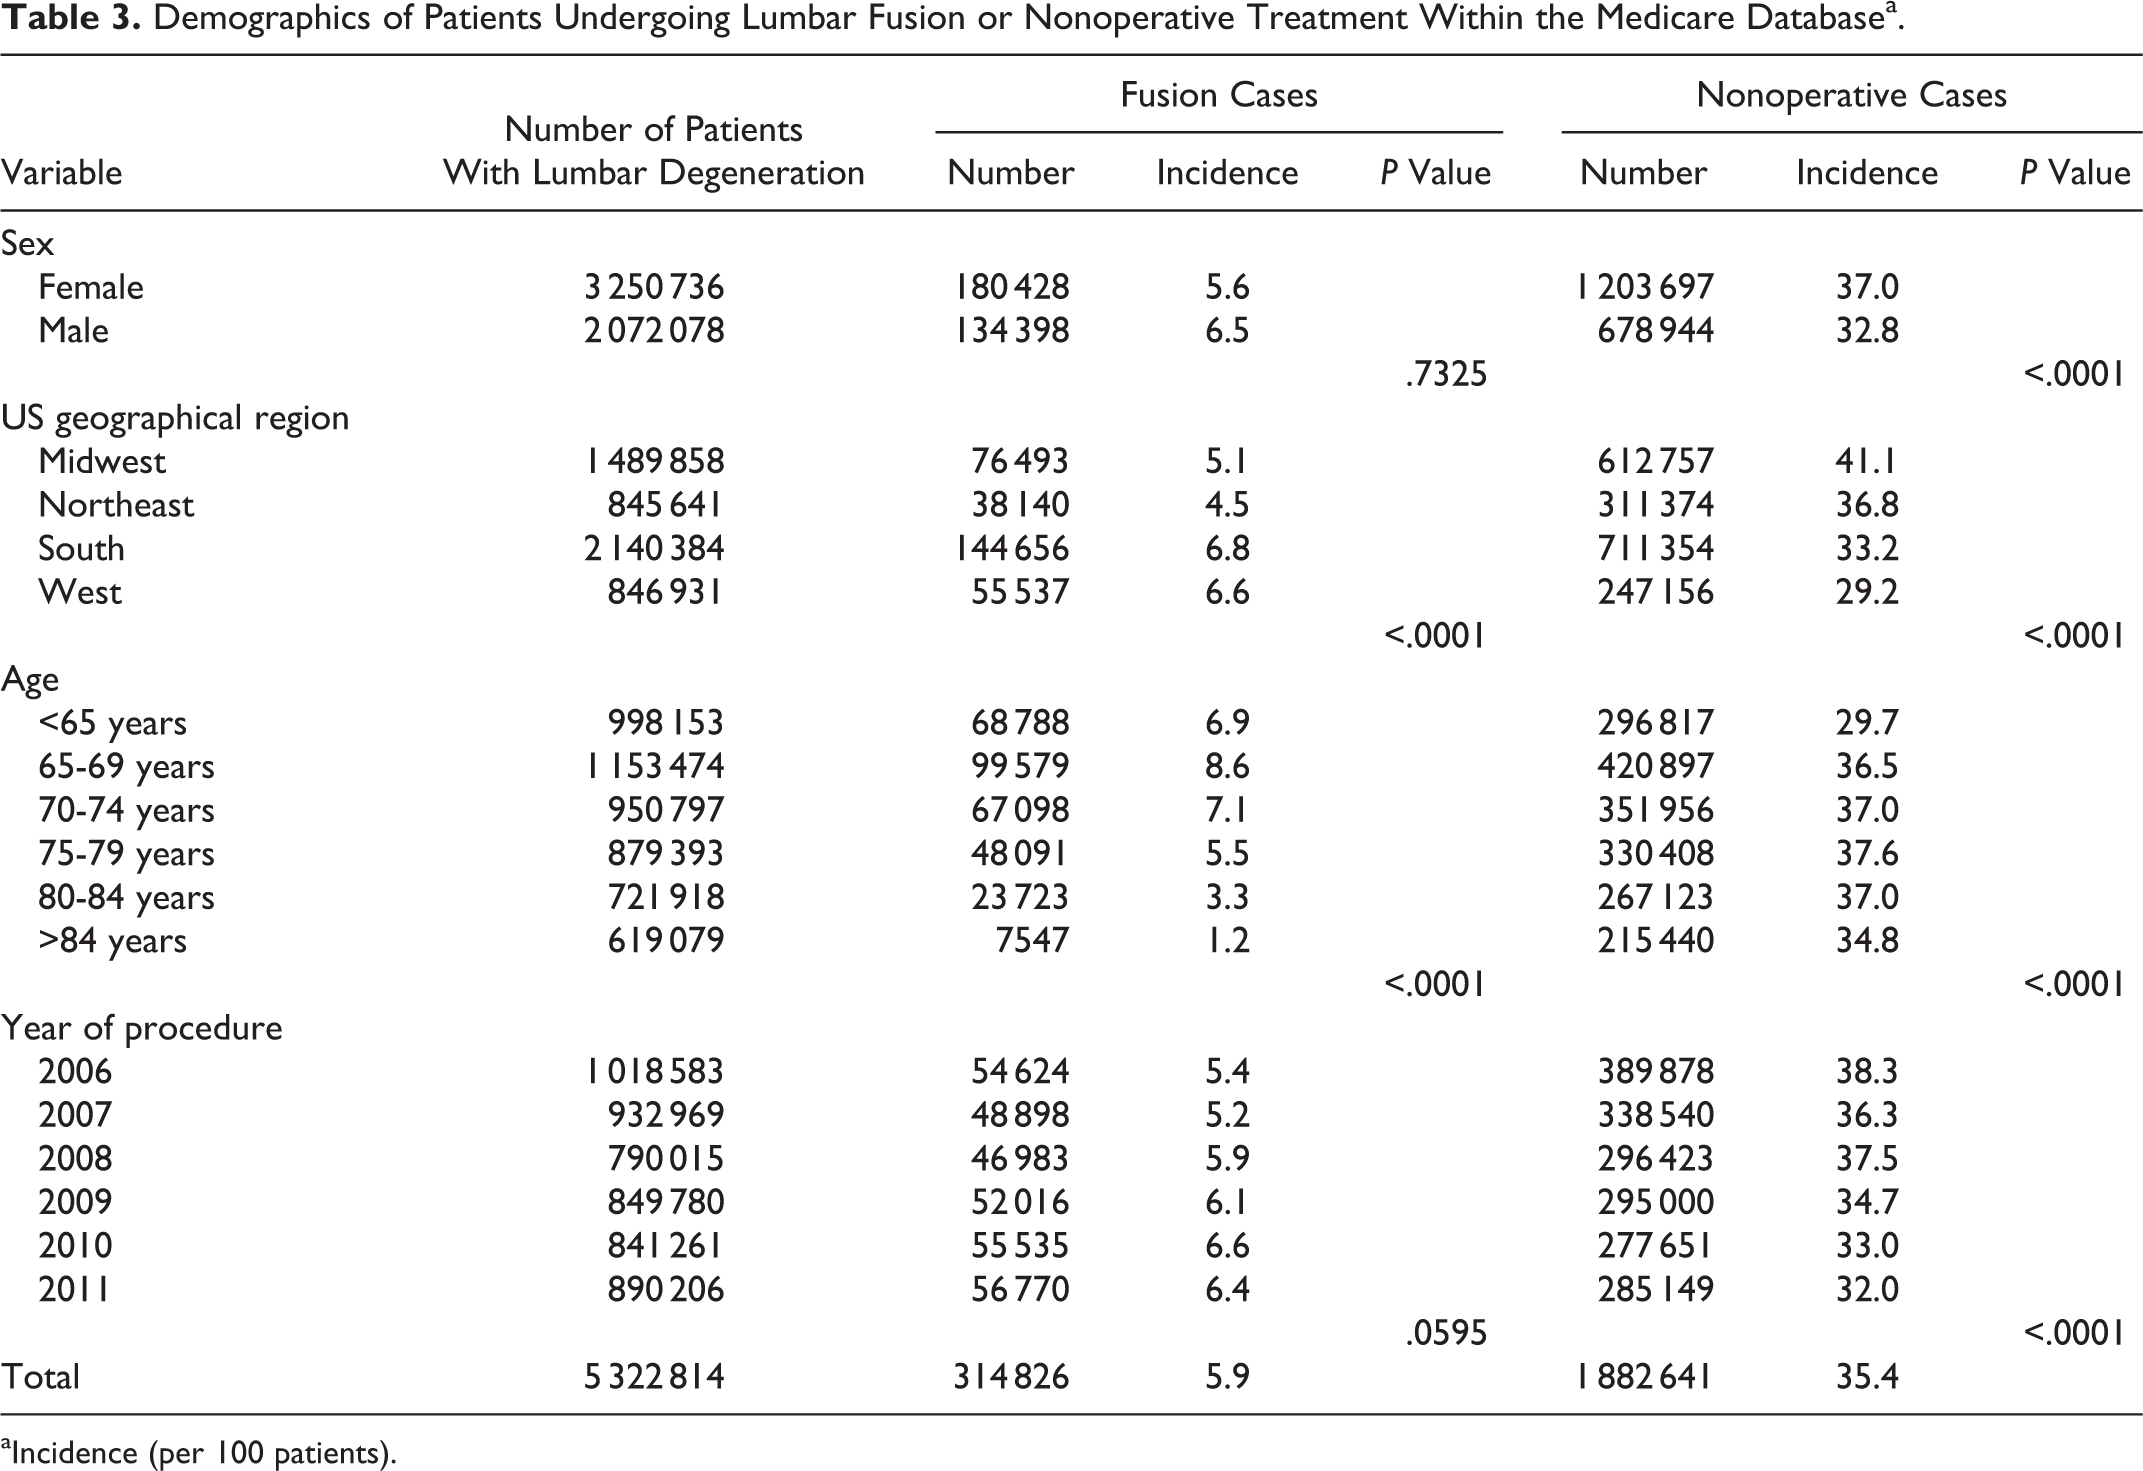
aIncidence (per 100 patients).
Changes in the Age Incidence for Diagnosis of Degeneration and Type of Treatment Within the Medicare Database.
The Poisson regressions significantly predicted the number of patients with lumbar degeneration who underwent fusion or nonoperative treatment while controlling for year, region, gender, and age (P < .0001), and model fits were excellent (R 2 = .991). Each variable was also individually predictive of the number of patients with lumbar degeneration (P < .0001; Table 2). The Poisson regressions significantly predicted the number of patients with lumbar degeneration who underwent fusion or nonoperative treatment while controlling for year, region, gender, and age (P < .0001), and model fits were excellent (R 2 = .967 fusion, R 2 = .947 nonoperative). For the fusion cohort, region and age were individually significant predictors of patient counts (P < .0001; Table 3). For the nonoperative cohort, all variables were individually predictive of patient counts (P < .0001; Table 3).
Cervical Region
There were 3 156 215 patients (16 per 1000 patients) diagnosed with cervical degenerative problems between 2006 and 2012 in the Medicare database (Table 2). Among those patients, 7.0% underwent fusion within the first year of diagnosis and 32% had nonoperative treatment. After 2008 there was a steady increase in the number of newly diagnosed patients, with a diagnostic incidence increase of 1.0 per 1000 patients per year between 2008 and 2011 (Table 2). Fusion trends remained stable between 2006 and 2011 at 7.0 per 100 patients with cervical degeneration. Nonoperative trends also remained stable from 2006 to 2011 at 32 per 100 patients with cervical degeneration (Table 5). Gender and region trends were similar to lumbar values. There were more female than male patients diagnosed with degeneration (19 vs 13 per 1000 patients) and female patients had more nonoperative treatment (34 vs 30 per 100 patients with cervical degeneration); however, male patients had more fusions as was seen in the Medicare lumbar cohort (8.6 vs 6.0 per 100 patients with cervical degeneration; Table 5). The South had the highest incidence of degeneration and fusion, whereas the Midwest had the highest incidence of nonoperative treatments (Tables 2 and 5). The age group >84 years of age had the highest incidence of patients diagnosed with cervical degeneration, followed by the <65 years age group (Table 2). The <65 years age group had the highest incidence of fusions, whereas the >84 years age group had the highest incidence of nonoperative treatment. A steady increase in the diagnostic incidence of cervical degeneration was observed after 2008 among all age groups (Table 4). For both the fusion and nonoperative groups, the overall incidence of both procedures decreased from 2008 to 2011 for all age groups (Table 4).
Demographics of Patients With Cervical Spine Disorders Undergoing Fusion or Nonoperative Treatment Within the Medicare Databasea.
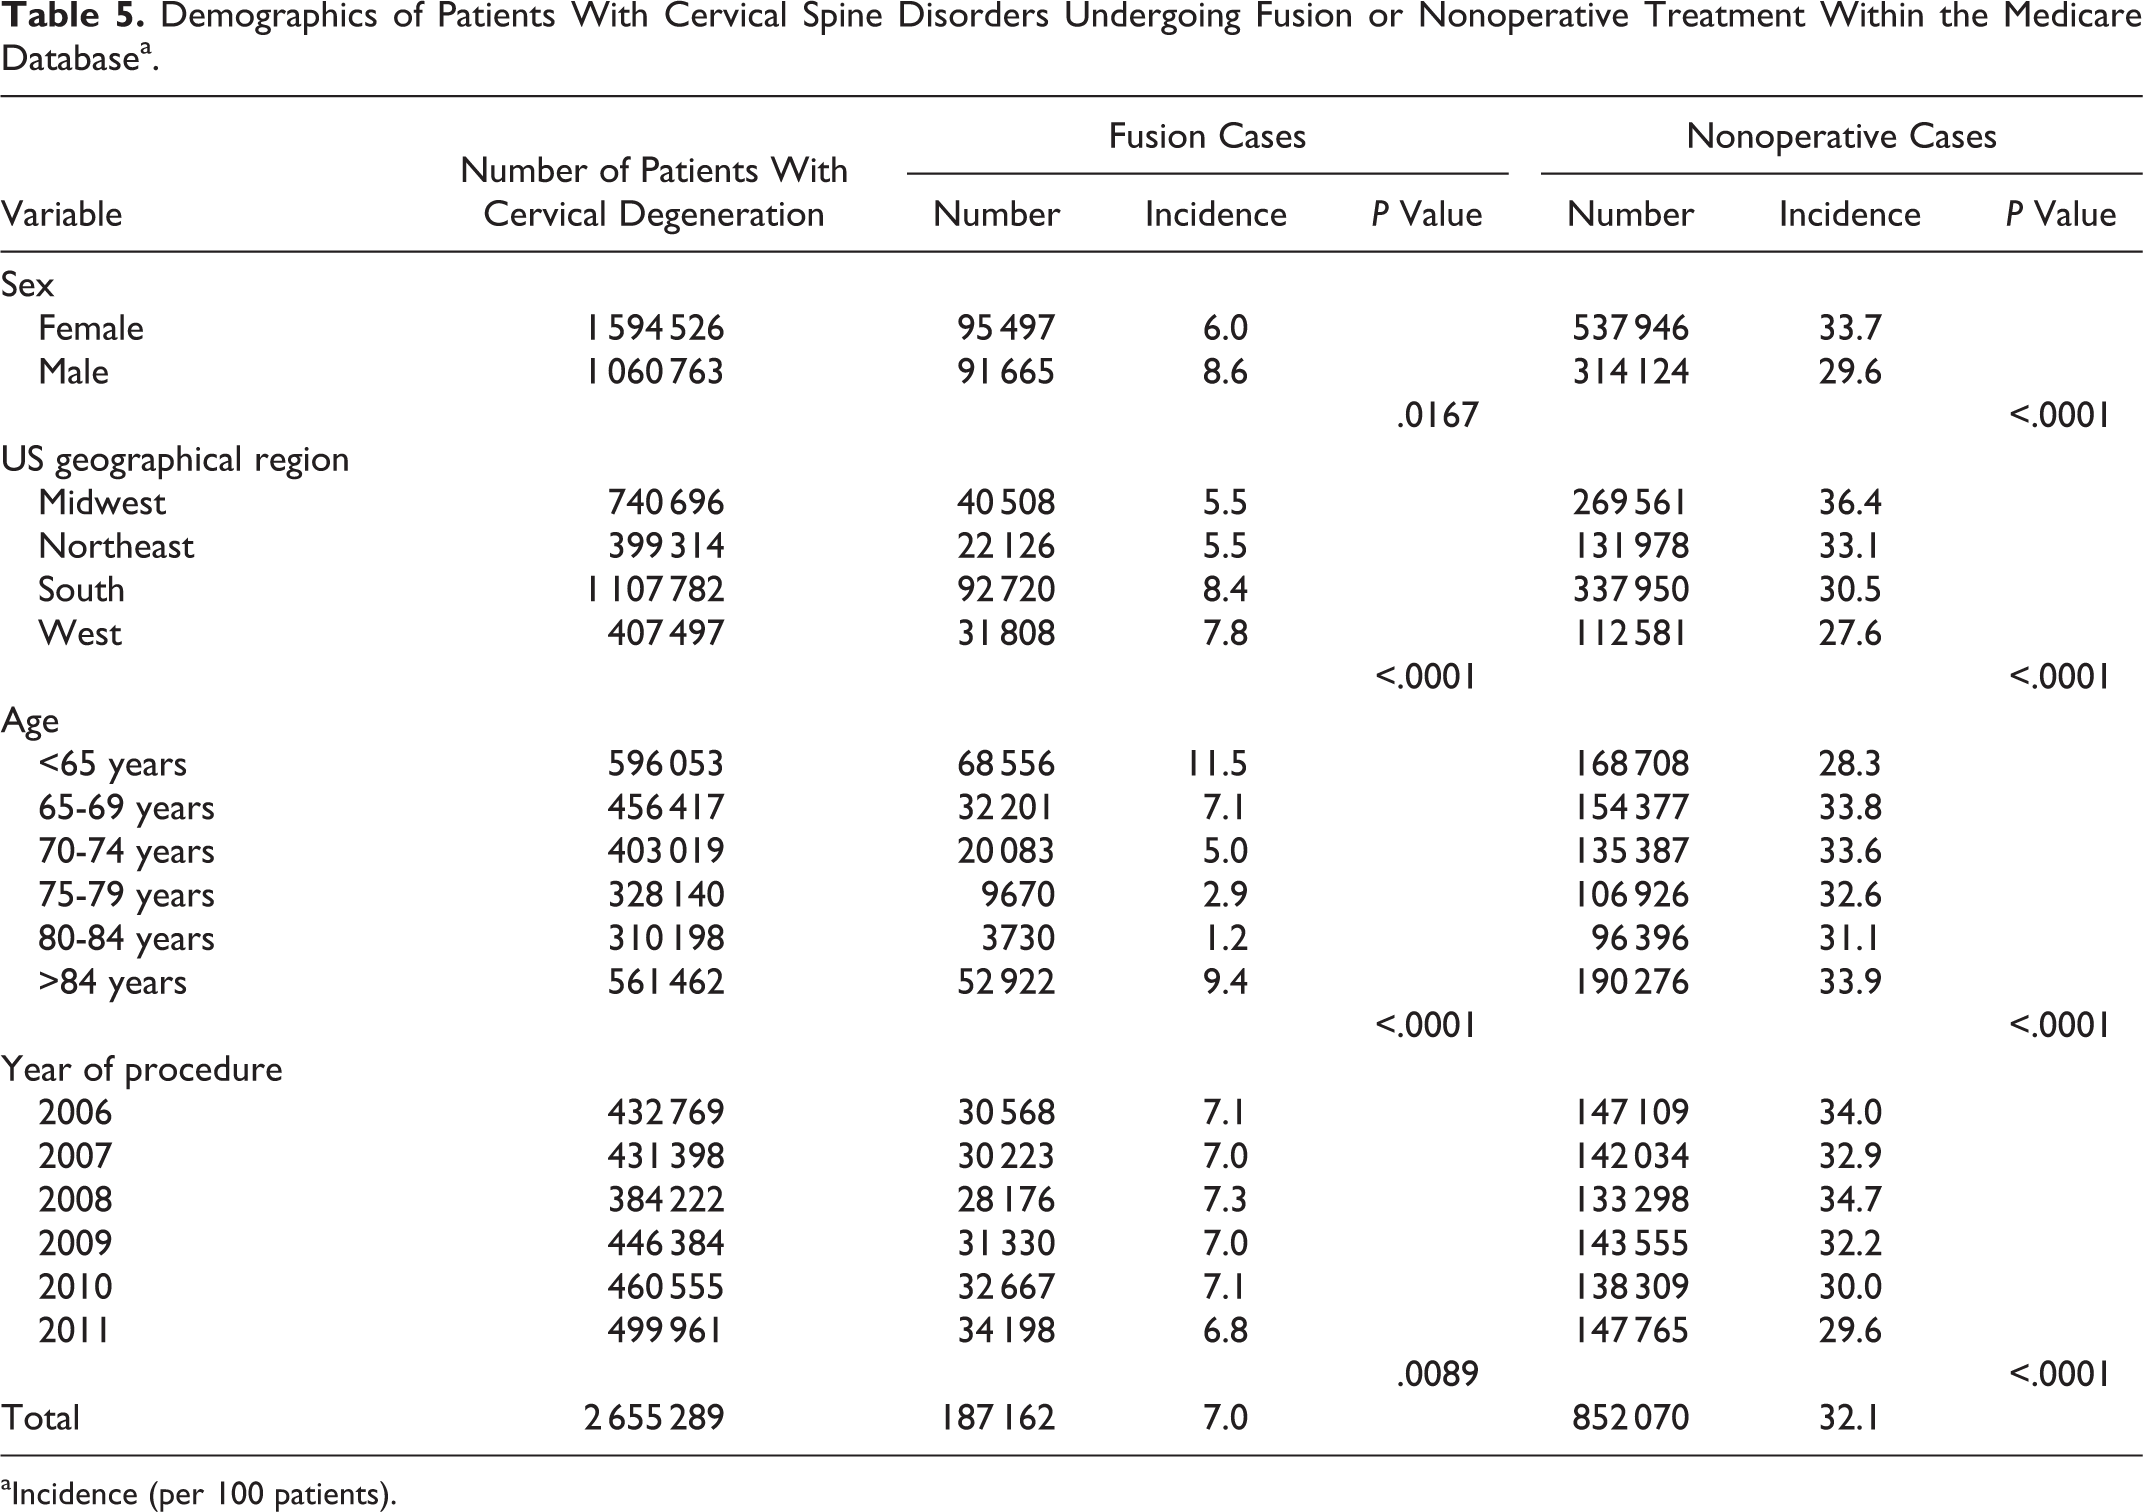
aIncidence (per 100 patients).
The Poisson regressions significantly predicted the number of patients with cervical degeneration while controlling for year, region, gender, and age (P < .0001), and model fits were excellent (R 2 > .994). Gender, region, age, and year were individually significant predictors of the number of patients with cervical degeneration (P < .0001; Table 2). The Poisson regressions also significantly predicted the number of patients with cervical degeneration who underwent fusion or nonoperative treatment while controlling for year, region, gender, and age (P < .0001), and model fits were excellent (R 2 = .967 fusion, R 2 = .874 nonoperative). For both the fusion and nonoperative cohorts, all variables were individually predictive of patient counts (P < .0167; Table 5).
Humana Database
Lumbar Spine
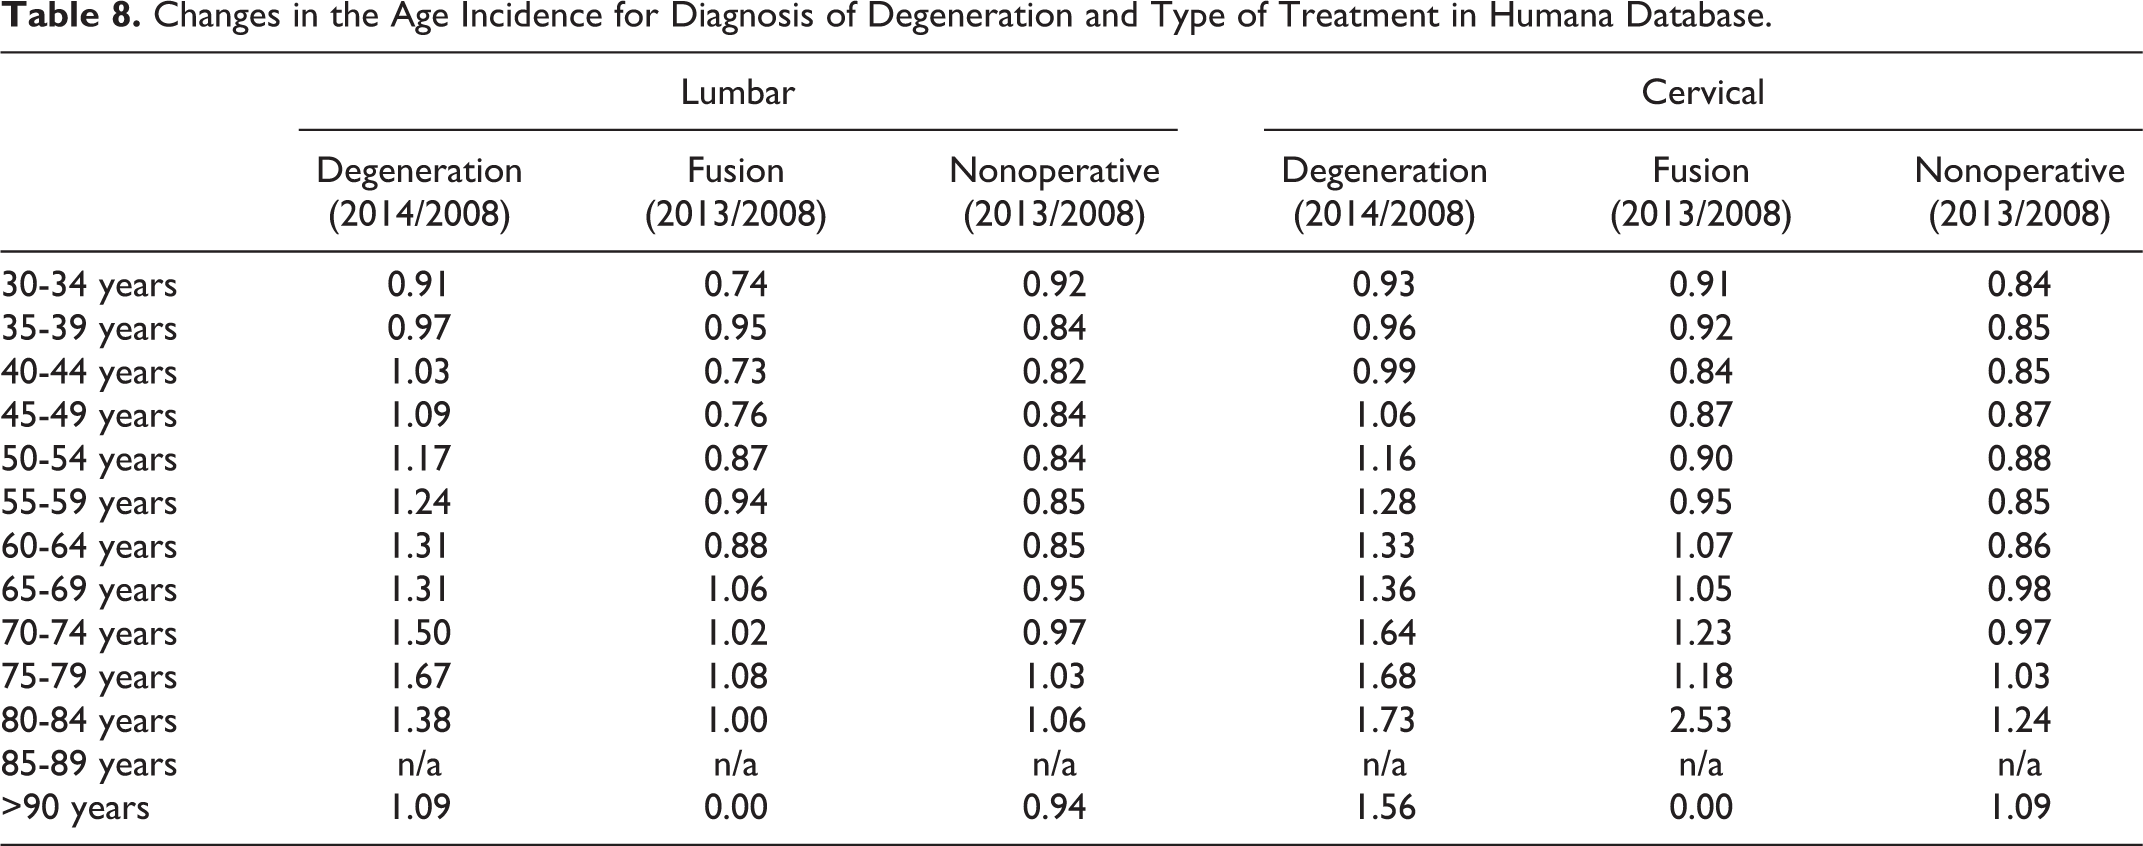
There were 1 160 495 patients diagnosed with lumbar degenerative disorders from 2008 to 2014. There was a steady increase in the number of diagnosed patients, with a 33% increase from 2008 to 2014 (Table 6). Of the patients diagnosed with lumbar degeneration, 4% underwent fusion surgery within 1 year of diagnosis, whereas 37.8% had some type of nonoperative treatment within 1 year of diagnosis (Table 7). There were more male patients diagnosed with degeneration (27.2 per 1000 patients) and male patients had more fusions (4.7 per 100 patients) compared with females. The South and Midwest were the regions with the highest incidence of initial diagnosis as well as fusions (Table 7). The incidence of lumbar degeneration was highest in the 60 to 64 years age group followed by the 55 to 59 years age group (Table 6). Patients in the youngest age group, 30 to 34 years of age, had the highest incidence of fusion and nonoperative treatments (Table 7). Between 2008 and 2014, patients older than 40 years of age had an overall increase in the number of lumbar degenerative conditions, 75 to 79 year olds having the greatest increase, with an increase of 67%. Patients 75 to 79 years of age, also, had the greatest increase in the number of fusions, with an increase of 8%. Patients 80 to 84 years of age had the greatest increase in the number of nonoperative treatments, with an increase of 6% (Table 8).
Demographics of Patients With Cervical and Lumbar Degenerative Conditions Within Humana Databasea.
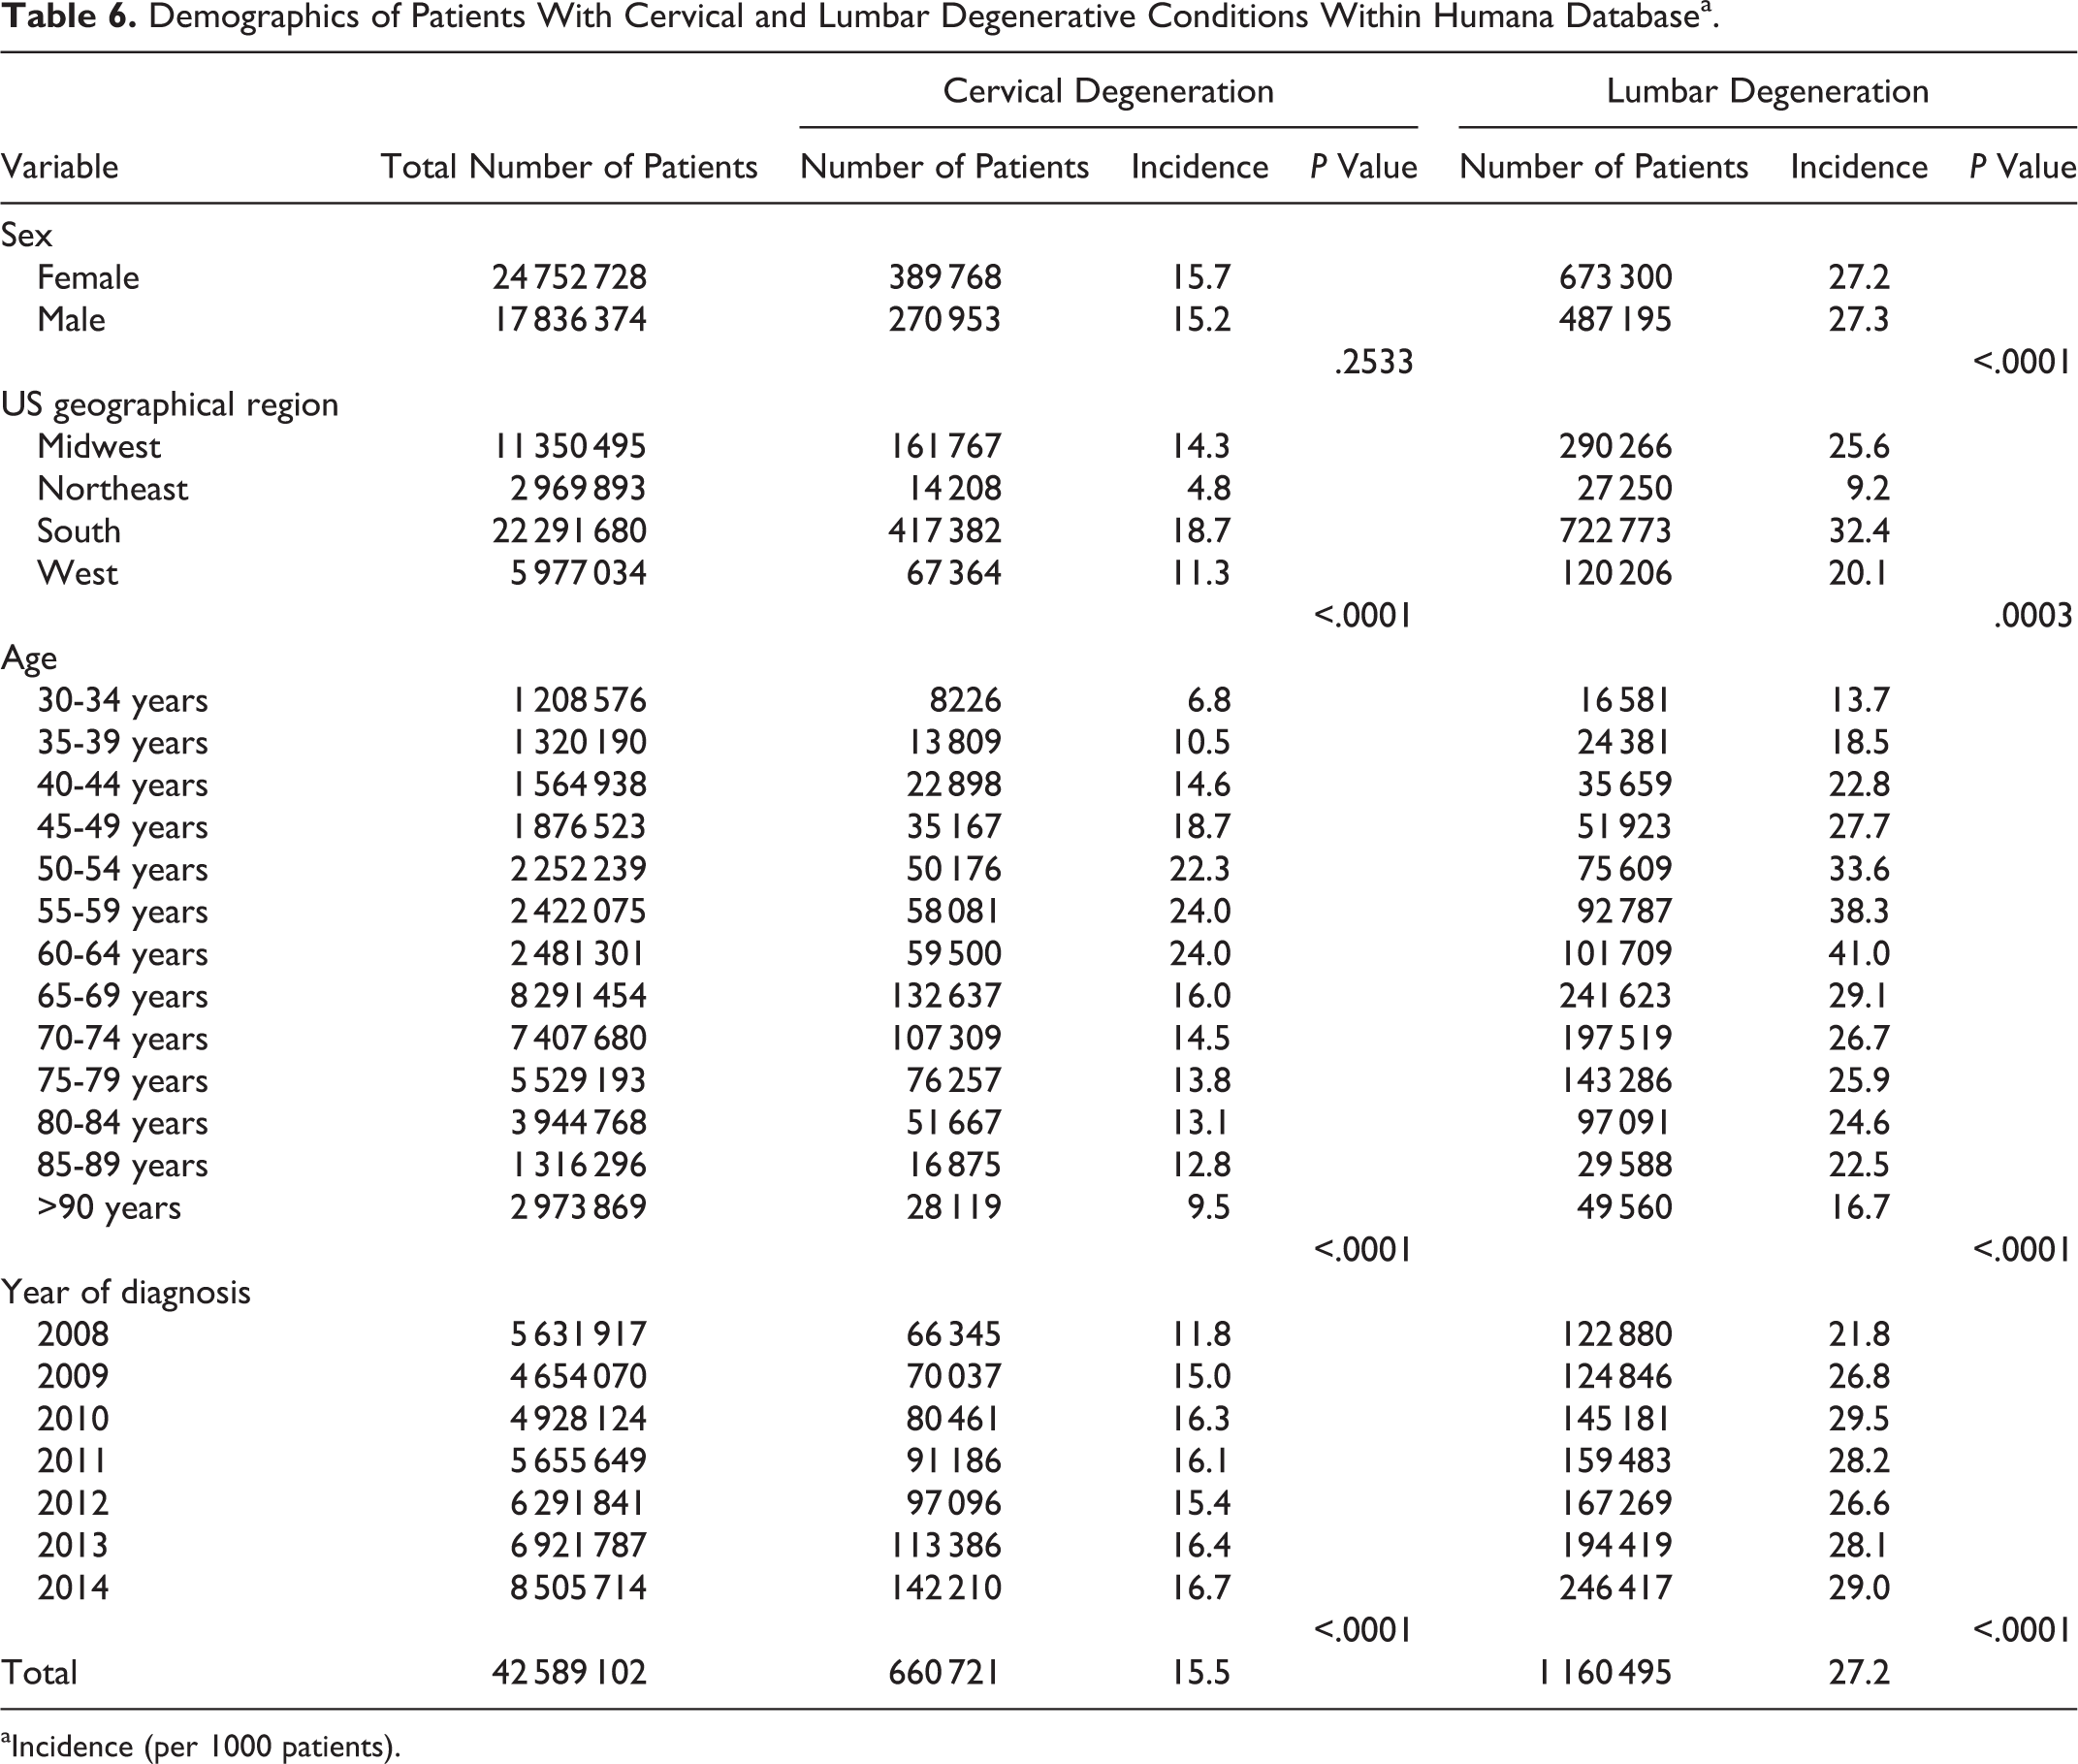
aIncidence (per 1000 patients).
Demographics of Patients With Lumbar Spine Degenerative Conditions Undergoing Fusion or Nonoperative Treatment Within Humana Databasea.
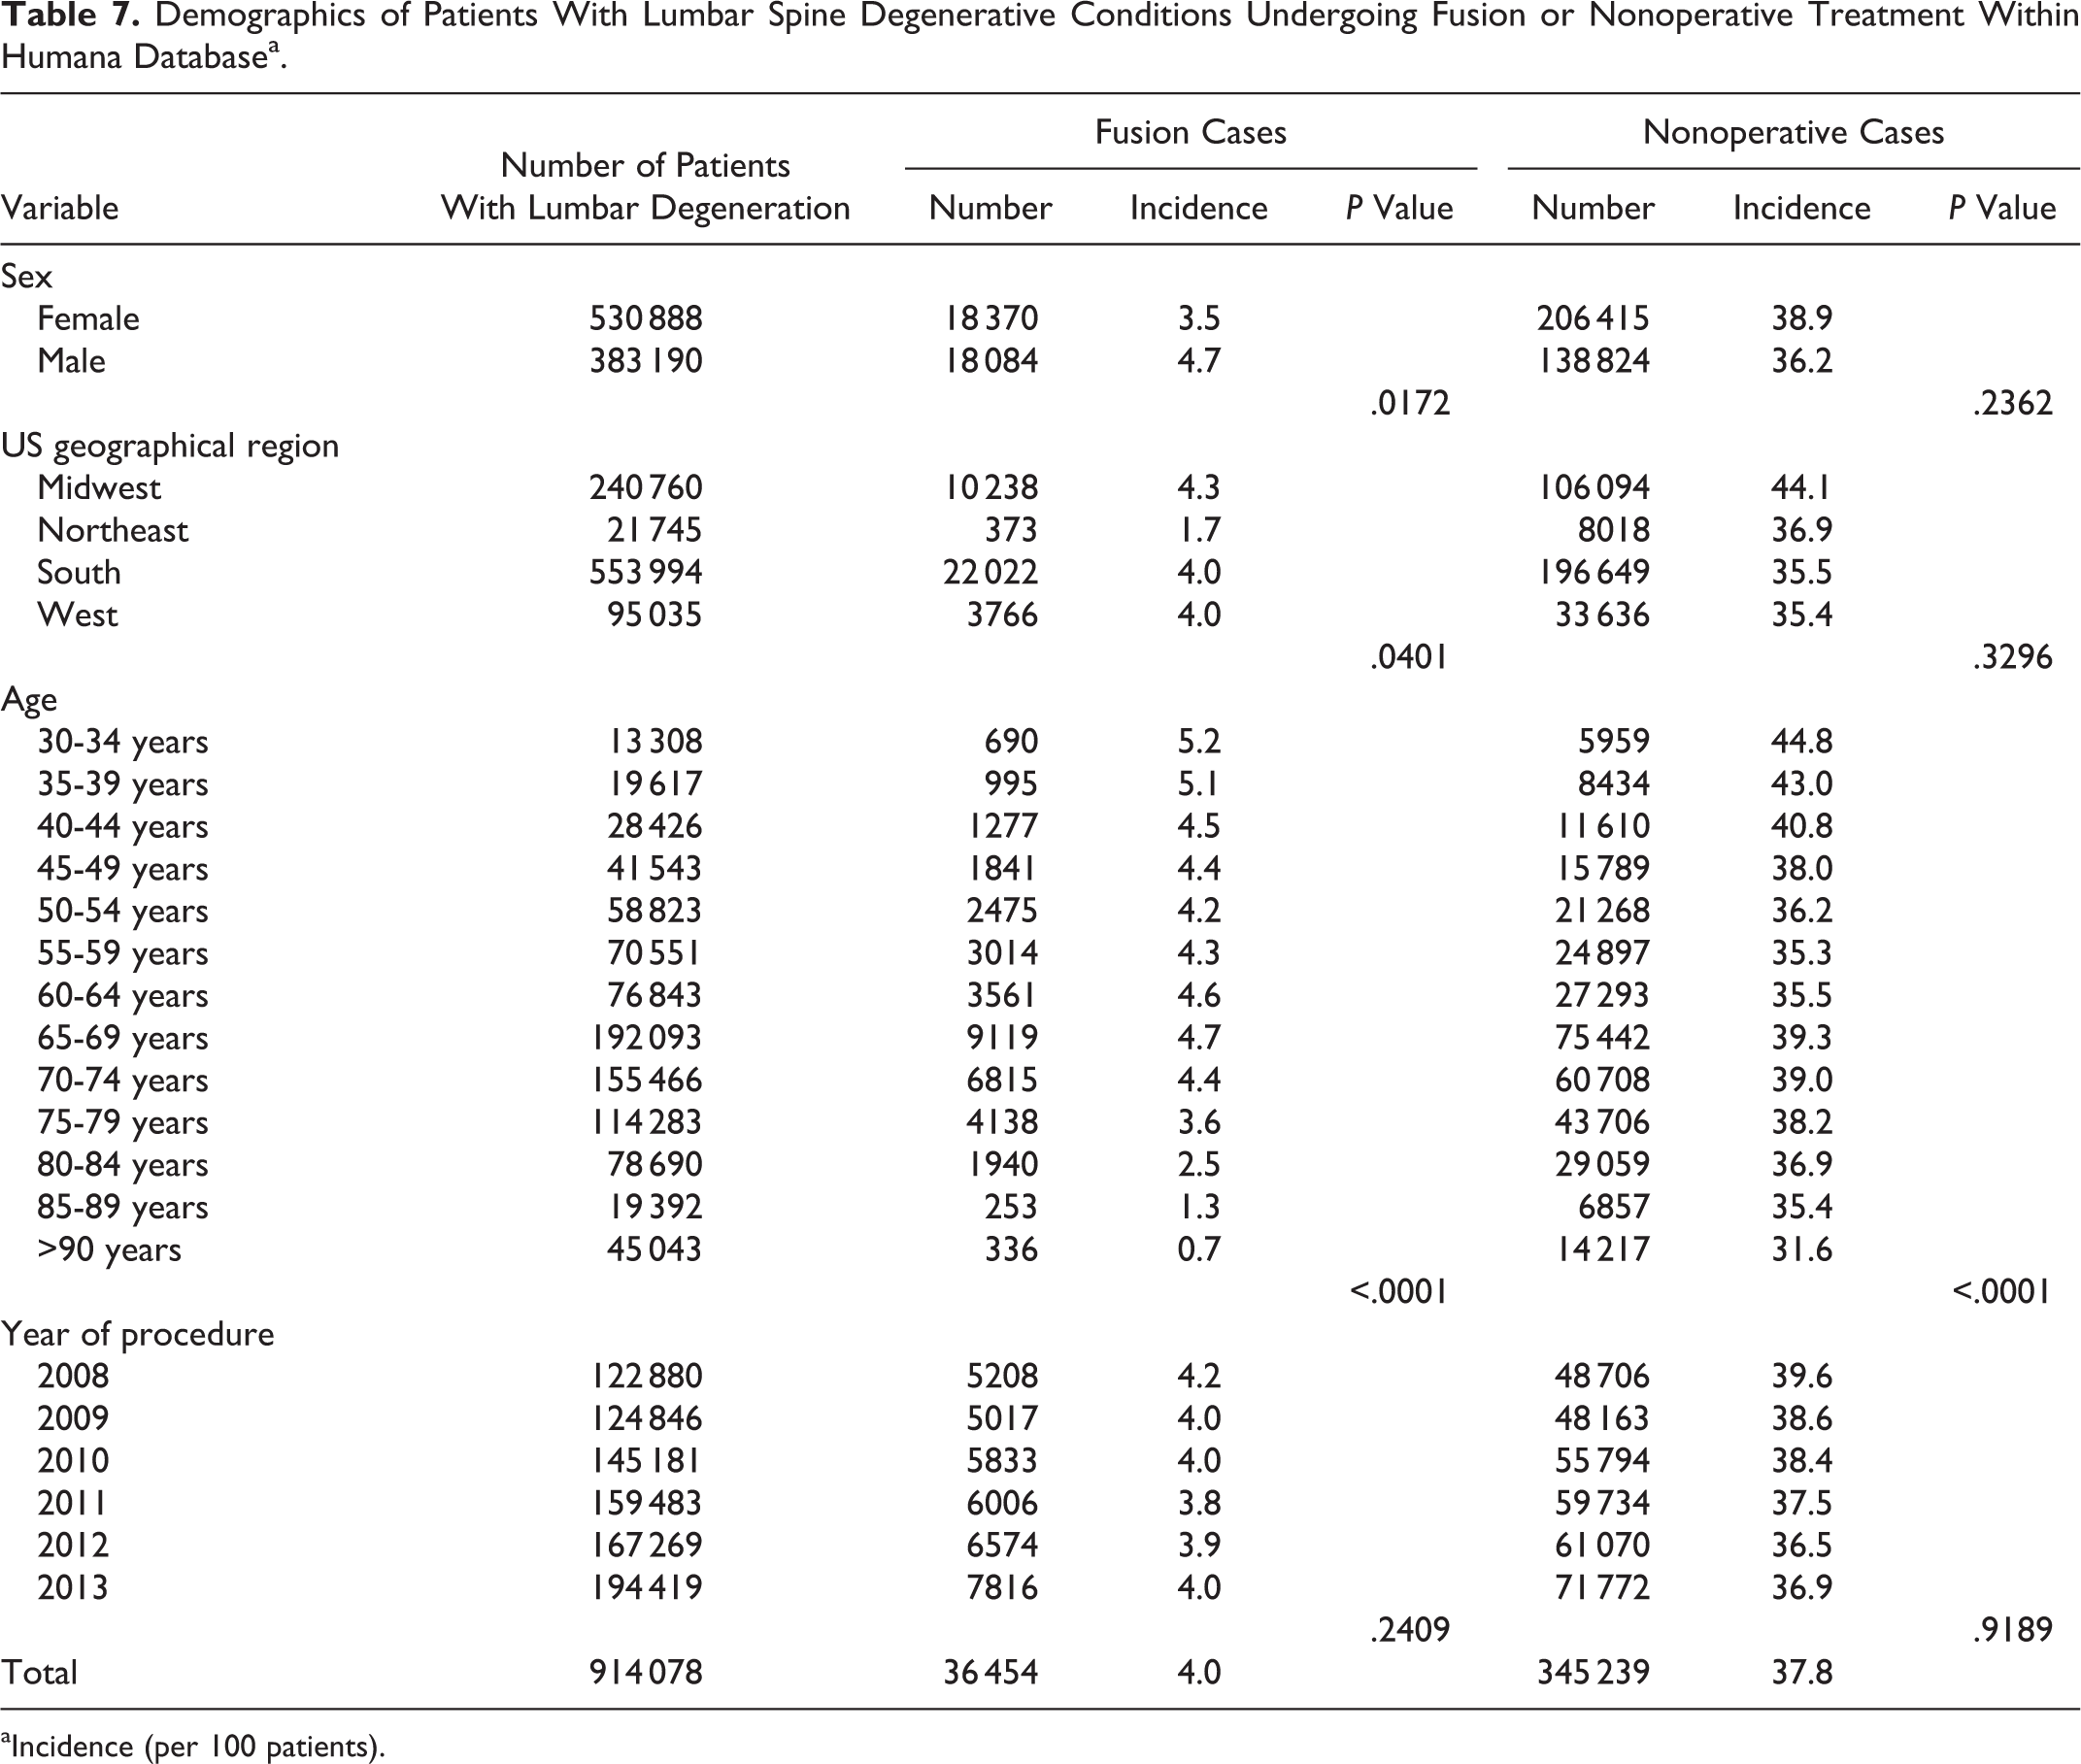
aIncidence (per 100 patients).
Changes in the Age Incidence for Diagnosis of Degeneration and Type of Treatment in Humana Database.
The Poisson regression significantly predicted the number of patients with lumbar degeneration while controlling for year, region, gender, and age (P < .0001), and model fit was excellent (R 2 = .966). Each variable was also individually predictive of the number of patients with lumbar degeneration (P < .0003; Table 6). The Poisson regressions significantly predicted the number of patients with lumbar degeneration who underwent fusion or nonoperative treatment while controlling for year, region, gender, and age (P < .0001), and model fits were moderate (R 2 = .597 fusion, R 2 = .603 nonoperative). For the fusion cohort, region, gender, and age were individually significant predictors of patient counts (P < .0401; Table 7). For the nonoperative cohort, only age was individually a predictor of patient counts (P < .0001; Table 7).
Cervical
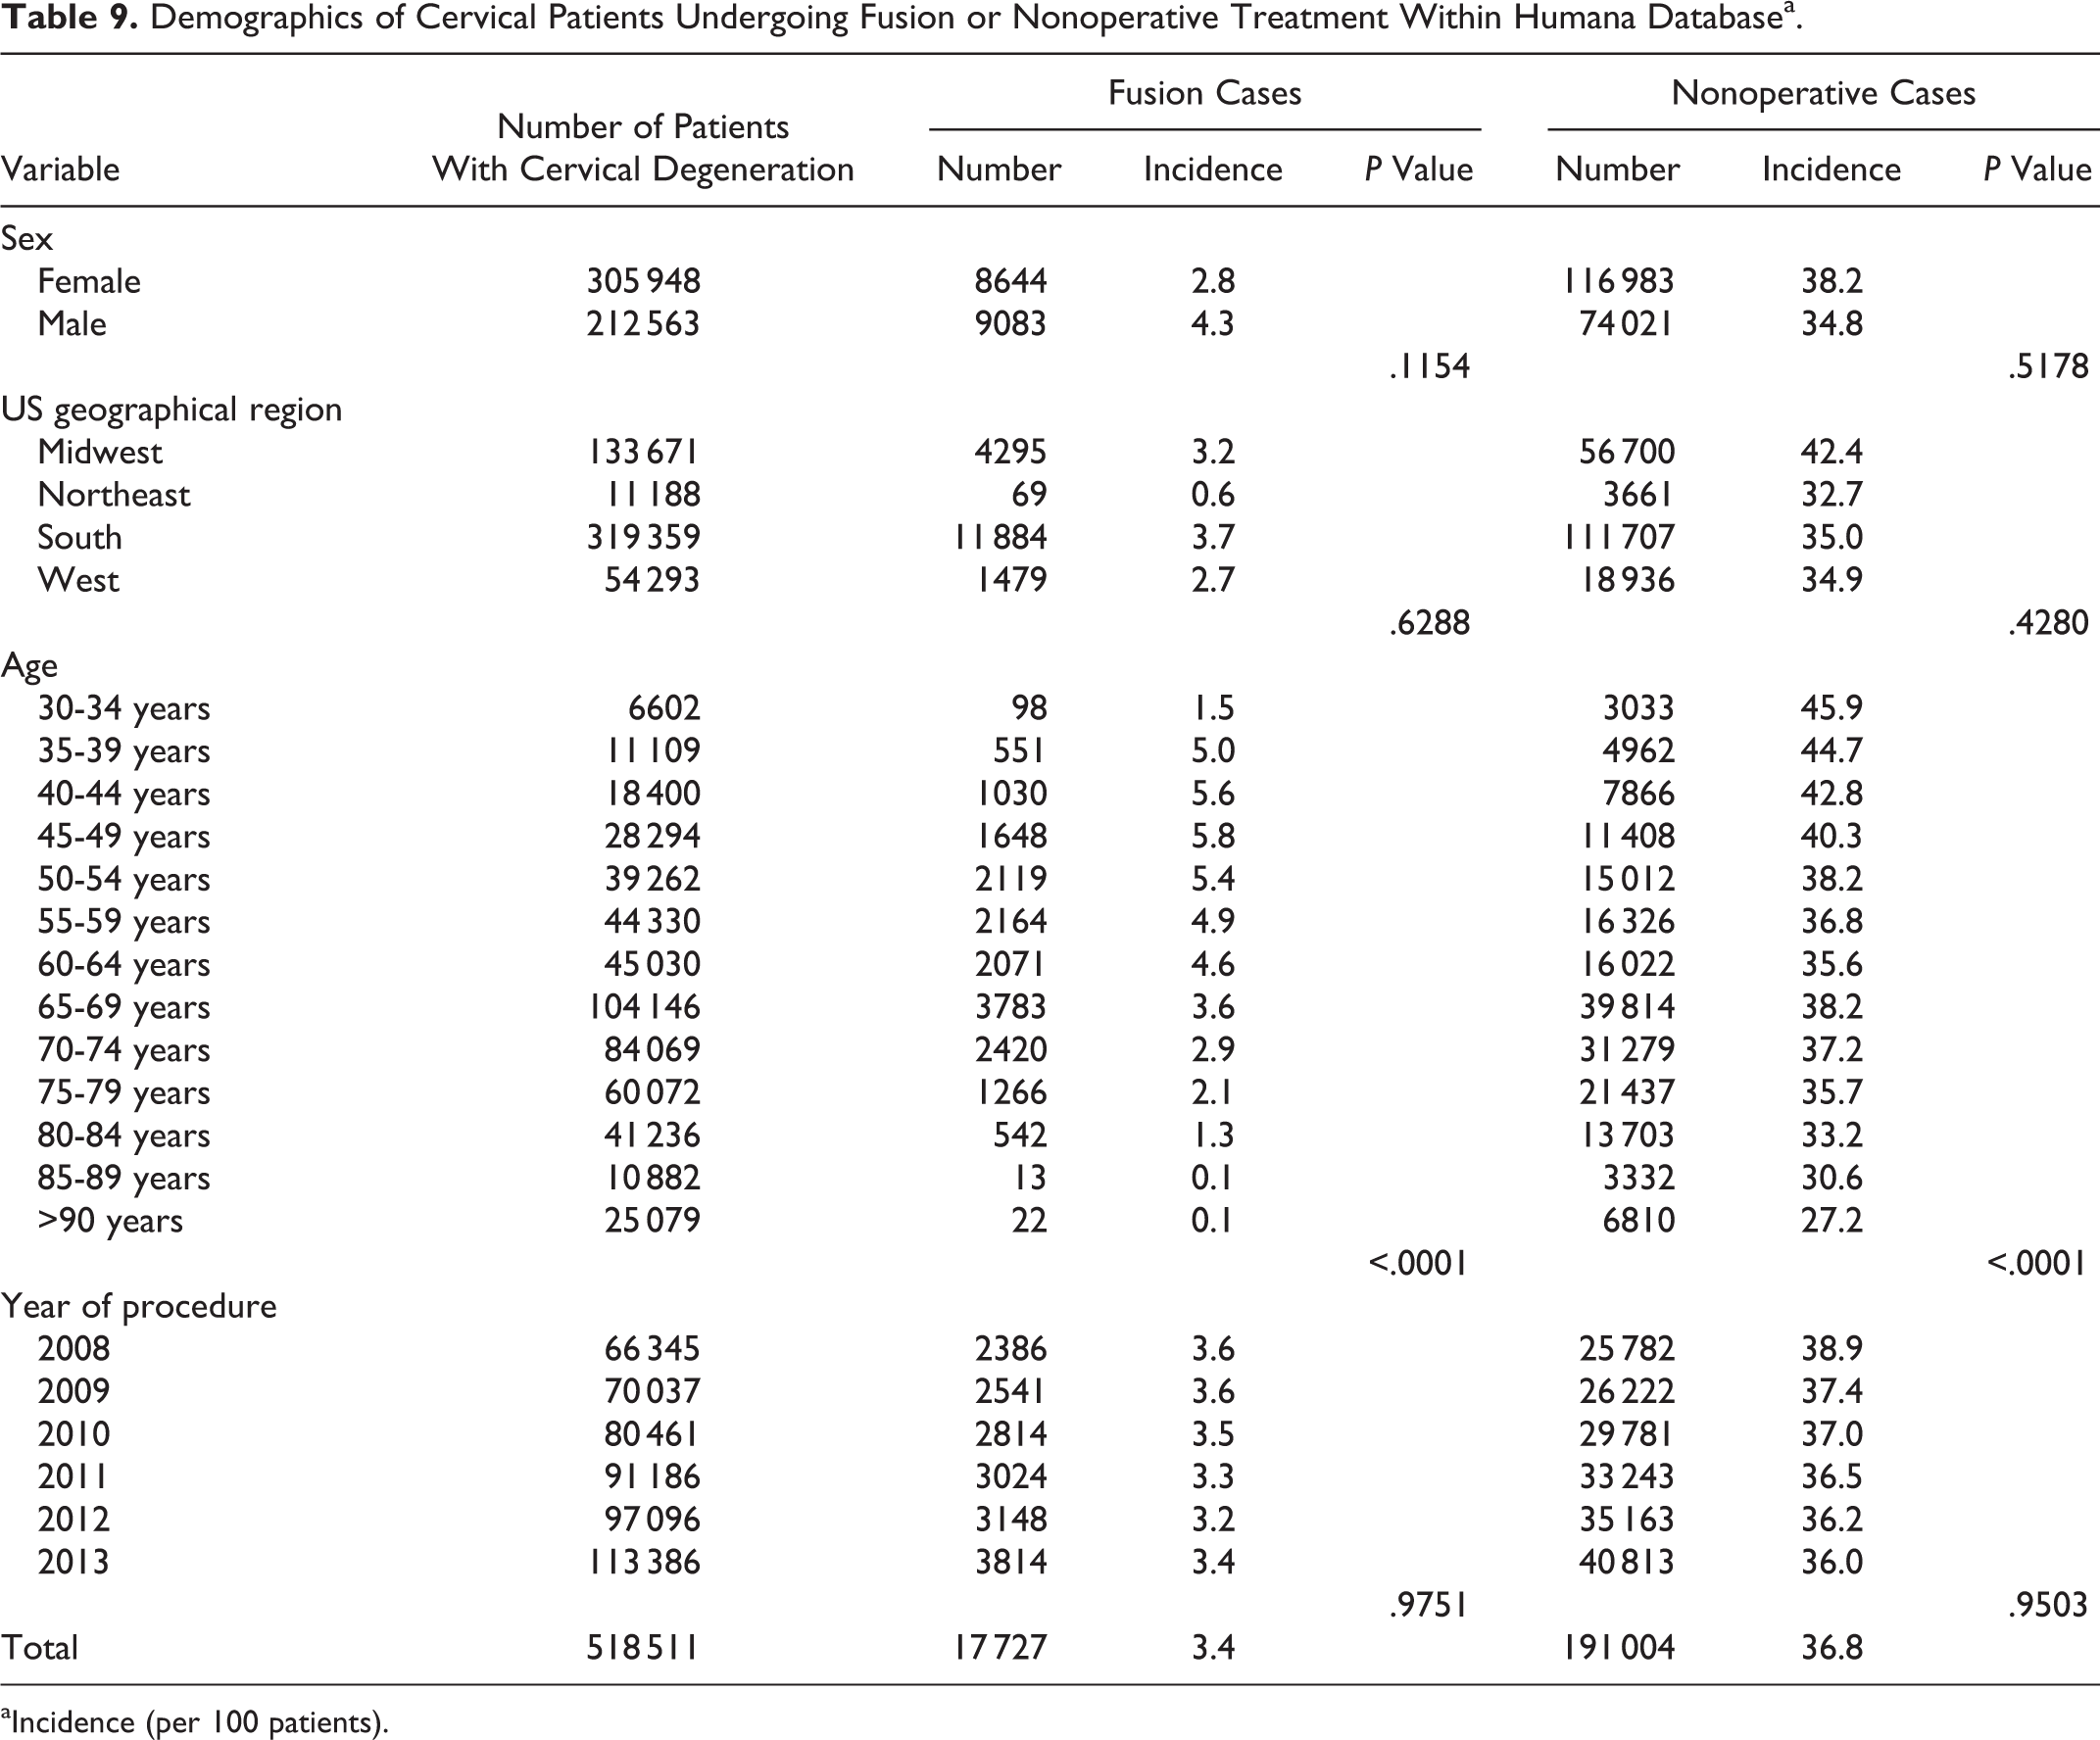
From 2008 to 2014, there were 660 721 patients diagnosed with a cervical degenerative condition. There was a constant increase with each year, with 2014 having 42% more patients with a diagnosis of cervical degeneration than in 2008 (Table 6). Fusion was performed in 3.4% of the patients and conservative treatment in 36.8% (Table 9). Although females had a higher incidence of diagnosed cervical degeneration (15.7 per 1000 patients) and nonoperative treatments (38.2 per 100 patients), males had a higher incidence of fusions (4.3 per 100 patients; Table 9). The South and Midwest regions had the highest number of patients for all 3 variables (Tables 6 and 9). The greatest number of diagnosed cervical degenerative conditions occurred in the 65 to 69 year olds, followed by 70 to 74 year olds (Table 6). Similar trends were also seen for the fusion and nonoperative variables. Although the overall number was greatest in 65 to 69 year olds, 45 to 49 year olds and 30 to 34 year olds had the highest incidence of fusion and nonoperative treatments, respectively (Table 9). Between 2008 and 2014, patients greater than 45 years of age had an overall increase in the number of diagnosed cervical degenerative conditions, with 80 to 84 year olds having the greatest increase of 73%. Similarly, patients 80 to 84 years of age had 153% more fusions and 24% more conservative treatments between 2008 and 2013 (Table 8).
Demographics of Cervical Patients Undergoing Fusion or Nonoperative Treatment Within Humana Databasea.
aIncidence (per 100 patients).
The Poisson regression significantly predicted the number of patients with cervical degeneration while controlling for year, region, gender, and age (P < .0001), and model fit was excellent (R 2 = .955). Region, age, and year were individually significant predictors of the number of patients with cervical degeneration (P < .0001; Table 6). The Poisson regressions also significantly predicted the number of patients with cervical degeneration who underwent fusion or nonoperative treatment while controlling for year, region, gender, and age (P < .0001), and model fits were moderate (R 2 = .655 fusion, R 2 = .536 nonoperative). For both the fusion and nonoperative cohorts, only age was individually a predictor of patient counts (P < .0001; Table 9).
Discussion
Lumbar and cervical conditions have been diagnosed and treated for many decades. In the past 20 years, there has been immense development and improvement in surgical techniques, implants, and instrumentation. At the same time, advanced imaging studies and an enhanced understanding of biomechanics have provided surgeons with better data to diagnose spinal conditions, giving an improved foundation from which to decide on a treatment option.
In our Medicare and Humana database study, we observed an overall increase in the diagnosis of both degenerative lumbar and cervical conditions, followed by an increase in the number of lumbar fusion treatments within the Medicare database and certain age groups. A recent study done by the Global Burden of Disease reported incidence, prevalence, and YLD for the most common and chronic disease and injuries worldwide between 1990 and 2013. 1 The top cause of worldwide YLD in both 1990 and 2013 was low back pain, with a stunning 57% increase in 2013. Neck pain was the fourth leading cause in both Global Burden of Disease reporting years with a 54% increase in 2013 compared with 1990. When stratified by location, low back pain was also the leading cause of YLD in the United States. 1 In our study, we found an increase of 33% for lumbar and 42% for diagnosed cervical degenerative conditions between 2008 and 2014 within the Humana database. Starting after 2008, there was also an increase in cervical diagnosis among Medicare patients, but the lumbar trends fluctuated between the years studied.
Cowan and coworkers reported an over 100% increase in fusion procedures from 1997 and 2003, with spine fusions being the 19th most performed surgical procedure in 2003. 11 Along these lines, Weinstein et al found almost a 20-fold increase in fusion rates between 2002 and 2003 among Medicare beneficiaries. 9 In our 2006 to 2012 Medicare population, we observed an 18% increase in lumbar fusion procedures in patients who were diagnosed with degenerative disc disease. Cowan and coworkers found that most of the cervical fusions were performed in 40 to 59 years age group of patients between 1993 and 2003. 11 At the same time, a study focusing on anterior cervical discectomy and fusion found that the highest increase in the number of fusion procedures was in patients ≥65 years of age between 1990 and 2004. 12 Furthermore, the age group >85 years had the highest cervical fusion incidence in the period between 2000 and 2004. Our data aligns with these reports. In our study, annually, cervical fusion was the most common in those aged <65 years (Medicare) and 40 to 49 years (Humana). However, the highest shift in cervical fusions between 2008 and 2013 was in the age groups 80 to 84 years (153%) and 70 to 74 years (23%, Humana). Improvements in the procedures and postoperative care can be one of the factors contributing to such a dramatic increase in the older population. 12 When lumbar fusion trends were reviewed, the age profiles matched the cervical data. Similarly, studies on fusion trends in the United States between 1993 and 2001 found that the highest annual incidences of lumbar fusion were in those patients aged >60 years. 4,11 Furthermore, within our data set, the private insurance carrier, Humana, experienced a greater increase between 2008 and 2013 than Medicare between 2006 and 2011.
With regard to nonoperative treatments, our data showed a decrease in the number of patients for both lumbar and cervical spine. The scientific/surgical community has been divided on the effect of various conservative treatments for degenerative spine conditions of the neck and low back pain. Some of the critical elements in decision making are patient symptoms, disease severity, comorbidities, and need for surgery. In a systematic review, Carreon et al found that, for spondylolisthesis and degenerative disc disease, patients undergoing fusion had better improvements than nonsurgical patients. 13 At the same time, Todd reported that patients with axial neck pain or cervical radiculopathy seemed to benefit from nonoperative treatments. 14 However, patients with myelopathy related to cervical degenerative disorders fail to respond to conservative treatments. 15 In line with these studies, Simotas and coworkers reported that among patients with lumbar spondylolisthesis who underwent nonoperative treatments, 18% had undergone surgery and, subsequently, 39% had worse symptoms or no improvements after 3 years. 16
Regional trends in spine treatment have been attributed to very intricate correlations between parameters such as surgeon density, type of medical institution, treatment preference, surgeon education, and several others. 17,18 There is a large body of literature on national trends for various spinal conditions and treatments for various time periods. 9,19 –22 In our study, the South region had the highest rate of diagnosis and procedures. In a study on cervical discectomy and fusion performed between 1990 and 1999, Angevine and coworkers found that most of the fusions were performed in the South. 19 Similarly, Pannell et al found that the highest overall fusion rates were in the South and Midwest. 21 Our results are in agreement with these previous studies, as we found that the Northeast region, for the most part, had the lowest rates. Providers’ presence could potentially contribute to our regional trends, as approximately 53% of the patients within Humana were in the South. However, our statistical analysis controlled for regional variation. Previous studies have pointed out that physician training and experience might contribute to regional variations. 18 Irwin et al found that orthopedic surgeons would more often opt for fusion compared to neurosurgeons, for the same clinical case. 18 In 2010, based on the census regions within the United States, the South and the Northeast had the highest number of physicians. The number of orthopedic and neuro surgeons was 8768 and 2098 (South) and 5354 and 1152 (Northeast), respectively. 23 Differences in number and type of specialty might contribute to the trends, as well as the provider presence in the South region, but additional factors could potentially be related to associated regional differences.
The age distribution was well in line with previous studies. 21 We found that female patients had more nonoperative treatments, whereas male patients underwent more fusion procedures.
Limitations
Medical billing data and surveys are the most commonly used tools to evaluate the severity of spine conditions and treatment outcomes, offering advantages and disadvantages. A survey’s main disadvantage is recall bias, which can have an important consequence in the spine field, given the difficulty associated with diagnosing many conditions. Studies have shown that there is a drastic difference between the 2 methodologies, billing data versus surveys, when it comes to analyzing the incidence trends of low back pain, with surveys reporting up to 40% and database studies up to 15% prevalence of low back pain. 8,24 As any database study relying on the ICD9 and CPT codes, we are able to obtain only certain demographics and patient outputs without being able to definitively find the causality for the observed trends. In addition, there can be inherent error in recording as a dependence on physician coding for diagnosis and treatment can be flawed. Another limitation with database studies is that each insurance data set represents a cross-section of their patients and not the overall national trend. However, by including both Medicare and Humana databases, our data provides a realistic overview of the current state of diagnosed spine degenerative conditions and treatments, with the trends being in agreement between both sources.
Despite those limitations, our data sheds light on the current trends in spine care. There is still a burning requirement to optimize the spine care for the elderly and people in their prime work age to lessen the current national economic burden.
Footnotes
Declaration of Conflicting Interests
The author(s) declared the following potential conflicts of interest with respect to the research, authorship, and/or publication of this article: ZB—Xenco Medical (consultancy), AO Spine (consultancy, past). JCW—Royalties: Aesculap, Biomet, Amedica, Seaspine, Synthes; Stock Ownership: Fziomed; Private Investments: Promethean Spine, Paradigm spine, Benevenue, NexGen, Vertiflex, electrocore, surgitech, expanding orthopaedics, osprey, bone biologics, curative biosciences, pearldiver; Board of Directors: North American Spine Society (non-financial, reimbursement for travel for board meetings, courses, etc.), North American Spine Foundation (non-financial), Cervical Spine Research Society (non-financial, reimbursement for travel for board meetings), AO Spine/AO Foundation (honorariums for board position); Fellowship Support: AO Foundation (spine fellowship funding paid to institution). RG-US Food and Drug Administration, Paid Consultant, 2010–2020. American Academy of Orthopaedic Surgeons, Chairman Biomedical Engineering Committee, 2016-2018. ASTM Intl., Co-Chairman F04.25 Spinal Devices Committee, 2016-present. Ziehm Imaging GmbH, Paid consultant, November 2016–present. Simplify Medical, Paid consultant, July 2016–present. icotec AG, Paid consultant, July 2016–present. Intrinsic Therapeutics, Paid consultant, June 2016–present. Medacta USA, Paid consultant, June 2016–present. Cytonics Inc., Unpaid consultant, Former paid consultant, Stockholder, January 2010–present.
Funding
The author(s) received no financial support for the research, authorship, and/or publication of this article.