
Abstract
Antidepressant discontinuation increases the risk of experiencing depressive symptoms. In a repeated single-subject design, we tested whether transitions in depression were preceded by increases in actigraphy-based critical-slowing-down-based early-warning signals (EWSs; variance, kurtosis, autocorrelation), circadian-rhythm-based indicators, and decreases in mean activity levels. Four months of data from 16 individuals with a transition in depression and nine without a transition in depression were analyzed using a moving-window method. As expected, more participants with a transition showed at least one EWS (50% true positives; 22.2% false positives). Increases in circadian rhythm variables (25.0% true positives vs. 44.4% false positives) and decreases in activity levels (37.5% true positives vs. 44.4% false positives) were more common in participants without a transition. None of the tested risk indicators could confidently predict upcoming transitions in depression, but some evidence was found that critical-slowing-down-based EWSs were more common in participants with a transition.
Keywords
Major depressive disorder (MDD) is a severely debilitating condition affecting approximately 264 million individuals worldwide (World Health Organization, 2019). For this condition, the prescription of antidepressant medication is widespread and increasing in Europe and the United States (Gusmão et al., 2013; Pratt et al., 2017). Discontinuation of antidepressant use is often desired by patients for different reasons but raises the risk of increases in depressive symptoms (Geddes et al., 2003; Glue et al., 2010; Sim et al., 2016). Although there are a number of established risk factors from (group-based) epidemiological research for depression relapses and increases in depressive symptoms, such as comorbid psychopathology and negative cognitive styles (Buckman et al., 2018; Burcusa & Iacono, 2007), these effects might not always apply on an individual level (Hamaker, 2012; Molenaar, 2004; Zuidersma et al., 2020). Thus, there seems to be a clear lack of individual-based research to reveal within-persons risk quantifiers of increases in depressive symptoms following antidepressant discontinuation. Moreover, established risk factors do not yet convey much information about the timing of potential upcoming transitions in depressive symptoms in individual patients. This hinders clinical practice such that clinicians are yet unable to accurately monitor patient progress and potential risks of depressive symptoms returning during and shortly after medication discontinuation attempts.
Complex-dynamical-systems theory could aid in such personalized transition detection using an individual’s collected time-series data. This theory presumes a set of critical-slowing-down (CSD)-based early warning signals (EWSs) for a broad subset of dynamical systems that can identify whether a transition into another (mood) state is approaching in some dynamical systems (Scheffer et al., 2009). Near such a tipping point, we expect to find CSD, in which the return rate to equilibrium after minor disturbances goes to zero (Scheffer et al., 2009; Strogatz, 2018; Wissel, 1984). EWSs preceding critical transitions are assumed to be present in various systems, from ecological systems in which climate can change to global financial systems in which markets can deteriorate and collapse (Scheffer et al., 2009). EWSs are calculated as relatively straightforward statistical indices, such as variance, kurtosis, or autocorrelation at lag 1 (acf-1), which are expected to increase before the transition occurs and to peak somewhere around the transition moment (Biggs et al., 2009; Dakos, Carpenter, et al., 2012; Scheffer et al., 2009). These increases occur because when a system recovers more slowly from perturbations, its state spends more time away from the equilibrium.
In psychiatry, several studies have reported evidence that EWSs may precede transitions in depression (Helmich et al., 2022; van de Leemput et al., 2014; Wichers et al., 2016, 2020). In these studies, EWSs were examined in time-series data collected through the experience-sampling method (ESM, also known as ecological momentary assessment; Csikszentmihalyi & Larson, 1987). In this method, individuals fill out short questionnaires multiple times a day on mobile devices, such as smartphones. Although ESM time-series data can offer insight into how momentary affect develops over time, it can be relatively limited in the number of daily assessments. This is mainly due to studies having to balance the number of presented questionnaires against the potential burden for individuals having to fill out multiple questionnaires each day (van Genugten et al., 2020). This is why there is a need to investigate whether EWSs could be applied to certain types of time-series data, which are less burdensome to collect, such as actigraphy or accelerometer data (Kunkels et al., 2021). Moreover, by doing so, researchers could investigate whether the predictive capabilities of actigraphy-based EWSs can improve over those of ESM-based EWSs. Such actigraphy data on physical activity are anticipated to include relevant information for identifying transitions in depressive symptoms because the normal physical-activity pattern is expected to change when nearing such a transition. Actigraphy data are collected by having individuals continuously wear lightweight accelerometers, which can provide data in intervals from, for example, 60-s periods down to 1-s periods. Intensive longitudinal data are assessed (e.g., 1,440 measurements a day when using 60-s periods) without individuals having to put in any conscious effort (Kunkels et al., 2021).
Another advantage of using CSD-based EWSs on actigraphy time-series data is the established conceptual link between depressive symptoms and physical activity because psychomotor retardation is a key feature of MDD (Buyukdura et al., 2011). Although ESM is also based on a conceptual link between ESM and depression, the link between physical activity and depression might have a different pathway and thus could provide new information. Slowing down in MDD patients can be observed in gross-psychomotor movements, including diminished hand and leg movements (Sobin et al., 1998). In addition, it was found that patients who clinically improved showed significantly higher movement intensities after 4 weeks, whereas patients who did not improve did not show increased movement intensities (Todder et al., 2009). Thus, we expect to detect decreases in the mean level of physical activity, as measured by actigraphy, before an increase in depressive symptoms.
When investigating actigraphy time-series data, the interdaily stability (IS) and intradaily variability (IV) are commonly used nonparametric methods. Both are well-established circadian-rhythm variables and provide information about the stability and fragmentation of the circadian rhythm (van Someren et al., 1999; Witting et al., 1990). IS indicates the association between the circadian rhythm and external zeitgebers (stability). That is, IS indicates how stable the circadian rhythm is from day to day, and the higher the IS, the more stable the rhythm. IV marks the intensity and frequency of changes in rest and activity (fragmentation). IV thus indicates how much the circadian rhythm is fragmented within a day such that higher IV indicates a more fragmented and unstable circadian rhythm. Given their role in general actigraphy research, we hypothesize these quantifiers will also be highly informative in our sample. In contrast with the CSD-based EWSs, quantifiers such as IS and IV can be considered circadian-rhythm variables. Hence, preceding a transition toward increases in depressive symptoms, we would expect increased IS and decreased IV because it could indicate rigidity changes in the system, causing the system to have problems coping with external stressors. We also propose a third circadian-rhythm variable, acf-1440 (autocorrelation at lag-1440), a circadian variant of acf-1, which provides information about the autocorrelation of the actigraphy data over 1,440 minutes (24 hr). Because acf-1440 corresponds to roughly one circadian cycle, it is expected to carry information about the individual’s day-to-day activity levels and thus may be more informative than acf-1 in this case because it captures a longer and more circadian component of the time series than acf-1. This notion is further supported by earlier studies that investigated alternative autocorrelation lags, such as acf-720 (Kunkels et al., 2021). We expect acf-1440 to show an increase near transitions because measurements taken 24 hr apart are expected to become more alike.
Although there are a number of studies that have investigated depression using actigraphy (Difrancesco et al., 2019; Lemke et al., 1999; Minaeva et al., 2020; Raoux et al., 1994; Todder et al., 2009), most used only relatively short assessment periods of a number of days up to a few weeks. Such short-term periods are too short to fully capture the (gradual) discontinuation of antidepressant (tapering) periods, which involve several weeks or sometimes even months. Note that none of the actigraphy studies in MDD patients focused on within-persons changes in context-driven actigraphy-based indicators for upcoming increases in depressive symptoms following antidepressant discontinuation. To investigate potential quantifiers of upcoming transitions in MDD, a study design is required that allows researchers to investigate per participant whether changes in EWSs preceded upcoming transitions.
Therefore, in 25 single-subject time series, all obtained within the same Transitions in Depression (TRANS-ID) Recovery study (for the complete study protocol, see: https://osf.io/zbwkp), we investigated whether EWSs and context-driven risk quantifiers calculated over actigraphy data precede increases in depressive symptoms in individuals in remission who were discontinuing their antidepressant medication. We expected to detect in each of the single-subject time series before transitions in depressive symptoms (a) increasing CSD-based EWSs (variance, kurtosis, and acf-1), (b) increasing IS and acf-1440 and decreasing IV, and (c) decreasing mean levels of physical activity. In Table 1, an overview of CSD-based EWSs (variance, kurtosis, acf-1), circadian-rhythm variables (IS, IV, acf-1440) and mean level, and expected direction of effect are given. The reported variables were studied at the individual level, which allowed for examining of individual differences and whether the presence of EWSs can be replicated across individuals. The analysis of this study, including its hypotheses, was preregistered on the OSF (https://osf.io/dfmw3), and the complete study protocol is available online (https://osf.io/zbwkp).
Overview of Quantifiers and Expected Direction of Change to Identify an Upcoming Transition
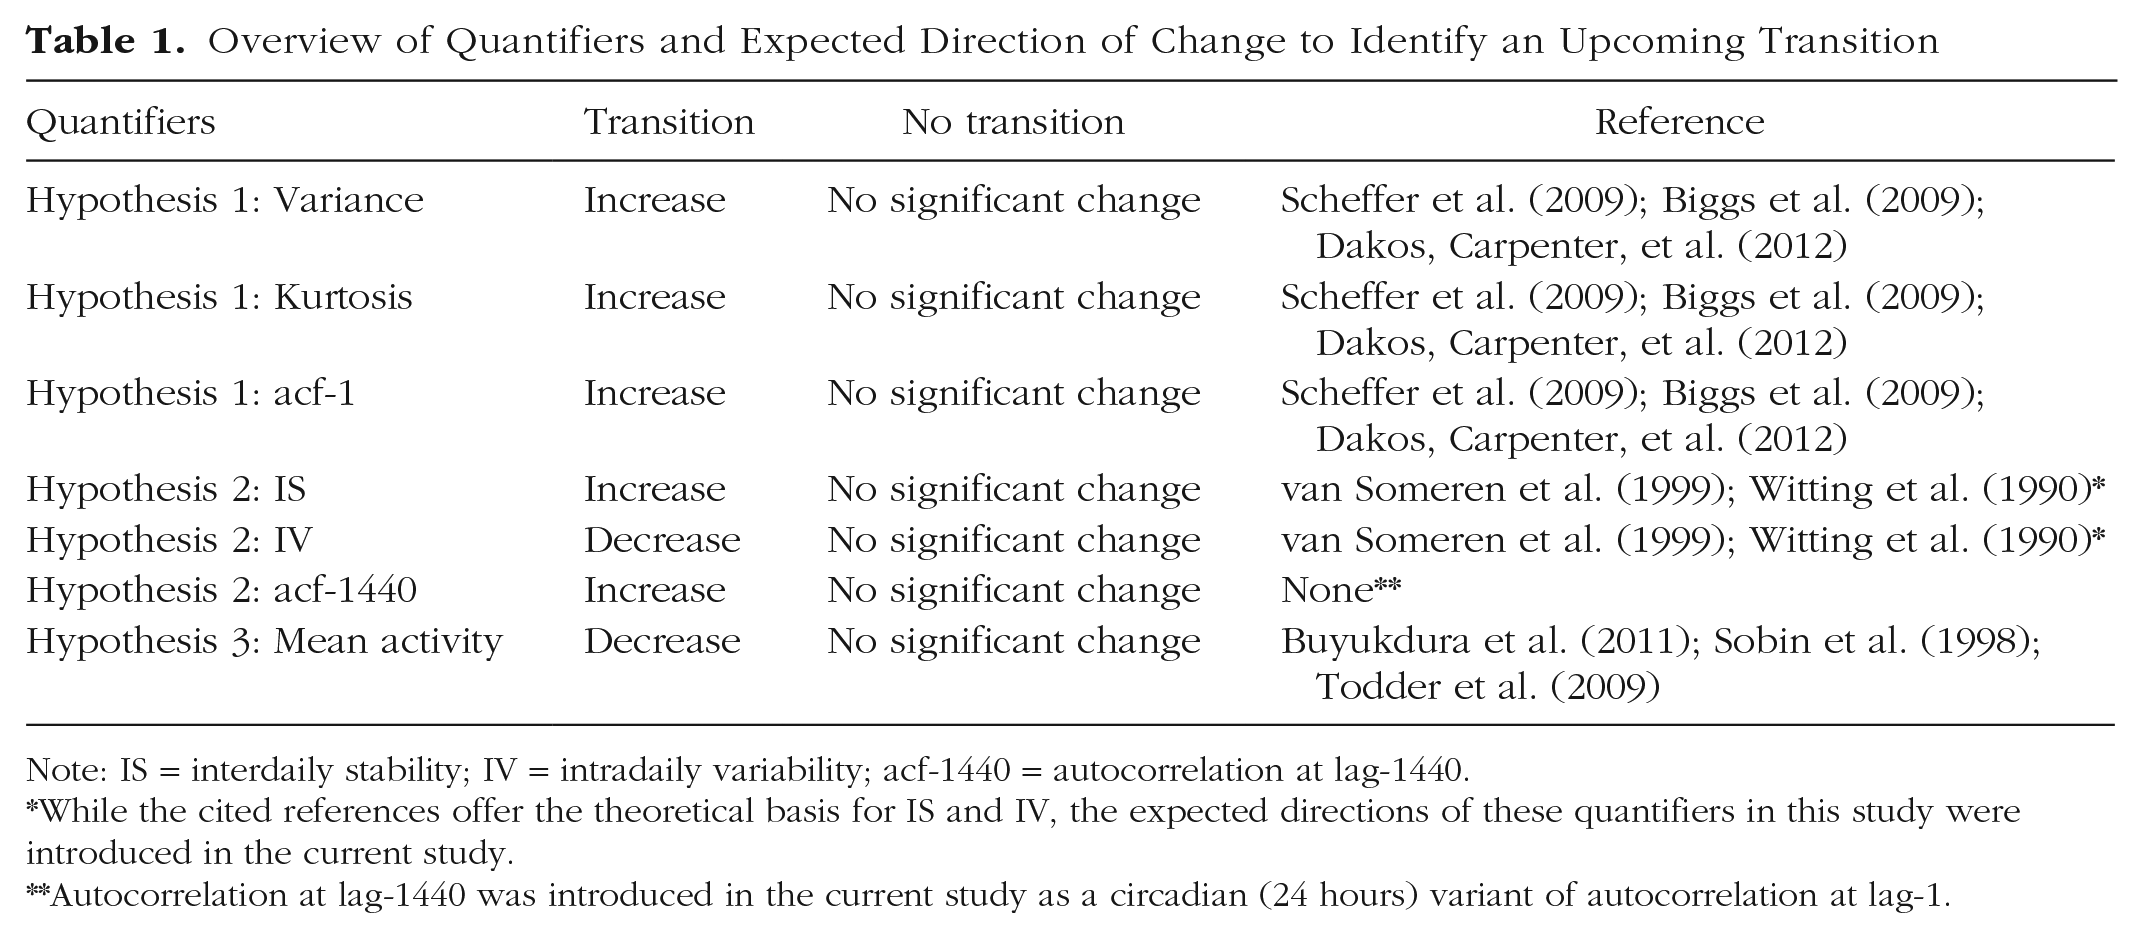
Note: IS = interdaily stability; IV = intradaily variability; acf-1440 = autocorrelation at lag-1440.*While the cited references offer the theoretical basis for IS and IV, the expected directions of these quantifiers in this study were introduced in the current study.**Autocorrelation at lag-1440 was introduced in the current study as a circadian (24 hours) variant of autocorrelation at lag-1.
Method
Sample
An overview of individual inclusion and exclusion is shown in Figure 1. Individuals were recruited through a pharmacy and online means. In total, 69 individuals were included in the study who fulfilled the criteria of a past diagnosis of MDD according to criteria from the fourth edition of the Diagnostic and Statistical Manual of Mental Disorders (DSM-IV; American Psychiatric Association, 1994). These formerly depressed individuals made a shared decision with their mental-health professionals to taper their antidepressant medication and did not meet the criteria for MDD at baseline. Of these individuals, 13 dropped out, and for five individuals, it was not possible to clearly define whether a transition toward higher levels of depression had occurred and were thus excluded. One participant was excluded because of technical issues causing actigraphy-data loss. Of the remaining 50 individuals, 31 did experience a transition in depressive symptoms, whereas 19 did not. Of participants with a transition, we excluded two individuals because of incomplete actigraphy data files, three individuals because their actigraphy time-series data had more than 7 consecutive days of missing data, five individuals because the transition occurred before or after the measurement period, and five individuals because there were fewer than 30 days of data before the transition, which would be not enough data to properly conduct the analyses. This period was doubled compared with the 14 days first described in our preregistration because we also doubled the window size from 7 to 14 days for our analyses. This increase is expected to maintain reliable calculation of the quantifiers while also maintaining the weekly periodicity of actigraphy data. Thus, the final sample included 16 individuals with a transition. Regarding the 19 individuals without a transition, one had to be excluded because of incomplete actigraphy data files, and nine had to be excluded because there were more than 7 consecutive days of actigraphy data missing. The final sample included nine individuals without a transition. Thus, the available final sample differed in size from that reported in the preregistration (https://osf.io/dfmw3). Further details on the used study protocol are available online (https://osf.io/zbwkp/).
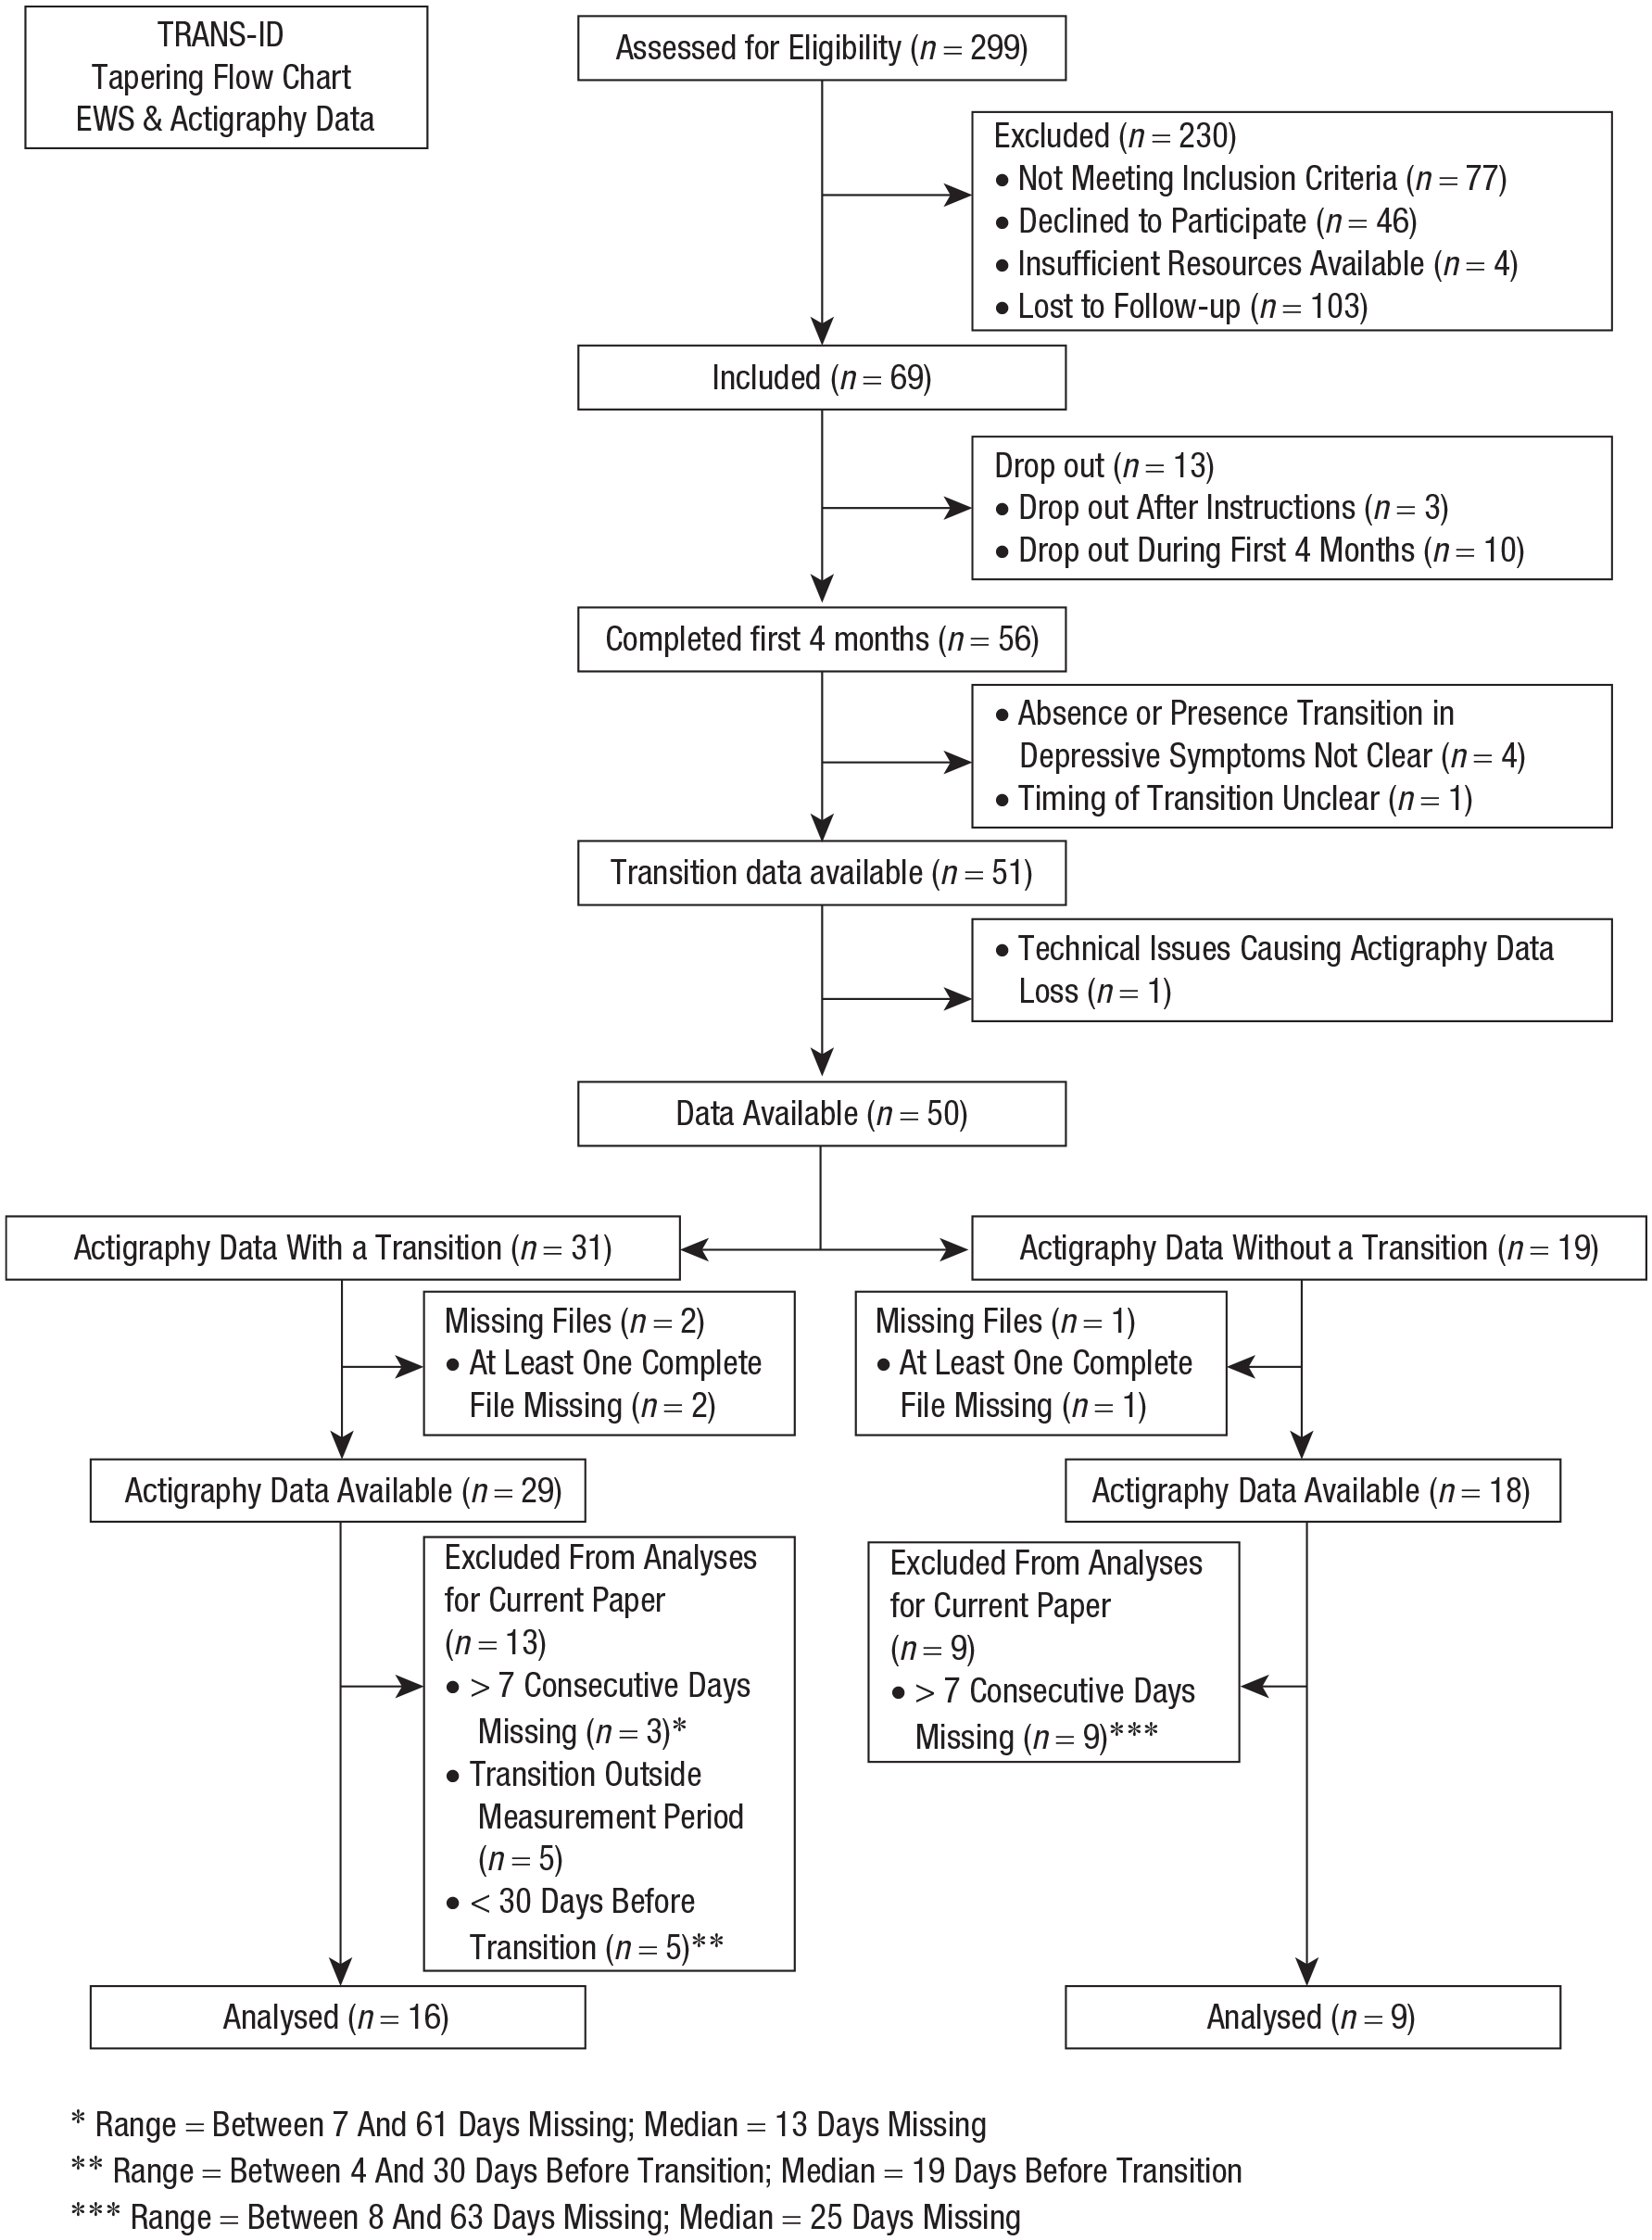
Flowchart Transitions in Depression (TRANS-ID) Recovery antidepressant discontinuation and actigraphy study.
The study was approved by the Medical Ethical Committee of the University Medical Center Groningen (METc2016.443). All patients were informed that they could stop their participation at any time and were asked to read and provide written informed consent before participation.
Actigraphy assessment
Physical-activity time-series data were collected with a wrist-worn MotionWatch 8 (MW8, CamNTech, Fenstanton, England) accelerometer. The MW8 was initialized to assess 60-s epoch lengths, and light detection and data compression were disabled. Individuals were instructed to continuously wear the MW8 and to remove the device only under rare conditions, such as sauna visits. Moreover, individuals were instructed to press the MW8 event-marker button to register the times at which the individual got out of bed and when the individual went to sleep. Because battery and memory capacity were valid for data assessment for 2 months, MW8 actigraphs were replaced halfway through the 4-month monitoring period. Participants received the first MW8 during a personal interview at the start of the monitoring period, and the replacement MW8 was sent through registered mail. These MW8 devices were initialized before sending them through postal services, and participants only had to switch the old MW8 for the new MW8 and return the old MW8 via postal services.
Actigraphy-data preprocessing
Activity-count data from the MW8 accelerometers were extracted with the native Motionware software (Version 1.2.28). Because we replaced the MW8 devices halfway through monitoring, the two actigraphy files assessed from each participant were merged before analyses. Although the native Motionware software offers the merging functionality, such straightforward merging led to the mismatched merging of files in the current application. Hence, three raters were employed to systematically merge these files. Files were visually checked on their activity and sleep patterns to provide optimal matches of files on the minute level. Missing data between files were imputed with zeroes to merge the two files into one continuous file because subsequent analysis software could not handle missing data. The imputation of data was done on only small-scale instances when it was required to merge multiple data files from one participant. In Table 2, a column is added to show the information on how much data were missing at maximum in relation to the size of the moving window. From these percentages, we infer that it is unlikely that the applied imputation strategies could have substantially tainted the analysis outcomes.
Performance of EWS, Calculated Over Participants’ Actigraphy Data, in Identifying Upcoming Transitions in Depressive Symptoms
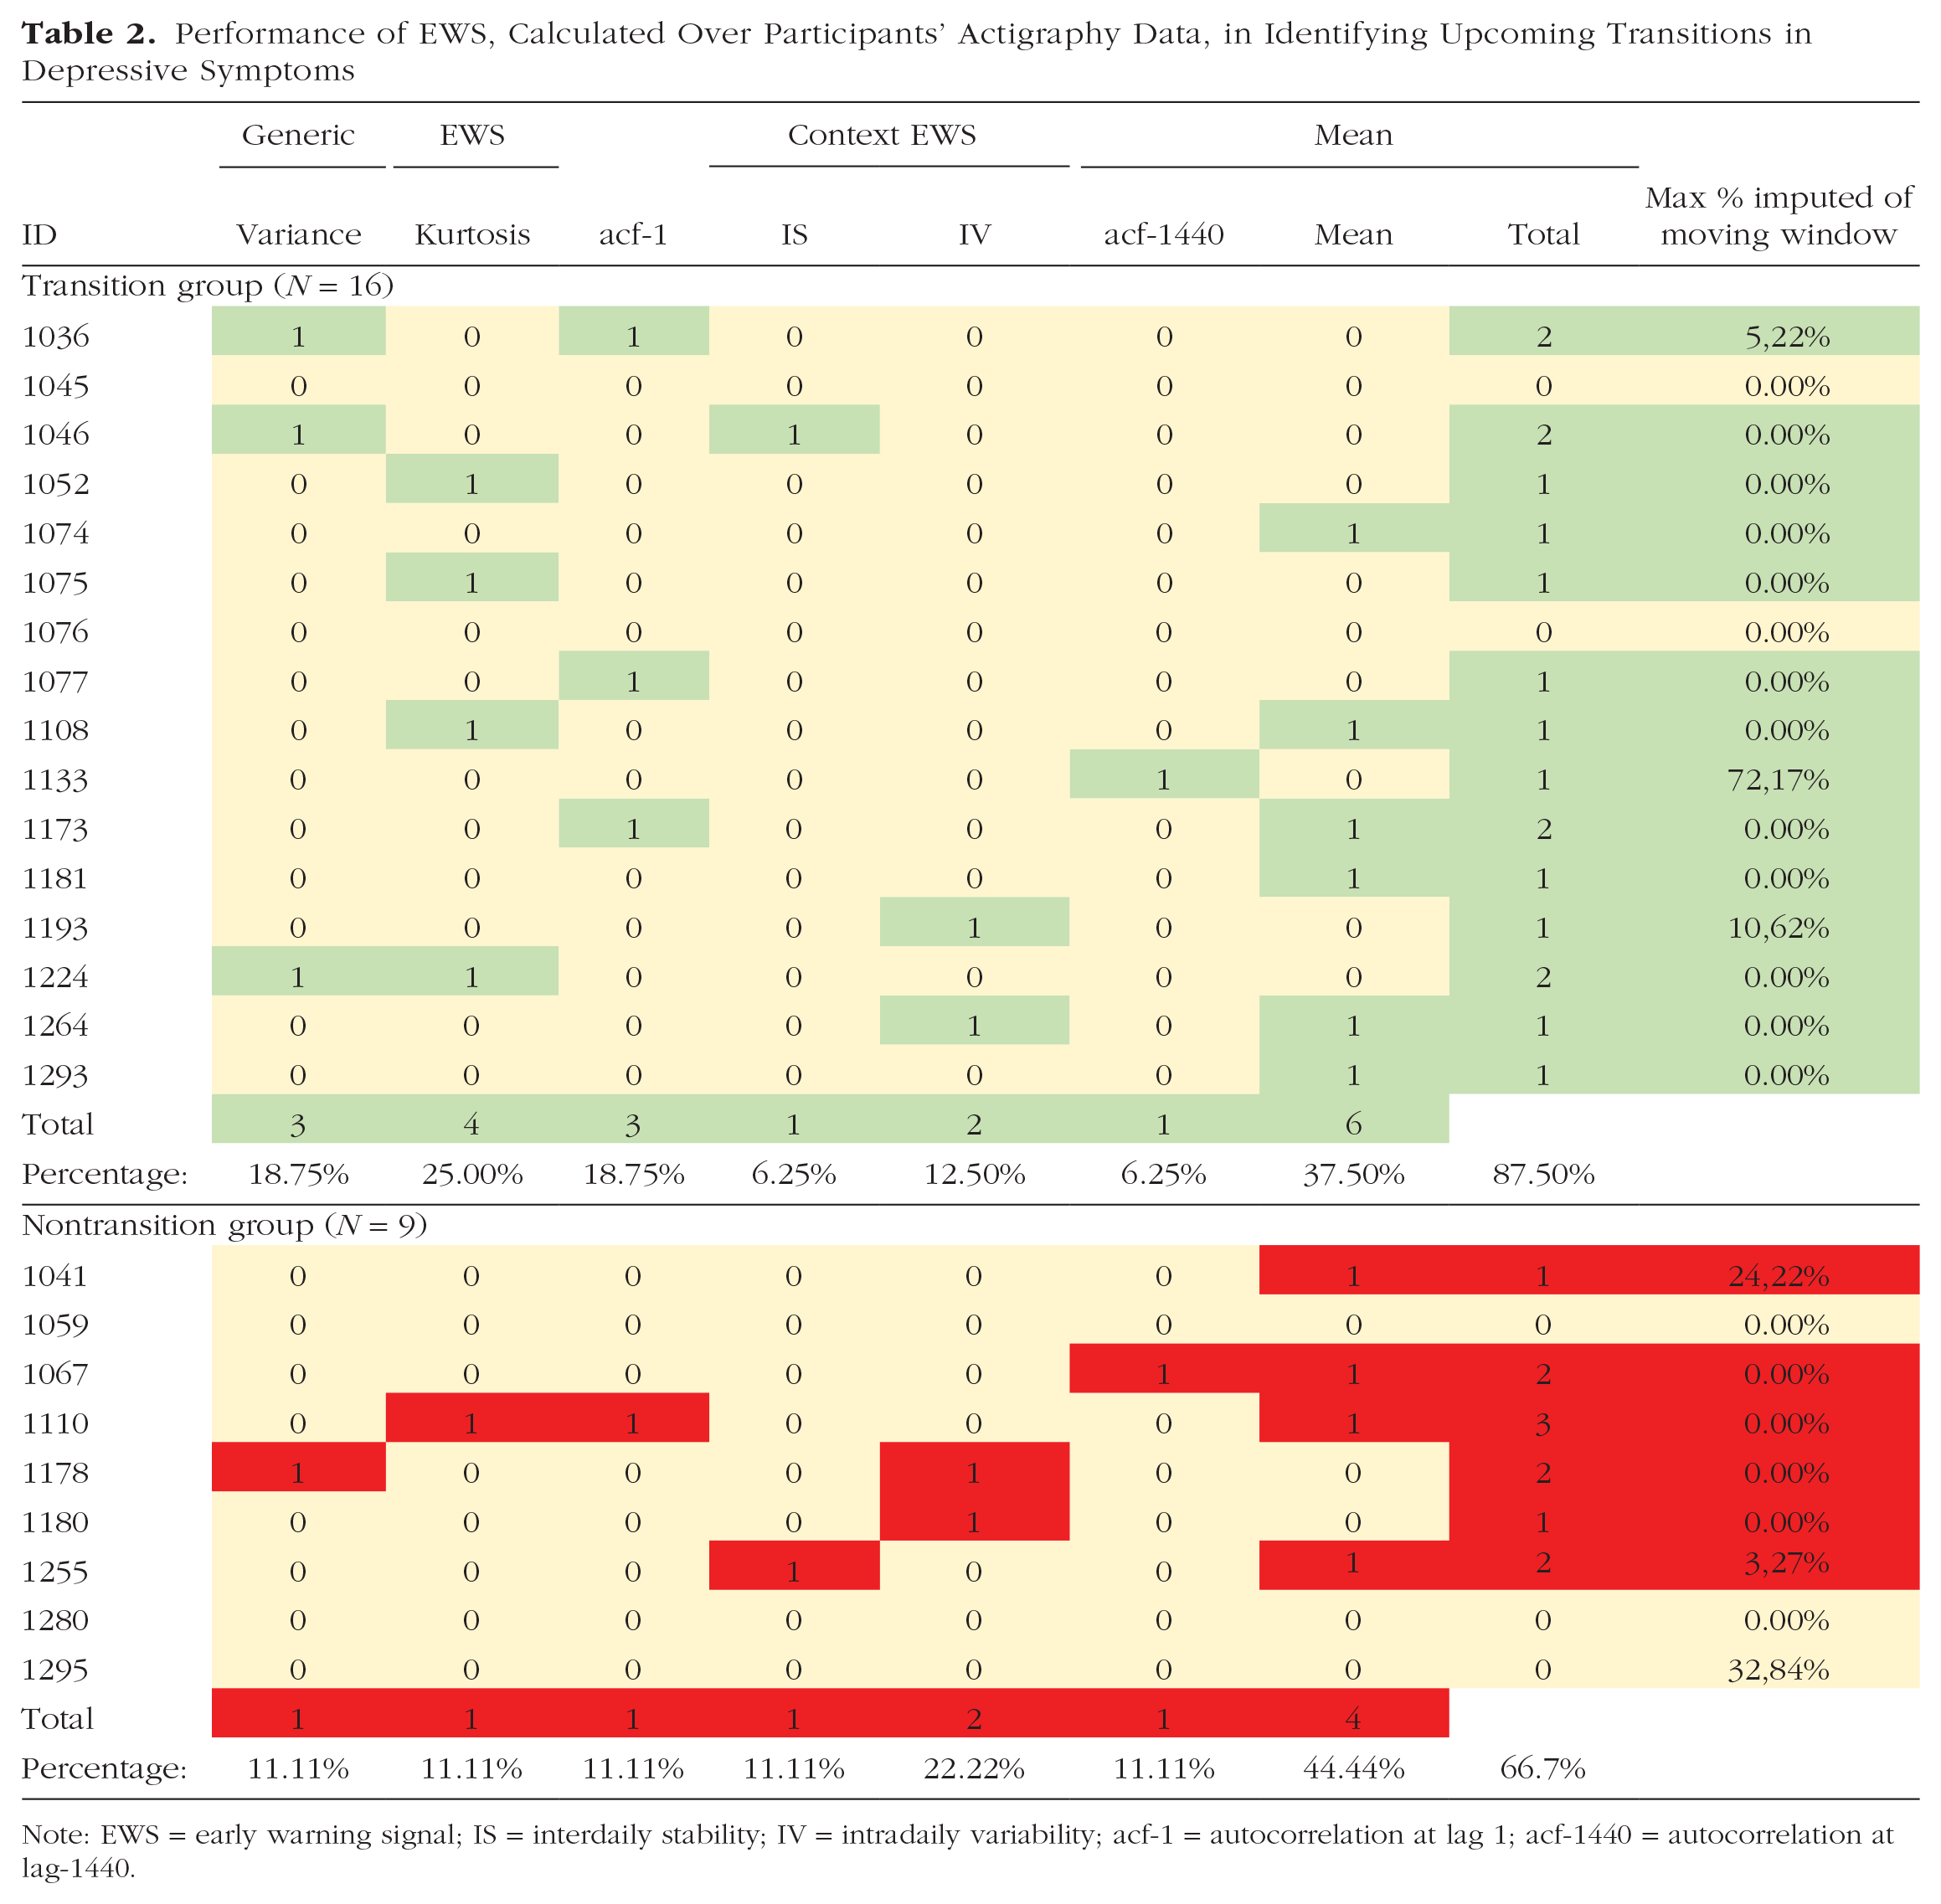
Note: EWS = early warning signal; IS = interdaily stability; IV = intradaily variability; acf-1 = autocorrelation at lag 1; acf-1440 = autocorrelation at lag-1440.
Transitions in depression
Transitions toward higher levels of depressive symptoms were defined using weekly Symptom Checklist-90 (SCL-90) depressive-symptom data, the evaluation interview, and other qualitative data (Smit, Snippe, et al., 2022). Patients had to fulfill a criterion of a reliable change (Jacobson & Truax, 1991) in depressive symptoms on the SCL-90 depression subscale, a criterion on the persistence of this depressive symptom increase, and a criterion on the clinically meaningful change as experienced by patients (qualitative consensus rating based on interviews and open-ended questions).
Actigraphy outcome variables
From the actigraphy data, the following outcome variables were calculated: (a) EWSs (variance, kurtosis, and acf-1), (b) circadian-rhythm variables (IS, IV, and acf-1440), and (c) mean physical activity. Comprehensive overviews of IS and IV calculation are described in more detail elsewhere (van Someren et al., 1999; Witting et al., 1990). Missing data were handled by the following exclusion criteria: when more data were missing than the moving-window analyses could process (e.g., when complete files were missing) or when more than 7 consecutive days were missing (details given inFig. 1).
Statistical analyses
To detect significant changes in the EWSs, modified Mann-Kendall (MK) tests (Hamed & Ramachandra Rao, 1998) were used because this method is better suited to deal with autocorrelation between consecutive windows than the normal MK test and is, therefore, less vulnerable to false positives. The MK trend test is a commonly used test in the literature on EWSs (Dakos, van Nes, et al., 2012). An advantage of the MK trend test is that it is better suited to detect nonlinear monotonic trends than a Pearson correlation. In addition, the Kendall correlation coefficient requires much fewer points than Pearson or Spearman’s correlation coefficients for detecting the same trend in data (Bonett & Wright, 2000). Because we expected some of the indicators to overlap, we employed the effective number of tests (Meff) method (Cheverud, 2001) to correct for multiple testing, which takes into account the cross-correlations between quantifiers, considering individual participants. For individuals with a transition, only data obtained before the transition were analyzed; for individuals without a transition, the full research period was analyzed.
Traditionally, a statistical test with a p value as an outcome parameter is used to detect a change in an EWS, and this significant change (p < pα) is expected to predict, or detect, a transition. We used the Meff method to adjust the standard pα of .05 to a lower lever (≈.02) to correct for multiple testing and correlations between EWSs. We used a single-sided test (change in the predefined direction, Table 1, pα applied to the upper side of the probability distribution only).
Calculating EWSs
The ACTman software package (Kunkels et al., 2020; see https://github.com/compsy/ACTman/) for R statistical software (Version 4.0.4; R Core Team, 2019) was used to preprocess the actigraphy data. The employed moving-window method spanned 14 days and was moved over the actigraphy data in 1-day steps. In the preregistration, a window size of 7 days was described. However, such short window sizes might lead to more variable estimates, which could also provide more unreliable EWS and risk-indicator estimations. To investigate whether there are substantial differences in study outcomes when choosing between a 14-day moving window and a 7-day moving window, we also performed the analyses in a 7-day moving window, the results of which are available in Table S6 in the Supplemental Material available online. No substantial difference was found herein.
Results
Descriptives
Of the 16 participants who did experience a transition, the mean age was 51.3 years (range = 27–67), and 87.5% were female. Of the nine participants who did not experience a transition, the mean age was 44.8 years (range = 25–61), and 77.8% were female.
CSD-based EWS
The results on the CSD-based EWS quantifiers are given in Table 2. Significant increases in variance preceded transitions in three individuals (18.8% true positives; 11.1% false positives). Significant increases in kurtosis preceded transitions in four individuals (25.0% true positives; 11.1% false positives). Significant increases in acf-1 preceded transitions in three individuals (18.8% true positives; 11.1% false positives), one of whom also showed an increase in variance. Thus, in eight out of 16 individuals (50.0%) with a transition, at least one CSD-based EWS preceded the transition (i.e., true positives). Regarding the nine individuals who did not experience a transition, two of them (22.2%) falsely showed significant increases in at least one EWS (i.e., false positives). Here, kurtosis and acf-1 both showed a false positive in the same individual, whereas variance showed a false positive in one other individual.
Circadian-rhythm variables
Results in the circadian-rhythm variables are given in Table 2. Significant increases in IS were found to precede a transition in one individual (6.3% true positives; 11.1% false positives). Significant increases in IV were found to precede a transition in two other individuals. (12.5% true positives; 22.2% false positives). Significant increases in acf-1440 were found to precede a transition in another individual (6.3% true positives; 11.1% false positives). In 16 individuals with a transition, four participants showed increases in circadian-rhythm variables in the period before the transition (25.0%). Regarding the nine individuals who did not experience a transition, four (44.4%) incorrectly showed significant increases in at least one EWS (i.e., false positives, indicating that false positives were more common than true positives among the investigated circadian-rhythm variables).
Mean levels
When investigating whether decreases in the mean levels of physical activity precede transitions in depression, we found six such decreases in the 16 individuals (37.5%) with a transition (true positives; see Table 2). However, we also found four decreases in mean activity in the nine individuals (44.4%) without a transition (false positives). This indicates that false positives were more common among the investigated mean levels than true positives.
Post hoc analyses
In our preregistered analysis plan, we described tests on the expected direction of effects. However, because we observed during analysis that many EWSs showed substantial changes in the unexpected direction, we decided to also perform post hoc analyses using two-sided tests. In other words, it seemed that the performance of some EWSs may be improved by excluding the predicted direction of the effect, albeit at a higher false-positive rate. ROC curves were calculated post hoc and plotted to investigate the true-positive-rate and false-positive-rate characteristics of the EWSs and circadian-rhythm variables. ROC curves show the true-positive rate (sensitivity) against the false-positive rate (Egan, 1975; Fawcett, 2006). A description of the receiver operating characteristic (ROC) curves is given in S1, the ROC curves are shown in Figure S2, and the results are given in Table S3, all in the Supplemental Material. Here, one can observe that the two-sided tests mostly outperformed the one-sided tests. Regarding individual EWSs, the two-sided plot for kurtosis and IV runs close to the top-left corner of their respective ROC-curves in Figure S2. This can be interpreted as that these EWSs performed relatively well in preceding transitions while not suffering as much from giving false positives. A description hereof is given in S4, and the corresponding results are given in Table S5, both in the Supplemental Material. Here, the number of true positives for the two-sided test was that 15 out of 16 unique transitions were preceded by a significant change in at least one EWS (93.75%; instead of 14 out of 16, 87.5%, described for the one-sided tests above). Unfortunately, the false-positive rate also increased substantially when testing two-sided. Instead of 66.7% of false positives in the one-sided test, the false-positive rate increased to 100% when testing two-sided. In addition, we exploratively combined multiple risk quantifiers into aggregate measures that increased the accuracy of the method for predicting the same data used to fit the model (see S7 and S8 in the Supplemental Material). Here we found that combinations of EWSs were able to outperform single EWSs under specific circumstances, but further studies are needed to confirm such findings in larger samples.
Discussion
A repeated single-subject design was used to test whether circadian-rhythm variables could predict an increase of depressive symptoms to a clinically relevant level in individuals who discontinued their antidepressant medication. At the individual level, we found that in eight out of 16 participants (50.0% true positives), an upcoming transition in depressive symptoms was preceded by at least one CSD-based EWS (variance, kurtosis, and acf-1) compared with 22.2% false positives in participants without a transition, which was in line with our first hypothesis. However, the performance of individual CSD-based EWSs was lower, ranging from 18.7% to 25.0% true-positive rates versus an 11.1% false-positive rate. We also found that the circadian-rhythm variables (IS, IV, and acf-1440) did not signal upcoming transitions, given that false positives were more common than true positives. Regarding mean activity levels, we also found that false positives were more common than true positives. Therefore, we conclude that no evidence was found for our second and third hypotheses. In the current study, we did not investigate the potential effects of life events on mean activity levels and circadian rhythm. However, because such events may provide an alternative explanation for some of the detected changes, we suggest future studies investigate this in more detail. From these results, we found some support for the first hypothesis that increases in at least one CSD-based EWS (variance, kurtosis, and acf-1) precedes transitions in depressive symptoms. With respect to this finding, we can conclude that increases in at least one CSD-based EWS were found to be more prevalent in participants who experienced a transition than in participants who did not experience such a transition. Thus, a single EWS does not yet seem to be able to differentiate between participants with and without transitions. No evidence was found for the second hypothesis that circadian-rhythm variables precede transitions. Furthermore, no strong support was found for the third hypothesis.
Earlier research examined whether circadian-rhythm variables could differentiate healthy individuals from depressed individuals or whether depressive episodes or the timing of the episodes could be detected on the basis of actigraphy-based measures (Minaeva et al., 2020; Zanella-Calzada et al., 2019). One of the unique features of the current study is that we examined whether within-persons changes in these actigraphy-derived quantifiers occurred just before individuals transitioned toward higher levels of depressive symptoms. Whereas previous studies have shown a number of circadian-rhythm variables to be associated with depressed mood states (Esaki et al., 2021), the current study shows that the investigated circadian-rhythm variables (IS, IV, and acf-1440) do not function as early indicators of an upcoming recurrence of depression.
When considering what the best predictor was for transitions in depressive symptoms, we found that our post hoc investigations into combinations of EWSs provide some information. That is, our analyses yielded evidence that combining multiple EWSs may improve the prediction of transitions, for example, the combination of acf-1440, acf-1, and kurtosis, whose point was found to be on the line of optimal solutions for equal costs for true and false positives. Because of the limited sample size, no cross-validation was possible, and thus, we cannot rule out this finding as a chance finding. However, these exploratory results may be a stepping stone for future research into EWS combinations on actigraphy time-series data from a larger sample. Using that data to find EWS combinations would then be validated through cross-validation. Only after that can studies with a more confirmatory character be used to investigate these EWS combinations for predictions of transitions in depression.
Given advances in actigraph technology above ESM and the current availability of cloud data storage and analysis, as signaled by mainstream adaptation of commercial actigraphs such as Fitbit, future research could consider developing a software tool for automatically calculating actigraphy-derived transition quantifiers that can be presented to end users (patients or clinicians) in an intuitive way. Such a tool may have the potential to more adequately estimate upcoming transitions than tools used currently. However, whether such future actigraphy quantifiers should be based on CSD, context-driven, circadian, or alternative theories or measures is still very much open to debate. Moreover, as we discuss in the next paragraph, there are several methodological challenges that need attention as well.
Given the mixed findings at the individual level, we investigated the effects of the a priori formulated expected direction of the EWS post hoc (see S4 and S5 in the Supplemental Material). In general, testing two-sided instead of one-sided did increase the true-positive rate somewhat, but it increased the false-positive rate equally or even more. Note that in acf-1440, the true-positive rate increased substantially more than the false-positive rate, which may indicate that our initial hypothesis that acf-1440 would become more rigid and therefore decrease over time may have been wrong. Future studies investigating whether the expected directions of CSD-based EWSs and circadian-rhythm variables hold robustly in actigraphy data could be worthwhile, especially for acf-1440. In addition, such research could also investigate whether, instead of becoming more rigid, the system might become more irregular instead (Servaas et al., 2021).
Although the used TRANS-ID data set offers a unique and rich high-resolution longitudinal data set with multiple data types, in the current study, we found that trying to predict transitions through the investigated actigraphy-based quantifiers on a more idiographic, individual-centered basis is not feasible. Perhaps first, the identification of more homogeneous activity subgroups is required, along with the study of the ranges and possible cutoff values for proposed transition quantifiers. Although such studies would require sample sizes that are too large to easily study in academic settings because of financial and other constraints, commercial parties, such as Fitbit, Garmin, Apple, or Huawei, do process such large quantities of (near) real-time data. Hence, perhaps future studies could aim at improving industry-academia cooperation in developing potential transition detection and prediction measures and methods.
This study had a number of limitations that should be taken into account. First, the study was designed for repeated single-subject analyses, meaning that power calculations were based on the number of data points within one participant needed for statistical analyses instead of the number of participants in a group. This meant that the results were descriptive, and differences in EWSs between participants with and without a transition could not be tested statistically. Therefore, the results from the between-persons analyses should be interpreted carefully, and confirmation using a larger sample is needed. Second, the core analyses in this article were applied after data collection was completed. The retrospective EWS analysis strategy involved that we first had to determine the transitions before we could subsequently test whether EWSs could predict these transitions. To become clinically relevant, this should be the other way around to be able to provide ample warning time before a transition occurs. Real-time methods, such as statistical process control (SPC), have recently been proposed (Smit, Schat, & Ceulemans, 2022), tested in simulated ESM data (Schat et al., 2021), and shown to have value in foreseeing recurrence of depression using empirical ESM time-series data (Smit et al., 2019; Smit & Snippe, 2022). When considering applying EWSs in real time, researchers will have to be aware to select methods that can correct for repeated testing. Although real-time methods such as SPC can handle this issue (Montgomery, 2012), it still has to be investigated what the effects hereof are on the false-positive rates in this context. Third, of the 51 participants who completed the data-collection period and had transition data available, we were able to include only 25 participants in our analyses. One of the main reasons for this was that the actual battery life of the used actigraphs was only half of the expected battery life, necessitating the use of two actigraphs to cover the full data collection period of 4 months. Because the used actigraphs could be initiated only by research staff, because of the required software not being available for participants, actigraph delivery through regular mail services was required. This caused missing data and required an additional merging step to merge each participant’s data files after receiving the actigraphs back from the participants. The exclusion of half of the participants from the analyses because of data loss illustrates that there is still considerable room for improvement. Given our experiences during this study, we suggest working with devices with larger battery capacity or devices for which participants can change the battery themselves and that also allow for real-time streaming of actigraphy data to certified protected servers. Note that the latter suggestion is also conditional for any future development of real-time EWS calculation and immediate informing of the patients and their clinicians.
In addition, it could be worthwhile to investigate a sample of participants whose transition occurred in the opposite direction, that is, toward a state of decreased depressive symptoms. This process is likely to be seen in individuals treated for their depressive symptoms, as was done in the TRANS-ID study (Helmich et al., 2020). Repeating the analyses of the current study with data from the Recovery study may expand knowledge of depressive-symptom dynamics. Finally, in this study, demographics such as racial/ethnic identification, cultural/geographic background, or socioeconomic status were not recorded because they were not expected to affect the investigated hypotheses.
To conclude, this is the first study to investigate whether transitions into increased depressive symptoms during tapering of antidepressant medication were preceded by actigraphy-based EWSs. Although results were in line with the idea that EWSs may precede transitions toward higher levels of depression in a small subset of participants, no evidence was found that changes in circadian-rhythm variables or changes in the mean level of actigraphy preceded such transitions. Although actigraphy can be a relatively practical way to obtain physical-activity time-series data in clinical practice, given the small difference between participants with and without a transition, clinical implementation of actigraphy-based EWSs as a monitoring tool to inform individuals about their momentary risks of recurrence does not seem feasible in the near future.
Supplemental Material
sj-docx-1-cpx-10.1177_21677026221148101 – Supplemental material for Risk Ahead: Actigraphy-Based Early-Warning Signals of Increases in Depressive Symptoms During Antidepressant Discontinuation
Supplemental material, sj-docx-1-cpx-10.1177_21677026221148101 for Risk Ahead: Actigraphy-Based Early-Warning Signals of Increases in Depressive Symptoms During Antidepressant Discontinuation by Yoram K. Kunkels, Arnout C. Smit, Olga Minaeva, Evelien Snippe, Sandip V. George, Arie M. van Roon, Marieke Wichers and Harri�tte Riese in Clinical Psychological Science
Footnotes
Acknowledgements
We thank the participants for their time and effort, P. Harder for the assistance with the recruitment of the participants, M. Messchendorp and R. de Vries for data collection, and Marieke A. Helmich for participating in the conceptualization of the study.
Transparency
Action Editor: Aidan G.C. Wright
Editor: Jennifer L. Tackett
Author Contribution(s)
References
Supplementary Material
Please find the following supplemental material available below.
For Open Access articles published under a Creative Commons License, all supplemental material carries the same license as the article it is associated with.
For non-Open Access articles published, all supplemental material carries a non-exclusive license, and permission requests for re-use of supplemental material or any part of supplemental material shall be sent directly to the copyright owner as specified in the copyright notice associated with the article.