
Abstract
Based on dynamical-systems theory, in the current study, we aimed to investigate if recurrence of depression is systematically preceded by within-persons early warning signals (EWSs) in positive and negative affect. Ecological momentary assessments were collected five times a day for a period of 4 months (averaging 524 assessments per individual) from 37 formerly depressed individuals discontinuing antidepressant medication. EWSs (increases in window autocorrelation and variance) preceded recurrence of depression in 32.9% of the participants across robustness checks. Compared with participants that remained in remission, participants with a recurrence showed significantly more positive trends in the variance but not in autocorrelation, and the average number of significant EWSs was more than 3 times larger across tested affect variables. Although the results provide the first systematic evidence that EWSs occur more often before the recurrence of depression, the low sensitivity of EWSs poses a substantial challenge for clinical applications.
Keywords
Depression is one of the main contributors to the worldwide burden of disease, not in small part because of its recurrent nature (Eaton et al., 2008). Being able to predict whether an individual will experience a recurrence of symptoms in the near future would be a major step toward improved prevention of depression. To understand recurrence of depression, researchers have recognized the need for theories that conceptualize depression as a dynamical system (Cramer et al., 2016; Nelson et al., 2017; Wichers, 2014; Wichers et al., 2015). In this framework, each individual is viewed as a dynamical system of interacting components (e.g., emotions, cognitions, symptoms, or combinations between these) that vary and influence each other over time and may together form a dynamic stable state. The dynamics of these components can convey information about the resilience of the system and may allow researchers to predict upcoming recurrence of depression in individual patients (Olthof et al., 2020; van de Leemput et al., 2014; Wichers et al., 2016, 2020).
An attractive within-persons risk marker for transitions in dynamical systems is critical slowing down (CSD; Strogatz, 2018; Wissel, 1984). CSD occurs when a system gradually becomes slower in recovering from perturbations, which signals a process of destabilization that leads to an increasing risk that even small perturbations may eventually result in large, potentially detrimental transitions (e.g., the transition from remission to a state in which depressive symptoms are elevated). CSD has indeed been shown to precede such “critical transitions” in a wide range of simulated dynamical systems, including simulations aimed at understanding depression (Cramer et al., 2016; van Nes & Scheffer, 2007). CSD is also empirically measurable because it leads to increases in the autocorrelation and variance of components of a wide range of dynamical systems. These so-called early warning signals (EWSs) have been shown to anticipate upcoming transitions in a wide range of empirical time series, such as ecology, climate change, geology, neurology, microbiology, chemistry, physics, and engineering (Olde Rikkert et al., 2016; Scheffer et al., 2009, 2012; Trefois et al., 2015). Because it has become apparent that depression is a highly heterogeneous concept (Fried, 2017; Fried & Nesse, 2015; Monroe & Anderson, 2015), such broadly applicable EWSs may provide a consistent and reliable warning for upcoming transitions toward recurrence of depression even if the precise mechanisms and stressors leading up to the recurrence of depression vary from patient to patient.
It has been suggested before that EWSs may precede acute severity transitions in chronic diseases, such as depression (Olde Rikkert et al., 2016; Trefois et al., 2015). In the case of depression, this may imply that, for example, someone’s affect varies more (indicated by increased variability) and takes longer to recover from events in daily life (indicated by increased autocorrelation) in the phase before recurrence of depression. The available studies have shown that group-level differences in autocorrelation and variance in momentary-affect data predicted severity of future depression (Kuppens et al., 2012; Panaite et al., 2020; Schreuder et al., 2020; van de Leemput et al., 2014; Wichers et al., 2010). One study showed that within-persons rises in the autocorrelation of daily assessed affect was associated with deterioration in depressive symptoms over time, although this was not found for within-persons rises in the standard deviation of affect measures (Curtiss et al., 2021). However, the body of literature that tests this idea empirically has a severe limitation commonly encountered in psychology: These studies were conducted at the between-persons level while aiming to inform on a within-persons process (Hayes et al., 2019; Nelson et al., 2017; Wright & Woods, 2020). It has indeed been demonstrated that group-level results can lead to severely incorrect inferences about within-persons processes; a positive association at the group level could even be a negative association at the level of the individual (Hamaker, 2012; Molenaar, 2004). Because of the between-persons design used in these studies and because the temporal order of EWSs and the occurrence of symptom transitions was not examined within individuals over time, evidence for the hypothesized within-persons rise in autocorrelation and variance preceding transitions in depression is still lacking (E. H. Bos & De Jonge, 2014). Only if researchers find that EWS systematically precede transitions toward recurrence of depression within single individuals over time will they know that recurrence of depression is indeed preceded by a process of destabilization (E. H. Bos & De Jonge, 2014).
To examine whether CSD takes place within individuals, it is necessary to intensively study the period before transitions toward recurrence of depression in individual patients. Such a radically different design to study this within-persons process was introduced by Wichers et al. (2016), who measured momentary-affect levels prospectively using ecological momentary assessment (EMA; Csikszentmihalyi & Larson, 2014; Myin-Germeys et al., 2009; Shiffman et al., 2008; Trull & Ebner-Priemer, 2009) multiple times a day over the course of several months. By starting when depression was still in remission and continuing until after recurrence, they captured the entire period that led up to recurrence. Promisingly, the results from this N = 1 study (Wichers et al., 2016) and from studies that applied different analyses to the data of that same individual (Albers & Bringmann, 2020; Cabrieto et al., 2018) were in line with the theory that the recurrence of depressive symptoms is preceded by a period of within-persons destabilization indicated by EWSs, such as rises in autocorrelation and variance in affective states. A confirmatory study using a new data set found the same result in a second individual who experienced a transition toward recurrence of depression (Wichers et al., 2020). However, other idiographic studies with somewhat different methodology did not find that EWSs in affect measures systematically preceded transitions in depression (Slofstra et al., 2018; Tonge et al., 2024). Given that most sample sizes of the previous studies were small, it needs to be studied in many more individuals whether EWSs in affective states systematically precede transitions toward recurrence of depression.
If transitions to recurrence of depression are indeed preceded by destabilization within individuals in the majority of the sample, this might have great clinical value because it may form the basis of a tool that signals when a specific patient is at increased risk of recurrence of depression. By continuously monitoring a patient’s affective state, an increase in the autocorrelation or variance of the patient’s affective states could be used to signal an impending relapse, triggering preventive measures.
In the current study, we used a replicated single-subject design including high-intensity data on momentary affect over a long period of time in multiple individuals to study whether we could systematically replicate the finding that CSD in affective states occurs before transitions toward recurrence of depression. The study was conducted in individuals that were in remission of depression at baseline who (gradually) discontinued their antidepressant medication during the study. Participants monitored their momentary affect during this period because patients are more vulnerable to experience a recurrence of depression when then they discontinue their medication (Borges et al., 2014). In line with theoretical literature on EWSs and the empirical evidence found so far in depression, we hypothesized that (a) autocorrelation and variance in affective states show a significant increase in the period before symptoms recur and (b) that this rise is absent or significantly smaller in participants that remain in remission. On the basis of previous findings and theoretical considerations, we expected to find the strongest EWSs before transitions toward recurrence of depression in the closest proxy of depression (van de Leemput et al., 2014; Wichers, 2014; Wichers et al., 2019). Therefore, we focused the analysis primarily on negative affect (NA) with low arousal (NA low) in the current data. Secondarily, we examined high-arousal NA (irritation, stress, restlessness) because these symptoms are common prodromal symptoms of depression (Benasi et al., 2021). Furthermore, we tested EWSs in positive-affect (PA) high arousal (PA high) and low arousal (PA low) because depression, and specifically anhedonia, is characterized by low levels of PA (Heininga et al., 2017; Watson et al., 1988).
Transparency and Openness
This study was preregistered on OSF before data analysis (Smit, Helmich, Snippe, et al., 2020). In the preregistration, we report how we determined our sample size, all data exclusions, all manipulations, and all measures in the study. The preregistration also includes a comprehensive analysis plan, including details on model selection and sensitivity checks.
The data used in this study could not be made publicly available because of sensitive patient information that could not be fully anonymized. However, access can be granted on reasonable request through the corresponding author.
All participants provided written informed consent. The study procedures were reviewed and approved by the Medical Ethical Committee of the University Medical Center Groningen. All study procedures complied with the ethical standards of the relevant national and institutional committees on human experimentation and with the Helsinki Declaration of 1975, as revised in 2008.
Method
Participants and procedures
Data from the TRANS-ID Tapering project was used for the current study. For an in-depth description of the study protocol, see Smit, Helmich, Kunkels, et al. (2020) and Smit et al. (2022).
Participants were previously depressed individuals who (gradually) discontinued their antidepressant medication. The sample consisted of adults (age ≥ 18) living in the Netherlands who were on antidepressant medication at baseline because of a past depressive episode and made a shared decision with their general practitioner or psychiatrist to discontinue their antidepressant medication. The study was advertised in local and national newspapers, online (e.g., via social media), and through a Dutch pharmacy when patients ordered antidepressant tapering strips (Groot & van Os, 2018). Participants were included between June 2017 and October 2018. Exclusion criteria were (a) not being in remission at baseline, (b) psychotic or manic episode at baseline (both were assessed using the mini-SCAN; Nienhuis et al., 2010), (c) reported diagnosis of personality disorder, (d) starting another antidepressant, or (e) not being able to work with a smartphone. For a summary of recruitment and inclusion, see the flow chart in Supplemental S1 in the Supplemental Material available online. Table 1 summarizes sample characteristics at baseline.
Sample Characteristics at Baseline
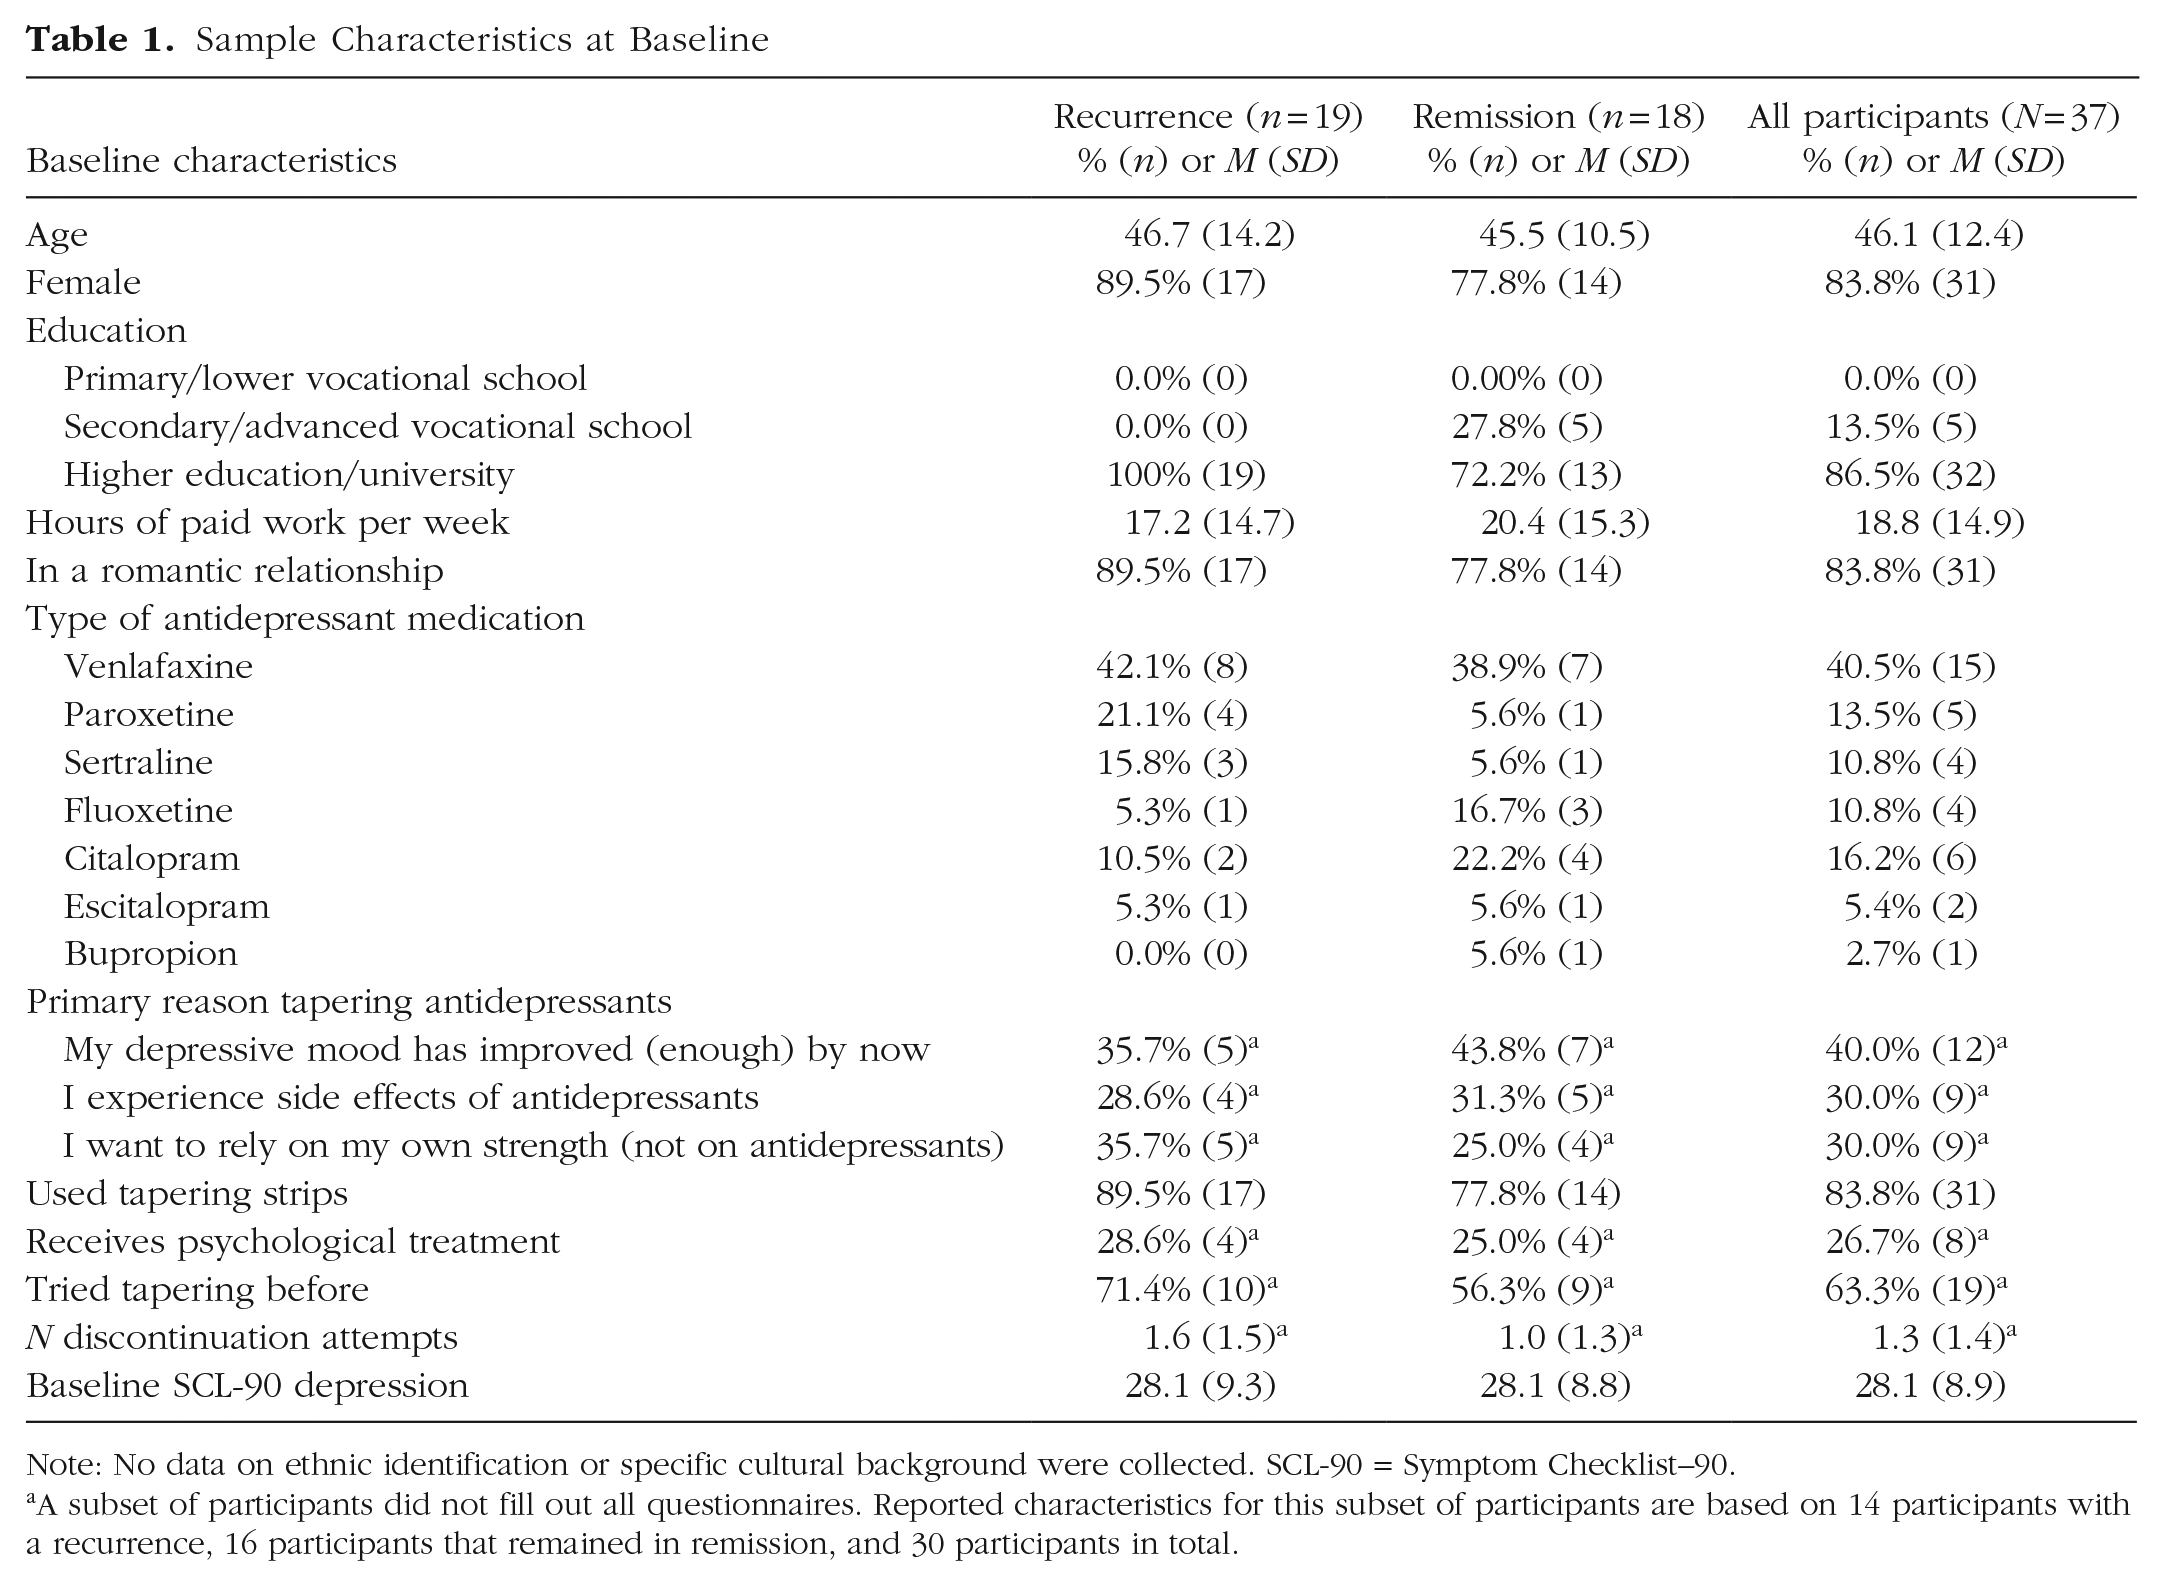
Note: No data on ethnic identification or specific cultural background were collected. SCL-90 = Symptom Checklist–90.
A subset of participants did not fill out all questionnaires. Reported characteristics for this subset of participants are based on 14 participants with a recurrence, 16 participants that remained in remission, and 30 participants in total.
Participants started 4 months of EMA 1 month before they planned to reduce their antidepressant dose to 0 mg. They completed EMA questions at five fixed time points a day. Participants also filled out weekly questionnaires, were called every 3 weeks, and participated in two poststudy evaluation interviews at 4 and 6 months after start of the study.
EMA
The EMA measurements consisted of five smartphone-based measurements a day over the course of 4 months (≈600 prompts per participant). Measurements took about 2 minutes to complete and were set at fixed intervals of 3 hours, scheduled to fit the sleep-wake habits of the participant. The full EMA questionnaire is available on OSF (Smit, Helmich, Kunkels, et al., 2020).
The EMA questionnaires included 10 momentary-affect items based on the affect circumplex (Posner et al., 2005; Yik et al., 1999), which were answered on a visual analog scale from not at all to very much. Items were standardized within persons and averaged at each time point to form the four mental states used in the analysis. NA low included down, listless, and tired. NA high arousal (NA high) included restless, stressed, and irritated. PA low included content and at ease. PA high included cheerful and energetic. A total mood score was also obtained by averaging all standardized items, reversing scores on positively stated items.
The compliance was good (Mdn = 88.5%), yielding a median of 545 observations per individual (range = 344–609), and 19,395 completed questionnaires in total. For the means, standard deviations, and ranges of compliance and raw item scores, see Table S2 in the Supplemental Material.
Transitions Toward Recurrence of Depression
A combination of quantitative and qualitative criteria was used to determine which participants experienced a transition toward recurrence of depression that was (a) statistically reliable, (b) persistent, and (c) clinically relevant (see Smit et al., 2022). The reliable change index (Jacobson & Truax, 1992) was used to test if depressive symptoms, measured using the Symptom Checklist–90 (SCL-90) depression subscale (Arrindell & Ettema, 2003), showed a statistically reliable increase in depressive symptoms (≥ 8.5 points) compared with the average of the SCL-90 depression scores obtained during the first 2 weeks of the study (i.e., when participants were still in remission). This change was considered persistent if the SCL-90 score remained elevated for at least 3 consecutive weeks. However, some increases in depression may not have persisted because treatment was started or tapering was interrupted when the clinician and patient determined depression had recurred. Therefore, instead of a persistence criterion, patients could also meet the criterion that treatment was started or increased or tapering was interrupted because depression had recurred. Because statistically reliable increases in depression may not be experienced as recurrence of depression by patients, a qualitative criterion was added to assess patients’ perceived clinical relevance of the increase. To assess clinical relevance, three independent raters inspected qualitative data obtained in evaluation interviews, three weekly phone calls during the research period, and comment sections that were included in all EMA and SCL-90 questionnaires and determined whether participants had indeed experienced a clinically meaningful increase in depressive symptoms that had caused them discomfort in daily life. In this article, we use the term “recurrence of depression” to reflect what was assessed using this method. Even though the observational nature of this study prevented us from determining whether each individual would have progressed to a full-blown depressive episode before receiving care as usual, we believe this term represents the phenomena under investigation in an accurate and readable way.
In previous studies (Wichers et al., 2016, 2020), the rise in EWSs started long before the transition, hence, a transition shortly after the 4-month EMA period may still show EWSs in the EMA data. Therefore, transitions were investigated for a 6-month period, also including the 2 months directly after the EMA data collection had ended.
Analysis
At the within-persons level, the analysis closely resembled the analysis of the previous N = 1 studies (Wichers et al., 2016, 2020). A more detailed version of the analysis plan, including more information on preprocessing and model choices, was published on OSF before the data were analyzed (Smit, Helmich, Snippe, et al., 2020).
First, the lag-1 autocorrelation and variance (implemented using the var() function in R) in NA low were estimated in a window of 28 days (maximum 140 observations per window), similar to Wichers et al. (2016) and Wichers et al. (2020). Within the window, data were first detrended using robust linear regression and then Winsorized (i.e., extreme values were capped at the fifth and 95th percentiles). Missing data were not imputed, and during the calculation of the autocorrelation, observations were not regressed on the previous observation if it was missing or if it was the previous day. The calculations were repeated, each time moving the window forward one observation until the final observation was reached.
After these time series of window autocorrelation and variance were obtained, the Mann-Kendall (M-K) trend test was used to estimate the trend in these window time series of autocorrelation and variance. All available windows were used for participants without a transition; in participants with a transition, the windows including observations made after the start of the transition were omitted from the analysis. To improve reliability, the test was performed only for individuals for whom at least 140 window estimates could be included in the analysis, leaving 19 participants with a transition and 18 participants without a transition (N = 37). To improve the specificity of the test, a minimum relevant effect size of τ > 0.1 was used, and in the remainder of the article, an increase in EWSs is called “significant” only if both p < .05 and τ > 0.1. We hypothesized such significant increases would be found in a higher percentage of participants that experienced a transition (i.e., sensitivity) than in participants that remained in remission (i.e., 1 – specificity).
The distribution of within-persons estimates of τ values summarizing the trend in autocorrelation and variance in each individual were used to gain insight in group-level differences in EWSs. We hypothesized that the τ values would be distributed (a) above zero for participants with a transition, indicating an increase in autocorrelation and variance before transitions, and (b) around zero for participants that remained in remission, indicating no trend in autocorrelation and variance. We tested if the average τ value was significantly higher (i.e., one-sided) for participants with a transition using Welch’s t test. In addition, we tested how many days before the transition the EWS became significant and remained significant until the transition and whether EWSs were more common in participants with a sudden transition compared with a gradual transition. Sudden transitions were defined as statistically reliable increases in the SCL-90 depression score that occurred within 1 week (Smit et al., 2022).
The robustness of these results was examined by repeating the analysis using a range of 17 different preprocessing and model settings (i.e., varying window sizes, minimum and maximum numbers of windows used in the analysis, and methods to deal with trends and outliers) that were specified in the preregistration (Smit, Helmich, Snippe, et al., 2020) and are presented in Table S4 in the Supplemental Material.
Results
Demonstration cases: individual analysis
For each individual patient with a transition, we hypothesized that autocorrelation and variance in NA low would increase significantly before the transition. To demonstrate this principle, Figure 1 shows window estimates of autocorrelation and variance for one participant with a transition. For this participant, visual inspection seems to indicate an increase in both EWSs in this case, which was confirmed by the M-K trend test (autocorrelation: τ = 0.41, p < .001; variance: τ = 0.68, p < .001). Because the results were both significant and the effect size was larger than the prespecified minimum relevant effect size of 0.1, we conclude that this patient demonstrated a significant rise in autocorrelation and variance before the transition. Figure 1 shows the window estimates for a participant without a transition. The autocorrelation in NA low did not increase in this case (τ = −0.04, p = .26), and the variance even decreased significantly over time (τ = −0.65, p < .001).
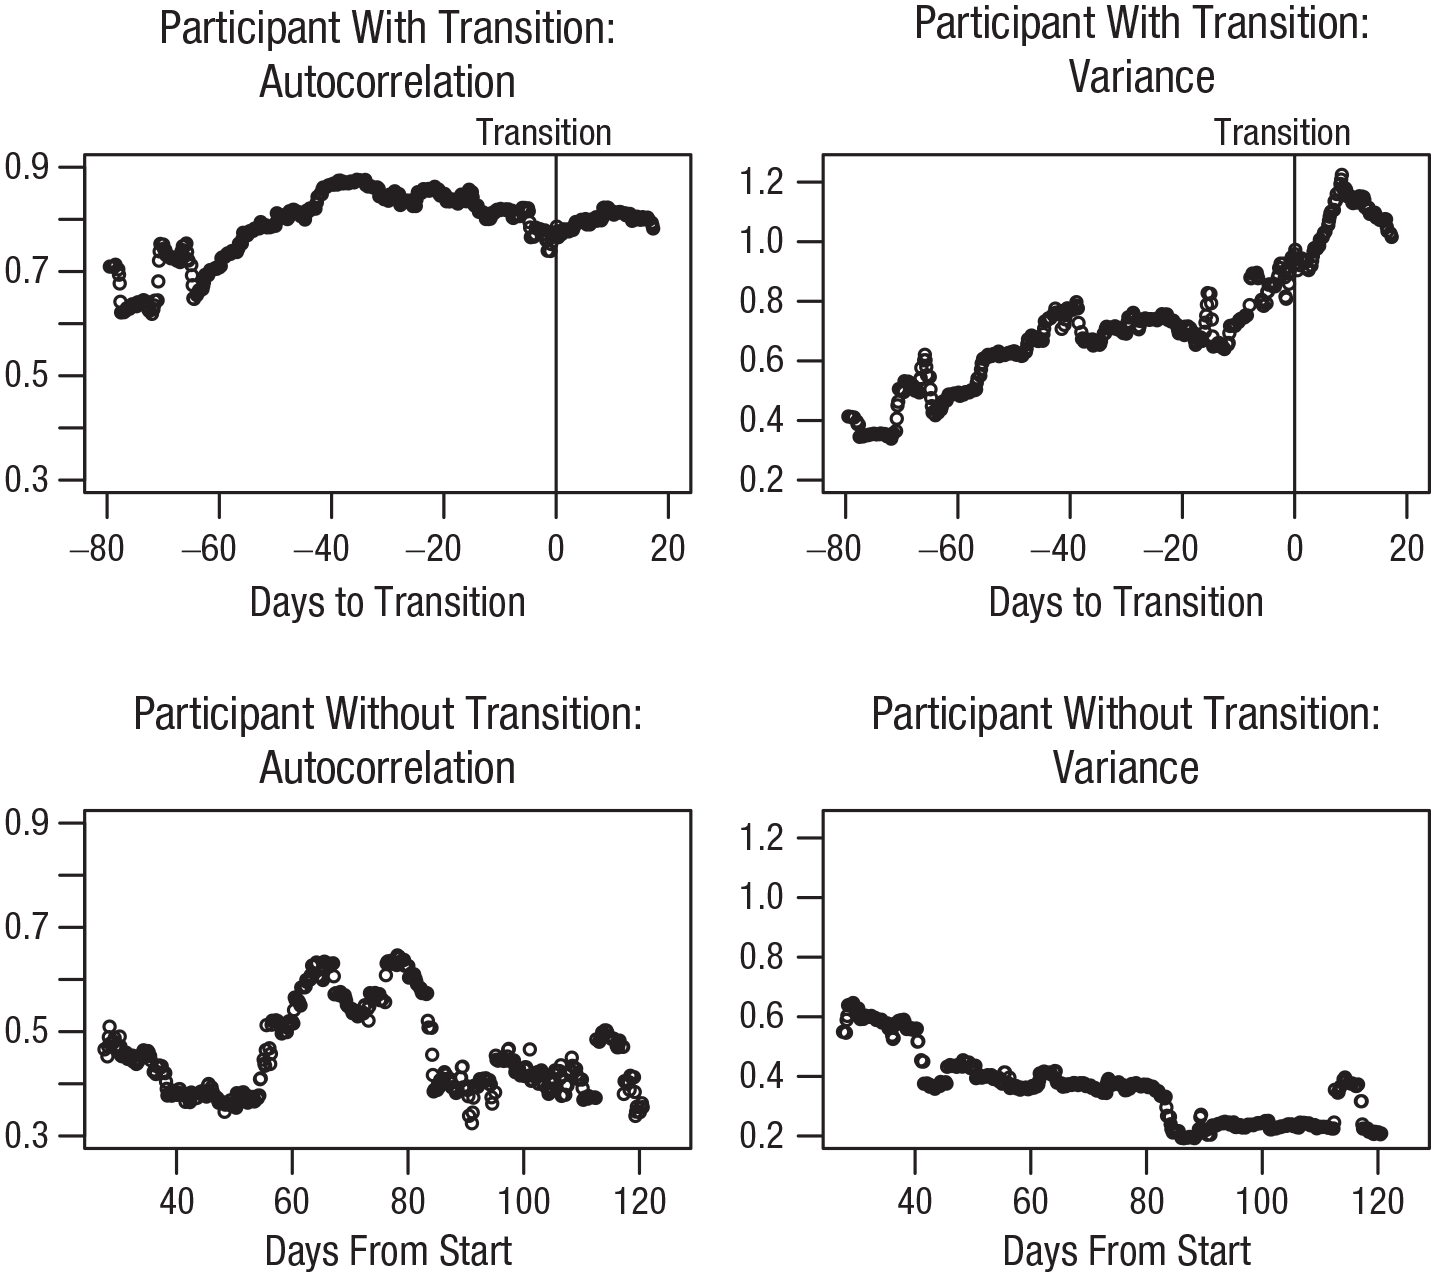
Window estimates of autocorrelation and variance for a participant with and without a transition in depressive symptoms. Dots represent window estimates in (left) autocorrelation and (right) variance, calculated using all available data in the 28 days before the indicated dot (i.e., backwards moving window). This means the graphs start on day 28 of the research period (i.e., with the window showing days 1–28). Advantage of using backwards moving windows is that points that appear in the graph before the transition were calculated using only data obtained before that transition. Two visually clear cases were selected for demonstration purposes.
Main analyses: NA low
Out of the 19 participants with a transition, seven (36.8%) showed a significant increase in the lag-1 autocorrelation of NA low, and five (26.3%) showed a significant increase in the variance of NA low before the transition (for overlap between these groups, see Table S3 in the Supplemental Material). As hypothesized, of the 18 participants without a transition, the number of EWSs was smaller; autocorrelation increased significantly in only four participants (22.2%), and variance increased significantly in only two (11.1%) participants.
As hypothesized, the average M-K trend in autocorrelation and variance was higher for participants with a transition (autocorrelation: M = −0.019; variance: M = −0.189) than for participants without a transition (autocorrelation: M = −0.175; variance: N = −0.468). This difference did not reach significance for autocorrelation, t(34.955) = 1.3674, p = .090, Cohen’s d = 0.45, but was significant for variance, t(33.672) = 1.8262, p = .038, Cohen’s d = 0.60. The density plot in Figure 2 shows the distribution of the M-K trend in autocorrelation and variance for participants with a transition and without a transition. Note that the average M-K trend was negative in both EWSs and both groups, indicating that on average, the autocorrelation and variance tended to decrease over time. Figure 2 also shows that there was a substantial overlap between groups, illustrating why the difference in average trend did not lead to a large difference in the number of participants showing EWSs in these groups.
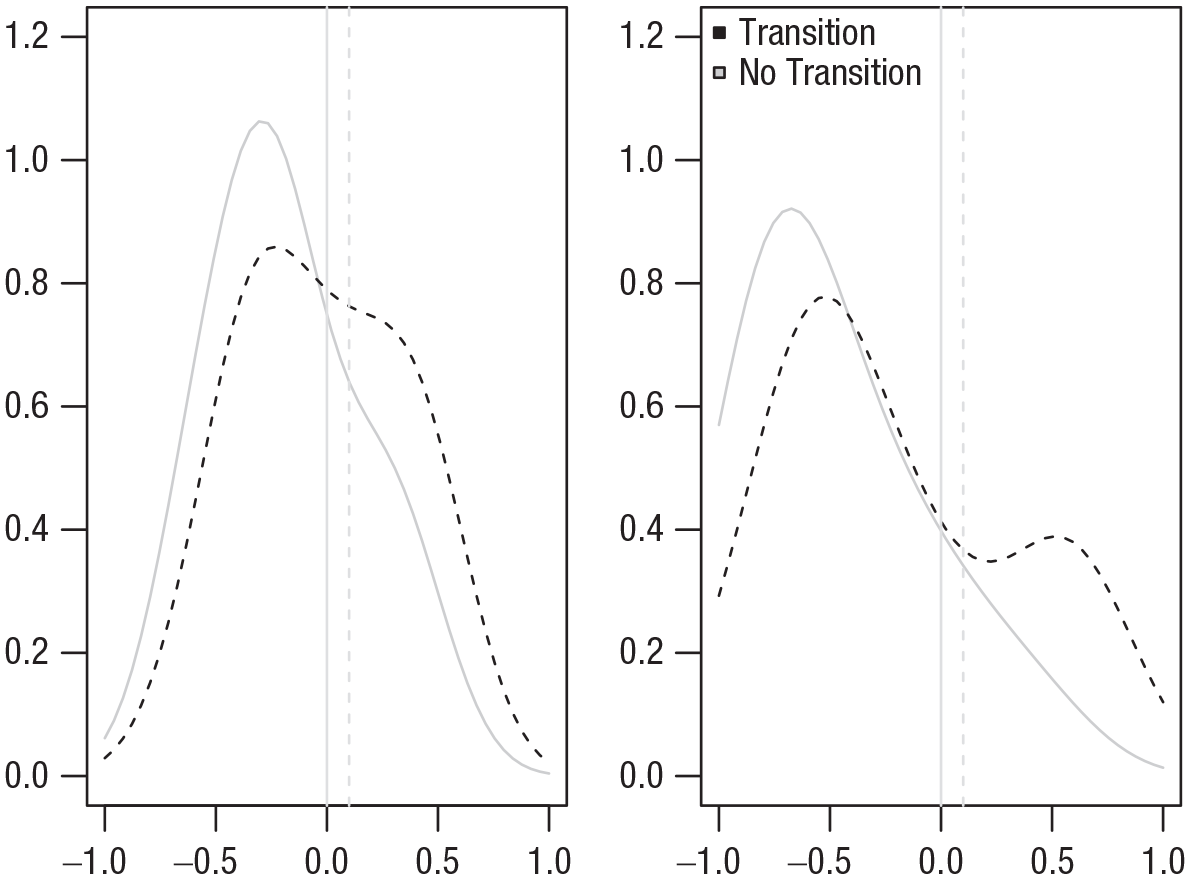
Between-persons distribution of the Mann-Kendall trend for the autocorrelation and variance. Dashed vertical lines indicate the minimum relevant effect size of 0.1 used in this study.
For participants who showed a significant increase in autocorrelation or variance, on average, the M-K trend became significant 56.7 and 37.8 days, respectively, before the start of the transition toward recurrence of depression (autocorrelation: range = 3–111 days; variance: range = 12–69 days) and remained significant until the transition. This shows that true positive increases in autocorrelation and variance typically start long before a transition in depressive symptoms.
Although it was hypothesized that EWSs would be more likely to appear in participants with a sudden transition in depressive symptoms compared with participants with a gradual transition, this was not confirmed by the data. Participants with a sudden transition (n = 9) showed a lower percentage of significant rises in autocorrelation (22.2%) and variance (11.1%) than participants with a gradual transition (n = 10; 50.0% and 40.0%, respectively).
Secondary analyses: NA high, PA low, PA high, total mood, and separate items
We repeated the tests for increases in autocorrelation and variance using the variables NA high, PA low, and PA high, yielding a total of eight EWSs tested for each individual. In all variables, proportionally more increases in autocorrelation and variance were found in the group of participants with a transition compared with participants without a transition (see Fig. 3). In seven of the eight EWSs, the number of true positives (i.e., pretransition EWS) was more than double the number of false positives (i.e., EWSs in the nontransition group); see Figure 3. For a full overview of all significant EWSs for each individual, see Table S3 in the Supplemental Material.
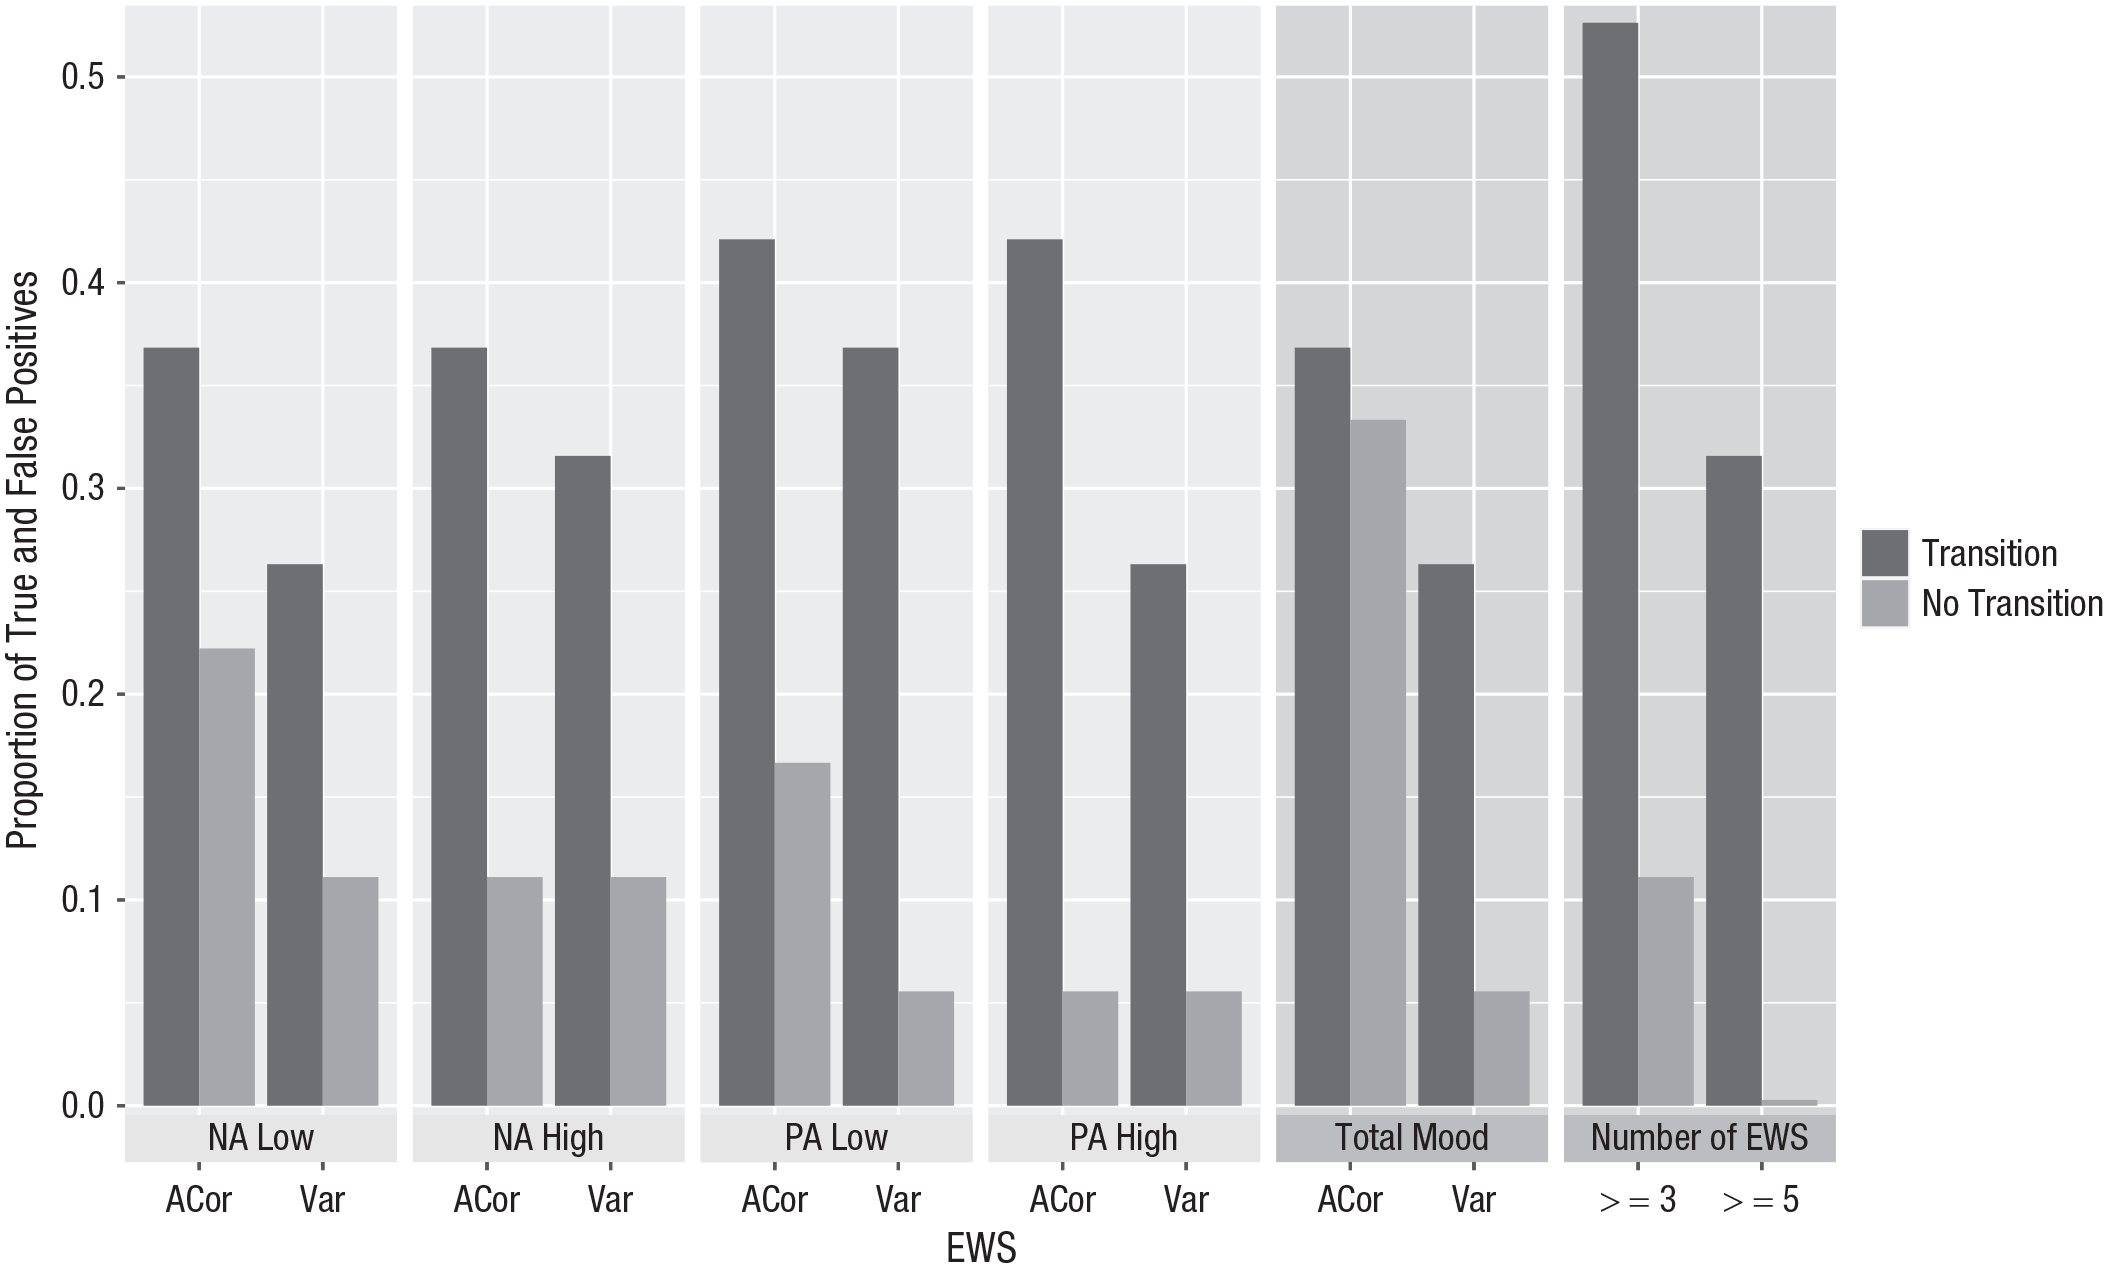
Proportion of true and false positives in different variables for different EWSs. ACor = lag-1 autocorrelation; var = variance; NA = negative affect; PA = positive affect; EWSs = early warning signals.
Out of the eight variable and EWS combinations, the average number of EWSs found in participants with a transition was more than 3 times larger than for participants without a transition (2.79 per participant with a transition vs. 0.89 per participant without a transition). Although participants with a transition had more EWSs on average, which EWSs were significant differed from person to person (see Table S3 in the Supplemental Material). Based on this, it seems likely that the predictive performance of EWSs can be improved substantially by using a combination of variables. Even a simple distinction between participants with three or more versus fewer than three significant rises across the total of eight tests in these four variables would have resulted in detecting 10 of 19 (52.6%) transitions at the cost of only two of 18 (11.1%) false positives. A decision rule based on five or more significant rises would have resulted in detecting six of 19 (31.6%) true positives at the cost of no false positives (see Fig. 3). Simply combining all items into a “total mood” variable did not have the same beneficial effect (see Fig. 3).
Post hoc tests were performed to probe whether differences in EWSs may have reflected stable between-persons differences in established risk factors (Buckman et al., 2018). Results suggested the number of EWSs was not significantly different depending on the level of residual symptoms measured at baseline using the SCL-90 depression subscale, r(35) = .06, p = .74, or the number of previous discontinuation attempts, r(27) = .22, p = .25.
Additional post hoc analyses were used to investigate whether participants used less of the response scale over time because this may have affected the trends in EWSs. To that end, the variance of the first 2 weeks was compared with the variance of the second 2 weeks. Results showed a significant decrease in the variance of NA low, t(50) = 1.86, p = 0.03; NA high, t(50) = 3.43, p < .001; and PA low, t(50) = 2.32, p = .01; but no significant decrease in the variance of PA high, t(50) = 1.37, p = .09.
Sensitivity analyses
To test whether the group differences in M-K trends in autocorrelation and variance were maintained across different model settings, we varied window size, minimum and maximum number of windows used in the analysis, and how to deal with trends and outliers. Figure 4 shows a summary of the Cohen’s d and p values of the t tests testing if the average M-K trend in autocorrelation and variance was larger for participants with versus without a transition for all 17 analyses with different model settings. The M-K trend in autocorrelation was not significantly larger for participants with a transition compared with participants without a transition in most model settings, confirming the results of the main analysis that the effect size for this EWS was too low to be detected with the current sample size. In contrast, the M-K trend in variance was significantly larger in participants with a transition in 11 out of 17 model settings. In addition, the effect size tended to be larger for variance than for autocorrelation. The direction of the effect was highly robust; the effect had the hypothesized direction in nearly all of the preregistered settings (autocorrelation: 16/17 = 94.1%; variance: 17/17 = 100%). This robustness also translated to the individual level: The percentage of true positives (M = 32.9%, SD = 6.3%) was larger than the percentage of false positives (M = 16.2%, SD = 9.9%) in the same settings. The one setting that showed a reversed effect for autocorrelation was when the analysis was limited to 140 windows instead of all available windows. For model settings and results for each of the tested model settings separately, see Supplement S4 in the Supplemental Material.
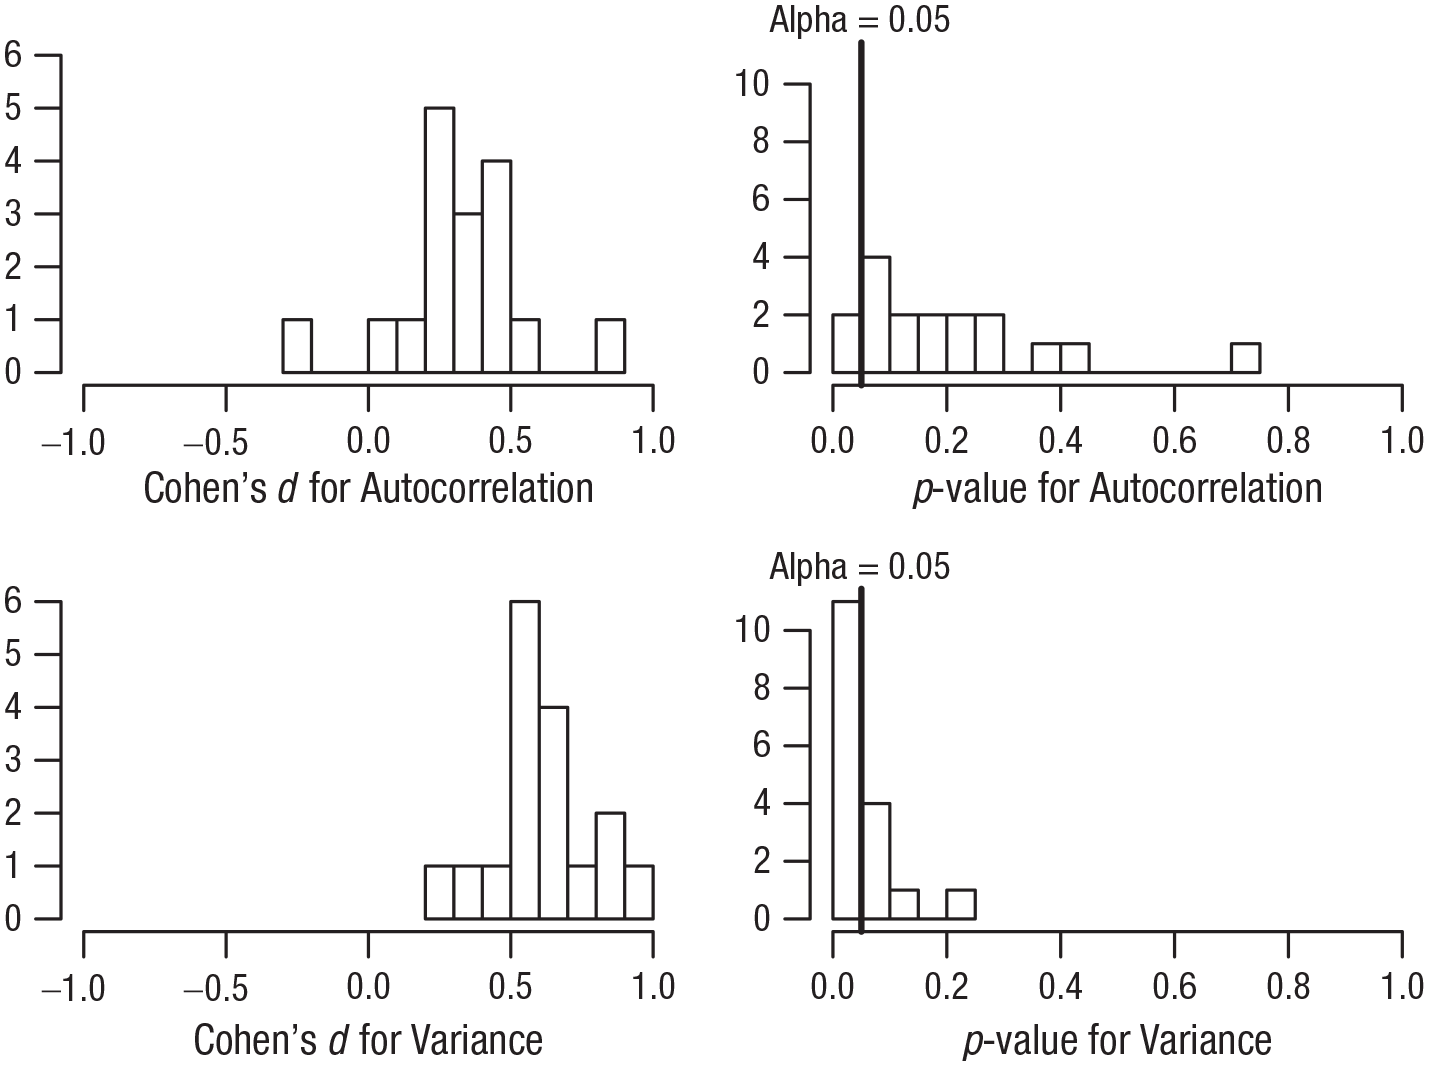
Distribution of results across the 17 different model settings used in the sensitivity check.
Discussion
Our aim in the current study was to examine whether EWSs would systematically precede transitions toward recurrence of depression. Results indicated that significant increases in both the autocorrelation and variance of the separate affect measures were more common in participants with a transition than in participants without a transition. We did not find this only for NA low, on which our primary hypothesis was focused, but also for NA high, PA low, and PA high. At the group level, we found evidence that the average trend in variance of these affect measures tended to be significantly higher for participants with a transition than for participants that remained in remission. Although the effect had the same direction for autocorrelation, the effect size was somewhat smaller for this EWS, and the difference between participants with and without a transition did not reach significance. When recurrence was preceded by EWSs, the increase in autocorrelation and variance, on average, became significant more than a month before the recurrence and remained significant until the recurrence.
The current findings extend previous between-persons studies (Kuppens et al., 2012; Panaite et al., 2020; Schreuder et al., 2020; van de Leemput et al., 2014; Wichers et al., 2010) because the results from the current study cannot be explained by stable between-persons differences (E. H. Bos & De Jonge, 2014). In our study, we used a method specifically designed to test the theory behind CSD and gain insight in the temporal chain of events within persons and add to existing studies using this methodology (Tonge et al., 2024; Wichers et al., 2016, 2020) by including substantially more participants. Using this replicated single-subjects design, we showed that within-persons rises in EWSs occur more often in the period preceding recurrence than in patients without recurrence and were able to (a) statistically test differences between the group with transitions and the group without transitions, (b) investigate sensitivity and specificity of EWSs as a personalized predictor, and (c) test whether results were robust against changes in model settings.
Our findings were highly robust: In 94.1% and 100% of the preregistered model settings, rises in autocorrelation and variance, respectively, were more commonly found in the participants with a transition than in participants that remained in remission, and the trend in EWSs was, on average, higher in participants with a transition. Although the results suggested a good specificity (around 83.8% depending on the model settings used), no EWSs were found in a substantial proportion of the participants with a transition toward recurrence of depression, leading to a low sensitivity (around 32.9% depending on the model settings used). That EWSs were found in only a limited percentage of individuals with a transition is in line with studies on within-persons EWSs in actigraphy data (Kunkels et al., 2023) and heart rate data (George et al., 2023) and with within-persons studies on EWSs in participants who transitioned to lower levels of depression (Helmich et al., 2023), adolescents who transitioned toward higher levels of psychopathology (Schreuder et al., 2023), and patients with bipolar disorder who transitioned toward a depressive episode (F. M. Bos et al., 2022; Ludwig et al., 2024). This underlines the importance of postponing conclusions about within-persons processes of change until within-persons studies are performed (E. H. Bos & De Jonge, 2014; Hamaker, 2012; Hayes et al., 2019; Molenaar, 2004; Nelson et al. 2017; Wright & Woods, 2020).
It has been suggested that EWSs based on CSD may be a fruitful basis for clinical interventions based on group-level studies (Olde Rikkert et al., 2016; Trefois et al., 2015; van de Leemput et al., 2014) and studies that included only a single individual with a transition (Wichers et al., 2016, 2020). Despite their methodological limitations, these studies continue to be cited as evidence that EWSs is a feasible strategy for well-timed interventions (Scheffer et al., 2024). The current study is an important addition to the increasing evidence from larger, more methodologically advanced studies that suggest such applications may not be realistic in the near future (e.g., George et al., 2023; Helmich et al., 2023; Kunkels et al., 2023; Schreuder et al., 2023). Because EWSs were found preceding recurrence of depression in only a minority of the sample, monitoring individuals’ affective states and using EWSs to signal an upcoming recurrence of depression would likely overlook the majority of individuals who will develop a depression. To be useful in clinical practice, a personalized method for detecting early signs of depression requires a higher sensitivity and overall accuracy.
Even though the low sensitivity of EWSs poses a substantial challenge for clinical applications, the theoretical implications are still interesting. The absence of EWSs in the majority of participants with a transition calls into question the assumption that recurrence of depression usually represents a transition before which CSD is expected. It has been demonstrated that CSD occurs before some but not all transitions (Boettiger et al., 2013; Hastings & Wysham, 2010). For example, a large perturbation may cause a transition even though the system was still quite stable, effectively skipping the process of destabilization that would cause CSD (Boettiger et al., 2013). Our results are in line with the idea that CSD-based EWSs are not generic enough to be expected before the majority of the transitions in psychopathology. Future research should be aware of this potential heterogeneity in the dynamics underlying transitions in psychiatry and focus more on identifying specific subgroups in which CSD can be expected.
A more practical explanation for why the difference in EWSs at the group level did not lead to a high sensitivity is the unexpected result that the majority of participants showed a downward trend in both EWSs. This downward bias may have been caused by participants answering more precisely and using less of the available scale when they become more accustomed to filling out the EMA questionnaire. This was supported by post hoc analyses showing a decrease in the variance of most variables in the second 2 weeks compared with the first 2 weeks. It is likely that this bias contributed substantially to the low number of significant EWSs that were found in both groups, leading to a low sensitivity and a high specificity.
Even though the sensitivity of separate EWSs in separate variables was quite low, the results indicated that participants who experienced a transition toward recurrence of depression showed more than 3 times as many EWS sas participants who remained in remission. With this observation, the current study provides preliminary evidence that the performance of EWSs can be improved by combining multiple variables and EWSs. Optimizing the way in which multiple EWSs and variables can be combined to form an “ensemble EWS” that performs well at the individual level would be an interesting topic for future investigation. Another way to optimize early detecting of recurrence might be by monitoring change in the mean of affect measures. We recently demonstrated that applying statistical process control to time-series data to detect increases in prodromal symptoms resulted in higher sensitivity and accuracy than found in the current study (Schreuder et al., 2024; Smit & Snippe, 2023; Snippe et al., 2023).
A limitation of the current study was its small between-persons sample size. As Voelkle et al. (2014) pointed out, in a realistic world, researchers are forced to make the trade-off between maximizing the number of participants and maximizing the number of observations per participant. Furthermore, this study was designed as a replicated single-subject design with the aim to systematically replicate the finding that CSD precedes recurrence of depressive symptoms in multiple individuals. Although we obtained the required intensive longitudinal data (number of observations per individual: Mdn = 545, range = 344–609) in a sample that was unprecedentedly large for such an intensive within-persons design (N = 37), the between-persons sample size was still on the small side for statistical testing at the between-persons level. The combination between the medium between-persons sample size and the small to medium effect size (Cohen’s d around 0.36 depending on the model settings used) may explain why the difference in the trend in autocorrelation did not reach significance. Furthermore, the accurate identification of transitions is an important area for further study. Although the current study was strengthened by combining quantitative and qualitative criteria to identify depressive recurrence, a thorough conceptual and empirical examination of the timescale and size of clinically meaningful symptom change is warranted (Helmich et al., 2021).
This study is a strong addition to the existing literature because we were able to capture what happens just before depressive-symptom transitions in multiple individuals. Our findings provide important empirical evidence that the process of within-persons destabilization in affect over time is stronger on average and occurs more often in participants with transitions toward recurrence of depression than in individuals that remain in remission. Despite initial promise, monitoring EWSs does not appear promising for clinical applications because EWSs did not precede recurrence of depression in the majority of the sample.
Supplemental Material
sj-docx-1-cpx-10.1177_21677026241305136 – Supplemental material for Critical Slowing Down in Momentary Affect as Early Warning Signal of Impending Transitions in Depression
Supplemental material, sj-docx-1-cpx-10.1177_21677026241305136 for Critical Slowing Down in Momentary Affect as Early Warning Signal of Impending Transitions in Depression by Arnout C. Smit, Marieke A. Helmich, Laura F. Bringmann, Albertine J. Oldehinkel, Marieke Wichers and Evelien Snippe in Clinical Psychological Science
Footnotes
Acknowledgements
We thank the participants for their time and effort, De Regenboog Apotheek for their assistance in the recruitment of participants, M. Messchendorp and R. de Vries for data collection, and P. C. Groot for his input on the study design. We also wish to acknowledge the insightful input from members of the larger TRANS-ID team, including Yoram K. Kunkels, Robin N. Groen, Harriette Riese, Sandip V. George, and Fionneke M. Bos.
Transparency
Action Editor: Pim Cuijpers
Editor: Jennifer L. Tackett
Author Contributions
Writing – review & editing.
References
Supplementary Material
Please find the following supplemental material available below.
For Open Access articles published under a Creative Commons License, all supplemental material carries the same license as the article it is associated with.
For non-Open Access articles published, all supplemental material carries a non-exclusive license, and permission requests for re-use of supplemental material or any part of supplemental material shall be sent directly to the copyright owner as specified in the copyright notice associated with the article.