
Abstract
Whereas sudden gains and losses (large shifts in symptom severity) in patients receiving psychotherapy appear abrupt and hence may seem unexpected, hypotheses from complex-systems theory suggest that sudden gains and losses are actually preceded by certain early-warning signals (EWSs). We tested whether EWSs in patients’ daily self-ratings of the psychotherapeutic process predicted future sudden gains and losses. Data were collected from 328 patients receiving psychotherapy for mood disorders who completed daily self-ratings about their therapeutic process using the Therapy Process Questionnaire (TPQ). Sudden gains and losses were classified from the Problem Intensity scale of the TPQ. The other items of the TPQ were used to compute the EWSs. EWSs predicted an increased probability for sudden gains and losses in a 4-day predictive window. These results show that EWSs can be used for real-time prediction of sudden gains and losses in clinical practice.
Keywords
Although the beneficial effects of psychotherapy are firmly established, evidence-based explanations of how psychotherapy leads to change are lacking (Kazdin, 2009; Lorenzo-Luaces & DeRubeis, 2018). One central issue in the study of change processes in psychotherapy is the establishment of a timeline in individual change trajectories (i.e., a temporal relation between a hypothesized mechanism and a symptom severity measure; Kazdin, 2007). Establishing such a timeline for individual change trajectories is greatly complicated by the ways in which symptom severity changes over time. Many studies show that symptom severity often does not change gradually over the course of treatment but discontinuously, with large shifts and fluctuations that become apparent when multiple repeated measures are taken (for a review, see Hayes, Laurenceau, Feldman, Strauss, & Cardaciotto, 2007). A better understanding of these discontinuous symptom changes is therefore a key step in the study of how change occurs in psychotherapy.
The most well-known discontinuous change patterns are sudden gains (abrupt changes toward lower symptom severity) and sudden losses (abrupt changes toward higher symptom severity; Lutz et al., 2013; Tang & DeRubeis, 1999). Sudden gains and losses are common (found in 17%–50% of patients receiving psychotherapy for mood and anxiety disorders; Busch, Kanter, Landes, & Kohlenberg, 2006; Hardy et al., 2005; Hofmann, Schulz, Meuret, Moscovitch, & Suvak, 2006; Kelly, Roberts, & Ciesla, 2005) and predictive of treatment outcome (e.g., Helmich et al., 2019; Lutz et al., 2013; Wucherpfennig, Rubel, Hollon, & Lutz, 2017). Certain nonspecific treatment factors such as hope, positive expectations, and the therapeutic relationship have been associated with sudden gains (Lutz et al., 2013; Stiles et al., 2003). These associations, however, do not explain why sudden gains and losses occur, and these phenomena remain difficult to understand from the conventional perspective on clinical change, in which symptom severity is assumed to change gradually and in proportion to intervention efforts (Schiepek, 2009; Stiles & Shapiro, 1994).
Recently, several authors proposed novel explanations for sudden gains and losses based on complex systems theory (Gelo & Salvatore, 2016; Hayes et al., 2007; Schiepek, 2009). In short, complex systems theory states that certain general principles apply to change processes in various systems, ranging from physics to psychology (Haken, 1983; Haken & Schiepek, 2010; Schöner & Kelso, 1988; Thelen & Smith, 1994). One such principle is that complex systems have certain tipping points in which abrupt and discontinuous changes, called order transitions, from one system state to another occur. A familiar example is the transition from liquid water into gas when boiling water. Under gradually increasing heat, the water remains liquid until the tipping point of 100 °C (under normal air pressure) is met and the transition toward the gaseous phase takes place. 1
From a complex system perspective, discontinuous changes in psychopathology (e.g., sudden gains and losses) can be seen as order transitions in a complex system of interacting cognitions, emotions, behaviors, and physiology (Cramer et al., 2016; Hofmann, Curtiss, & McNally, 2016; Schiepek, Eckert, Aas, Wallot, & Wallot, 2016). Both formal theory (Haken, 1983) and empirical findings (Scheffer et al., 2012) show that order transitions in a wide variety of systems are preceded by periods of instability that give rise to certain early-warning signals (EWSs). One such EWS is the presence of critical fluctuations, heavy and irregular fluctuations in the system’s behavior (see Fig. 1). Another EWS, not discussed here, is critical slowing down, an increasingly slow recovery from perturbations (see Scholz, Kelso, & Schöner, 1987). Thus, although sudden gains or losses appear abrupt and hence may seem unexpected, complex systems theory states that sudden gains and losses represent order transitions that are actually preceded by EWSs that can be identified when looking at the fluctuations in a patient’s cognitions, emotions, behavior, and/or physiology over time.
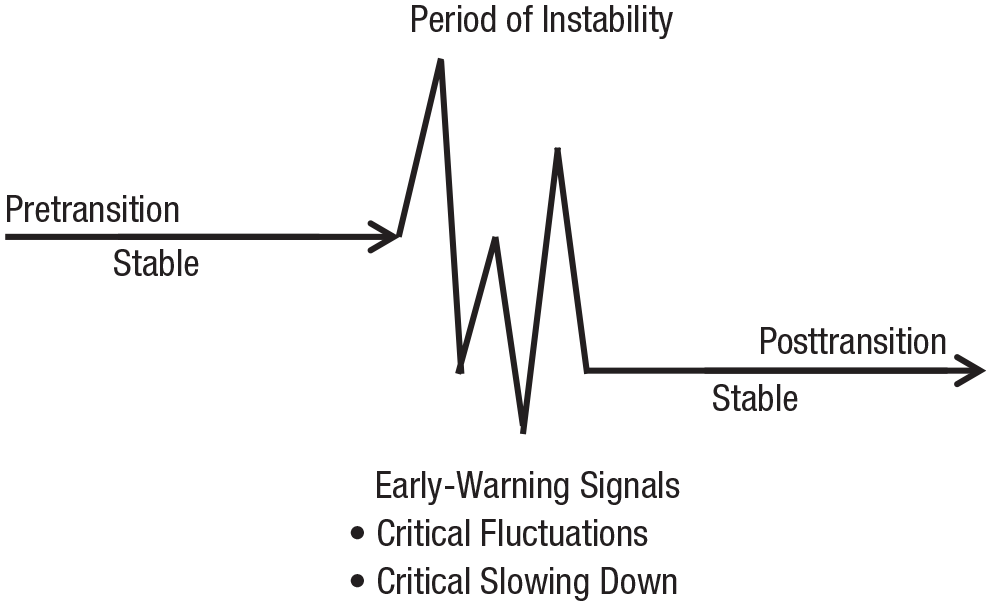
Conceptual illustration of an order transition. The transition from one stable state to another stable state is characterized by a period of instability in which the behavior of the system often displays specific properties (e.g., critical fluctuations and critical slowing down) that can be considered early-warning signals of an imminent transition between stable states.
Several studies have linked fluctuation measures to clinical improvement in patients. Fluctuating emotional behavior in therapy sessions, analyzed from observational data of psychotherapeutic processes, has been related to more positive treatment outcome in patients with depression (Hayes & Strauss, 1998), personality disorders (Hayes & Yasinski, 2015) and conduct problems (Lichtwarck-Aschoff, Hasselman, Cox, Pepler, & Granic, 2012). In addition, critical fluctuations in daily self-ratings of patients’ psychotherapeutic process have been linked to more positive treatment outcomes in patients with obsessive-compulsive disorder (Heinzel, Tominschek, & Schiepek, 2014; Schiepek, Tominschek, & Heinzel, 2014), mood disorders (Olthof et al., 2019), and a group of patients with various diagnoses (Haken & Schiepek, 2010, pp. 416–422). In another study using frequent self-ratings, higher variability in emotions during baseline was related to a greater symptom decrease at follow-up for patients with mood disorders (van de Leemput et al., 2014). The same study found that higher variability in emotions in a nonclinical sample was related to a greater symptom increase over time.
Although these studies demonstrated a relation between fluctuations and outcome measures of symptom severity, no studies have yet tested critical fluctuations as an EWS for specific order transitions in symptom severity, such as sudden gains and losses, on an individual level. The present study is the first to examine whether EWSs predict future sudden gains and losses in a large sample of patients who received psychotherapy for mood disorders. EWSs and symptom severity were measured each day of treatment to establish a suitable timeline (Kazdin, 2007). Sudden gains and losses in patients’ symptom severity were hypothesized to be preceded by a short period of increased fluctuations (i.e., critical fluctuations) in patients’ daily self-ratings of the psychotherapeutic process. Specifically, we tested whether heightened levels of fluctuations in these self-ratings were predictive of an increased probability to experience a sudden gain or loss in the subsequent 4 days of treatment. The study was specifically designed to test whether EWSs can potentially be used to prospectively predict sudden gains and losses in real-world clinical-care settings.
Method
Study sample
Data were collected as part of routine clinical practice at four clinics in Austria and Germany where patients received intensive psychotherapy. The study included 328 patients (181 women) between 18 and 69 years old (M = 43.80, SD = 11.04) who had a primary diagnosis for one of the following mood disorders: bipolar, 23 (7.0%); major depressive single episode, 148 (45.1%); major depressive recurrent, 155 (47.3%); or persistent mood disorder, 2 (0.6%), as classified according to the 10th edition of the International Statistical Classification of Diseases and Related Health Problems (World Health Organization, 1992). During treatment, patients completed the Therapy Process Questionnaire (TPQ; Schiepek, Aichhorn, & Strunk, 2012) on a daily basis using the Synergetic Navigation System (SNS; Schiepek, Aichhorn, et al., 2016), an online monitoring system used to assess therapeutic progress. The process-monitoring data were accessible for therapists and used for feedback. Patients received various integrative treatment programs that combined therapeutic elements from different theoretical approaches. The therapies were given by interdisciplinary teams of professionally trained therapists. The present data set is compiled from data from patients who completed the daily self-ratings on at least 80% of their treatment days and gave consent for scientific use of their data. Ethical approval for the application of the SNS to patient monitoring and the usage of the retrieved data was given by the ethical committee of the Salzburg County Governance. Because of a processing error, 1 patient had to be omitted from the original sample of 329 patients.
Materials
The TPQ is a questionnaire (originally in German) developed for daily self-ratings of patients receiving psychotherapy (Schiepek, Aichhorn, et al., 2016). The TPQ contains 23 items corresponding to five factors: (a) Therapy Progress, (b) Problem Intensity, (c) Relationship Quality and Trust in Therapists, (d) Dysphoric Affect, and (e) Relationships With Fellow Patients (Schiepek et al., 2012). The items of the Dysphoric Affect factor and one item of the Problem Intensity factor were answered on a visual analog scale; the other items used a 7-point Likert scale. Both scales generally ranged from not at all to very much. The Problem Intensity scale of the TPQ is a measure of subjective symptom severity and was therefore used to identify sudden gains and losses. We calculated Cronbach’s α as a measure of internal consistency for the Problem Intensity scale on both the interindividual level and intraindividual levels. The average Cronbach’s α of this scale for interindividual variability was .88 (SD = .03). For intraindividual variability, the average Cronbach’s α was .82 (SD = .10). The other items of the TPQ were not analyzed in scales but used to compute dynamic complexity (see below). Example TPQ items include: “Today I came closer to the solution to my problems” (therapy progress factor), “Today my problems bothered me” (problem intensity), “I perceive the work with my therapist(s) as helpful” (relationship quality and trust in therapist factor), “Today, I felt sad” (dysphoric affect factor), and “I can trust the other patients” (relationship with fellow patients factor).
Data analysis
Time series characteristics
The median length of the daily self-ratings was 59 days (range = 30–318 days). The median number of missing days in the time series was 1 (1.37%; range = 0−13; 0%–12.94 %). Missing days were filled with the data of the day before because imputation is necessary for the computation of the EWSs and the classification of sudden gains or losses. See Figure 2a for an example of a daily self-rating time series.
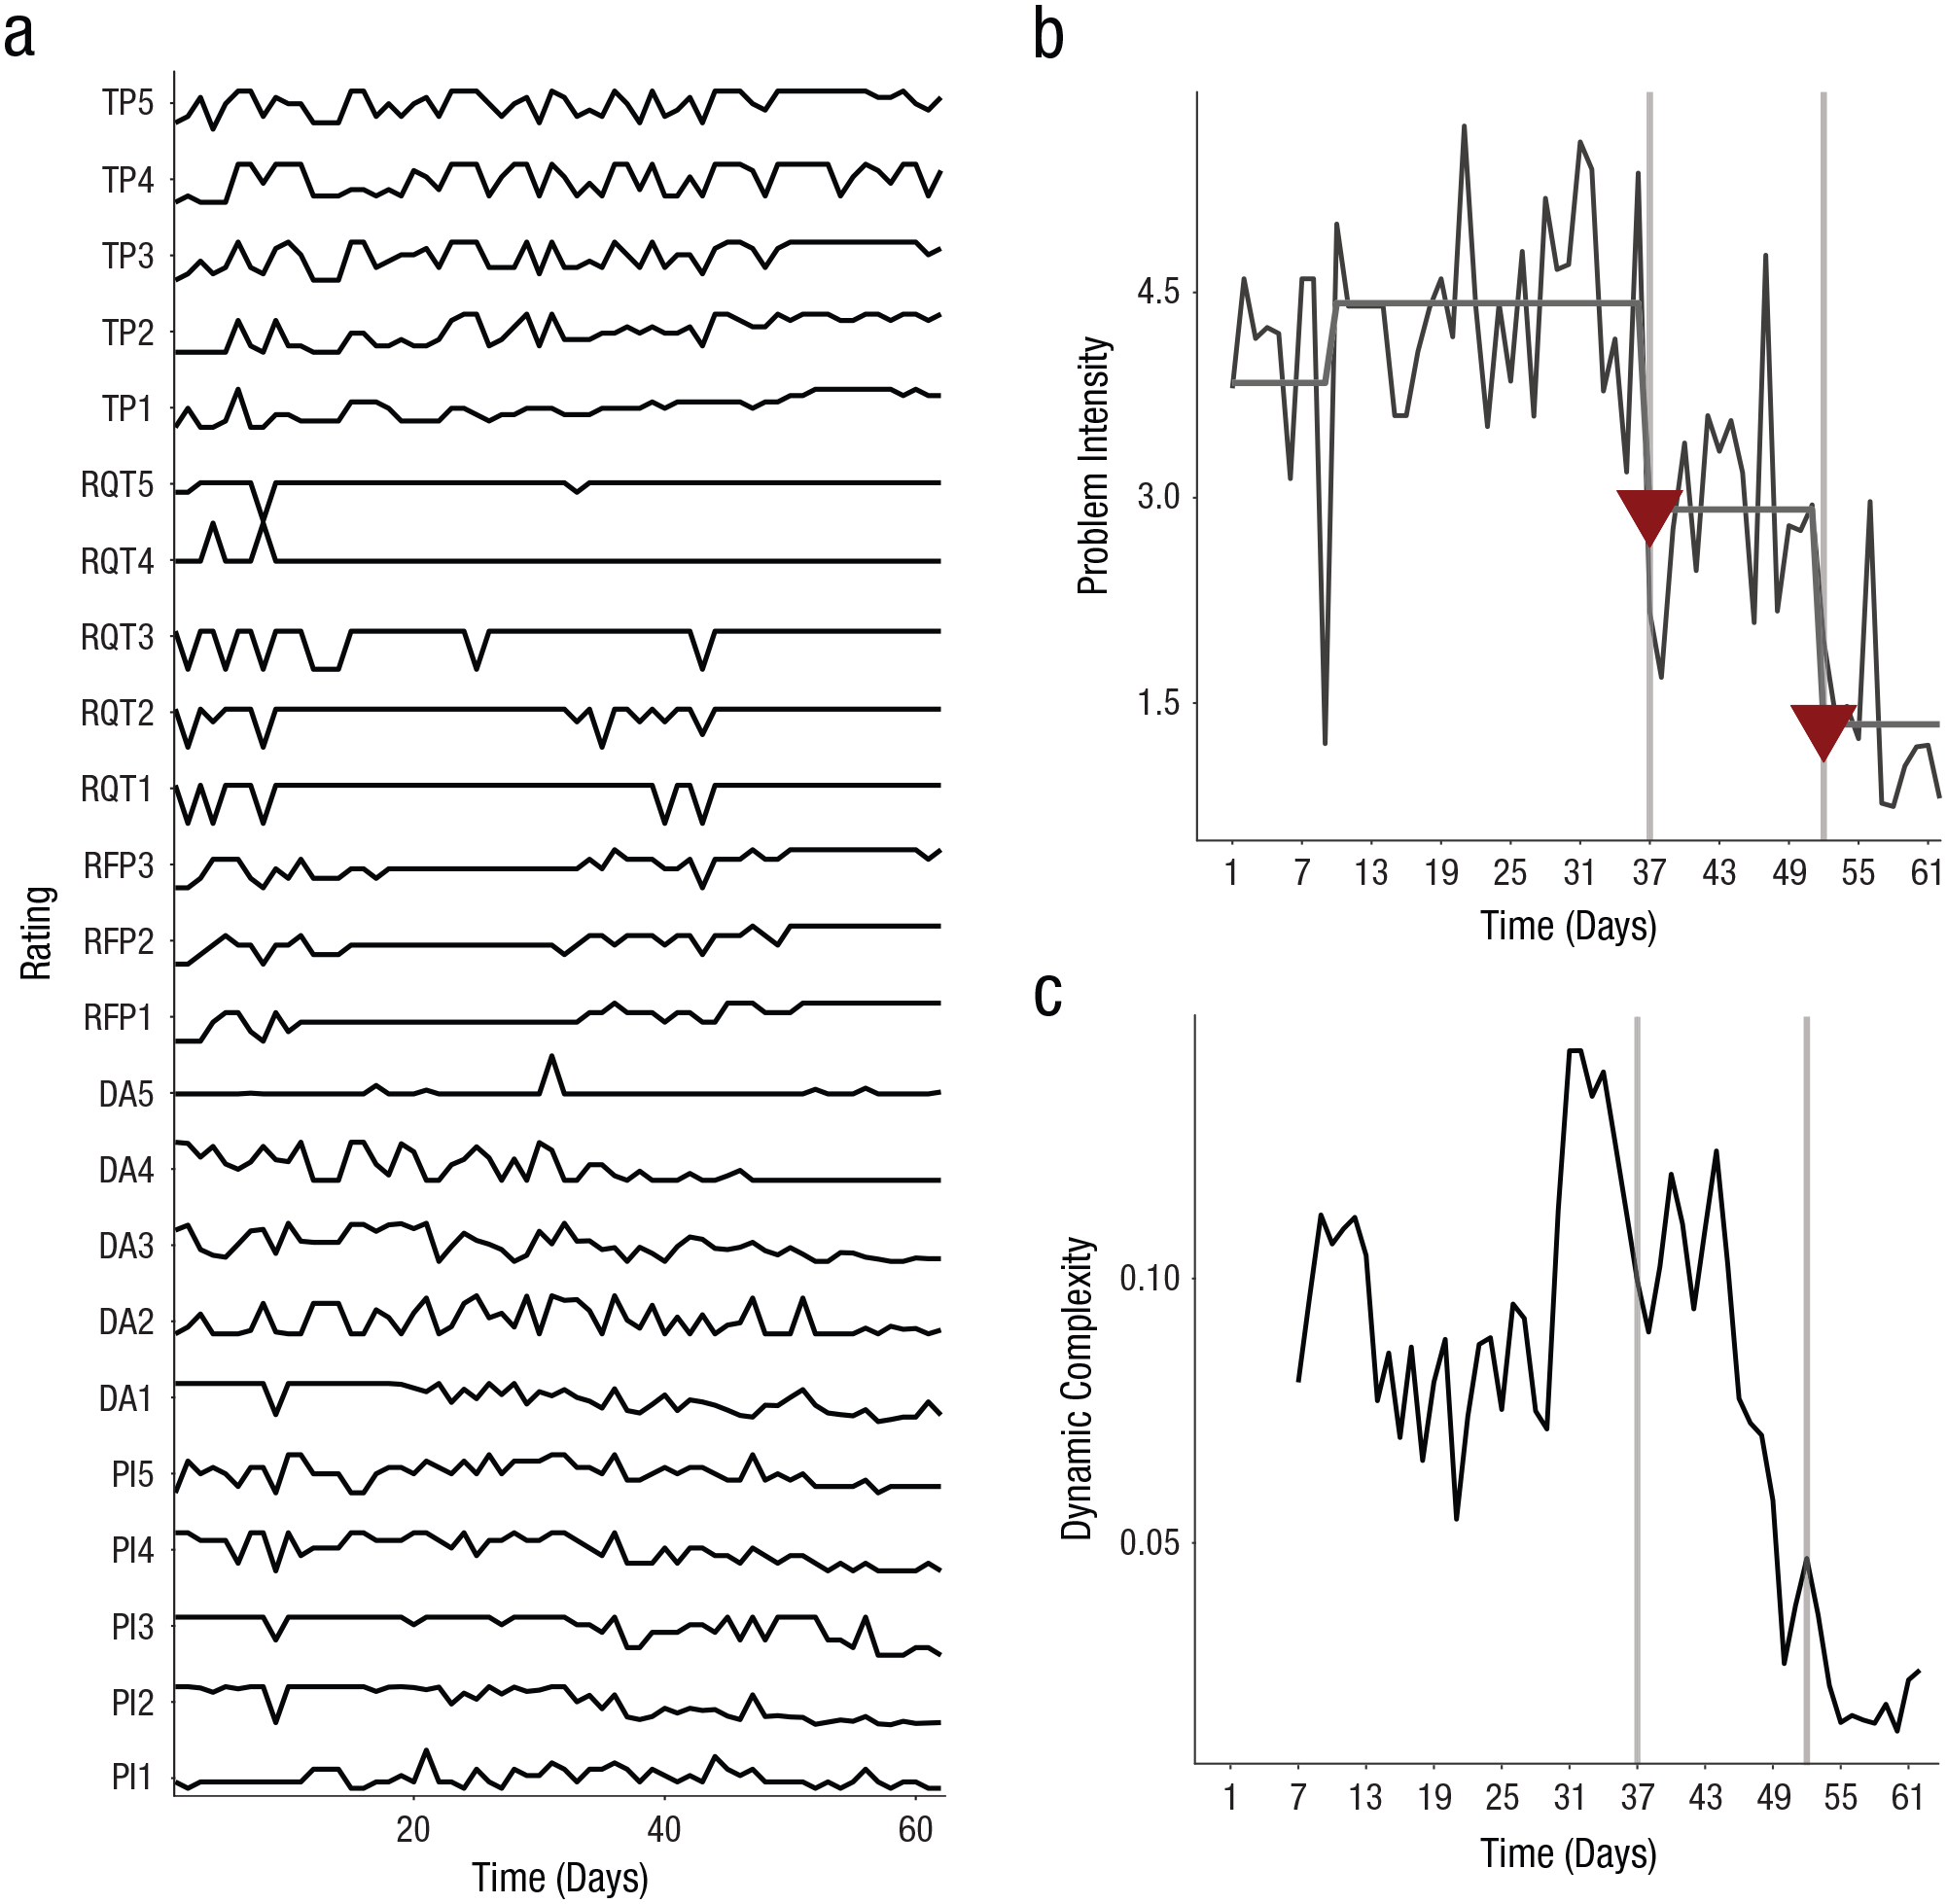
Data visualization from one patient included in the study with (a) daily self-ratings on the Therapy Process Questionnaire (TPQ), (b) sudden gains in the Problem Intensity (PI) scale, and (c) dynamic complexity. Raw scores on the items of the TPQ are shown in (a). The values on the PI items are included in the PI scale and used for the classification of sudden gains; the other items of the TPQ are used to calculate the early-warning signals (EWSs). Problem Intensity over time is graphed in (b). The gray horizontal line indicates segments of the time series classified with recursive partitioning. Triangles and vertical gray lines indicate sudden gains. The average dynamic complexity of the TPQ items (except those from the Problem Intensity scale) over time is graphed in (c). TP = Therapy Progress items; RQT = Relationship Quality and Trust in Therapists items; RFP = Relationships With Fellow Patients items; DA = Dysphoric Affect items; PI = Problem Intensity items.
Sudden gains and losses
A sudden gain or loss was defined as a shift toward a lower (gain) or a higher (loss) level of Problem Intensity. We classified sudden gains and losses with recursive partitioning, which uses regression trees to identify segments of the time series that have a stable mean value, thereby identifying mean shifts (Lewis & Stevens, 1991). Decision rules based on the sudden-gain literature (e.g., Lutz et al., 2013) were added to the recursive partitioning algorithm. These rules entail that a true gain or loss should be (a) large in absolute terms, (b) large relative to pregain or preloss scores, and (c) in between two periods of relatively stable scores. In the present study, a sudden gain or loss had to (a) involve an absolute shift in Problem Intensity of at least 1.5 points on a scale of 0 to 6, (b) involve a relative shift of at least 25%, and (c) be in between two stable periods of Problem Intensity of at least 7 days. The criterion of an absolute shift of 1.5 points is relatively conservative, which ensures that only considerably large shifts are identified as sudden gains and losses. As a consequence of this conservative absolute shift criterion, the second decision rule from the sudden-gain literature is actually redundant because 25% in the range of 0 to 6 is already 1.5 points.
Early-warning signals
EWSs were measured using the dynamic complexity algorithm, a measure designed for the identification of critical fluctuations in short and coarse-grained time series (Schiepek, 2003; Schiepek & Strunk, 2010). Dynamic complexity is computed by multiplication of a fluctuation measure, F, that is sensitive to the strength and number of fluctuations in a time series, and a distribution measure, D, that is sensitive to the uniformity of the distribution of values within the theoretical range of the values in a time series (for technical details, see Dynamic Complexity in the Supplemental Material available online).
Dynamic complexity was computed for all 18 items of the TPQ that are not included in the Problem Intensity scale. This was done separately for each item for every patient using a backward 7-day overlapping moving window, resulting in 18 dynamic complexity time series per patient. The 7-day window size controls for weekend effects and was expected to be short enough for prediction purposes. A backward window was used to ensure that possible critical fluctuations were indeed modeled to predict future sudden gain or loss. We calculated two predictors from the dynamic complexity values. The first was local dynamic complexity (LDC), the highest dynamic complexity value, averaged over all items, within 4 days preceding a possible sudden gain or loss. The 4-day window was chosen because critical fluctuations are known to be present just before a transition but disappear abruptly at the moment of transition (Kelso, Scholz, & Schöner, 1986; Van Orden, Kloos, & Wallot, 2011). Hence, a short but not too short window of four time steps seemed appropriate (similar to Stephen, Dixon, & Isenhower, 2009). Second, the binary variable cumulative complexity peak (CCP) was included, indicating whether the number of simultaneous peaks in dynamic complexity values of single items was significantly high one day before a possible sudden gain or loss (for technical details, see Schiepek, 2003). Last, a third early-warning predictor, delay (i.e., the number of days passed since a CCP) was included. This variable was aimed at modeling a possible lagged effect of a CCP on sudden gains and losses that may occur if CCPs are not predictive on a 1-day lag but are predictive on a larger lag.
Event-history model
The relation between EWSs and sudden gains and losses was tested with a multilevel event-history model using the function glmer as implemented in the lme4 package (Bates, Mächler, Bolker, & Walker, 2014) for the R software environment (Version 3.5; R Core Team, 2018). Because of a high correlation among two early-warning predictors (r = .93), we had to exclude one predictor from the preregistered model (see Multicollinearity in the Preregistered Model and Table S2 in the Supplemental Material). The final model included the occurrence of a sudden gain or loss as binomial outcome variable (1 = the occurrence of a sudden gain or loss, 0 = no sudden gain or loss). When a patient had a sudden gain or loss, the patient was removed from data analysis for the next 7 days because it was not possible to have another gain or loss within this period (because Problem Intensity per definition had to be stable for the 7 days after a gain or loss). This temporary exclusion is necessary in event-history analysis in which both values of the binomial outcome need to be possible at each time point in the model. Because there was considerable variation in time series length, we censored time series at day 100 (because most patients had a treatment duration between 1 and 3 months), thereby shortening the time series for 48 patients (15% of all patients) and resulted in the exclusion of five late sudden gains and losses (3% of all sudden gains and losses).
The model included the time-varying EWS predictors LDC, CCP, and delay described above. The effect of time on sudden gains or losses was modeled by including the predictors duration, the number of days passed since the occurrence of an event or the start of psychotherapy, and the predictor time, indicating the day of treatment. The inclusion of the predictor duration is essential in event-history analysis and controls for so-called censored cases (i.e., patients who did not have a sudden gain or loss within the observation time). Likewise, this predictor is necessary to reliably model patients with multiple sudden gains or losses. The inclusion of the predictor time is necessary as sudden gains tend to occur often in the beginning of treatment (i.e., early responses; Haas, Hill, Lambert, & Morrell, 2002). Last, the three-way interaction between LDC, CCP, and duration and the nested two-way interactions between those variables were included. This was done because the possible predictive value of LDC and CCP might change over time in the period that no gain or loss occurs. In addition, a possible CCP could be increasingly predictive when LDC is high as well. This two-way interaction could also be influenced by duration. Individual differences in the number of sudden gains or losses were accounted for by including a random intercept. Random slopes were included for all continuous predictors. The equation, in the language of the package lme4 (Bates et al., 2014) for the R software environment (R Core Team, 2019), is given in Equation 1. We evaluated the odds ratios of the fixed effects coefficients with 95% likelihood profile confidence intervals:

Follow-up models
Although our hypothesis, based on complex systems theory, is that EWSs predict both sudden gains and losses, it is important from a clinical perspective to empirically test whether EWSs are also predictive when only gains or only losses are modeled. Therefore, an explorative follow-up analysis was conducted to examine the predictive value of EWSs for sudden gains and sudden losses separately. For this purpose, two different event-history models similar to the one described above were run. Patients with only sudden gains were included in the gain model. Patients with only sudden losses were included in the loss model. Patients with both sudden gains and losses were included in both models; their sudden gains were predicted in the gain model, and their sudden losses were predicted in the loss model. Patients without any sudden gains and losses were included in both models. It should be emphasized that these follow-up models are explorative and therefore cannot be interpreted as a confirmative hypothesis test.
Results
Sudden gains and losses
Of the 328 patients, 114 (34.8%) experienced one or multiple sudden gains and/or losses. Overall, 112 sudden gains and 64 sudden losses were classified (see Table S1 in the Supplemental Material). For an illustration of sudden gains, see Figure 2b.
Early-warning signals for sudden gains or losses
Event-history model
Of the early-warning predictors, LDC positively predicted sudden gains and losses with an odds ratio (OR) of 1.55. This means that an increase in LDC of 1 SD relates to a 55% increased probability for the occurrence of a sudden gain or loss within 4 days after the peak (Table 1). See Figure 2c for an example of increased dynamic complexity before a sudden gain or loss. The effects of the binary predictor CCP and delay, the number of days after such a peak, were not significantly related to sudden gains and losses.
Results for Association Between Sudden Gains and Losses and Predictors
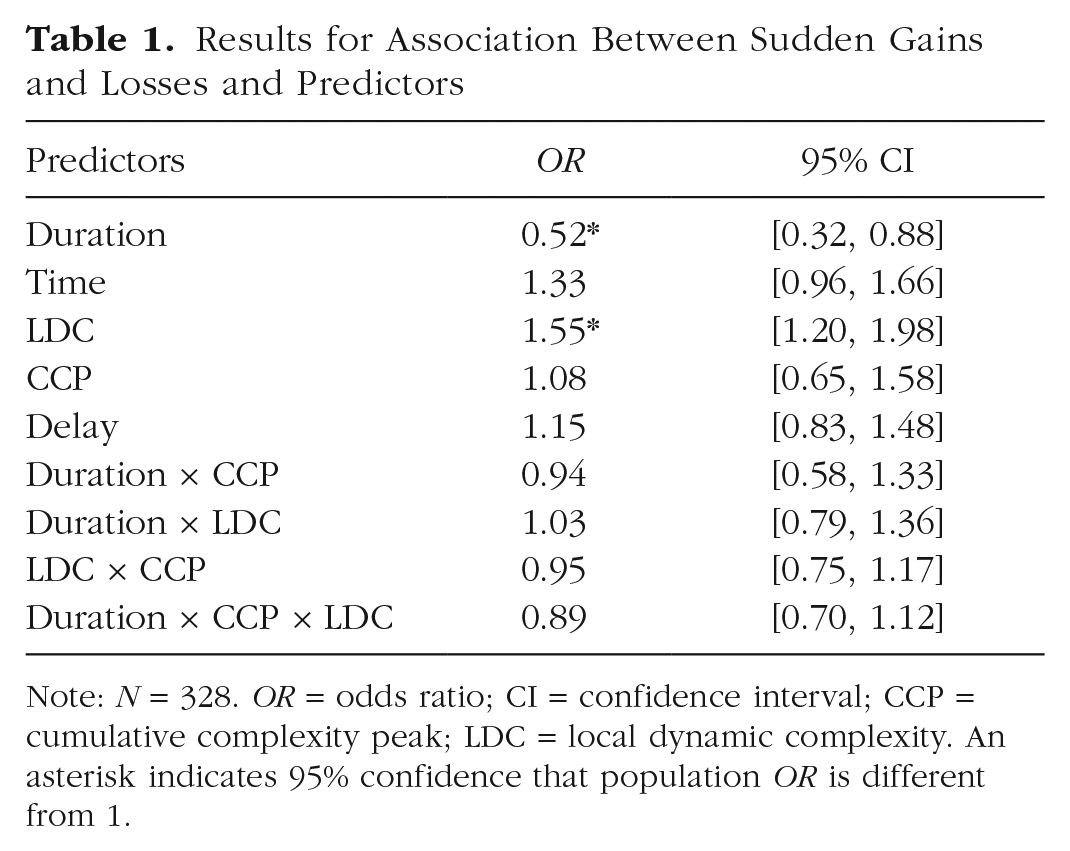
Note: N = 328. OR = odds ratio; CI = confidence interval; CCP = cumulative complexity peak; LDC = local dynamic complexity. An asterisk indicates 95% confidence that population OR is different from 1.
There was a negative relation between the predictor duration and the occurrence of sudden gains and losses, meaning that the longer the time since the start of therapy or a prior gain or loss, the less likely it is that a patient will experience a sudden gain or loss. In other words, patients often experienced sudden gains or losses relatively early in the therapy process (possibly an early response; Lambert, 2005) and/or shortly after a prior gain or loss, indicating a possible cascade of transitions for some patients. The overall effect of the predictor time (i.e., time in therapy) was not significantly related to the occurrence of sudden gains and losses. The higher-order interaction effects included in the model were not statistically significant.
Follow-up models
As described above, the gain model included patients with sudden gains, patients with sudden gains and losses (with only the gain being predicted), and patients with neither a sudden gain nor loss (n = 304). In the gain model, the early-warning predictor LDC positively predicted sudden gains with an OR of 1.39. The confidence interval, however, shows that one cannot be 95% confident that the population OR is greater than 1 (Table 2). The predictors time and duration significantly predicted sudden gains. The effect of duration shows that longer durations since the start of therapy or a previous sudden gain lead to a lower probability of a sudden gain to occur. In contrast, the effect of time shows that a longer time in therapy leads to a higher probability for a sudden gain. Last, the interaction between LDC, CCP, and duration significantly predicted sudden gains. When there is a CCP and LDC is high, this is related to a lower probability of sudden gains when the value of duration is higher. The other predictors were not significantly related to the occurrence of sudden gains.
Results for the Association Between Predictors and Sudden Gains and Losses in Separate Models for Gains and Losses
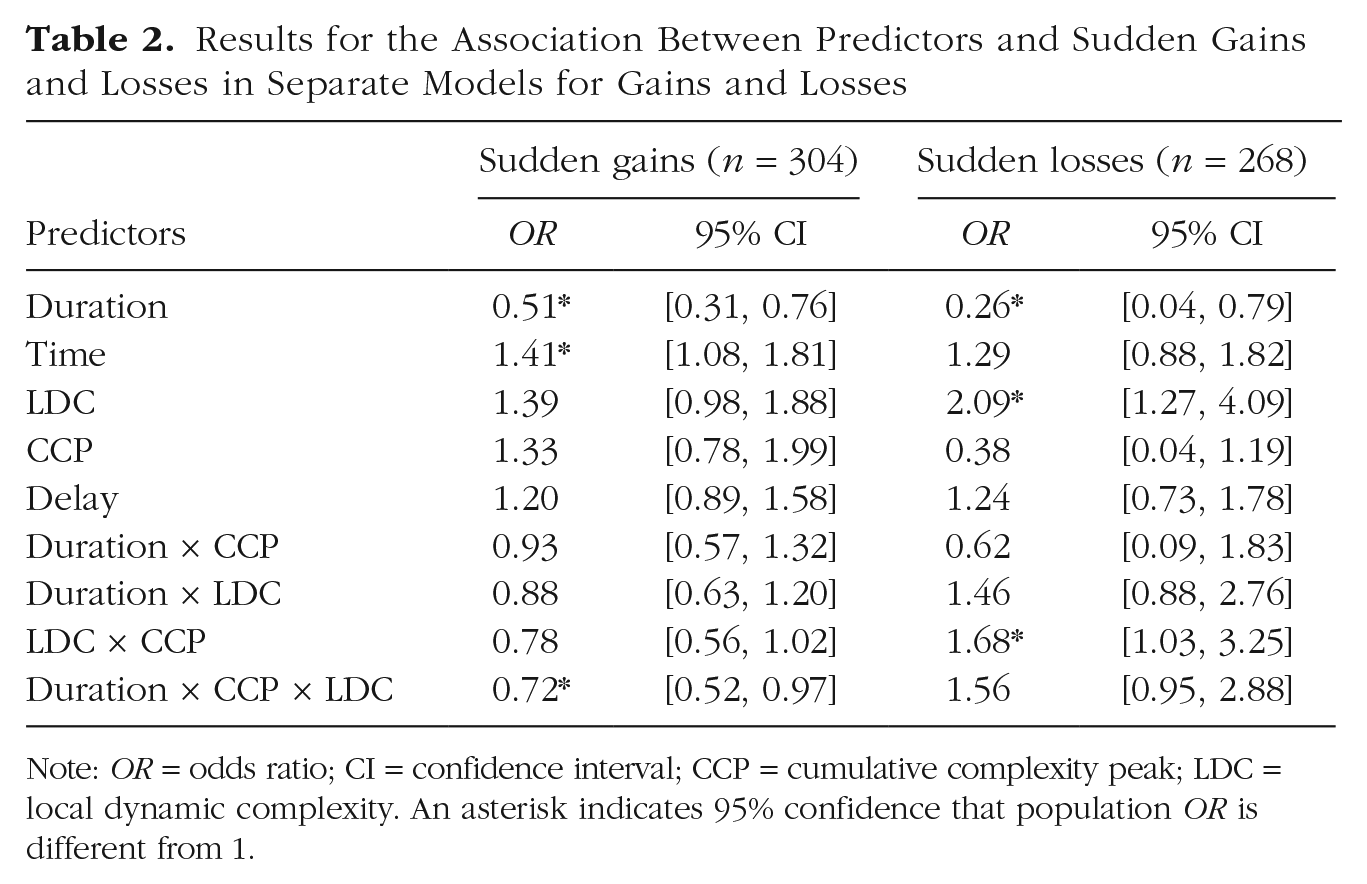
Note: OR = odds ratio; CI = confidence interval; CCP = cumulative complexity peak; LDC = local dynamic complexity. An asterisk indicates 95% confidence that population OR is different from 1.
The loss model included patients with sudden losses, patients with sudden gains and losses (with only the losses being predicted), and patients with neither a sudden gain nor a sudden loss (n = 268). In the loss model, the early-warning predictor LDC positively predicted sudden losses with an OR of 2.09 (Table 2). The interaction between LDC and CCP also significantly predicted sudden losses. In the presence of a CCP, higher LDC was related to an even greater probability for a sudden loss. The significant effect of the predictor duration shows that longer durations since the start of therapy or a previous loss leads to a lower probability for a sudden loss to occur. The other predictors were not significantly related to the occurrence of sudden losses.
Discussion
This study tested critical fluctuations as EWSs for sudden gains and losses in a large sample of patients. We found higher dynamic complexity, an indicator for critical fluctuations, in daily self-ratings of the psychotherapeutic process to predict an increased probability for sudden gains and losses within the next 4 days of treatment. This finding supports the hypothesis that sudden gains and losses reflect order transitions that are preceded by EWSs in daily self-ratings that can be used for prediction. The occurrence of a significant number of simultaneous peaks in dynamic complexity values of single items (i.e., a CCP) and the number of days after such a CCP were not significantly related to the occurrence of sudden gains and losses on the next day.
Explorative follow-up models showed that the predictive value of LDC remains when only sudden gains or only sudden losses are predicted. It should be noted, however, that for sudden gains, we cannot be 95% confident that the population OR for LDC is larger than 1. The confidence intervals in the explorative models are relatively large compared with the full model, likely because of a loss of power. The results of the separate analysis for sudden gains and losses showed some unexpected higher-order interaction effects. We avoid post hoc interpretation here because it is likely that the estimates of these higher-order interaction effects are underpowered in the follow-up models. The question of whether different early-warning predictors have different predictive value for sudden gains and losses remains an open question for future research involving larger samples of patients. Overall, the findings that EWSs predicted both sudden gains and losses seem to corroborate our assumption that although sudden gains and losses are very different phenomena in a clinical sense, they are similar in the fact that they both represent order transitions, a universal change phenomenon that can be predicted with general EWSs.
The result that sudden gains and losses can be predicted with EWSs is in line with previous research showing that instability and fluctuations in the therapeutic process are related to better treatment outcomes (Hayes & Strauss, 1998; Hayes & Yasinski, 2015; Lichtwarck-Aschoff et al., 2012; Olthof et al., 2019; Schiepek et al., 2014; Van de Leemput et al., 2014). This study extends previous work by showing that critical fluctuations indeed serve as an EWS that has real-time predictive value for specific clinical transitions in individual change trajectories (i.e., sudden gains and losses). These results support the notion that instability can be seen as a precursor for sudden gains and losses. Because the study took place in a real-world clinical-care setting, the present findings also show that real-time prediction with EWSs using daily self-ratings is feasible in clinical practice (when necessary recourses are provided).
The meaning and (clinical) implications of these results have to be interpreted within the broader context of complex systems theory. First, it must be emphasized that EWSs are general indicators of instability and not predictors of specific kinds of order transitions. Complex systems theories state that the same EWSs will precede very different order transitions (e.g., both sudden gains and losses), a claim that is supported by our results and many other studies on many different systems (Kelso, 2010; for reviews, see Scheffer et al., 2009; Scheffer et al., 2012). Second, EWSs are not always followed by an order transition. Although instability often results in an order transition, it is possible that a system falls back into the previous state after a period of instability (Gelo & Salvatore, 2016). Strictly speaking, EWSs are thus best understood as indicators of instability in present time. This instability is predictive because it often results in an order transition in the near future.
EWSs as indicators of instability have clinical relevance because instability in complex systems signals sensitive periods in which a system is more open to change. During periods of instability, systems show an increased sensitivity to external influences (Schöner & Kelso, 1988; Thelen & Smith, 1994). This means that small interventions targeted in these sensitive periods can have disproportionately large effects compared with their effects during more stable periods of the process (Granic, 2005; Stephen et al., 2009). This hypothesis still warrants further research in the context of psychotherapy. If confirmed, this would have large implications for the personalization of care. Identifying sensitive periods and feeding back this information to clinicians can potentially enable them to timely adapt their treatment efforts to these sensitive periods in a patient’s change process.
The main strength of this study is that daily self-ratings were taken across the entire treatment period, and because of that, the real-time predictive value of EWSs for sudden gains and losses could be evaluated with an appropriate timeline (Kazdin, 2007). Our analysis did not aggregate over time but modeled the relation between EWSs and symptom severity within individuals across the entire psychotherapeutic process (see Bos & De Jonge, 2014; Fisher, Medaglia & Jeronimus, 2018; Wichers, Schreuder, Goekoop, & Groen, 2019). A limitation of our analysis is that the dynamic complexity time series of single items were aggregated to compute the EWSs predictors. We hereby provide an estimate of the overall instability in a patient’s process, but it comes at a cost of estimating predictive contributions of single items. Future research demanding considerably larger sample sizes could employ analyses that model each item on each day separately, thereby testing the predictive power of specific items for specific transitions (Wichers et al., 2019).
Data collection took place in a real-world clinical-care setting, supporting the ecological validity of our results. A limitation regarding the study sample is that the data set was compiled from patients who completed the self-ratings on at least 80% of their treatment days. There are also patients who did not complete the daily self-ratings this often. A compliance study that was done on a subset of the data set used in this study suggests that about 79% of all patients who started the process monitoring completed the questionnaire on at least 80% of the treatment days (Schiepek, Aichhorn, et al., 2016). High compliance rates are pivotal for implementing EWSs in clinical care. Future research should therefore also explore whether it is possible to find predictive EWSs in passively collected data, such as contextual, movement, or heart rate data.
In this study, we limited our focus on EWSs for sudden gains and losses because they are common and well-defined clinical transitions. There are likely to be, however, many other order transitions that can occur in psychotherapy, such as transitions in insight, affect, or progress. Likewise, more dramatic clinical transitions, such as the onset of psychopathology (Nelson et al., 2017), relapse (Wichers, Groot, Psychosystems, ESM Group, & EWSs Group, 2016), or suicide attempts (Fartacek, Schiepek, Kunrath, Fartacek, & Plöderl, 2016), are also hypothesized to reflect order transitions that are preceded by general EWSs. The present study is a first step in exploring the potential of EWSs for real-time prediction. Future research should examine whether EWSs are indeed predictive for different clinical transitions as well.
Conclusion
This study demonstrates that the presence of critical fluctuations in patients’ daily self-ratings is a predictive EWS of future clinical transitions, in this case, sudden gains and losses. These findings show that daily monitoring of patients’ psychotherapeutic process by means of self-rating is suitable to compute EWSs and that if this information is fed back to clinicians, it can be used for the real-time prediction of sudden gains and losses and, potentially, the personalization of care.
Supplemental Material
Olthof_Open_Practices_Disclosure – Supplemental material for Critical Fluctuations as an Early-Warning Signal for Sudden Gains and Losses in Patients Receiving Psychotherapy for Mood Disorders
Supplemental material, Olthof_Open_Practices_Disclosure for Critical Fluctuations as an Early-Warning Signal for Sudden Gains and Losses in Patients Receiving Psychotherapy for Mood Disorders by Merlijn Olthof, Fred Hasselman, Guido Strunk, Marieke van Rooij, Benjamin Aas, Marieke A. Helmich, Günter Schiepek and Anna Lichtwarck-Aschoff in Clinical Psychological Science
Supplemental Material
Olthof_Supplemental_Material – Supplemental material for Critical Fluctuations as an Early-Warning Signal for Sudden Gains and Losses in Patients Receiving Psychotherapy for Mood Disorders
Supplemental material, Olthof_Supplemental_Material for Critical Fluctuations as an Early-Warning Signal for Sudden Gains and Losses in Patients Receiving Psychotherapy for Mood Disorders by Merlijn Olthof, Fred Hasselman, Guido Strunk, Marieke van Rooij, Benjamin Aas, Marieke A. Helmich, Günter Schiepek and Anna Lichtwarck-Aschoff in Clinical Psychological Science
Footnotes
Acknowledgements
We thank Wolfgang Aichhorn, Barbara Stöger-Schmidinger, Helmut Kronberger, Brigitte Krawanja, Brigitte Matschi, Fide Ingwersen, Elke Pauly, and Jens-Peter Rose for their contribution to the data collection. We are grateful to Aaron Fisher, Lorenzo Lorenzo-Luaces, and one anonymous reviewer for their constructive input.
Action Editor
Christopher G. Beevers served as action editor for this article.
Author Contributions
M. Olthof, G. Strunk, M. van Rooij, G. Schiepek, and A. Lichtwarck-Aschoff designed research. All of the authors performed research. M. Olthof, F. Hasselman, and G. Strunk analyzed data. M. Olthof and A. Lichtwarck-Aschoff drafted the manuscript, and F. Hasselman, G. Strunk, B. Aas, M. A. Helmich, and G. Schiepek contributed to critical revisions. All of the authors approved the final manuscript for submission.
Declaration of Conflicting Interests
G. Schiepek is director of the Center for Complex Systems, which is the publisher and developer of the Synergetic Navigation System monitoring system that was used for data collection. The remaining authors declared that there were no conflicts of interest with respect to the authorship or the publication of this article.
Funding
M. A. Helmich is supported by the European Research Council (ERC) under European Union Horizon 2020 research and innovation programme (ERC-CoG-2015) Grant 681466.
Open Practices
All materials have been made publicly available via Open Science Framework and can be accessed at https://osf.io/hm43n. The design and analysis plans for the experiments were preregistered at Open Science Framework and can be accessed at https://osf.io/xku9c. The complete Open Practices Disclosure for this article can be found at http://journals.sagepub.com/doi/suppl/10.1177/2167702619856343. This article has received badges for Open Materials and Preregistration. More information about the Open Practices badges can be found at ![]() .
.
Notes
References
Supplementary Material
Please find the following supplemental material available below.
For Open Access articles published under a Creative Commons License, all supplemental material carries the same license as the article it is associated with.
For non-Open Access articles published, all supplemental material carries a non-exclusive license, and permission requests for re-use of supplemental material or any part of supplemental material shall be sent directly to the copyright owner as specified in the copyright notice associated with the article.