
Abstract
Background:
Understanding the psychological well-being (PWB) of university staff and factors that influence it is critical for developing intervention programs that promote PWB and enhance productivity and worker engagement.
Purpose:
This study aimed to assess the level of PWB in university staff and identify personal, social, and workplace environmental factors related to their PWB.
Methods:
A cross-sectional, correlational study design was used. A convenience sample of university staff was recruited from two universities in Texas. Participants completed an online questionnaire, which included Ryff’s PWB scale to measure PWB, along with questions related to personal, social, and workplace factors. Hierarchical multiple regression was used to analyze the influence of these factors on the PWB of university staff.
Results:
The PWB of university staff (n = 202) was significantly influenced by personal factors (i.e., race and perceived mental health status), social factors (i.e., social support of friends), and workplace environmental factors (i.e., physical demands).
Conclusion/Application to Practice:
To effectively promote PWB among university staff, occupational health nurses should proactively track and monitor their PWB. Policies and interventions should consider the various personal, social, and workplace environment factors identified in this study, such as mental health, social support resources, and physical demands.
Background
There are nearly four million workers employed by institutions of higher education or universities in the United States (Institute of Education Sciences, 2018). University staff members occupy information-intensive positions performing administrative and technical duties, which significantly influence the campus community (Ogunbodede & Ambrose, 2020). University staff regularly interact with students who are seeking guidance for academic advisement, auxiliary services, and emotional support. These interactions directly affect student satisfaction and success (Guifoile & Krimpelbein, 2017). University employees are often challenged by extensive organizational change, increased workload, and decreased governmental funding (Kaiser et al., 2021; Vandiya & Hidayat, 2018). Furthermore, job demands (workload, work conflict, and work–family conflict) may result in burnout and reduce the engagement of university employees (Kaiser et al., 2021).
Recently, the COVID-19 pandemic has caused universities to experience higher turnover rates of 35% (Umpierrez, 2021). During the COVID-19 pandemic, approximately 80% of university employees reported higher levels of stress and feelings of anger associated with increased job demands and the deterioration of work–life balance (Kaiser et al., 2021). Student learning and university operations may be affected by increases in employee turnover and mental health issues. Mental health is not only the absence of mental illness but also the presence of psychological well-being (PWB; Tang et al., 2019). Psychological well-being encompasses favorable psychological functioning, which includes both hedonic happiness and functioning with optimal effectiveness in individual and social life from a eudemonic happiness perspective (Winefield et al., 2012).
The PWB of university employees has become a substantial concern for academic administration after the COVID-19 pandemic. Unfortunately, the PWB status of this population has not been well investigated (González-Rico et al., 2018). Consequently little is known regarding the relationship between the level of PWB and the related personal, social, and workplace environmental factors for employees in a university setting.
Multiple studies have investigated how employees’ PWB directly affects job satisfaction, mental health, and physical health (Coutinho et al., 2018; Kinman & Johnson, 2019; Mudrak et al., 2018; Rigotti et al., 2021). Positive PWB has shown to increase overall employee satisfaction and worker engagement (Coutinho et al., 2018; Mudrak et al., 2018; Rigotti et al., 2021) and is highly correlated with the individual’s job performance (Kinman & Johnson, 2019). Therefore, assessing and promoting PWB in university staff is significant to enhance the quality of staff service provision and protect their health.
University administrators need to understand the impact of low PWB on both the individual employee and the institution. Low PWB of university employees directly affects their overall wellness (e.g., anxiety, stress) and impedes student well-being (e.g., decreased support; Brewster et al., 2022; Williams et al., 2017). There is a significant need to promote the PWB of university staff to reduce the risk of developing chronic health diseases, improve the workforce’s overall health function, and support student academic outcomes (Brewster et al., 2022).
Recently, the number of universities adopting workplace well-being programs to promote wellness and address health-related problems of faculty, staff, and students has grown (Brantley & Shomaker, 2021; Brewster et al., 2022; Travia et al., 2022). However, these programs have often experienced challenges related to organizational policies and cultures that prioritize productivity and workload (Brantley & Shomaker, 2021; Brewster et al., 2022). To better design effective programs or resources to address PWB in university staff, identifying factors influencing PWB is essential to protect university staff from mental and physical illnesses. This study aimed to describe the perceived PWB of university staff and identify personal, social, and workplace environmental factors related to their PWB.
Conceptual Framework
Psychological well-being is defined as “the combination of positive affective states such as happiness (the hedonic perspective) and functioning with optimal effectiveness in individual and social life (the eudemonic perspective)” (Winefield et al., 2012, para. 2). This study followed a conceptual framework adapted from Carol Ryff’s (1989) PWB model. Researchers have illustrated PWB in six domains that reflect positive human functioning. The domains include the following:
• Autonomy—individuals view themselves to be living in accord with their personal convictions
• Environmental mastery—how well individuals manage their life situations
• Personal growth—the extent to which individuals make use of their personal talents and potential
• Positive relationships—the depth of connection individuals have with significant others
• Purpose in life—the extent to which individuals feel their lives have meaning, purpose, and direction
• Self-acceptance—knowledge and acceptance individuals have of themselves, including awareness of personal limitations (Ryff, 2014, p. 11).
Studies have reported that individual PWB is affected by personal factors (i.e., gender, race, age, education level, and socioeconomic status) or social factors (i.e., marital status, dependents, and relationship with others; Akram, 2019; De-Juanas et al., 2020; Matud et al., 2020; Navarro-Carrillo et al., 2020) and workplace environmental factors (i.e., work location, employment category, and level of job control; Carolan et al., 2017; González-Rico et al., 2018; Kersemaekers et al., 2018; McMurtrie, 2020). Based on these previous studies, a study framework was developed to illustrate the relationships among the six domains of PWB and personal, social, and workplace environmental factors influential to PWB, as depicted in Figure 1.
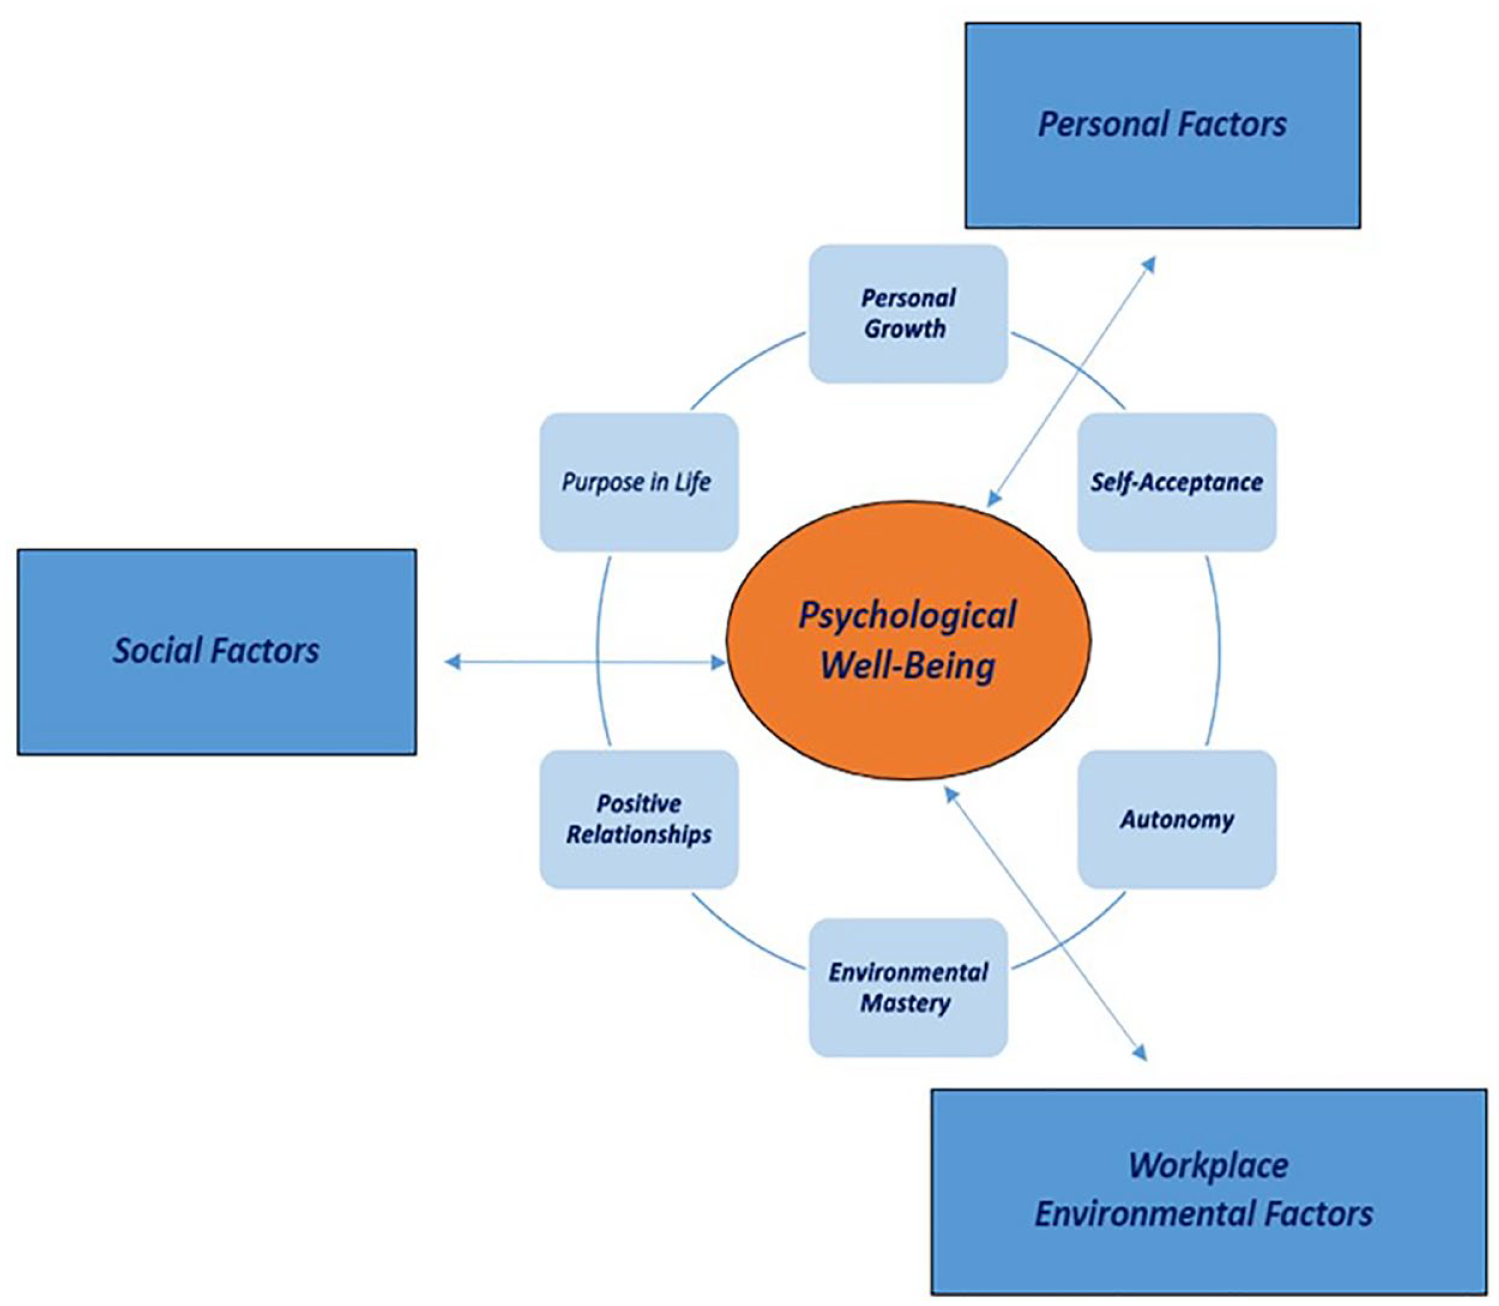
Conceptual Framework.
Methods
Research Design and Sample
A convenience sample of university staff was recruited from two universities in Texas. For University A, a university-wide announcement with a study flyer was sent out. For University B, a study invitation flyer was sent to the staff using email listservs obtained from the Public Information Officer. To protect the privacy of participants, the researcher used the blind carbon copy (BCC) field to send emails. The inclusion criteria were as follows: the university staff should be (a) regular full-time staff or part-time staff and (b) aged 18 years and older. Survey screening questions were used to exclude nonregular employees (i.e., those not eligible for benefits), faculty, instructional academic staff, student employees, and temporary employees.
Measures
Personal Factors
A questionnaire with four distinct parts was used to collect data for this study. The first part focused on personal factors including gender, age, race, ethnicity, education level, perceived health status, and presence of comorbidities. Perceived health status, which refers to a subjective reflection of physical and mental health status (Wu et al., 2013), was measured by the Self-Rated Health (SRH) tool on a 5-point Likert-type scale ranging from Poor (1) to Excellent (5) (Ahmad et al., 2014). The presence of comorbidities was assessed using a dichotomous response (Yes or No), indicating whether they had any preexisting medical conditions.
Social Factors
The second part of the questionnaire assessed social factors, encompassing marital status, the presence of dependents at home, and perceived social support. The 12-item Multidimensional Scale of Perceived Social Support (MSPSS; Zimet et al., 1988) was used to measure participant’s perceived social support from family (four items), friends (four items), and significant others (four items). Responses were rated on a 7-point Likert-type scale, ranging from Very Strongly Disagree (1) to Very Strongly Agree (7), with a maximum possible score of 84. The psychometric properties of the MSPSS have been tested by previous studies (Bugajski et al., 2019; Wittenborn et al., 2020), demonstrating high reliability (α = .85–.94). In this study, its Cronbach reliability coefficient was α = .93, further attesting to its robustness and suitability for assessing perceived social support in the given sample.
Workplace Environmental Factors
The third part examined workplace environmental factors. Participants were queried about employment location (i.e., University A, University B), employment category (i.e., exempt, nonexempt), employment status (i.e., full-time, part-time), length of employment by the university (in years), and leadership position (yes/no). The Work Factors Survey (WFS) measured three additional aspects: job control (four items), psychological demands (four items), and physical demands (four items), using a 4-point Likert-type scale from almost never (1) to very often (4). A previous study (Hystad et al., 2011) concluded Cronbach’s alpha values for the three factors, ranging from .71 to .85. With this study sample, the Cronbach reliability coefficient was α = .65, which proved to be reliable and suitable for this study’s purpose.
PWB Scale
Finally, participants’ PWB was assessed using Ryff’s (1989) PWB scale. The PWB scale had 42 items, seven items in each of the six domains: autonomy, environmental mastery, personal growth, positive relations with others, purpose in life, and self-acceptance (Ryff & Singer, 1996). Responses were collected on a 6-point Likert-type scale ranging from strongly disagree (1) to strongly agree (6). The scale has a mix of positively worded and negatively worded items. The negatively worded items were reverse-scored during data analysis to ensure higher values indicate better well-being. The total score of PWB ranges from 42 to 252. Ryff’s PWB scale has been extensively validated, showing high internal consistency reliability (α = .86–.93) and test–retest coefficient ranging from .81 to .88. In this study, the total PWB scale exhibited excellent reliability with a Cronbach’s alpha of .92 for the overall scale, and for each of the subscales: autonomy (α = .75), environmental mastery (α = .80), personal growth (α = .78), positive relations with others (α = .75), purpose in life (α = .83), and self-acceptance (α = .86).
Data Collection Procedure
The study was approved by the Institutional Review Boards of Texas Woman’s University and the University of Houston. All data were collected through the PsychData survey and stored securely on its server. The first page of the online survey included a written explanation of the study purpose, qualifications, procedure, expected completion time, incentives, and informed consent declaration. By electing to take part in the study, the participants declared that they were at least 18 years old, read and understood the information provided in the consent form, and agreed to voluntarily participate in the study. All the survey data were deidentified and any contact information (i.e., name and email address) was kept separately from the survey research data in a password-protected data file.
Data Analysis
A total of 225 staff members from two universities initially participated in this study; however, complete responses to all variables in the questionnaire were provided by 212 staff. Among these, five cases identified as nonbinary gender and five cases reported part-time work status. Considering the limited sample size of these specific categories, the analysis focused solely on participants who identified as male or female gender and held full-time work status when exploring the PWB of university staff. Consequently, the final sample size was 202 university staff participants.
All analyses were performed using the IBM SPSS version 28.0. Descriptive statistics were used to describe participants’ demographic characteristics. Independent t tests and analysis of variance (ANOVA) were conducted to investigate differences in total PWB levels across various demographic characteristics.
Pearson correlation coefficients of total PWB, PWB subscales, personal, social, and workplace environmental factors were computed through zero-order correlation analysis. Next, the variables showing correlation with PWB at p < .15 were entered into a hierarchical regression analysis to identify significant personal, social, and workplace environmental factors on the PWB of university staff. Preliminary statistical assumption tests were performed prior to the hierarchical regression analysis to ensure no violation of normality, linearity, multicollinearity, and homoscedasticity of the data (Pallant, 2016). Scatterplots were used to assess linearity, homoscedasticity, and outliers. Histograms, skewness, and kurtosis were evaluated to determine normality. In evaluating multicollinearity, the correlation matrix was reviewed to ensure that correlation coefficients across variables were less than .90 and the variance inflation factor was less than 10. No statistical assumptions had been violated.
In the hierarchical regression analysis, independent variables were sequentially entered into three models, starting with personal factors in Model 1, followed by social factors in Model 2, and workplace environmental factors in Model 3. The resulting change in R2 values and the beta-weights for each variable were examined to determine which personal, social, or workplace environmental factors accounted for more variance in PWB. In the regression analysis, the level of significance was set at p = .05 to identify significant predictors of PWB of university staff.
Results
Study participants were predominantly women (n = 150, 74.3%), with ages ranging from 19 to 74 years (M = 42.06, SD = 12.94). The majority identified as White (66.3%) and non-Hispanic (79.7%). More than half (57.9%) of the participants reported having comorbidities. Regarding perceived health status, participants rated their physical health as good (M = 3.13, SD = 0.85) and their mental health status slightly lower than good (M = 2.93, SD = 0.91). The highest level of education reported by the participants was graduate degree (49%). More than half of them were married (48%). Approximately 59.4% of participants had dependents living in their homes. In terms of social support, participants showed moderately high overall MSPSS scores (M = 63.08, SD = 14.96) out of the maximum score, 84; social support from significant others (M = 21.75, SD = 6.79) was slightly greater than that from friends (M = 20.73, SD = 5.78) and family (M = 20.60, SD = 5.87). Concerning workplace factors, most participants were in the exempt employment category (79.7%), with 31.7% holding a leadership position. On average, participants reported 6.75 years of employment with the university (SD = 5.14). The overall WFS scores were moderately high (M = 26.28, SD = 4.82). Specifically, participants reported high levels of job control (M = 12.09, SD = 2.48), moderately high levels of psychological demands (M = 10.15, SD = 3.32), and low levels of physical demands (M = 5.15, SD = 1.97). Table 1 presents participant demographics and total PWB scores.
Participants’ Demographics and Total PWB (N = 202)
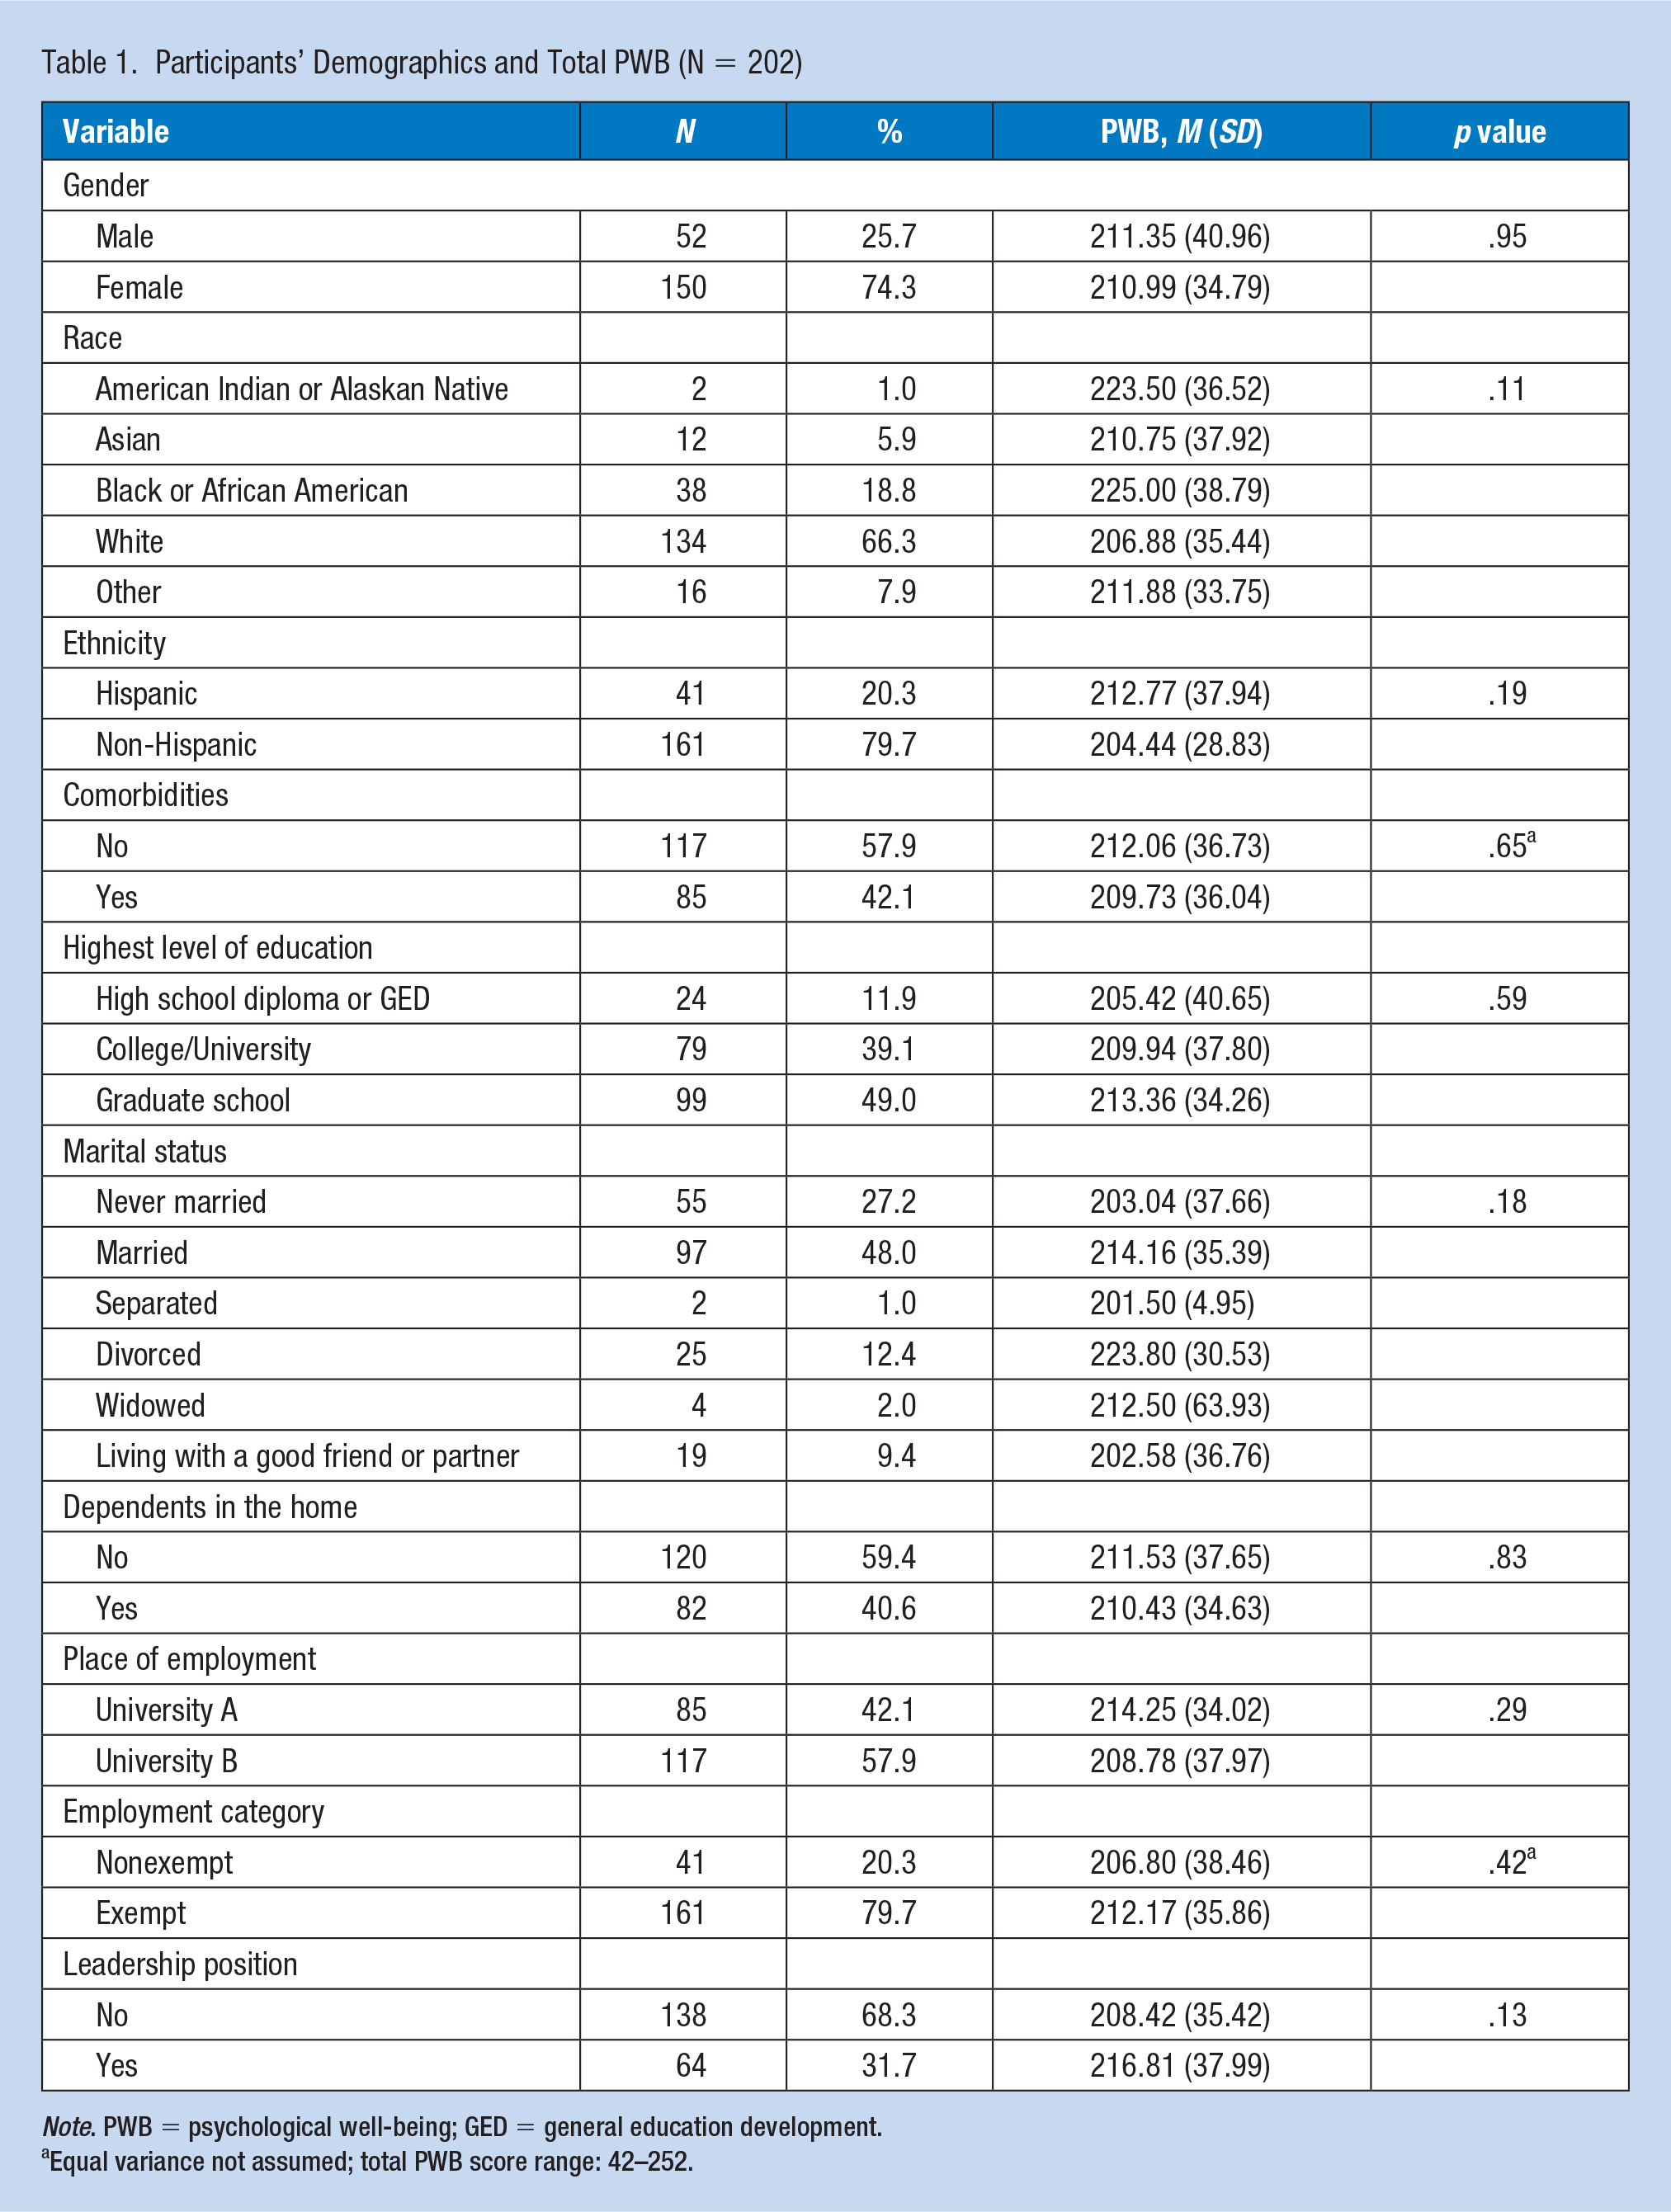
Note. PWB = psychological well-being; GED = general education development.
Equal variance not assumed; total PWB score range: 42–252.
The PWB Level of University Staff
The total PWB level of female participants (M = 210.99, SD = 40.96) was slightly lower than that of male participants (M = 211.35, SD = 40.96). Among racial groups, the total PWB level of Black or African American was the highest (M = 225.00, SD = 38.79). Non-Hispanic participants reported a lower total PWB level (M = 204.44, SD = 28.83) than Hispanics (M = 212.77, SD = 37.94). Participants reporting comorbidities had a lower total PWB (M = 209.73, SD = 36.04) than participants without comorbidities (M = 212.06, SD = 36.73). The total PWB level of the divorced participants was the highest (M = 223.80, SD = 30.53). There was little difference in total PWB levels between participants with dependents in the home (M = 210.43, SD = 34.63) and participants without dependents in the home (M = 211.53, SD = 37.65). University staff with graduate degrees reported slightly higher levels of total PWB (M = 213.36, SD = 34.26), followed by the staff with college/university (M = 209.94, SD = 37.80) and those with high school diploma or general education development (GED) (M = 205.42, SD = 40.65). The total PWB of exempt university staff was marginally higher (M = 212.17, SD = 35.86) than the nonexempt staff (M = 206.80, SD = 38.46). Participants in leadership positions reported having a greater level of total PWB (M = 216.81, SD = 37.99) than those not in a leadership position (M = 208.42, SD = 35.42). However, independent t tests and one-way ANOVA revealed no statistical significance in the total PWB level differences by gender, race, ethnicity, presence of comorbidities, level of education, marital status, dependents in the home, place of employment, employment category, and leadership position.
Table 2 presents the total PWB and subscale scores across University A and University B participants. Staff working in University A reported higher PWB; however, there was no significant difference in total PWB scores (University A [M = 214.25, SD = 34.02]; University B [M = 208.78, SD = 37.97]; t [200] = 1.06, p = .29). Among PWB subscales, personal growth perception was notably higher in staff working at University A (M = 41.00, SD = 6.03) than in staff working at University B (M = 39.29, SD = 7.04), t [200] = 1.81, p = .07). Regarding the remaining PWB subscales, there was not statistically significant difference across the universities.
Total Psychological Well-Being (PWB) Level and Subscale Scores Across Universities
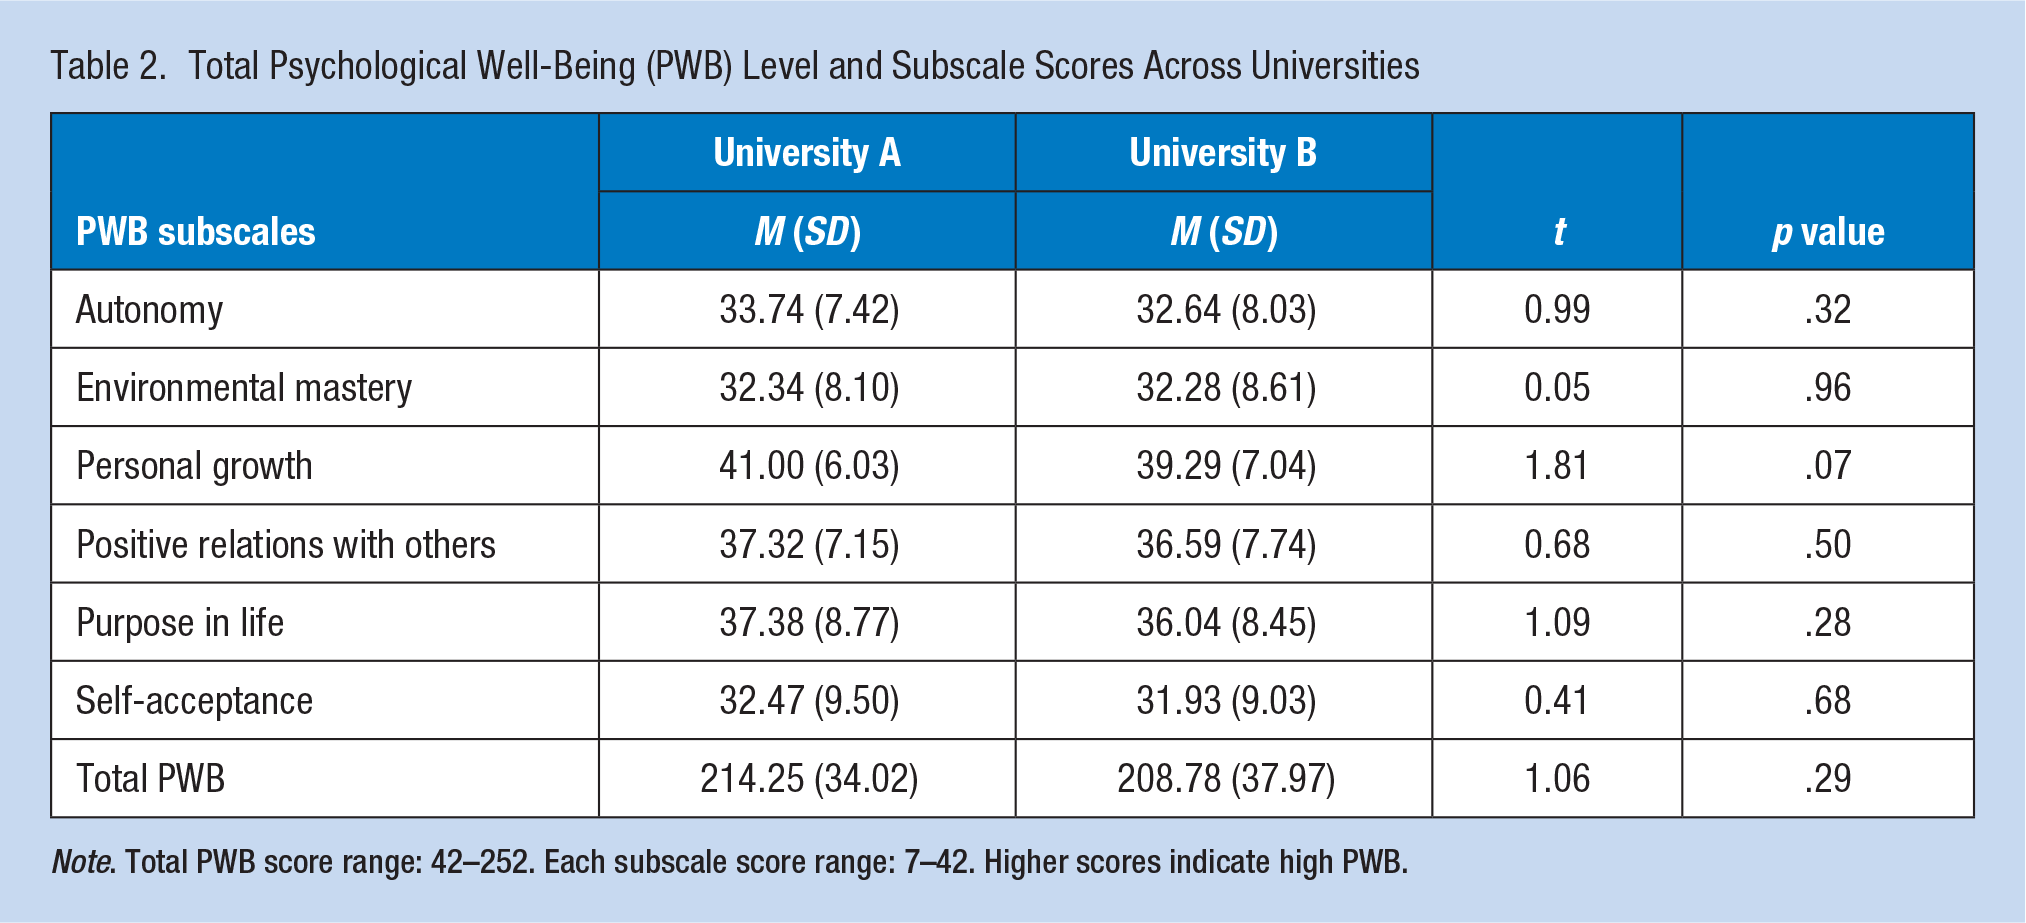
Note. Total PWB score range: 42–252. Each subscale score range: 7–42. Higher scores indicate high PWB.
Personal, Social, and Workplace Environmental Factors Related to PWB
Among personal factors, age (r = .23, p < .001), race (r = −.16, p = .02), perceived physical health status (r = .32, p < .001), and perceived mental health status (r = .58, p < .001) were significantly associated with total PWB of university staff. Gender, ethnicity, presence of comorbidities, and education level were not significantly associated with the total PWB level.
Social factors significantly associated with total PWB were perceived social support—family (r = .35, p < .001), social support—friends (r = .31, p < .001), and social support—significant others (r = .26, p < .001); similar significant associations between the perceived social support and total PWB were discovered. Marital status and dependents in the home were not significantly associated with the total PWB level; they did not show significant relationships with PWB subscales either.
Workplace environmental factors that showed a statistically significant association with total PWB were leadership position (r = .11, p = .13), work factors—job control (r = .22, p = .002), work factors—psychological demands (r = −.19, p = .006), and work factors—physical demands (r = −.13, p = .07). Work location, work category, and length of employment were not significantly associated with total PWB; similar relationships were found with PWB subscales.
The correlations among all the PWB subscales and total PWB scales were significant: autonomy (r = .56, p < .001), environmental mastery (r = .85, p < .001), personal growth (r = .72, p < .001), positive relations with others (r = .68, p < .001), purpose in life (r = .83, p < .001), and self-acceptance (r = .85, p < .001).
The findings of this study concluded that age, race, perceived physical health, perceived mental health, social support—family, social support—friends, social support—significant other, leadership position, work factors—job control, work factors—psychological demands, and work factors—physical demands were determined to be significantly (p < .15) related to total PWB and entered as predictors in the subsequent regression analyses (see Table 3).
Summary of Hierarchical Regression Model for Total Psychological Well-Being
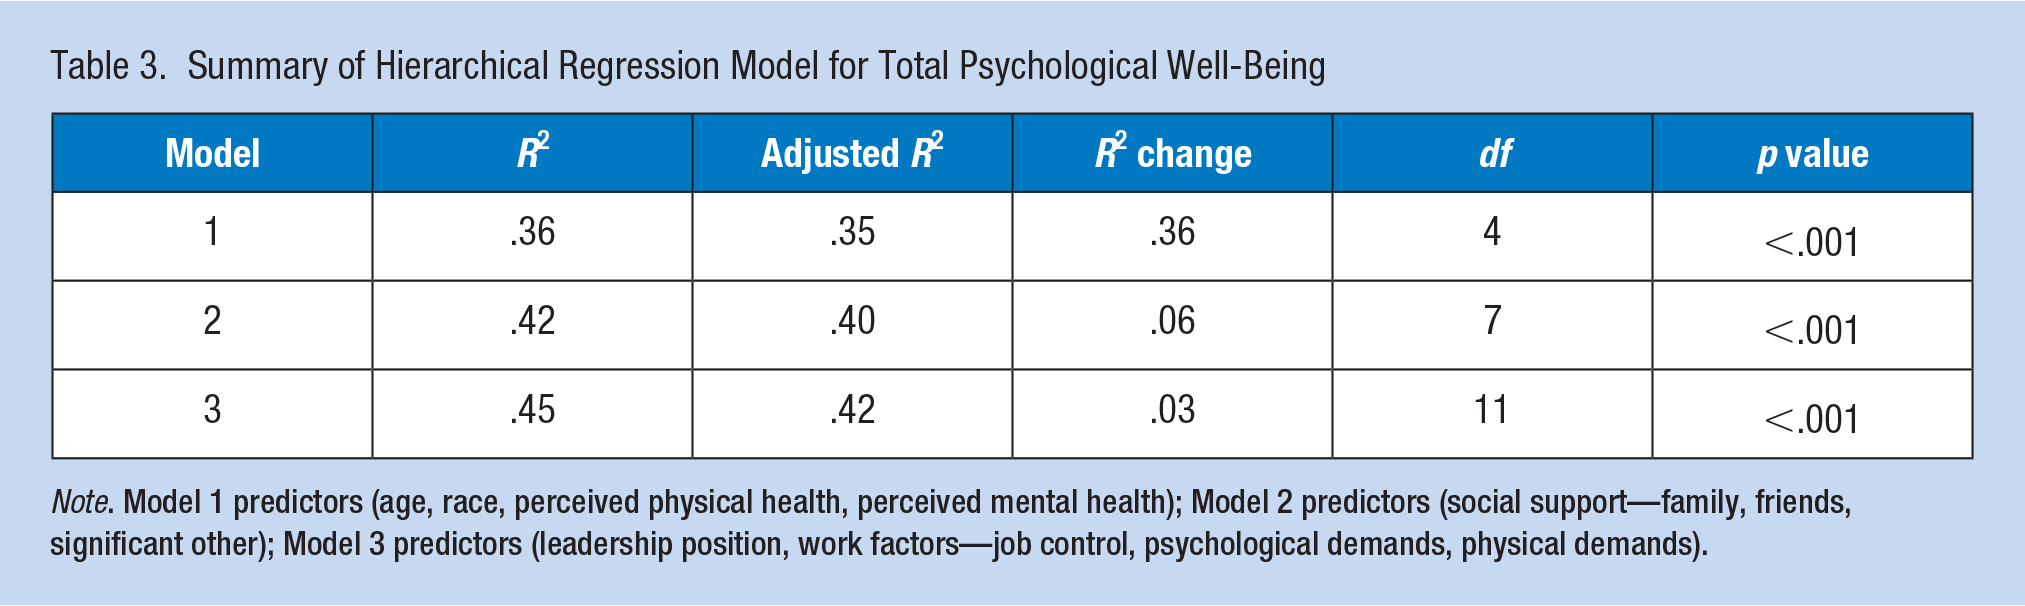
Note. Model 1 predictors (age, race, perceived physical health, perceived mental health); Model 2 predictors (social support—family, friends, significant other); Model 3 predictors (leadership position, work factors—job control, psychological demands, physical demands).
From hierarchical multiple regression analysis, the first model with personal factors accounted for 36% of the variance in total PWB, F (4, 197) = 27.64, R2 = .36, adjusted R2 = .35, p < .001. After adding social factors (i.e., social support—family, social support—friends, and social support—significant other), the second regression model accounted for 42% of the variance in total PWB, F (7, 194) = 19.97, R2 = .42, adjusted R2 = .40, p < .001. The third regression model revealed that the combination of all personal, social, and workplace environmental factors accounted for 45% of the variance in total PWB, F (11, 190) = 14.38, p < .001, R2 = .45, adjusted R2 = .42, p = .01.
In Regression Model 3 with personal, social, and workplace environmental factors, race (β = −.11, p = .05), perceived mental health status (β = .45, p < .001), social support—friends (β = .19, p = .003), and work factors—physical demands (β = −.14, p = .02) were significant predictors of total PWB at the p < .05 level (see Table 4).
Regression Coefficients of Personal, Social, and Workplace Environmental Factors on Total Psychological Well-Being
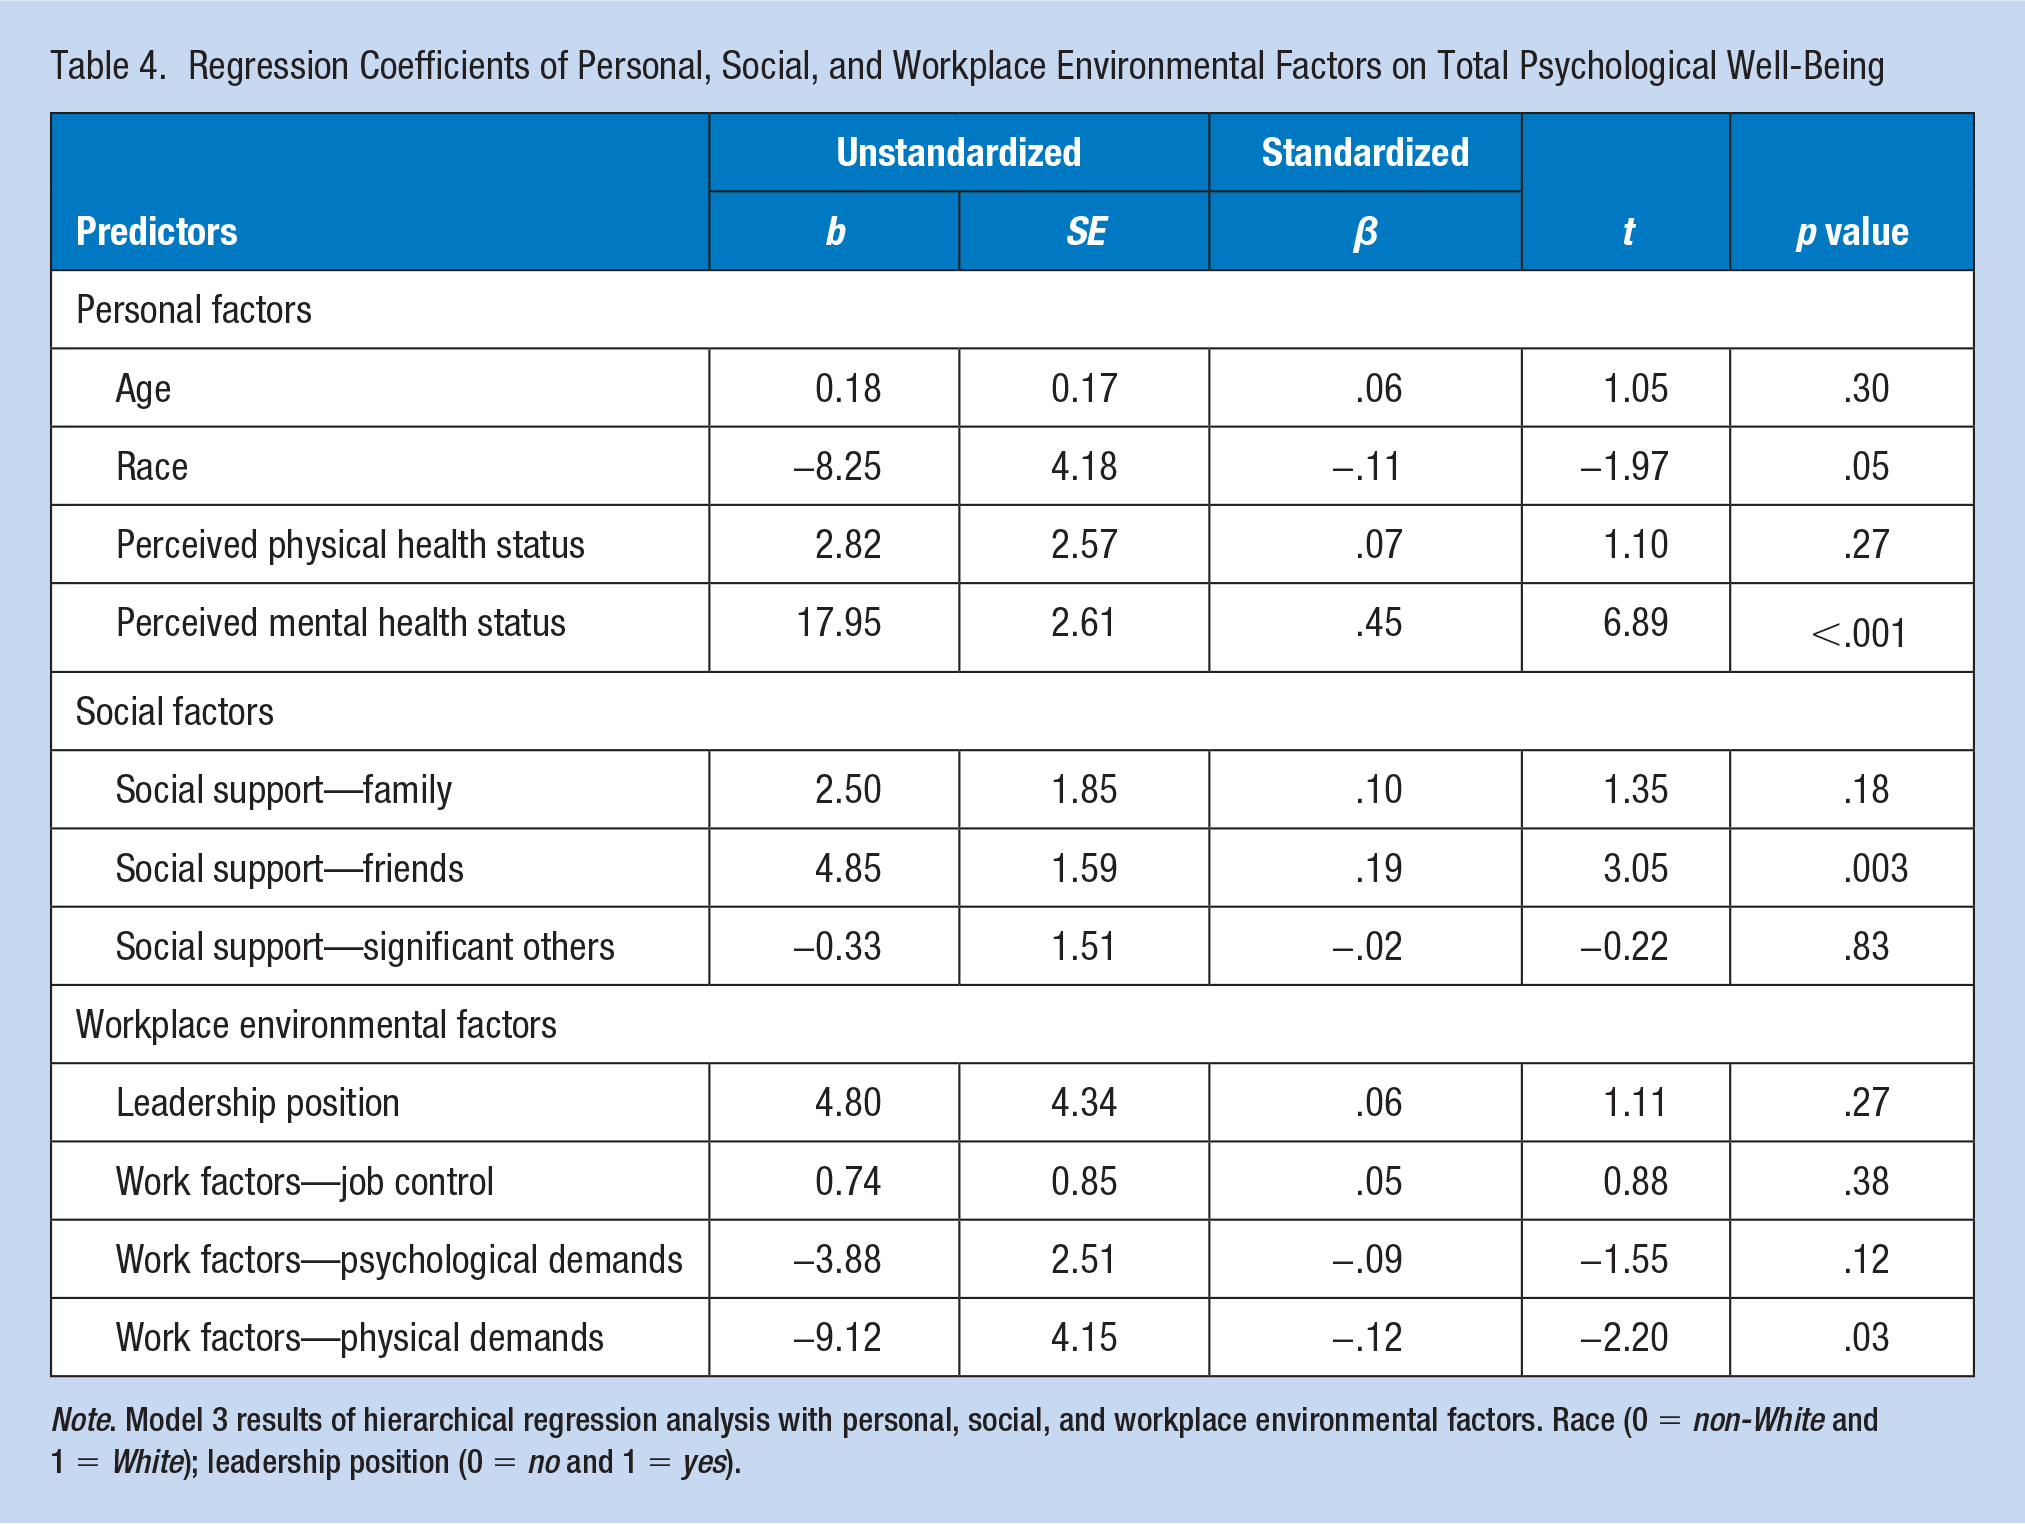
Note. Model 3 results of hierarchical regression analysis with personal, social, and workplace environmental factors. Race (0 = non-White and 1 = White); leadership position (0 = no and 1 = yes).
Discussion
Few studies have delved into the multifaceted dimensions of PWB among university staff, particularly employing a comprehensive theoretical framework. Carol Ryff’s (1989) PWB model, which encompasses six domains reflecting positive human functioning—autonomy, environmental mastery, personal growth, positive relationships, purpose in life, and self-acceptance—offers a holistic approach. Ryff’s (1989) PWB scale, extensively validated in previous research, has demonstrated high internal consistency reliability and shown its applicability across different age groups, genders, socioeconomic status, and cultures. Despite this model could comprehensively reflect the psychological experiences of university staff, studies using it to measure the PWB of university employees have been rare. Only one study, exploring this model, compared the PWB of private and public university faculty (Akram, 2019), leaving a noticeable gap in the literature. Embracing Ryff’s comprehensive framework could provide valuable insights into the PWB of university staff.
This study found that total PWB scores of staff at University A (M = 214.25, SD = 34.02) and University B (M = 208.78, SD = 37.97) were in the upper quartile out of the maximum level, 252. Furthermore, race and perceived mental health status were statistically significant predictors of university staff PWB. Among the six domains of the PWB, staff at both universities scored highest on personal growth, positive relations with others, and purpose in life. However, a previous study of millennial workers reported that the PWB subscale scores for self-acceptance and positive relationships with others were mostly high, whereas those for autonomy, environmental mastery, purpose in life, and personal growth were low (Oktavia et al., 2020). In this study, the relationships of environmental mastery, self-acceptance, and purpose in life subscales with total PWB were stronger than the relationships of other subscales with the total PWB level. Another study of employees in Slovenia found that the association between PWB and autonomy was stronger than the relationship among others (Šarotar Žižek et al., 2015). These gaps across studies can occur with different types of workers and call for studies with staff from more universities.
Personal Factors Influencing PWB
In the investigation of significant factors influencing the PWB of university staff, race and perceived mental health status were significant personal factors. It is notable that perceived mental health status was the strongest predictor of the total PWB level in the university staff. High job demands, insufficient resources, and poor staff management have consistently been associated with increased mental health issues of university staff (i.e., stress, anxiety, depression, and other mental health difficulties; Brewster et al., 2022; Kaiser et al., 2021). Therefore, it is essential to provide programs or resources for mental health support for university staff. In this study, race was also significantly associated with PWB; Whites had lower levels of total PWB, whereas African Americans showed higher total PWB levels. This finding contradicts previous research on the relationship between race and PWB (Chang et al., 2014; Schmitt et al., 2014). Chang et al.’s (2014) study with adult psychiatric patients in New England found that in response to the psychiatric treatment, Asians reported the highest PWB, whereas Blacks had the lowest. Another research study found that African Americans consistently exposed to racial stigmatization and threats showed lower PWB (Schmitt et al., 2014). The comprised information can be used in the development of PWB intervention programs that appropriately promote the PWB of university staff.
Social Factors Influencing PWB
Among social factors, the perceived social support of family, friends, and significant others was positively associated with higher scores of total PWB in the correlation analysis. However, social support from friends was the only significant predictor for total PWB in the university staff. Previous studies have also found a positive correlation between social support and the PWB of university students (Adyani et al., 2019; Saputra & Palupi, 2020). Considering these findings, it can be concluded that social support is positively correlated with PWB in a university setting. Therefore, creating an organizational climate or culture that includes the social support of friends and colleagues should be considered a university strategic plan.
Workplace Environmental Factors Influencing PWB
Regarding workplace environmental factors, this study found having a leadership position and perceived work factors (i.e., job control, psychological demands, and physical demands) were significantly associated with total PWB. Specifically, physical demand was a significant predictor of the total PWB in the university staff. This study’s results were consistent with those of previous studies that reported that individual PWB was affected by workplace environmental factors. Mudrak et al. (2018) determined that job resources (e.g., job control, support from supervisor) and job demands (e.g., job insecurity, work–family conflicts) were significantly related to faculty well-being in the Czech Republic. Schütte et al. (2014), in their study with European employees, found a significant association between poor PWB and negative work factors, including high job demands, low quality of leadership, and low sense of community. Winefield et al. (2014) identified that workplace factors positively affecting PWB of Australian university employees included improving job control and reducing job demands. The results of this study suggest that higher levels of job control, lower levels of psychological demands, and lower levels of physical demands were associated with higher levels of total PWB. Therefore, assessing these factors should be considered when developing programs that promote PWB.
Limitations
Several limitations may affect the overall results of this study. First, the study depended on the participants’ voluntary survey responses. University staff may report a higher PWB due to fear of management retaliation, thus introducing the possibility of response bias. Therefore, the anonymity and confidentiality of the survey responses were informed to protect the participants. Part-time staff, faculty, and nonbinary gender were not included in the data analysis due to too small portions of the sample. Because this study is the first to investigate the PWB of university staff members, the results depended on the voluntary responses of participants from only two Texas universities with similar work environments. So, the results cannot be generalized to all university staff. Furthermore, the sample was predominately White non-Hispanic women; therefore, the results of this study should be interpreted cautiously. Future research should include samples from a more inclusive demographic population and multiple geographical university settings.
Implications for Occupational Health Practice
This study’s findings provide helpful information for occupational health nurses (OHNs) and other stakeholders (e.g., administrators, faculty, and staff) in university settings in assessing the level of PWB and related personal, social, and workplace environmental factors. To better design effective programs or resources to address PWB in university staff, careful consideration of factors influencing PWB is essential. For example, OHNs are recommended to track and monitor physical health status, mental health status, social support resources, and workplace environment in addition to the PWB of university staff, considering different racial groups. The collected information can be used to develop optimal intervention programs that promote the PWB of university staff, faculty, and students. In evaluating the effectiveness of implemented PWB programs, university administrators should consider not only the improvement of university staff PWB but also the impacts on student retention and outcomes.
The findings of this study shed light on the significant associations between the psychological well-being (PWB) of university staff and various personal, social, and workplace environmental factors. In particular, perceived mental health status, social support—friends, work factors—physical demands, and race emerged as significant predictors of university staff’s PWB. To gain a more comprehensive understanding of PWB disparities among racial groups and devise effective promotion strategies, further research is warranted. To deepen our comprehension of how personal, social, and workplace environmental factors affect the PWB of university staff, future studies could explore alternative methodologies (e.g., qualitative, mixed methods). In addition, longitudinal studies can provide valuable insights into the effectiveness of health promotion strategies in mitigating psychological distress and promoting the PWB of university staff over time. Such research endeavors hold significant promise in advancing occupational health and fostering a supportive and flourishing work environment for university staff.
Footnotes
Acknowledgements
The authors thank the participants who volunteered their valuable time to take part in this study, recognizing their significant contribution to institutions of higher education. In addition, they extend the appreciation to Dr. Misty Richmond for providing invaluable feedback on the study.
Author Contributions
All authors have contributions to the conception and design of the work, or analysis and interpretation of data for the work and drafting the article or revising it critically for important intellectual content. Finally, they approved the manuscript for publication and ensured that any questions related to the accuracy or integrity of the work were appropriately investigated and resolved.
Conflict of Interest
The author(s) declared no potential conflicts of interest with respect to the research, authorship, and/or publication of this article.
Funding
The author(s) disclosed receipt of the following financial support for the research, authorship, and/or publication of this article: The author(s) disclosed receipt of financial support from the American Association of Occupational Health Nurses (AAOHN) Foundation for the research, authorship, and/or publication of this article. The funders had no role in the study design, data collection and analysis, decision to publish, or preparation of this manuscript.
Human Subjects Review Details
This study was approved by Institutional Review Boards of Texas Woman’s University on August 15, 2022 (IRB-FY2022-51) and the University of Houston on January 27, 2022 (STUDY00003412).