
Abstract
Background: The health care sector is one of the most rapidly growing industry sectors in the United States. This study examined differences in the rates and trends of violent occupational injuries among health care workers in the United States. Methods: This study used data about violent occupational injuries among health care workers in the United States collected by the Bureau of Labor Statistics (BLS) Survey of Occupational Injuries and Illnesses (SOII). The BLS SOII collects data about injuries that result in at least one lost workday. Violent injuries are defined as intentional injury by another person. Data were obtained for years 2011 to 2017. We examined injury rates and trends according to industry and occupation, as well as age, sex, and race/ethnicity. Results: Intentional injuries increased among health care workers between 2011 and 2017. Rates, expressed as injuries per 10,000 workers, were particularly elevated in residential care facilities (44.07) and among health practitioner support technologists and technicians (22.54); nursing, psychiatric, and home health aides (28.13); and occupational therapy and physical therapist assistants and aides (39.72). Black health care support and practitioners workers had injury rates three times higher than White workers. Conclusions/Application to practice: Efforts should be made to address the increasing rates of intentional occupational injuries among health care workers. These efforts should focus on comprehensive programs enforcing policies for prevention and management (including reporting and training) and employee engagement in such efforts. High-rate industries and occupations should receive particular attention.
Background
The health care sector is one of the fastest-growing sectors in the United States, employing more than 18 million people, including registered nurses (RNs), licensed and unlicensed assistive professionals, and rehabilitation professionals (Bureau of Labor Statistics [BLS], 2020a). The health care sector is anticipated to add 2.4 million jobs from 2019 to 2029, (BLS, 2020a). Workplace violence (WPV) is a concern among health care workers. WPV is defined as “violent acts, including physical assaults and threats of assault, directed toward persons at work or on duty” (Centers for Disease Control and Prevention [CDC], 1996). Violence can be classified into four types: Type I (Criminal Intent), Type II (Customer/client), Type III (Worker-on-Worker), and Type IV (Howard, 1996; Peek-Asa et al., 1997).
In the United States, the health care and social assistance industry has both a high number and rate of reported injuries compared with all other industry sectors (BLS, 2020b). In 2017, of the 18,400 nonfatal intentional occupation injuries, 76.5% (14,080) occurred to workers in the health care and social assistance industry sector (BLS, 2020c). According to data from the National Crime Victimization Survey (NCVS), a national household survey, health care practioners and technical and health care support workers experienced the third and fourth highest rates of nonfatal violent workplace crimes, respectively, among all occupational groups (Siegel et al., 2020).
One recent study conducted among hospitals participating in the National Institute for Occupational Safety and Health’s (NIOSH) Occupation Health Safety Network (NIOSH, 2019) examined rates and trends in violent injuries, which included incidence of Type I, II, and III violence (World Health Organization [WHO], 2002). The study found that violent workplace injuries increased by 23% annually between 2012 and 2015. The risk of these injuries was found to vary according to occupation, with nursing assistants and nurses at the highest risk (Groenewold et al., 2018). Another study found that nurses, direct daily care workers (comprised mostly of certified nursing assistants), and social workers on average experienced more assaults compared with other health care workers (physicians, nurse practitioners, and physician assistants; Rosenthal et al., 2018).
Applying Research to Occupational Health Practice
Violence is a significant contributor to injury and mental health strain among health care workers. Understanding factors associated with the risk for violent injuries in health care may help to develop prevention strategies. This study was conducted using data from the 2011 to 2017 Bureau of Labor Statistics Survey of Occupational Injuries and Illnesses, which has representative data about work-related violent injuries for health care workers (both those in health care occupations and in the health care industry). This study found that there were differences in the risk for violent injuries in health care. In particular, residential care facilities, nursing, psychiatric, and home health aides, and occupational therapy and physical therapist assistants and aides as well Black health care workers had elevated rates. These findings can be used to identify populations among whom interventions to prevent these injuries are most needed.
The American Nurses Association (ANA) recently conducted a study to identify the health, safety, and wellness among a sample of 14,000 RNs and student nurses working mostly in hospital, acute care, academia, and medical-surgical areas. They reported that almost one quarter of the participants had been physically assaulted at work by a patient or patient’s family member (ANA, 2017).
Antecedents of Type II WPV may be attributed to patient population characteristics (e.g., history of violence or mental health condition; Lipscomb & El Ghaziri, 2013; Mento et al., 2020; Nowrouzi-Kia et al., 2019), work organization factors (e.g., staffing, scheduling, lack of training on WPV prevention and management, work tasks, and organizational culture; Lipscomb & El Ghaziri, 2013; Mento et al., 2020; Nowrouzi-Kia et al., 2019), environmental risk factors (e.g., lack of security, unit layout/design with blind spots and unsecure furniture, poor lighting; Lipscomb & El Ghaziri, 2013; Lipscomb & London, 2015; Mento et al., 2020; Nowrouzi-Kia et al., 2019), and to less extent to staff characteristics and occupations (e.g., demographics factors—such as gender, physical statures [height/weight], age, job titles, and training level; Lipscomb & El Ghaziri, 2013; Mento et al., 2020). WPV exposure impacts worker victims psychologically and physically, in addition to impacting their co-workers due to witnessing such exposures along with decreased productivity, increased work absences, and turnover (Al-Qadi, 2021; Mento et al., 2020). Patients also experience indirect consequences of WPV as the quality of patient care suffers when staff are injured and unable to work due to Days Away From Work (DAFW) and hospitals use staff not typically designated (float) to provide care on select units (Zhao et al., 2018).
To minimize health care workers’ exposure to WPV, data guided and driven policies and legislations are needed at the national level. Understanding WPV exposures through analyzing surveillance data trends is crucial to reduce the economic burden, empower health care workers, and enhance safety culture to reduce WPV injuries and related outcomes (U.S. Department of Labor & OSHA, 2013). This study sought to assess the rates and trends of violence-related injuries in the health care industry and among health care workers using 5 years (2011–2017) of the BLS SOII data. The study also sought to assess factors associated with these injuries and characteristics of the injured employees to further understand the variation in the risk of WPV.
The data published by BLS typically only include rates for broad injury and occupation categories. In addition, the rates of violence-related injuries according to demographic characteristics of injured workers are not usually available. This study sought to expand on the data traditionally published by the BLS by providing injury rates for violence injuries according to more detailed industry and occupation categories, as well as report trends in violence-related injuries, which are not often reported by BLS.
Methods
Data Sources
Data for this study were obtained from the BLS SOII. The BLS SOII is an annual survey that is designed to provide representative information about the number and incidence rates of occupational injuries and illnesses in the United States, as well as details about the characteristics of those injuries (source, event, nature, body part) and characteristics of individuals who were injured (age, gender, race/ethnicity, occupation, industry). The data in the BLS SOII come from a probability sample of establishments in the United States and are weighted to be representative of the U.S. working population (BLS, 2018). The data used in this study were obtained through special data requests to the BLS to obtain more granular data than those typically provided through the BLS SOII website. Although the BLS does publish some data about violence-related occupational injuries, these violent injury data are often not published in reports according to detailed industry and occupation categories or demographic variables such as age, gender, and race ethnicity. In addition, the BLS does not frequently provide information about trends in the rates of violent injuries (BLS, 2018).
The BLS publishes data about occupational injuries in the United States resulting in at least one lost day of work. Therefore, the violence-related injuries are defined as injuries for which the event or exposure was coded as “intentional injury by another person that required at least one lost workday.” Data were obtained stratified by year from 2011 to 2017 specifically for all workers in the health care and social assistance industry including broad categories of health care practitioner and technical and health care support occupation groups, as well as detailed occupations and industries within these groups. It should be noted that not all workers in the health care and social assistance industry work in health care occupations and not all health care workers are employed in the health care and social assistance industry. We only obtained data about private industries because industry category was not available for the public sector. BLS codes occupation using the Standard Occupational Classification system (BLS, 2021a), and industry using the North American Industry Classification System (ref.), Further data included gender (male, female), age (16–19, 20–24, 25–34, 35–44, 45–54, 55–64, 65 and above), and race/ethnicity (White, Black/African American, Hispanic or Latino, Asian, American Indian or Alaska Native, Native Hawaiian or other Pacific Islander, and multirace). We also obtained information related to characteristics of the injury including the body part injured, the nature of the injury (sprains, strains, tears; bruise, contusions; soreness, pain; etc.), the source of the injury (patient; co-worker), and number of lost workdays due to the injury; BLS, 2012; US Census Bureau, 2022).
Denominator data regarding employed workers in the United States were obtained from the BLS Current Population Survey (CPS) for years 2011 to 2017. The data were stratified into the same industry and occupation categories as the BLS data (BLS, 2019). We performed a special data request with the BLS to get employment by detailed industries for the private sector only. For race/ethnicity groups, the CPS did not use the same categorization as the SOII. Therefore, we used race/ethnicity data from the 2012 to 2016 American Community Survey Public Use Microdata Sample (ACS PUMS), which was stratified by the major occupation categories (health care practitioner and technical occupations and health care support occupations) that corresponded with BLS data.
Data Analysis
All data analysis was conducted using SAS Version 9.3 (SAS Institute Inc., Cary, NC, USA). We calculated the number and percent of injuries according to body part, nature of injury, source of injury, and how many DAFW the injury resulted in. We also produced count and percentages of injuries for industry and occupational categories stratified by age groups, sex, and race/ethnicity groups.
Crude rates were calculated as the number of injuries per 10,000 workers per year during the 2011 to 2017 time period. Rates and 95% confidence intervals (CIs) were stratified by industry and occupation categories and for age groups, sex, and race/ethnicity groups within the major industries and occupations. To model differences in rates according to these factors, Poisson regression was used in which the annual count of injuries with the natural log of the number of workers within those categories as an offset was modeled with the categories treated as predictors. Unadjusted rate ratios (RRs) with corresponding 95% CIs were derived to examine differences in rates between groups.
Separate Poisson regression models for each industry and occupation category were calculated for purposes of estimating trends in violent injury rates over the time period from 2011 to 2017. For each of these categories, the annual count of injuries within that occupation or industry group with the natural log of the number of workers within that category was modeled with the year of the injuries treated as the predictor. The trends were expressed as AAPCs (average annual percent change) with corresponding 95% CIs. These AAPCs represent the average change in injury rates from year to year during the study period. A positive AAPC indicates that on average rates were increasing during the time period and a negative AAPC indicates that on average rates were decreasing (National Cancer Institute [NCI], 2021). A percent change was calculated by subtracting the rate in one year from the rate in the preceding year, followed by dividing that number by the rate in the preceding year and multiplying by 100.
Results
The total number of intentional violence-related injuries resulting in at least one lost day of work were 75,360 in the private sector health care and social assistance industry sector. For health care occupations, the total number of intentional violence-related injuries resulting in at least one lost day of work were 33,160 health care practitioner and technical occupation and 42,500 among health care support occupations (Table 1). Patterns were similar within the health care and social assistance industry sector and among the health care occupations. Frequency and percentages shown are for the health care and social assistance industry sector unless otherwise noted. Most intentional injuries affected either the upper extremities (27.1%) or the head (25.3%). With respect to the nature of the injury, most intentional injuries resulted in sprains, strains, tears (23.6%); bruises, contusions (22.5%); and/or soreness, pain (21.3%). Within the health care and social assistance industry, 68.9% of these intentional injuries were perpetrated by a patient, this percentage was lower than among health care practitioner and technical occupations (86.9%) and health care support occupations (82.4%). The three highest categories for DAFW were 3 to 5 days (21.3%), 1 day (18.8%), and 31 or more days (17.8%).
Number and Percent of Intentional Injuries by Another Person Resulting in at Least One Lost Day of Work Among in the Health Care and Social Assistance Industry Sector and Workers in Health Care Occupations, by Characteristics of the Injury, United States, Bureau of Labor Statistics Survey of Occupational Injuries and Illnesses, 2011 to 2017
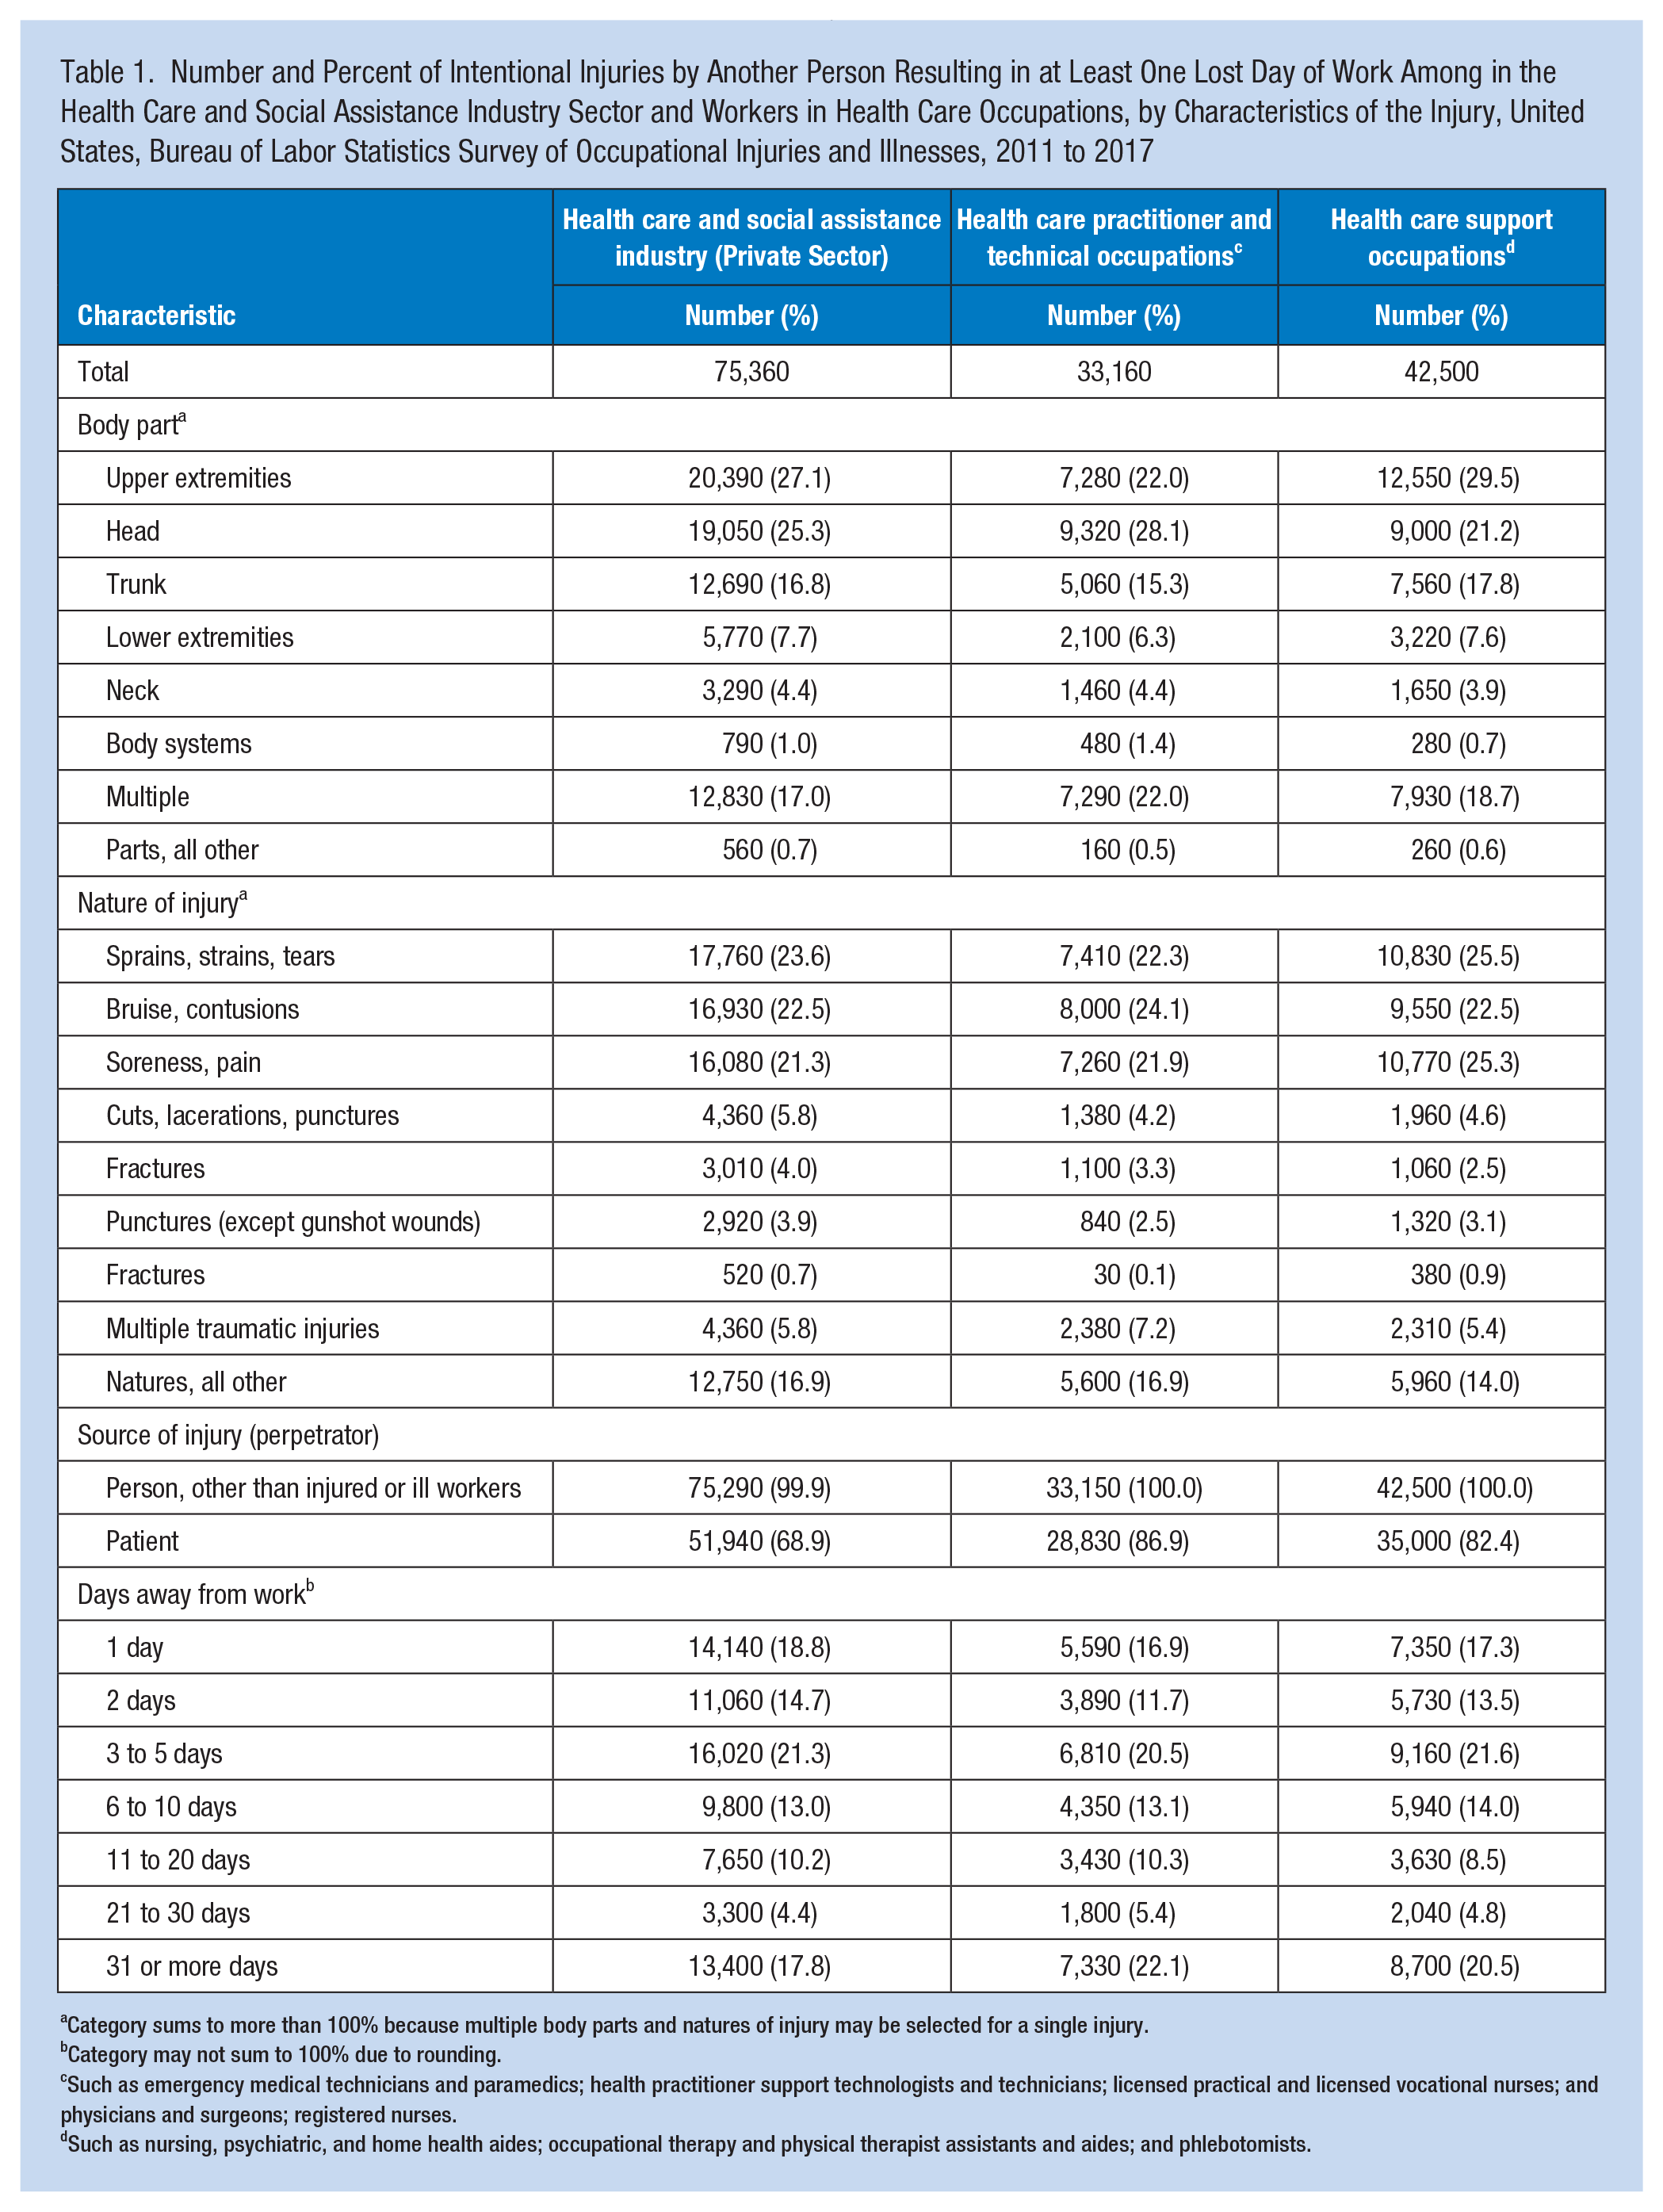
Category sums to more than 100% because multiple body parts and natures of injury may be selected for a single injury.
Category may not sum to 100% due to rounding.
Such as emergency medical technicians and paramedics; health practitioner support technologists and technicians; licensed practical and licensed vocational nurses; and physicians and surgeons; registered nurses.
Such as nursing, psychiatric, and home health aides; occupational therapy and physical therapist assistants and aides; and phlebotomists.
Injury Counts and Rates by Industry and Occupation
Within the health care and social assistance industry sector, the highest number of intentional injuries occurred in hospitals (n = 22,750) and residential care without skilled nursing (n = 22,460) (Table 2). The overall annual average rate of intentional violent injuries in the health care and social assistance industry sector was 6.24 per 10,000 workers (95% CI = [6.19, 6.28]). The rate among residential care without skilled nursing was substantially higher than other industries within health care and social assistance. The next three highest rates were in the nursing care facilities, hospital, and home health care services industries.
Number, Percent, and Annual Rate of Intentional Injuries by Another Person Resulting in at Least One Lost Day of Work Among in the Health Care and Social Assistance Industry and Health Care Workers, by Select Industry or Occupation, United States, Bureau of Labor Statistics Survey of Occupational Injuries and Illnesses, 2011 to 2017
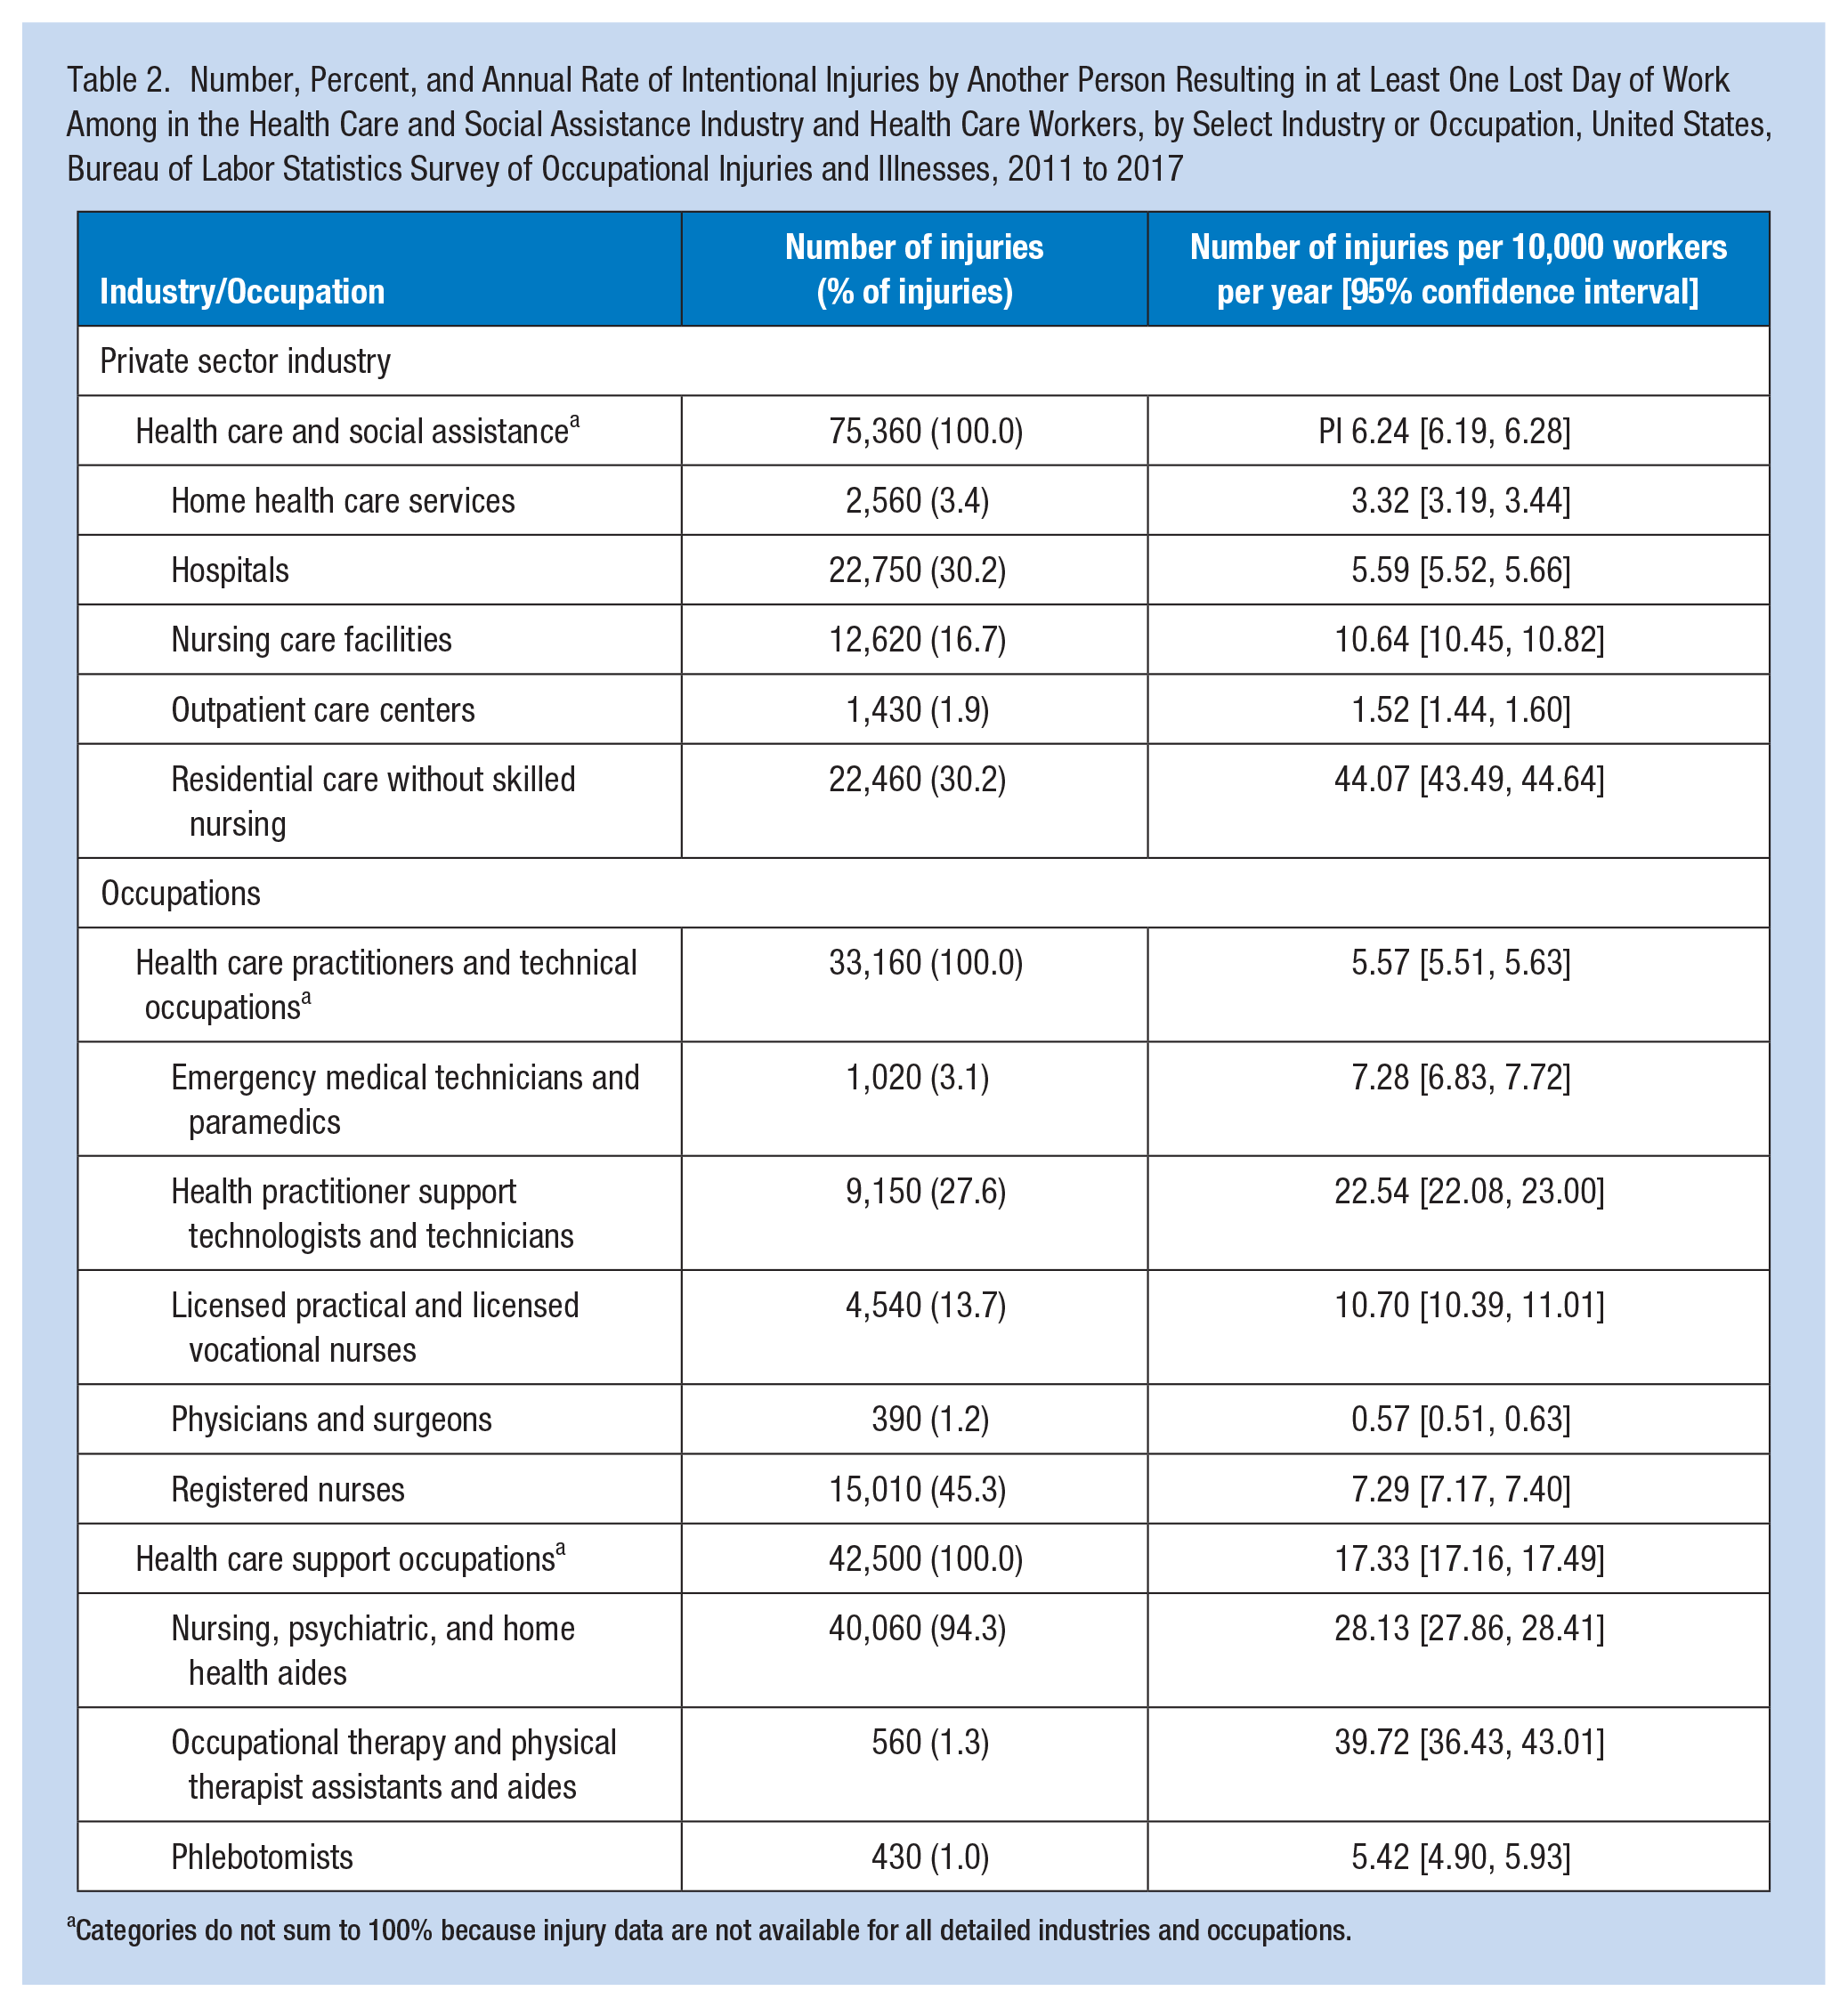
Categories do not sum to 100% because injury data are not available for all detailed industries and occupations.
Among health care practitioners and technical occupations, most occurred to RNs, health practitioner support technologists and technicians, and licensed practical and licensed vocational nurses. Among health care support occupations, the vast majority of injuries occurred among nursing, psychiatric, and home health aides.
The rates of injuries among health care practitioners and technical occupations were 5.57 per 10,000 (95% CI = [5.51, 5.63]) lower than among health care support occupations which were 17.33 per 10,000 workers (95% CI = [17.16, 17.49]). Despite their relatively low number of injuries, occupational therapy and physical therapist assistants and aides had an injury rate more than 2 times higher than that for health care support occupations overall. Health practitioner support technologists and technicians’ injury rate was more than 4 times higher than that for all health care practitioners and technical occupations.
Injury Trends by Industry and Occupation
Within the private health care and social assistance industry group, the AAPC was 5.19 (95% CI = [4.81, 5.57]), which indicates that on average between 2011 and 2017 the injury rate increased by 5.19% compared with the previous year (Table 3). With the exception of outpatient care centers, the AAPC was positive among all industries. The highest AAPC was observed among home health care service followed by nursing care facilities and hospitals.
Average Annual Percent Change a (AACP) in the Number of Intentional Injuries by Another Person Resulting in at Least One Lost Day of Work per 10,000 Workers Among in the Health Care and Social Assistance Industry and Health Care Workers, by Industry or Occupation, United States, Bureau of Labor Statistics Survey of Occupational Injuries and Illnesses, 2011 to 2017
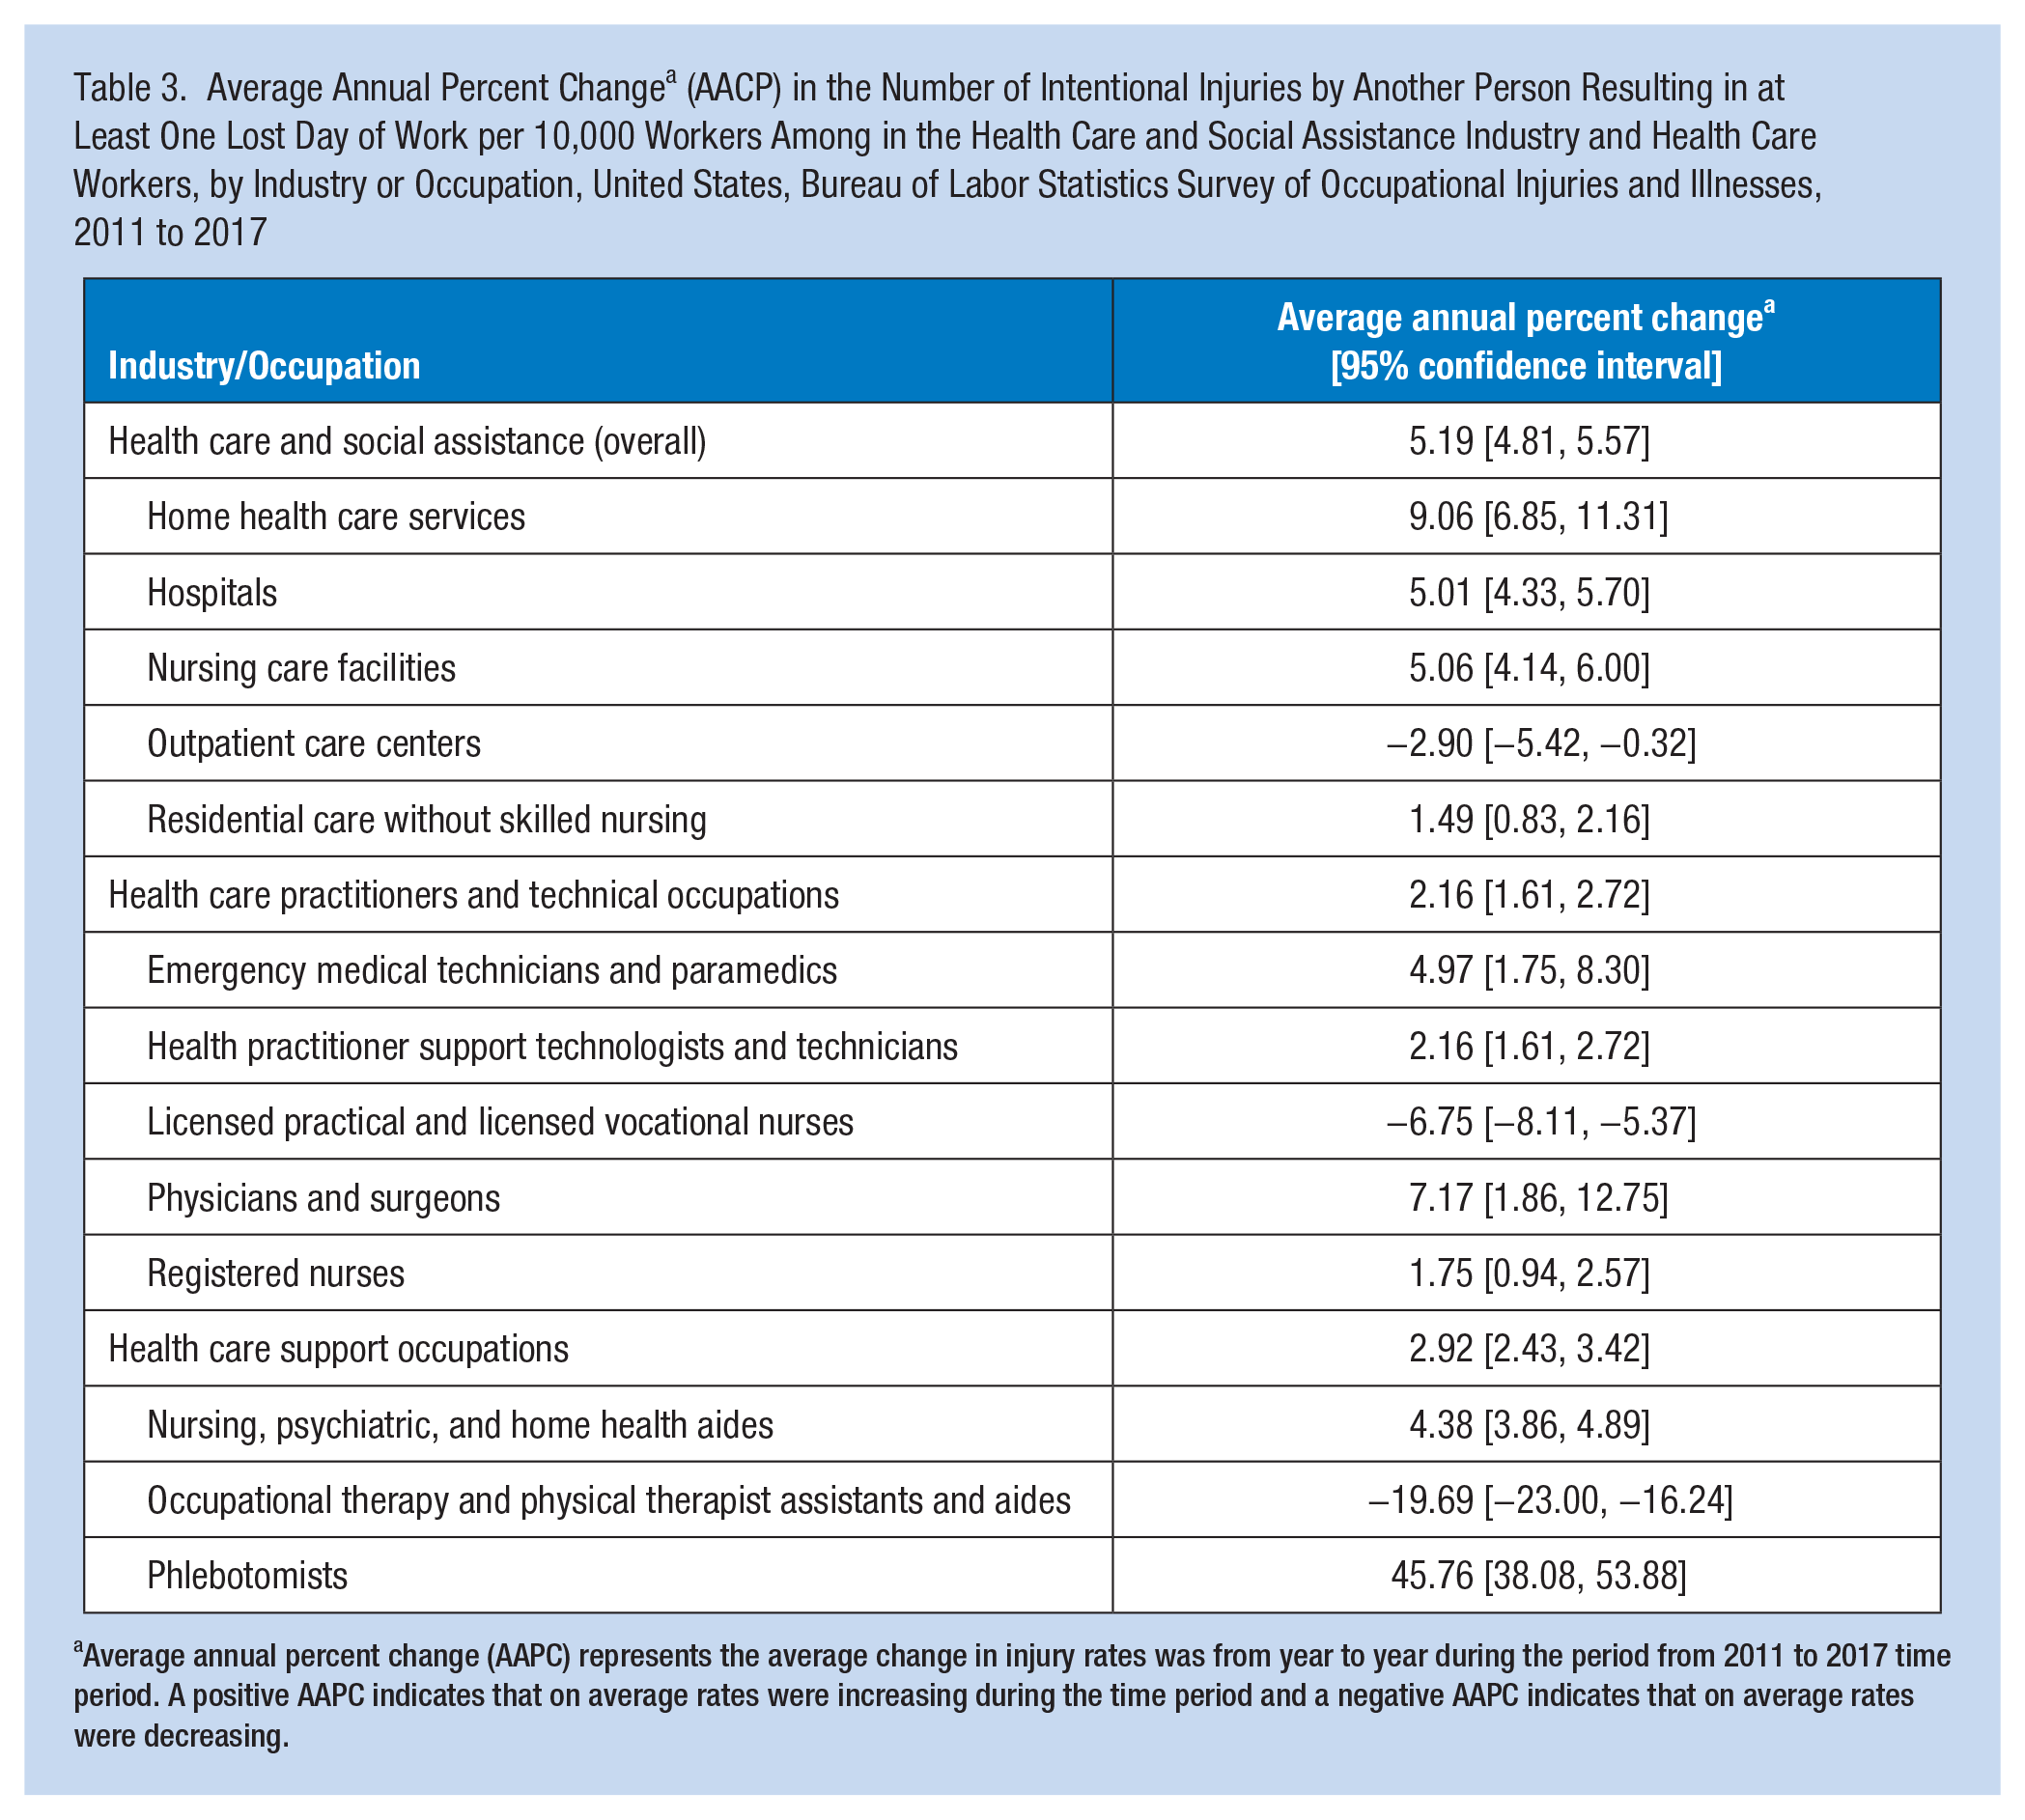
Average annual percent change (AAPC) represents the average change in injury rates was from year to year during the period from 2011 to 2017 time period. A positive AAPC indicates that on average rates were increasing during the time period and a negative AAPC indicates that on average rates were decreasing.
The AAPC was 2.16 (95% CI = [1.61, 2.72]) among health care practitioners and technical occupations and 4.38 (95% CI = 2.43, 3.42) among health care support occupations. With the exception of occupational therapy and physical therapist assistants and aides and licensed practical and vocational nurses, all of the detailed occupations had positive AAPCs. Although the highest AAPC was observed among phlebotomists (45.76; 95% CI = [38.08, 53.88]), most of this increase was due to a very drastic increase that occurred in 2017. Among health care practitioners and technical occupations, the highest AAPCs were among physicians and surgeons. With the exception of phlebotomists, the highest AAPC among health care support occupations was among nursing, psychiatric, and home health aides.
Injury Counts and Rates by Demographic Characteristics
Across both occupation groups and within the private health care and social assistance industry group, the highest percentage of injuries occurred among those between the ages of 25 and 64 and the lowest percentage of injuries occurred among those aged 16 to 19 years and aged 65 or older (Table 4). Within health care practitioner and technical occupations, compared with those aged 25 to 34, 35 to 44 (risk ratio [RR] = 1.13, 95% CI = [1.10, 1.17]), 45 to 54 (RR = 1.23, 95% CI = [1.19, 1.27]), and 55 to 64 (RR = 1.21, 95% CI = [1.16, 1.26]) had significantly higher injury rates, whereas those aged 65 and above were significantly lower (RR = 0.58, 95% CI = [0.54, 0.62]). Within the health care support occupations, compared with those between the ages of 25 and 34 years, those 35 and 44 years (RR = 1.15, 95% CI = [1.12, 1.18]), and 45 and 54 (RR = 1.19, 95% CI = 1.16, 1.23) had significantly elevation rates. The injury rates of those aged 16 to 19 (RR = 0.75, 95% CI = [0.70, 0.81]), 20 to 24 (RR = 0.80, 95% CI = [0.77, 0.83]), and 65 years and older (RR = 0.38 95% CI = [0.35, 0.41]) had significantly lower injury.
Number, Percent, Annual Rate, and Crude Rate Ratio of Intentional Injuries by Another Person Resulting in at Least One Lost Day of Work Among in the Health Care and Social Assistance Industry and Health Care Workers, by Demographic Characteristics, United States, Bureau of Labor Statistics Survey of Occupational Injuries and Illnesses, 2011 to 2017
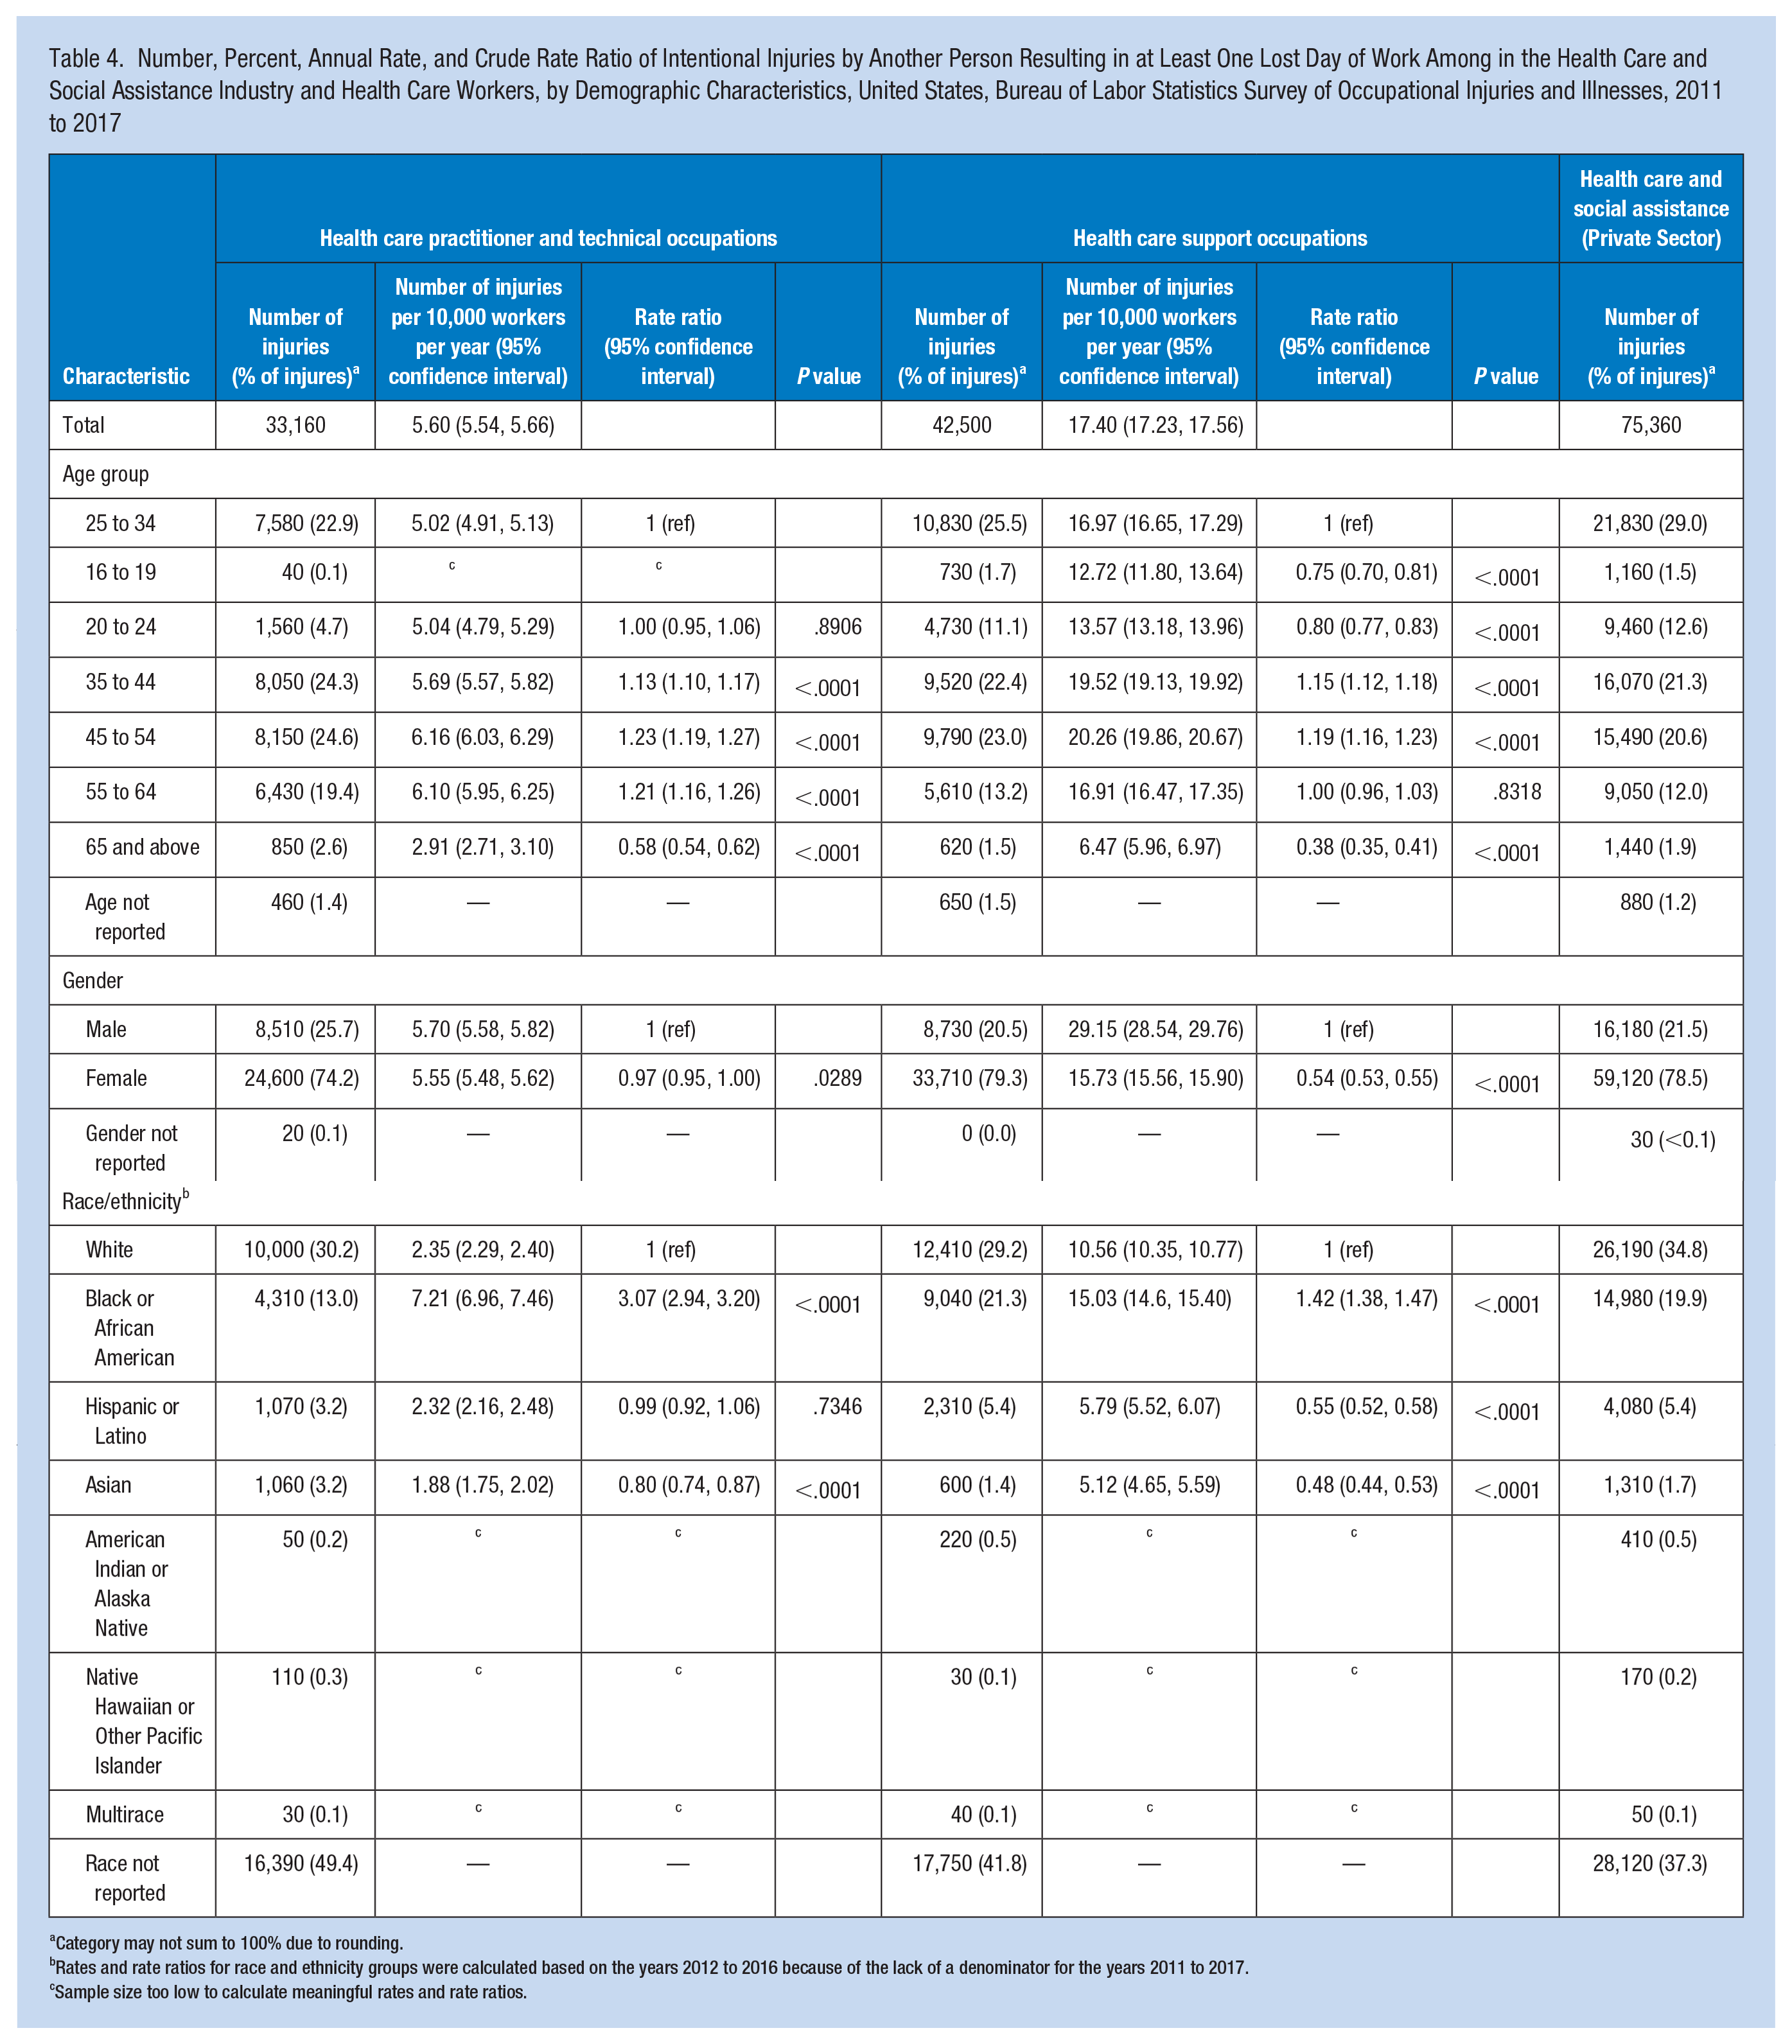
Category may not sum to 100% due to rounding.
Rates and rate ratios for race and ethnicity groups were calculated based on the years 2012 to 2016 because of the lack of a denominator for the years 2011 to 2017.
Sample size too low to calculate meaningful rates and rate ratios.
Across both occupational groups and within the private health care and social assistance industry group, females accounted for between 70% and 80% of injuries. Within health care practitioner and technical occupations, the rate of injuries was not significantly different between males and females. Within health care support occupations, compared with males, females had a significantly lower rate of injury (RR = 0.54, 95% CI = [0.53, 0.55]).
Across both occupation groups and within the private health care and social assistance industry group, White workers accounted for the most injuries followed by Black/African American workers. Within health care practitioner and technical occupations, compared with White workers, Black workers had a significantly and substantially higher injury rate (RR = 3.07, 95% CI = [2.94, 3.20]). The rate was not significantly different for Hispanic/Latino workers and Asian workers had a significantly lower injury rate (RR = 0.80, 95% CI = [0.74, 0.87]). Within health care support occupations, compared with White workers, Black workers had a significantly higher injury rate (RR = 1.42, 95% CI = [1.38, 1.47]). Hispanic/Latino (RR = 0.55, 95% CI = [0.52, 0.58]) and Asian workers (RR = 0.48, 95% CI = [0.44, 0.53]) had a significantly lower injury rates.
Sensitivity Analysis
For the total number of injuries by industry and occupation, we compared the annual estimate of injuries per 10,000 workers with the BLS SOII published estimate for annual the number of injuries per 10,000 full-time equivalents (FTEs). We found that these numbers were highly correlated (data not shown).
Discussion
In this study, we aimed to provide injury rates for violence injuries to health care workers and in the health care industry according to detailed industry and occupation categories, as well as report trends in violence-related injuries. We observed that the incidence rate of violent injuries in health care is increasing for most industries and occupations. The findings from this study are consistent with other studies. For example, similar to Groenewold et al. (2018), this study found that violent injuries in health care are increasing. While Groenewold et al. (2018) found that nurses and nursing assistants had the highest rates of these injuries, this study found that the rate was highest among occupational therapy and physical therapist assistants and aides. However, rates among nursing, psychiatric, and home health aides and nurses were still elevated. In addition, although direct comparison is not possible with Harrell (2011), because of different occupational classifications, that study found that rates of violent injuries were elevated among mental health occupations. In this study, the residential care without nursing industry was found to have rates substantially elevated compared with other industry. Mental health and substance abuse treatment is a large component of the residential care industry (BLS, 2021b).
The comparisons described here should be interpreted with caution. This study utilized BLS data which contain injuries resulting in at least one lost work day. Many of these other studies contain data about all injuries, regardless of whether they resulted in lost work days. With respect to industry, rates were most elevated in residential care facilities without nursing and nursing facilities. These elevated rates may be at least partially explained by the patients served in these facilities. There is evidence that patients with dementia present a higher risk of violence (Scott et al., 2011), where there has been a trend of underreporting of unintentional violence, for example, within this patient population (Lachs et al., 2013; Pulsford & Duxbury, 2006). The residential care without nursing industry includes a number of different forms of residential care including care for those with intellectual and developmental disabilities, as well as mental health substance misuse challenges. Although these vulnerable populations are much more likely to be victims of violence than the perpetuators of violence, there is still evidence of elevated risk among health care workers in these facilities (Maagerø-Bangstad et al., 2019; Nolan et al., 1999). Substantially elevated rates among nurses and nursing aides are also consistent with a number of other studies, which may be related to the fact these occupations tend to have more contact time with patients (Groenewold et al., 2018; Pompeii et al., 2015).
The finding that younger health care workers had a lower injury rate compared with older health care workers contradicts previous research that has found that trainees and first year health care workers generally have higher rates of violent injuries (Hogh et al., 2008). As summarized by Gillespie et al. (2010), different studies have showed contradictory evidence about sex as a risk factor for violent injuries in health care, similarly as the results demonstrated variation in sex differences across the occupations. The findings of elevated rates among Black/African American health care workers are especially striking, and to the best of our knowledge, there have not been any other studies that have examined disparities in violence injuries in health care according to race/ethnicity. The results with respect to race and ethnicity from this study should be interpreted carefully because of the high degree of missing data for race/ethnicity.
Findings from this study have a number of notable limitations. First, because of how the BLS SOII collects data, this study only includes an estimate of violent injuries based on sample of industries. Although this sample is designed to be representative of the workforce, some discrepancies are still possible. The BLS SOII likely underrepresents the total number of occupational injuries in the United States (Boden & Ozonoff, 2008) as this study is also only based on reported injuries. There is substantially evidence that many injuries in health care settings, including violent injuries, go unreported (Arnetz et al., 2015). Because the BLS SOII is meant to describe more severe injuries resulting in at least one lost work day, this underreporting may not be as much of a problem with the findings presented here. In addition, this study only describes violent injuries for which there was at least one day of lost work. Many violence-related injuries will not result in any lost work time.
This study used the number of workers as a denominator rather than the number of FTEs. The risk of violence-related injuries likely increases with time at work and patient contact time. For workers who work less than full-time, the use of the number of workers as a denominator could result in an underestimation of actual risk and similarly an overestimation for those who work more than full-time. As noted in the results, we compared rates using FTE and workers as the denominator and found that the rates were the two different denominators tended to be correlated.
Implications for Occupational Health Practice
As with other workplaces, health care facilities are required to “furnish . . . a place of employment which are free from recognized hazards that are causing or are likely to cause death or serious physical harm to his employees” (Occupational Safety and Health Administration [OSHA], 1970). These findings suggest that health care facilities nationwide are failing to do so. Violence-related injuries in health care remain a difficult issue to both study and intervene on due to the complexity of the actual exposure and the limited availability of protection for workers. There are recognized strategies that can be utilized to reduce the risk of violence among health care workers. Some efforts for the prevention and management of WPV have drawn heavily on Section 5 (a) (1) of the Occupational Safety and Health Administration (OSHA) Act (General Duty Clause) or the Federal Guidelines for Preventing Workplace Violence for Health care and Social Service Workers, originally published in 1996 and revised in 2004 and 2016 (U.S. Department of Labor, 2016), including the recent House Resolution (HR) 1309, Workplace Violence Prevention for Health Care and Social Service Workers Act, that was passed by the U.S. House of Representatives in 2019. These include management commitment and employee involvement, worksite analysis, hazard prevention and control, training and education, and record keeping and program evaluation (U.S. Department of Labor & OSHA, 2016). Comprehensive models for the prevention and management WPV should address the variations of exposures and risk factors across occupations and client populations being served (Byon et al., 2021; Laranjeira, 2021). Engaging the workforce is crucial in designing and implementing and evaluating such policies and training programs that include topics such as communication skills and de-escalation techniques, with particular emphasis on reporting (International Labour Organization [ILO], 2020; Laranjeira, 2021).
Footnotes
Acknowledgements
We would like to thank the Bureau of Labor Statistics for providing the data used in this study.
Declaration of Conflicting Interests
The author(s) declared no potential conflicts of interest with respect to the research, authorship, and/or publication of this article.
Funding
The author(s) received no financial support for the research, authorship, and/or publication of this article.
Author Biographies
Devan Hawkins is an instructor of Public Health in the Public Health program in the School of Arts and Sciences at MCPHS University. His research interests include the contribution of work to social and racial health inequities, health care worker health and safety, and the health impacts of climate change.
Mazen El Ghaziri is an assistant professor at the School of Nursing, College of Health Sciences, at UMass Lowell. His area of interest is workplace violence, focused on the organization of work and the work environment.