
Abstract
Background: The physical activity (PA) health paradox hypothesizes that occupational physical activity (OPA) and leisure time PA have differential cardiovascular health effects due to increased cardiovascular load without adequate recovery; however, research describing worker PA lacks high-quality objective OPA measurement. This study aimed to objectively describe PA profiles of men reporting high OPA and make comparisons to aerobic PA and OPA recommendations. Methods: Male food service, material moving, health care, or maintenance workers wore activity (ActiGraph® and activPAL®) and heart rate monitors for 7 days. Participants recorded work, non-work, and sleep times in a diary. PA was operationalized as time spent in sedentary behavior, upright time, light, moderate, vigorous, and moderate-to-vigorous PA during work and non-work hours. PA profiles were described and compared with Centers for Disease Control and Prevention aerobic PA guidelines (≥21.4 minute/day) and OPA recommendations (<30 minute/hour upright and intensity of <30% heart rate reserve). Findings: Nineteen male workers (68% White, age = 46.6±7.9 years) were more active on workdays than non-workdays (sedentary: 492.3 vs. 629.7 minute/day; upright: 462.4 vs. 325.2 minute/day; moderate-to-vigorous PA: 72.4 vs. 41.5 minute/day, respectively; all p < .05). Most participants (17/19) achieved aerobic PA guidelines across all days with more achieving on workdays (19/19) than non-workdays (13/19). OPA often exceeded recommended limits with participants accumulating 39.6±12.2 minutes/work hour upright and 30.3±25.9% of working time >30% heart rate reserve. Conclusions/Application to Practice: Male workers reporting high OPA typically met aerobic PA guidelines but exceeded recommended OPA limits. The long-term health implications of such activity profiles should be investigated.
Background
Leisure-time physical activity (LTPA) is physical activity that is accumulated outside of working time and is known to promote cardiovascular health (2018 Physical Activity Guidelines Advisory Committee, 2018). However, moderate and high self-reported occupational physical activity (OPA) is associated with increased risk for cardiovascular disease and all-cause mortality (Holtermann et al., 2009, 2010, 2012, 2018; Krause et al., 2015). These conflicting findings have been labeled the physical activity (PA) health paradox (Holtermann et al., 2018). Jobs with high OPA have different activity patterns during work and leisure time, which may adversely affect cardiovascular health; however, limited research describing objective LTPA and OPA patterns provides inadequate understanding of this potential mechanism.
Data from the National Health and Nutrition Examination Survey (NHANES) and Coronary Artery Risk Development in Young Adults (CARDIA) study identified occupation as a significant determinant of the PA profile (Quinn et al., 2020; Steeves et al., 2018). Yet, descriptive research has been limited to self-reported occupation to estimate OPA (Quinn et al., 2020) or objective measurement of whole day activity without isolation of work time (Steeves et al., 2018). Thus, the objectives of this study were to describe domain-specific (work vs. leisure) PA profiles among men with active jobs using objective measurement and to compare those profiles with current Centers for Disease Control and Prevention (CDC) aerobic PA guidelines (2018 Physical Activity Guidelines Advisory Committee, 2018; United States Department of Health, 2008) and OPA recommendations for occupational sedentary time (Buckley et al., 2015) and OPA intensity (Jørgensen, 1985; Wu & Wang, 2002).
Methods
This study employed a within-subjects repeated measures design to collect and describe objective PA data from participants during work and non-workdays. Men working in industries known to have high amounts of light-intensity OPA (e.g., food service, material moving, health care, or maintenance) (Quinn et al., 2020; Steeves et al., 2018) were invited to participate using direct contact and flyers to local businesses. Workers that were interested completed an initial phone screening and were determined eligible to participate if they reported: (a) being male; (b) aged 35 to 59 years, (c) worked full-time (≥30 hours/week); (d) self-reporting predominantly light-intensity job responsibilities (≥75% walking, light movement, or standing), (e) had no self-reported cardiovascular disease (coronary heart disease, stroke, peripheral artery disease), and (f) did not report currently taking medications affecting blood pressure (BP) or heart rate (HR). Workers were also included only if they were “low risk” on a commonly used PA pre-participation screening tool, the PA Readiness Questionnaire (PAR-Q) (Thomas et al., 1992). This questionnaire is meant to be self-administered and consists of a series of seven yes/no questions regarding a person’s known diseases, signs and symptoms of cardiovascular disease, and musculoskeletal health.
Potential participants were excluded if they reported: (a) mobility limitations (self-reported inability to climb two flights of stairs or walk 2 city blocks), (b) worked night shift, or (c) worked a second job. Women were not included to limit the known influence of sex on the association between OPA and cardiovascular health (Coenen et al., 2018; Quinn et al., 2020). Only middle-aged men (aged 35–59 years) were included because cardiovascular disease markers are known to be higher in this age group versus younger adults, and the poor cardiovascular health such as vascular remodeling hypothesized to be associated with high levels of OPA would be more likely observable in older workers (Rapsomaniki et al., 2014).
Participants that met the eligibility criteria were asked to report to the study laboratory after abstaining from food, caffeine, exercise, and nicotine for ≥1 hr. After informed consent was obtained, the following were measured: (a) confirmation of PAR-Q questions (Thomas et al., 1992), medical history (e.g., disease history and current medication use), current smoking status (daily, less than daily, and not at all); and (b) demographics (such as age, sex, and race/ethnicity); (c) HR and BP, which were measured following a 10-minute rest, with BP measure on the non-dominant arm using a validated oscillometric device (HEM-705CPN, Omron, Lake Forest, IL); (Vera-Cala et al., 2011), and (d) weight and height to the nearest 0.1 kg and 0.1 cm, used to calculate body mass index (kg/m2), respectively. At this stage, participants were further excluded if they had high blood pressure (systolic ≥ 150 mmHg or diastolic ≥ 95 mmHg). Eligible participants then completed a submaximal treadmill exercise test (modified Balke protocol to 80% age-predicted HR maximum) to estimate cardiorespiratory fitness as maximal volume of oxygen consumption (VO2max) (American College of Sports Medicine, 2013; Jakicic et al., 2009).
Physical Activity Measurement
Following the recruitment and baseline assessment process, participants were asked to wear a thigh-worn inclinometer/accelerometer to objectively measure posture (sitting/standing/steps; activPAL3 micro, PAL Technologies, Glasgow) and a waist-worn tri-axial accelerometer to estimate physical activity ambulation and intensity (GT3X-BT, ActiGraph®, Pensacola, Fl) (Lyden et al., 2012; Matthews et al., 2012) for 7 days. In addition, participants completed a custom paper diary of start and stop times for work, sleep, and monitor wear periods for each day, which were then used to characterize activity as work time (time while at work), non-work time (time while not at work), or sleep.
The activPAL® was affixed to the anterior right thigh continuously for 7 days to measure posture (sitting/lying or upright) and stepping at a sampling rate of 10 Hertz (Edwardson et al., 2017). Daily data were considered valid with ≥10 hours/day of waking wear time (Edwardson et al., 2017). Data were exported in 15-second epochs and classified as: (a) sedentary behavior (time spent seated or lying down, SED), (b) stepping, or (c) standing using manufacturer-provided software (Edwardson et al., 2017). Data were further integrated into 1-minute epochs before analyses to align with ActiGraph® data, which are recorded as 1-minute epochs. All self-reported nap, sleep, and non-wear periods were removed from daily SED after checking for body posture agreement. Further data reduction divided total SED into time accumulated in short bouts (short-bout SED, <30 consecutive minutes) and long bouts (long-bout SED, ≥30 consecutive minutes). Upright time was calculated as the total time spent standing or stepping and time spent in long upright bouts (long-bout upright, ≥60 continuous minutes).
Two ActiGraph® GT3X-BT monitors, both worn on a belt over the right hip, measured activity pattern and intensity for 7 days at a sampling rate of 60 Hertz. Two monitors were used to ensure battery life throughout the 7 days while also collecting HR data (see below). Thus, the monitors were programmed to collect data over 4 days and 3 days, respectively, and would automatically switch data collection between the monitors halfway through the week. Each participant removed their monitors only for water activities and recorded any non-wear time in their diary. Data were integrated as 1-minute epochs using ActiLife software (ActiGraph®, Pensacola, FL) and considered valid with ≥10 hours/day of valid wear time (Troiano et al., 2008; Tudor-Locke et al., 2012). Wear time was defined using the same intervals from the activPAL® monitor (Troiano et al., 2008; Tudor-Locke et al., 2012). The number of 1-minute epochs spent in light PA, moderate PA, and vigorous PA were identified via 3-axis acceleration using Freedson cutpoints within the ActiLife software (Sasaki et al., 2011). Total moderate-to-vigorous PA (MVPA) was calculated as moderate-equivalent minutes (i.e., moderate + [vigorous × 2]) (Physical Activity Guidelines Advisory Committee, 2018).
In summary, using both activPAL® and ActiGraph® data, we calculated time spent in total SED, short-bout SED, long-bout SED, upright, long-bout upright, light PA, moderate PA, vigorous PA, and MVPA which were all averaged during all valid wear days, work and non-workdays (total of days with or without work), and work time (time only while at work) based on the diary.
Heart Rate Measurement
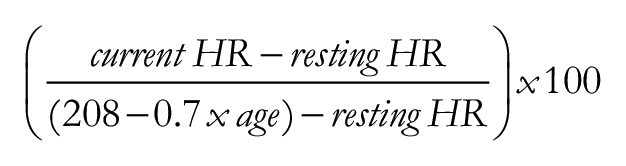
Participants wore a chest-worn HR monitor (H10 Bluetooth, Polar) for 7 days, only removing it during water activities and recording any non-wear time in their diary. The HR monitor was paired via Bluetooth with the ActiGraph® accelerometer to continuously measure and store HR data throughout the 7 days. Minute-by-minute HR values were calculated as a percentage of heart rate reserve (HRR) to quantify the relative activity intensity of OPA throughout the day (Equation 1) (American College of Sports Medicine, 2013).
All study procedures were approved by the University of Pittsburgh Institutional Review Board (STUDY number 19050097). Participants provided written informed consent prior to enrollment.
Data Analysis
All analyses were performed in STATA v. 16. Descriptive analyses were conducted for purposes of describing the demographic and health characteristics of study participants including means (standard deviation), frequency (percentage), or median (25th–75th percentile) depending on variable structure. Physical activity measures were operationalized as daily time spent in total SED, short-bout SED, long-bout SED, upright, long-bout upright, light PA, moderate PA, vigorous PA, and total MVPA. Mixed-effects models were constructed accounting for within-subject correlations across repeated measures were used to estimate PA outcomes on: (a) all days, (b) work time; (c) workdays, and (d) non-workdays after adjustment for wear time, age, body mass index, smoking status, and VO2max. Statistical comparisons are presented as beta coefficients and the associated p-values which represent a comparison between estimated work and non-workday values of each PA variable.
Additional comparisons of PA measures were conducted with those put forth by the CDC that recommends 150 to 299 moderate-equivalent minutes/week of aerobic PA for health benefits and ≥300 minutes/week for greater health benefits, including any domain or bout duration with no upper limit (2018 Physical Activity Guidelines Advisory Committee, 2018; United States Department of Health, 2008). To compare participants’ day-level averages to the CDC’s weekly recommendations, we converted the weekly recommendations to daily-level equivalents (i.e., 150 and 300 minutes/week divided by 7 days equals 21.4 and 42.9 minutes/day, respectively). For comparison of participants’ PA to these recommendations, their PA levels were characterized as: (a) below (0–149 minutes/week), (b) meeting basic (150–300 minutes/week), or (c) meeting high (>300 minutes/week) recommended levels of PA during: (a) all days, (b) workdays, (c) non-workdays, and (d) during work time only.
For the OPA measures, we used a recommendation from an international panel of experts who stated that 2 to 4 hours of an 8-hour workday (i.e., up to 30 minutes/hour) should be spent upright (standing or moving) and that only 4 to 6 hours should be spent sedentary (Buckley et al., 2015). Thus, the amount of upright time/work hour for each participant was compared with these recommendations (Buckley et al., 2015). Again, a simple characterization of the number of participants meeting or exceeding 30 minutes of upright time per work hour is presented. Jørgensen (1985), and Wu and Wang (2002), have recommended that all OPA should be completed at an intensity of ≤30% HRR for an 8-hour workday to maintain optimal cardiovascular health. Therefore, the average percentage of work time spent >30% HRR was summarized for each participant and the number of participants exceeding the recommended levels were presented.
Results
Fifty-eight participants were initially screened with 22 ineligible due to age (n = 4), insufficient OPA (n = 6), working night shift (n = 2), working a second job (n = 3), or being greater than low risk on the PAR-Q (n = 7). Fourteen participants were screened as eligible but did not schedule or report for a baseline assessment. As such, 22 eligible participants reported for an assessment visit, during which 3 became ineligible (2 had high resting BP and 1 had an abnormal cardiovascular response to exercise), resulting in 19 participants enrolled.
Table 1 summarizes the participant characteristics (n = 19). Participants had an average age of 46.6 (SD = 7.9) years, majority were White (68.4%), with almost half (42.1%) worked in food service, or in material moving (47.3%), with fewer (5.3%) in health care, and in building/grounds maintenance (5.3%). Participants reported working an average of 43.3 (SD = 7.1) hours/week and estimated that 88% of their work time was spent standing or moving.
Participant Characteristics (N = 19)
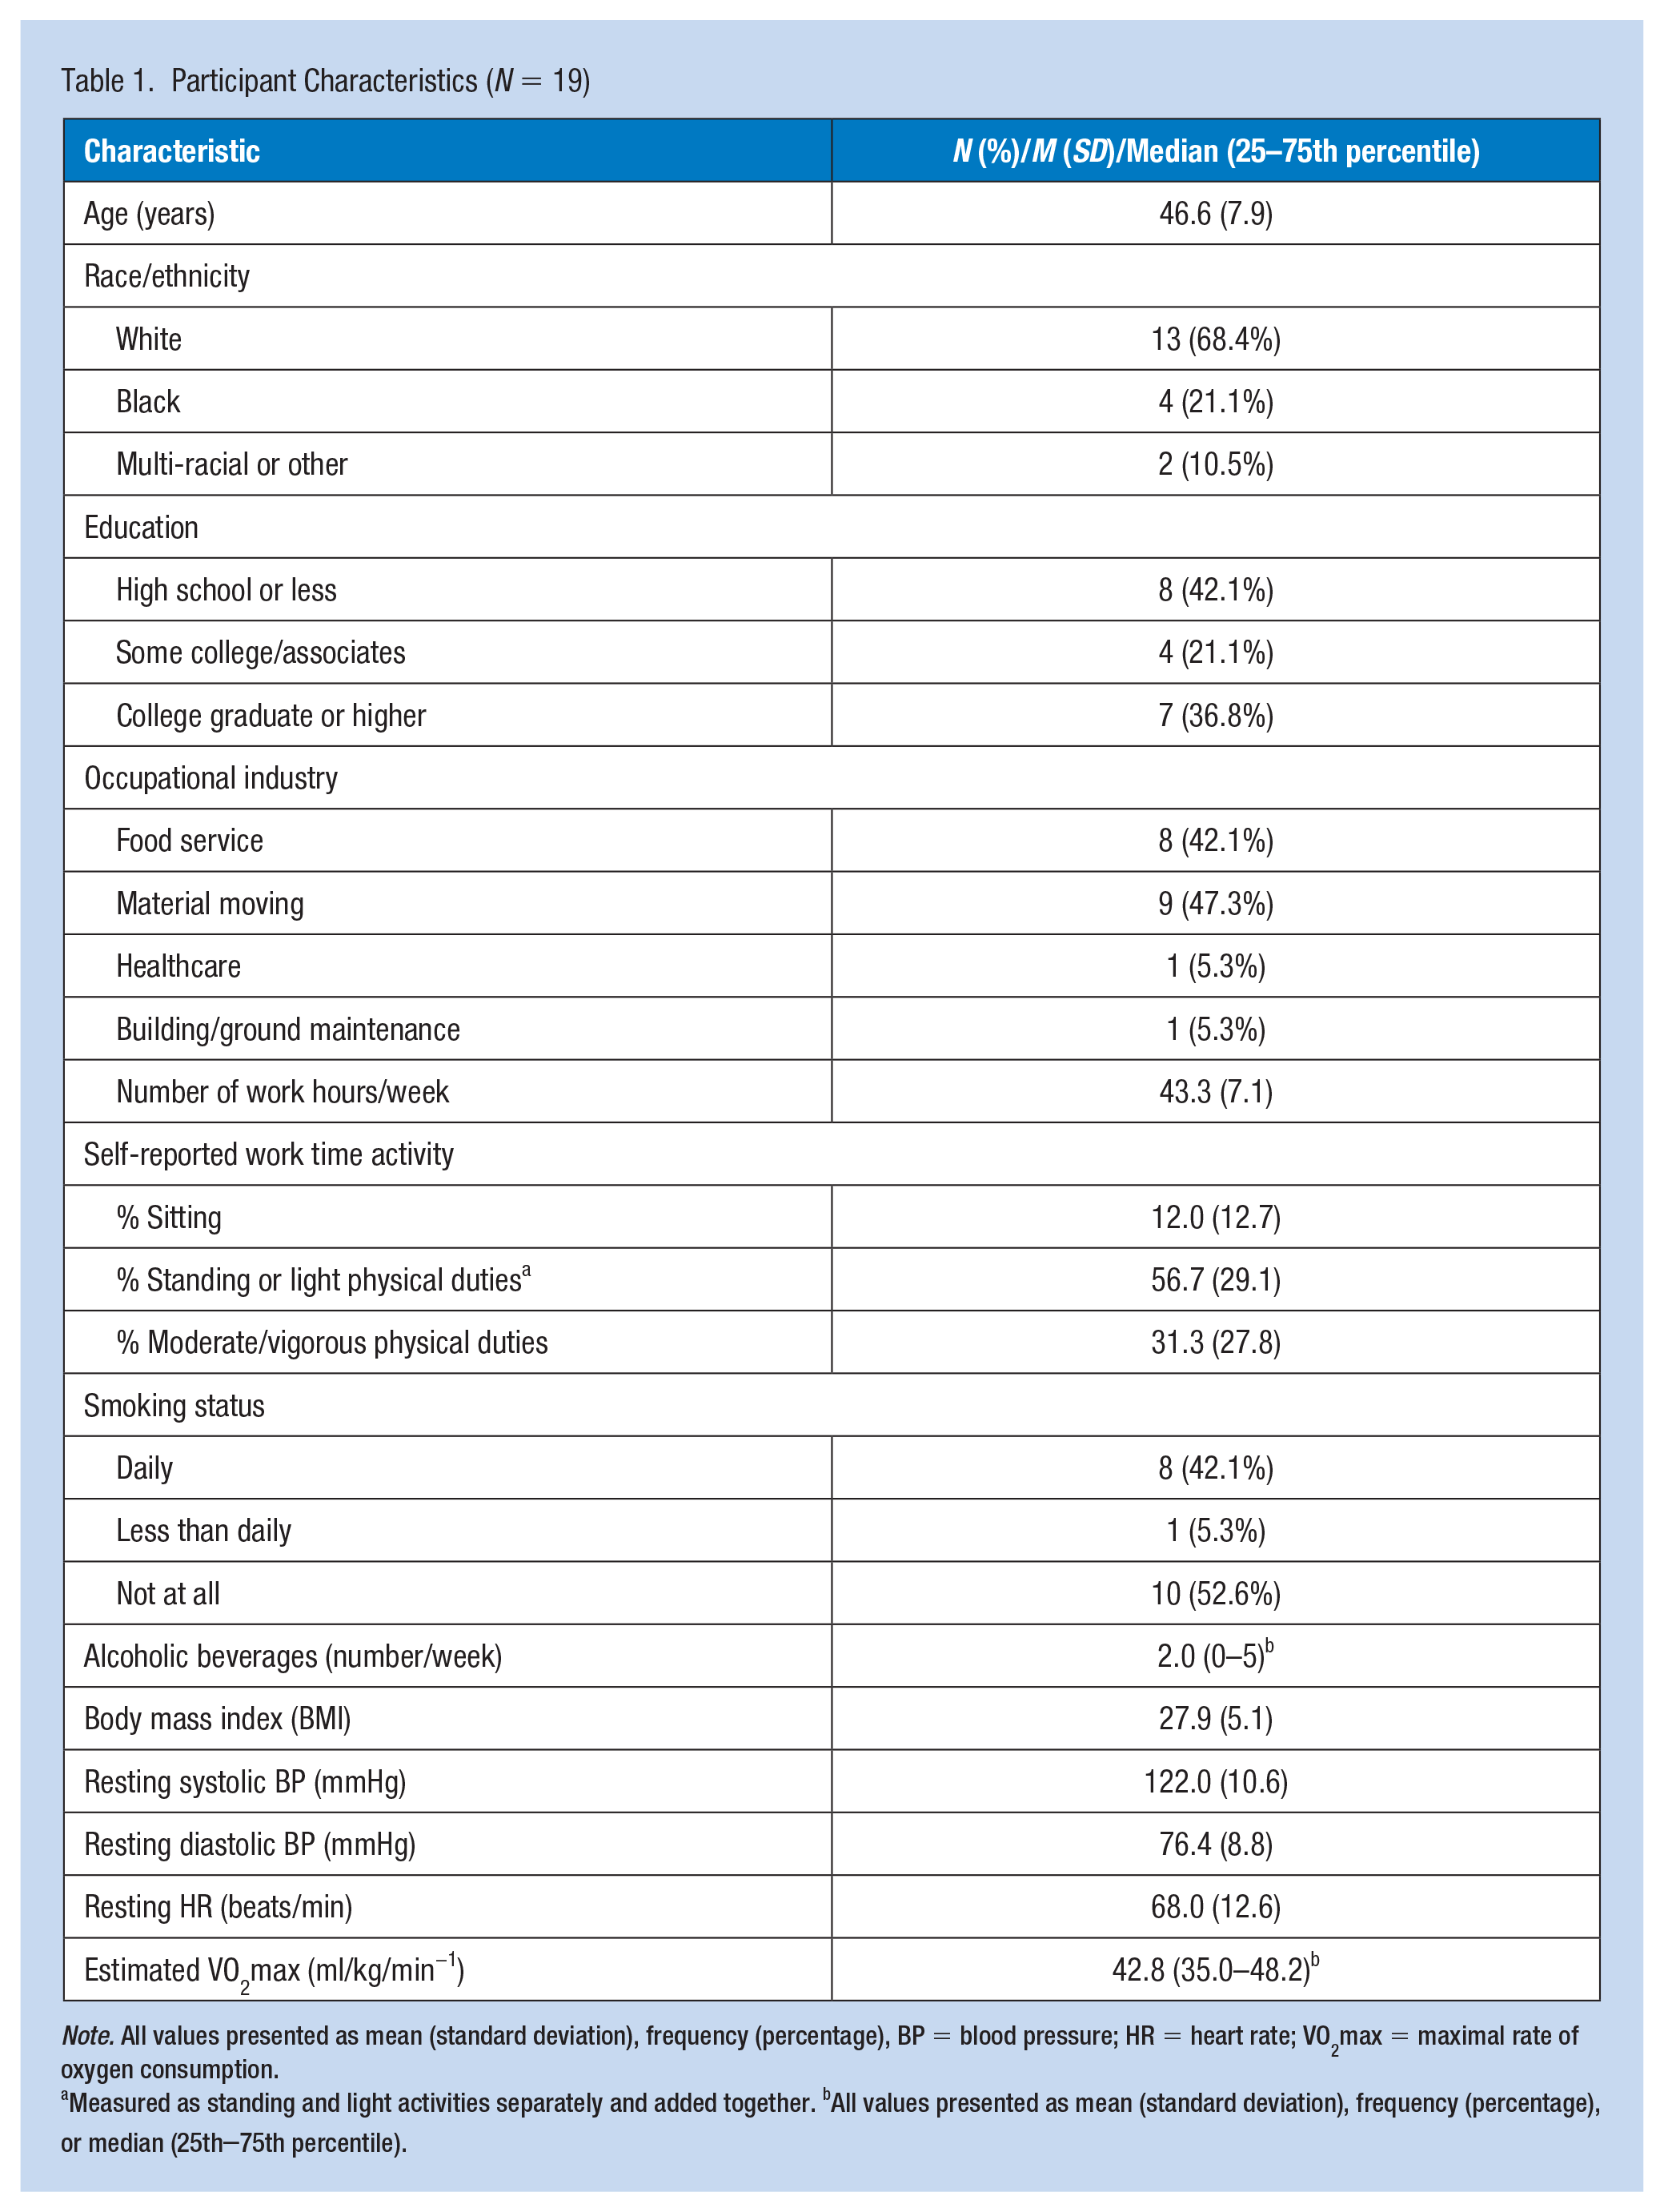
Note. All values presented as mean (standard deviation), frequency (percentage), BP = blood pressure; HR = heart rate; VO2max = maximal rate of oxygen consumption.
Measured as standing and light activities separately and added together. bAll values presented as mean (standard deviation), frequency (percentage), or median (25th–75th percentile).
Table 2 displays PA profiles overall, during work time, and across work and non-workdays as measured by activPAL and ActiGraph monitors. Across all measurement days, participants provided an average of 6.9 (SE = 0.7) days of measurement with approximately 955 (SE = 13) minutes of waking wear time per day. Participants were monitored for an average of 4.8 workdays and 2.1 non-workdays. In general, participants were significantly more active on workdays versus non-workdays. Participants accumulated approximately 137.1 (SE = 20.3) less total SED minutes on workdays compared with non-workdays (p < .001), most of which (101.2 minutes, SE = 21.6) was a reduction in long-bout SED. As the inverse of SED time, upright time was 137.1 (SE = 20.3) minutes higher on workdays versus non-workdays (p < .001). Long-bout upright time was significantly higher on workdays versus non-workdays (β = 120.1 minutes, SE = 21.3, p < .001). Participants had more light- (β = 109.9 minutes, SE = 19.4, p < .001) and moderate-intensity (β = 29.8 minutes, SE = 8.1, p < .001) minutes on workdays than non-workdays, but no difference in vigorous minutes between workdays and non-workdays was observed (β = 1.0 minutes, SE = 0.6, p = .126). Total moderate-equivalent minutes of MVPA was 31.7 (SE = 8.3) minutes higher on workdays versus non-workdays (p < .001). Finally, participants accumulated 4,848 (SE = 765) more steps on workdays than non-workdays (p < .001).
Physical Activity Profile Across Workdays and Non-Workdays
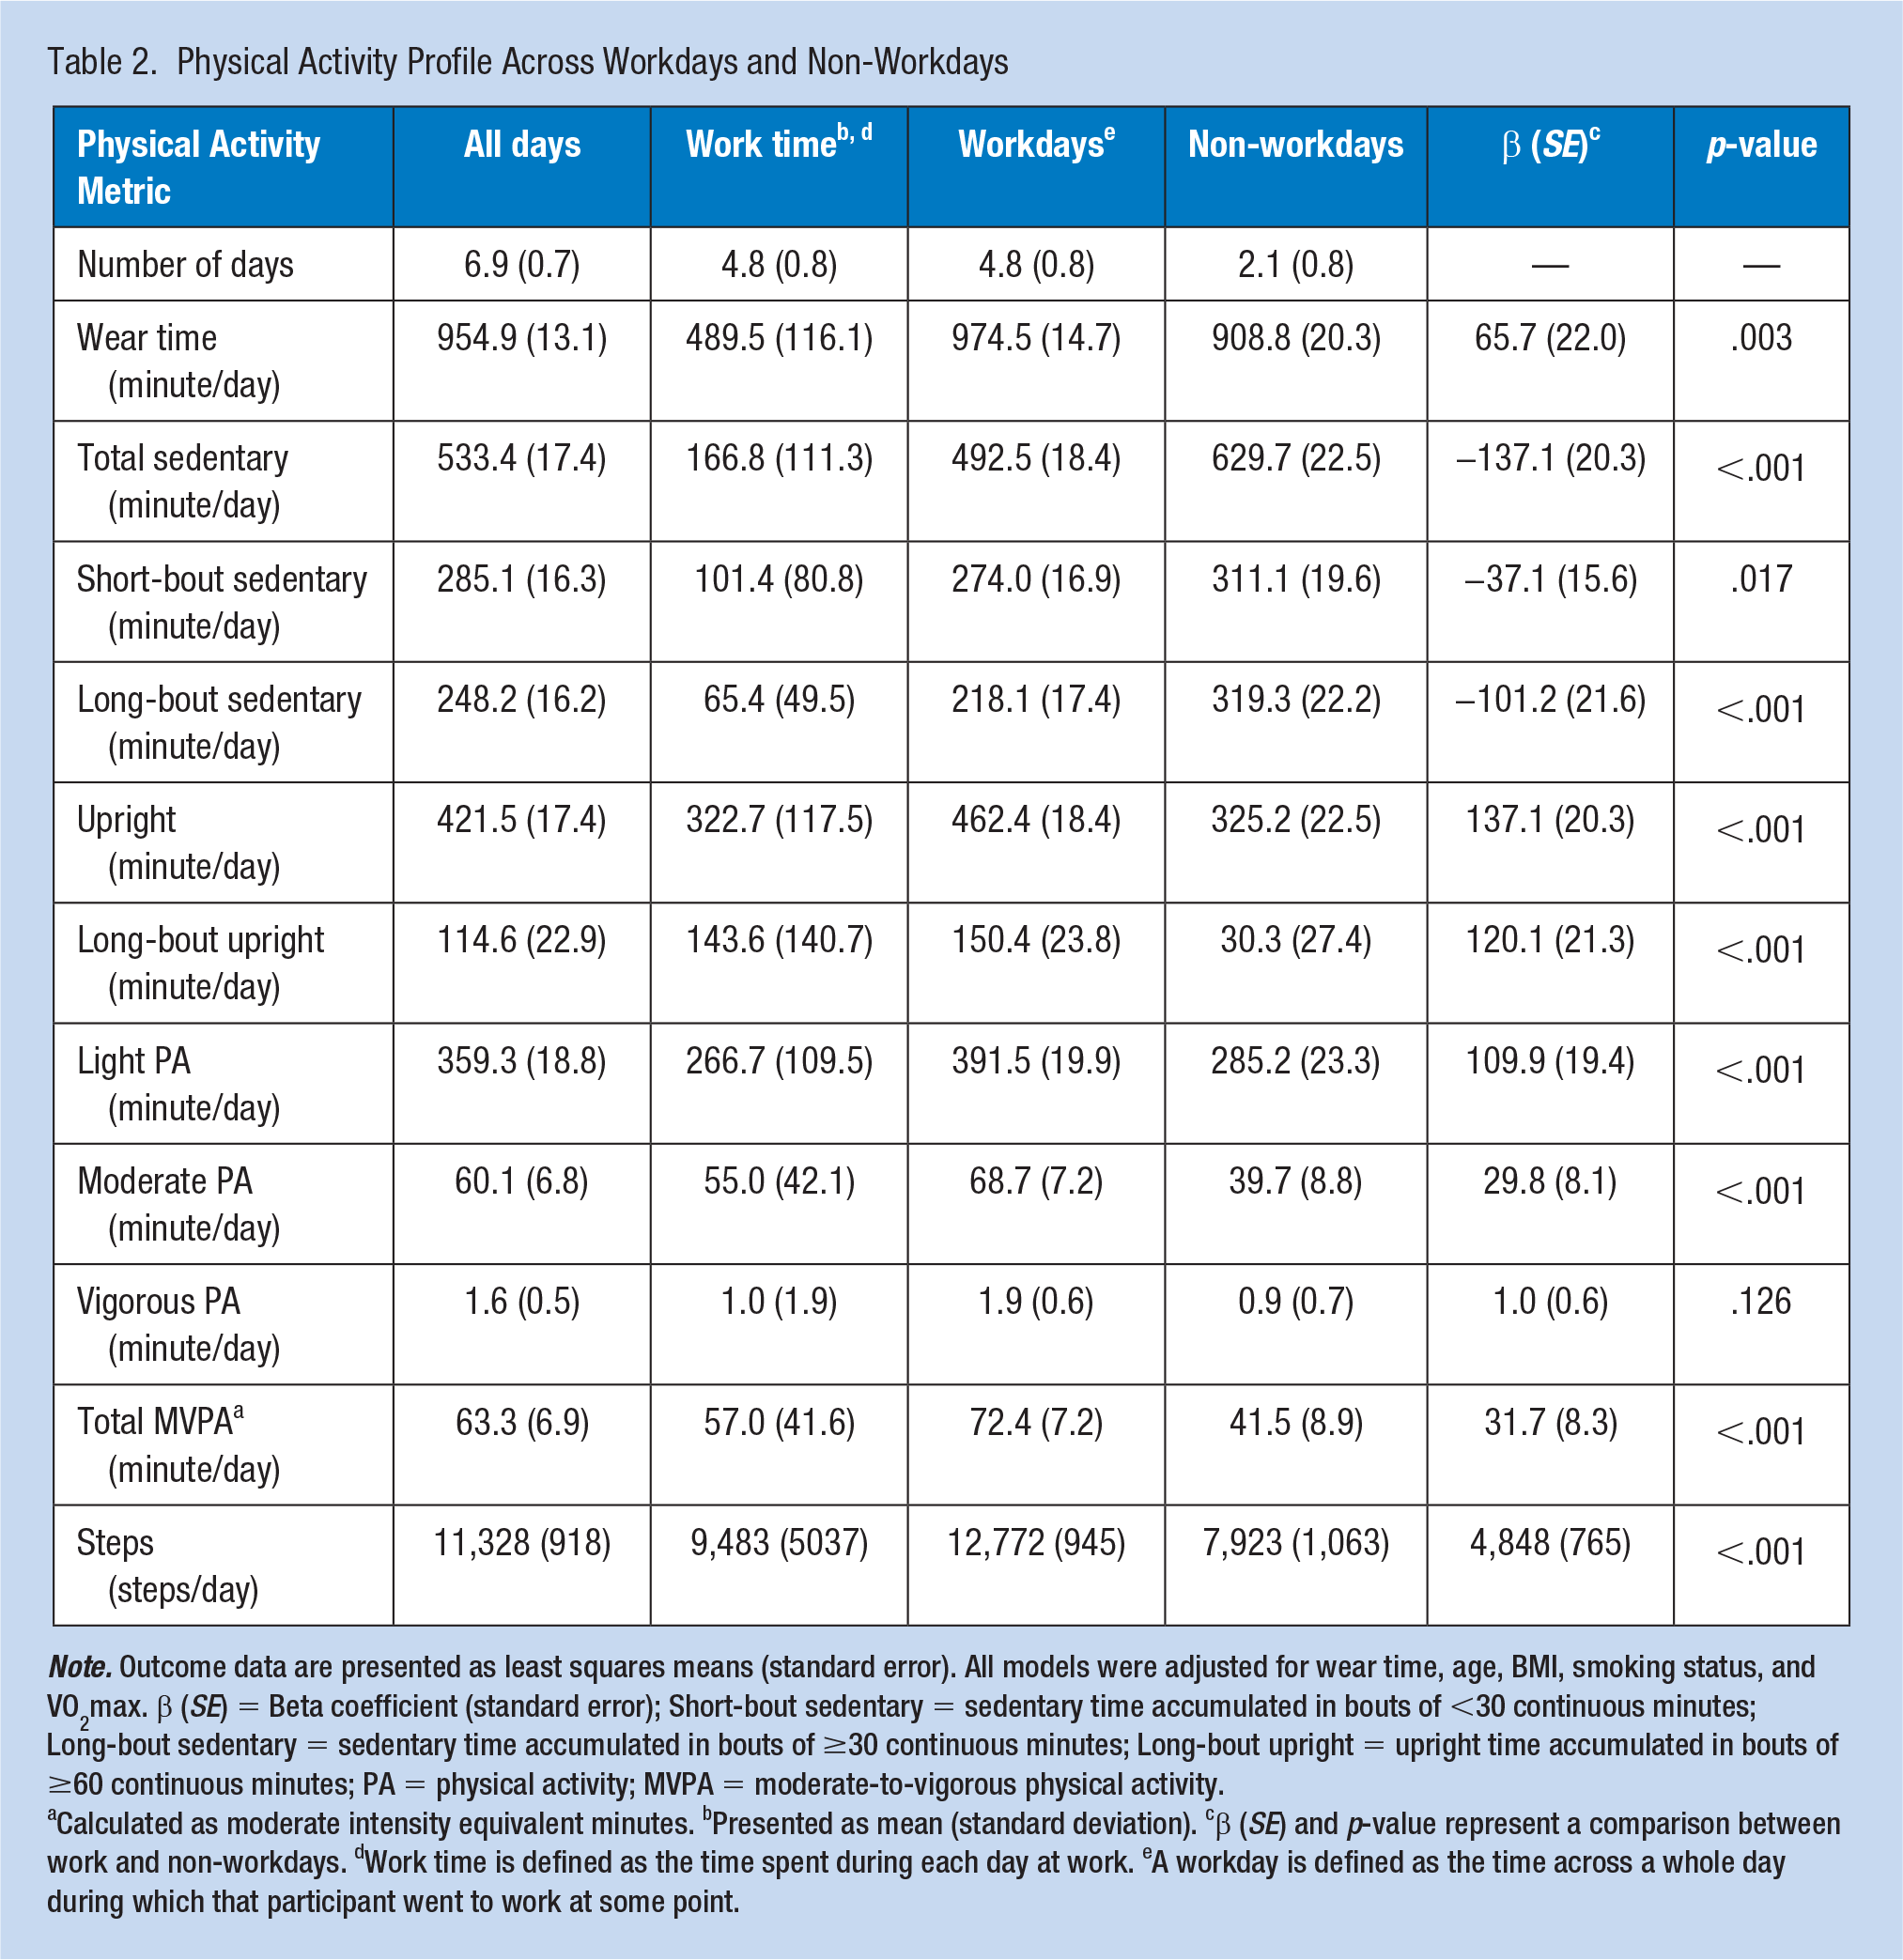
Note. Outcome data are presented as least squares means (standard error). All models were adjusted for wear time, age, BMI, smoking status, and VO2max. β (SE) = Beta coefficient (standard error); Short-bout sedentary = sedentary time accumulated in bouts of <30 continuous minutes; Long-bout sedentary = sedentary time accumulated in bouts of ≥30 continuous minutes; Long-bout upright = upright time accumulated in bouts of ≥60 continuous minutes; PA = physical activity; MVPA = moderate-to-vigorous physical activity.
Calculated as moderate intensity equivalent minutes. bPresented as mean (standard deviation). cβ (SE) and p-value represent a comparison between work and non-workdays. dWork time is defined as the time spent during each day at work. eA workday is defined as the time across a whole day during which that participant went to work at some point.
Figure 1 depicts the participants’ PA profiles characterized by current CDC aerobic PA guidelines for MVPA (Physical Activity Guidelines Advisory Committee, 2018; US Department of Health 2008) across all days and during work time, on workdays, and non-workdays. Across all days, 89.5% (n = 17/19) participants met CDC PA guidelines. On workdays, all participants met the CDC PA guidelines with 57.9% (n = 11) meeting guidelines even when considering work time only.
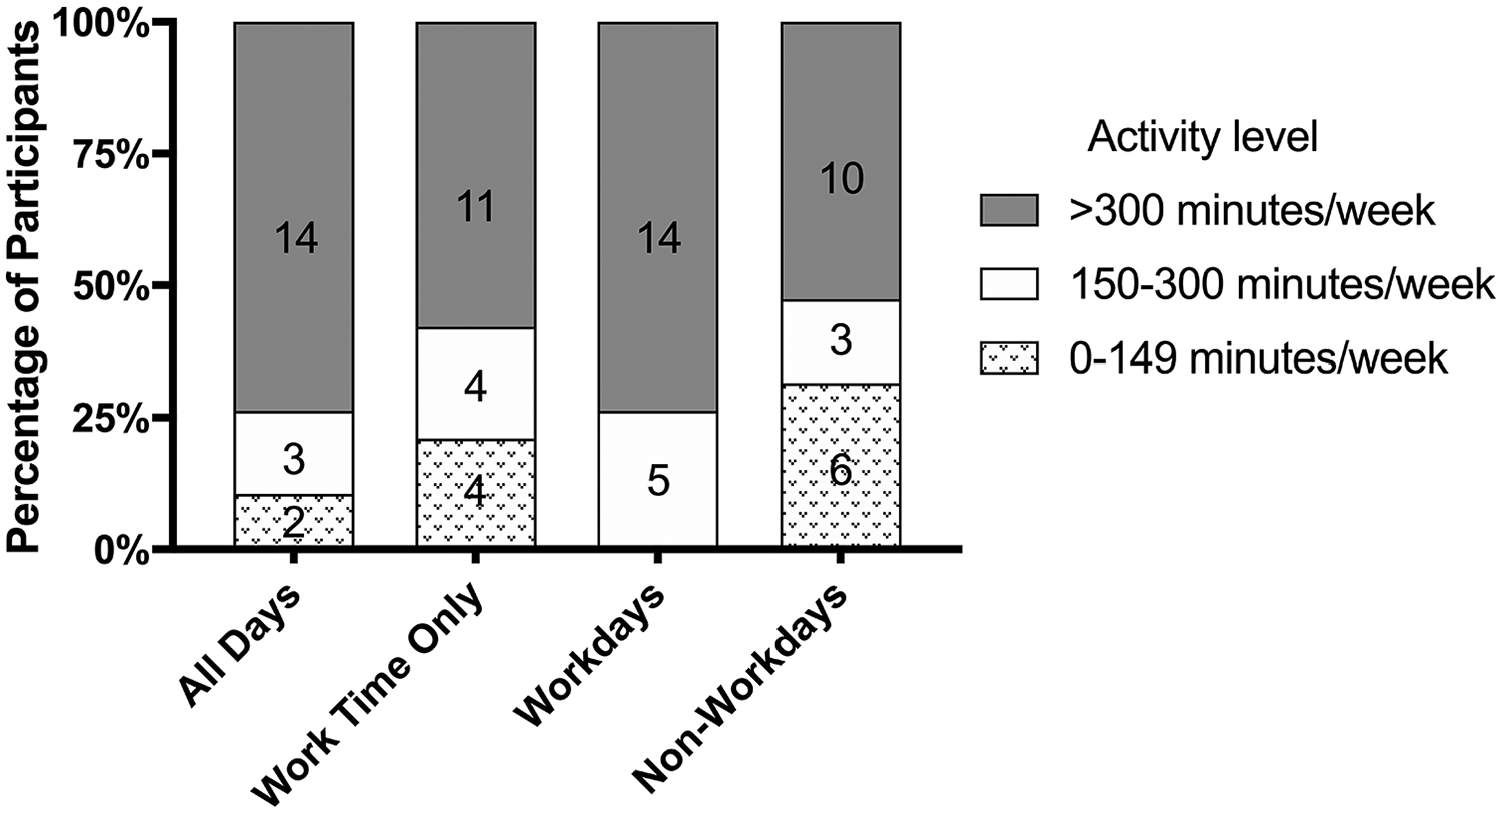
Comparison of worker activity to recommended aerobic physical activity levels.
On average, participants spent 39.59 (SD = 12.18) minutes/hour in upright time with 74% (n = 14) of participants exceeding the recommended level of upright time (Buckley et al., 2015) (Data not shown). Analysis of working time activity found that most (n = 18) exceeded the 30% HRR limit sometime during the workday (Jørgensen, 1985) (data not shown). On average, 30.3% (SD = 25.86) of working time was spent above this threshold, though this was highly variable across participants (ranging from 0 to 85.2%) and industries (data not shown).
Discussion
Overall, participants were significantly more active on workdays than non-workdays with less short- and long-bout SED accompanied by more time spent upright, more moderate PA, and more steps. No differences were observed in vigorous PA between workdays and non-workdays.
Current results estimated that 56% of waking time on all days was spent sedentary. This is slightly higher than the other studies estimating that men and women in similar occupations spent 44% to 54% (Steeves et al., 2018) or 44% to 52% (Quinn et al., 2020) of their day sedentary. However, waist-worn accelerometry was used in the other available research to quantify sedentary behavior, which is known to significantly misclassify sedentary time as compared with the activPAL® (Kim et al., 2015; Koster et al., 2016). Differences may also be explained by higher wear time in this study (15.9 hours), using a 24-hour wear protocol, compared with previous studies (14.6 hours [Steeves et al., 2018] and 14.95 hours [Quinn et al., 2020]), which would likely inflate sedentary time estimates. In addition, the current sample included only men in Pittsburgh, PA and is not necessarily generalizable to more diverse samples. In contrast, total SED in the current study was lower than previous reports in office workers (66%) (L. Smith et al., 2015) and in other less active occupations (60–66%) (Steeves et al., 2018).
Greater activity on workdays versus non-workdays was expected and aligns with previous NHANES and CARDIA research, suggesting that highly active jobs are associated with more overall activity (Quinn et al., 2020; Steeves et al., 2018). The activity profile of the current sample aligned generally with the industry-specific activity profiles previously reported in CARDIA, where workers in the same industries had high light PA and low total SED (Quinn et al., 2020).
Participants accumulated 137 fewer minutes of total SED/day on workdays versus non-workdays, most of which was long-bout SED (101 minutes). Previous research has observed that individuals with sedentary jobs have higher amounts of sitting during work time compared with non-work time (Pedersen et al., 2016). These results are concordant with ours if considered in a framework of compensatory behavior where high sitting during work means less sitting during non-work, and vice-versa. Our finding that non-workdays had more long-bout SED likely reflects higher engagement in SED leisure-time activities (Shibata et al., 2018).
The current study estimated that, across all days, participants spent 44% of their time upright and achieved 11,328 steps/day. This agrees with previous NHANES data showing individuals in similar occupations accumulate 9,960 to 11,602 steps/day (Steeves et al., 2018). Although some previous work used thigh-worn accelerometry to measure posture and sitting time (Gupta et al., 2015; Hallman et al., 2016), none report upright time in workers with active jobs, making comparison difficult. However, the percentage of upright time and step count is higher than previously reported in office workers (33% and 9,737 steps, respectively) as would be expected (L. Smith et al., 2015). The current study reports 137 more minutes of upright time and 4,848 more steps on workdays versus non-workdays. Interestingly, a previous study of office workers found no difference in upright time between weekend days (assumed to be non-workdays) and weekdays (assumed to be workdays), but 164 more steps/day on weekdays (L. Smith et al., 2015). The previously reported difference in steps is significantly less than what we found, suggesting a greater influence of work domain on activity in highly active occupations.
Achievement of Aerobic Physical Activity Guidelines
Most participants (89%) met aerobic PA guidelines across all monitoring days. In comparison, approximately 50.7% of the U.S. population meets the guidelines when measured by self-report (Katzmarzyk et al., 2017) and 45% when measured with accelerometry (Zenko et al., 2019). All 19 participants achieved aerobic PA guidelines on workdays and 68% of participants met guidelines on non-workdays. Given the known health benefits of regular PA, it is vital to note this high achievement of aerobic PA guidelines, even on non-workdays. Still, as mentioned previously, this finding has unclear interpretation regarding health benefits as high amounts of OPA has been paradoxically associated with higher risks for cardiovascular and all-cause mortality (Coenen et al., 2018).
Activity Profiles During Work Time
The few previous studies describing OPA profiles have been limited by relying on whole-day activity measurement causing difficulty in determining in which domain (work or non-work) the measured activity was achieved and, therefore, difficult to quantify OPA exposure (Quinn et al., 2020; Steeves et al., 2018). Addressing this limitation, we identified domain-specific activity using a time-use diary in addition to objective monitoring. Interestingly, 79% of participants accumulated enough daily activity to meet aerobic PA guidelines during work time only. In fact, the average MVPA was 57.0 minutes/workday suggesting that individuals with high OPA may not need to perform additional LTPA to achieve recommended aerobic PA levels.
Work time was split between SED (34%) and upright (66%) time, with almost half of the upright time being spent in long-bouts (29% of work time). Comparing the upright time in this study to the current expert recommendations for occupational sedentary behavior (Buckley et al., 2015), 14 participants (74%) exceeded the maximum recommendation (30 minute/hour) with upright minute/hour ranging from 20.7 to 59.8 minutes. The wide range may be due to the variety of occupational tasks required; however, no clear pattern was observed across industries. Although adverse health effects of excessive workday sedentary time have recently become more established (Buckley et al., 2015), the inverse behavior (excessive occupational standing) has also been associated with increased risk for incident heart disease (P. Smith et al., 2018). It is clear that participants in the current study accumulated large amounts of overall and prolonged upright time throughout the workday, most of which was light activity (83% of upright time) rather than simply standing. While accumulating evidence supports replacing sitting with standing or light PA for health in predominantly desk-based workers (Buckley et al., 2015; Crespo et al., 2016; Mullane et al., 2017), the health implications and optimal pattern of standing and light PA in highly active workers should be explored further.
Work-Time Activity Intensity
Current recommendations endorse that individuals maintain a relative intensity of ≤30% HRR throughout an 8-hour workday to limit cardiovascular strain (Jørgensen, 1985). In the current sample, 18 participants (95%) spent some time above that threshold on an average workday. The wide range (0–85%) may be due to the variety of occupational tasks required (although no clear pattern was observed across industries) or due to variety of fitness levels as previously proposed (Holtermann et al., 2018). Those with lower fitness would exceed 30% HRR at a lower absolute workload thus being more susceptible to this exposure, with the opposite true for high fitness. However, our data did not support this hypothesis, as the correlation between time spent >30% HRR and estimated fitness was weak (r = .07). Nevertheless, some participants spent most of their day above 30% HRR, potentially causing increased cardiovascular load and strain over time (Holtermann et al., 2018).
A significant strength of the study was objective measurement of PA using validated devices and a time-use diary to determine the activity domain (Matthews et al., 2012; Quinn et al., 2020; Steeves et al., 2018). Although these methods provide a significant advancement over traditional self-reported methods, the assessment of activity was limited by only measuring ambulatory movement rather than lifting, carrying, or other non-ambulatory activities, which could be a substantial part of OPA. Future research should attempt to quantify this aspect of OPA and whether it contributes to the achievement of muscular strengthening guidelines and related health outcomes. This study was further strengthened by HR measurement to compare activity intensity to OPA intensity recommendations. This study was limited by the small, non-diverse sample limiting the generalizability of the findings. The high-quality methods that we employed should be applied to larger more diverse samples in the future.
The current sample of men with active occupations had high activity levels, consistent with meeting aerobic PA guidelines, especially during workdays where participants had higher upright time, steps, and moderate PA and lower SED than on non-workdays. Most work time was spent upright, which resulted in most individuals exceeding previously recommended light PA and OPA intensity guidelines on workdays. However, caution should be taken when interpreting these recommendations as they were established many years ago or for different purposes. Future research should investigate the long-term health implications of exceeding these recommended limits to inform recommendations and policies leading to optimal cardiovascular health in occupations with high amounts of OPA.
Implications for Occupational Health Practice
Men with highly active occupations achieve high levels of activity overall and especially on workdays that not only meet LTPA recommendations but also may exceed recommended OPA limits. This is of importance because while extensive research has shown LTPA to have positive cardiovascular health effects, high amounts of OPA may have opposing health effects. Following future confirmation, this research could inform OPA guidelines and policies that consider the optimal activity amount and pattern that optimizes for the cardiovascular health of workers.
Applying Research to Occupational Health Practice
Using objective physical activity measurement, men with highly active occupations seem to be highly active overall but especially on workdays compared with non-workdays. These high activity levels resulted in participants meeting basic or high aerobic physical activity recommendations at a higher rate than average U.S. adults. However, working time activity levels also exceeded currently recommended OPA levels regarding upright time and activity intensity. This pattern may be of concern given the recent literature showing opposing cardiovascular health effects of the different activity domains. Future research should investigate the long-term health implications of exceeding recommended activity limits during working time. Such research could inform recommendations and policies that lead to optimal cardiovascular health in occupations with high levels of OPA.
Footnotes
Acknowledgements
The authors thank all of the participants who volunteered their valuable time to participate in this study and for all of the hard work they do each day.
Conflict of Interest
The author(s) declared the following potential conflicts of interest with respect to the research, authorship, and/or publication of this article: Dr. Barone Gibbs discloses grant funding from the Agency for Healthcare Quality Research, the American Heart Association, the National Institutes of Health, and the Tomayko Fund.
Disclaimer
The findings and conclusions in this report are those of the author(s) and do not necessarily represent the official position of the National Institute for Occupational Safety and Health, Centers for Disease Control and Prevention. Copyright This work was authored as part of the Contributor’s official duties as an Employee of the U.S. Government and is, therefore, a work of the U.S. Government. In accordance with 17 USC. 105, no copyright protection is available for such works under U.S. Law.
Funding
The author(s) disclosed receipt of the following financial support for the research, authorship, and/or publication of this article: This study was supported by internal grant funding from the University of Pittsburgh School of Education.
Author Biographies
Tyler D. Quinn, PhD is a researcher at the National Institute for Occupational Safety and Health. He has expertise in occupational physical activity, exercise physiology, and occupational health.
Christopher E. Kline, PhD, is an Associate Professor in the Department of Health and Human Development at the University of Pittsburgh. His expertise is focused on the interrelationships between physical activity and sleep and their independent and combined influence on cardiometabolic health.
Elizabeth F. Nagle, PhD is an associate professor in Health and Human Development at the University of Pittsburgh. She has expertise in aquatic exercise, exercise physiology, cardiovascular physiology, and physical activity.
Lewis J Radonovich, MD is the Deputy Director of the Respiratory Health Division at the National Institute for Occupational Safety and Health. He is a physician and clinical scientist with expertise in occupational health and workplace safety.
Bethany Barone Gibbs, PhD, is an Associate Professor in Health and Human Development at the University of Pittsburgh. She is a physical activity and cardiovascular disease epidemiologist with expertise in objective activity monitoring of 24-hr behavioral patterns, cardiovascular risk measurement, and all-day activity behavioral interventions.