
Abstract
Background:
Workplace wellness programs (WWPs) are increasingly promoted by businesses and governments as an important strategy to improve workers’ overall health and well-being and to reduce health care and other organizational costs. Few studies have evaluated WWPs in small businesses to provide evidence on the potential return-on-investment (ROI) that WWPs might yield. This study aimed to fill this gap by presenting a quasi-experimental, ROI analysis of a WWP in a small company.
Methods:
This observational quasi-experimental study evaluated economic outcomes of a multicomponent WWP implemented by a small long-term care company. The company provided approximately 2 years of de-identified, individualized data on its employees for 2013–2015. There were 116 WWP participants and 323 nonparticipants. Difference-in-differences models were used to evaluate the program using organizational costs and ROI estimates.
Findings:
The estimated program cost was $132.692 (95% confidence interval [CI]: [$112.957, $156.101]) per participant and the estimated organizational costs savings were $210.342 (95% CI: [−4354.095, 2002.890]). The WWP achieved an ROI of $0.585 (95% CI: [−$35.095, $14.103]) per participant. Although not statistically significant, the results suggest that the WWP saved $1.585 for every $1 invested.
Conclusions/Application to Practice:
These results suggest that the evaluated WWP yielded a positive, although nonsignificant, ROI estimate. While ROI is still one of the most common evaluation metrics used in workplace wellness, few studies present ROI estimates of WWPs in small companies. Given policy efforts to promote WWPs in small businesses, there is a need to conduct high-quality ROI analyses for WWPs in smaller companies.
Background
Businesses implement workplace wellness programs (WWPs) with the expectation they will improve employees’ overall health and well-being, thereby reducing organizational costs related to health claims, turnover, and productivity losses (Baicker et al., 2010; Neira, 2013). These expectations are supported by an extensive body of empirical research that suggests WWPs improve employee health by reducing modifiable risks, such as obesity (Goetzel et al., 2012; Newman et al., 2015), tobacco use (Goetzel et al., 2014; Newman et al., 2015), physical inactivity (Goetzel et al., 2012, 2014), high stress (Goetzel et al., 2014; Newman et al., 2015), high blood pressure (Goetzel et al., 2012, 2014), and high blood glucose (Goetzel et al., 2014; Henke et al., 2011). Economic evaluations have further linked these health improvements to decreased organizational costs associated with health care utilization, employee performance, and employee turnover (Barbosa et al., 2015; Dement et al., 2015). Some studies have even suggested that companies investing in WWPs have better stock performance than companies that do not (Fabius et al., 2013; Goetzel et al., 2016). As a result, WWPs are gaining support among employers and public health professionals.
WWPs are promoted as an important public health strategy by governments and international health policy organizations such as the European Network for Workplace Health Promotion (De Greef & Van den Broek, 2004) and the World Health Organization (Jakarta Declaration, 1997). The U.S. federal government initiated the Prevention and Public Health Fund to encourage workplace wellness initiatives (Anderko et al., 2012) by giving grants to small businesses to provide comprehensive WWPs (Office of the Legislative Counsel, 2010). Given public policy efforts that encourage private investment in WWPs, it is critical to evaluate the extent to which WWPs produce desired outcomes.
Despite the popularity of WWPs and the financial support the ACA has provided for small businesses, there are significantly fewer evaluations of WWPs in small companies than in large companies (McCoy et al., 2014; Unsal, 2018). Furthermore, WWP ROI research is often criticized for methodological flaws such as measurement inconsistencies, improper statistical analysis, and a lack of statistical inference information on the ROI estimate (Lewis et al., 2014; Lewis & Khanna, 2013). Emphasizing the importance of these criticisms, recent systematic reviews found that studies with higher methodological rigor had lower ROI estimates (Baxter et al., 2014; Unsal, 2018).
The purpose of this study was to conduct an economic evaluation of a WWP implemented by a small nonprofit company, the Well-Spring Retirement Community, in Greensboro, North Carolina. As a continuing care retirement community, Well-Spring meets the U.S. Small Business Administration’s (SBA, 2008) definition of a small business in Title 13, Code of Federal Regulation, part 121. Our evaluation was one of the first evaluations of a WWP in a small, nonprofit company. This study also aimed to provide more rigorous ROI evidence than previous nonrandomized studies by using strong, quasi-experimental methods as outlined below.
Methods
The Well-Spring Retirement Community aims to provide high and consistent quality services to its independent-living and long-term care residents (Well-Spring: A Life Plan Community, 2020). Well-Spring strives to maintain a safe and positive work environment for its employees across departments such as health care, dining services, activities and administration, facilities and grounds maintenance, and security. To help accomplish its goals, Well-Spring launched a series of annual WWPs to inform employees about healthy lifestyles and motivate them to engage in healthier behaviors.
This quasi-experimental study evaluated the economic impact of Well-Spring’s “Just10” program which was conducted for 6 weeks from February 3, 2014, through March 17, 2014. The Just10 program was structured as a series of three challenges: (a) losing 10 pounds, (2) exercising 10 minutes every day, and (3) walking or running 10 miles every week. Participation in each of the three challenges was voluntary. Participants could choose to participate in one, two, or all three of these challenges. If participants completed one or two challenges, they received a $100 cash incentive. Participants who completed all three challenges received a $300 cash incentive. There were 40 participants who received $100 and 34 participants who received $300.
To evaluate the Just10 program, Well-Spring provided approximately 2 years (January 2013 through February 2015) of de-identified, individual-level data on 116 program participants and 323 nonparticipants to a team of external researchers from the University of North Carolina at Greensboro (UNCG). The research team was contacted by Well-Spring after the completion of Just10 and was not involved in the design or implementation of Just10.
Because this was an evaluation of a previously implemented program, we developed a logic model to guide our selection of measures and subsequent analyses. The aim was to identify components of the program and analyze how these components were associated. The logic model presented in Figure 1 illustrates the hypothesized causal relationship between Just10 program participation and associated outcomes. In this evaluation, the logic model serves as ex-post documentation of the program as implemented rather than as an a priori conceptual model to guide program implementation. It therefore serves to highlight possible “weak links” in the assumed causal chain, such as the short duration of the program or the connection between the targeted health behaviors and the organizational outcomes. This evaluation was reviewed and approved by the Institutional Review Board (IRB) of University of North Carolina at Greensboro.
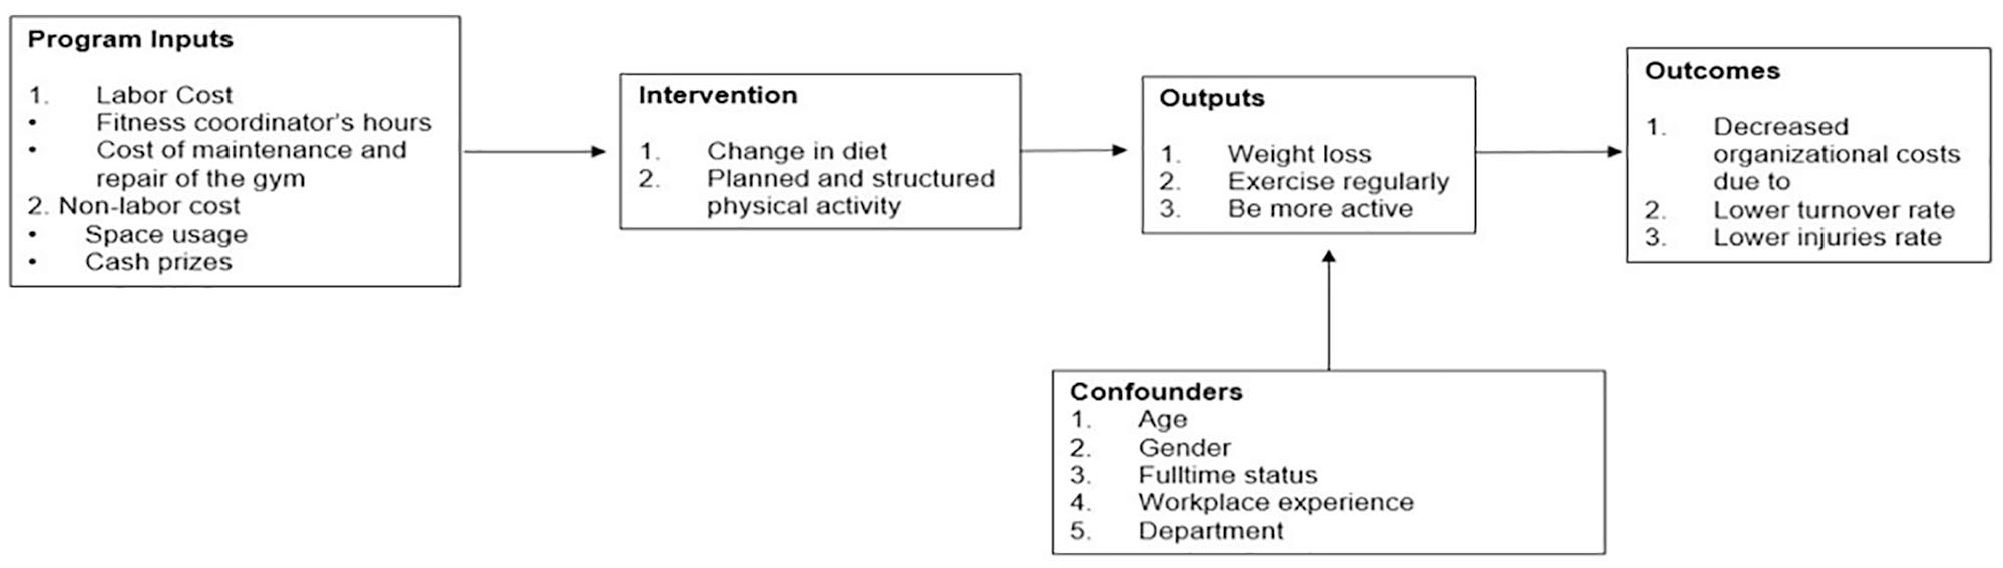
Logic model for the Just10 program.
Study Sample
All Well-Spring employees were eligible to participate but participation and completion were voluntary. The Well-Spring Aquatic and Fitness Center Coordinator prepared flyers about the Just10 wellness program and distributed them to all employees. Employees who chose to participate in the challenge to lose 10 pounds were weighed by the coordinator before and after the Just10 intervention. Employees who chose to participate in any one of the other two activity challenges were asked to complete activity logs that recorded the distance or the time of exercise to calculate how far they had walked or run and how long they had exercised.
As indicated, Well-Spring provided data on all employees for approximately 2 years (January 2013 through February 2015), which included employee data during periods we defined as pre-program, intervention, and post-program. We followed individuals who were employed during the intervention period for pre- and post-program periods. The intervention period range was February 2, 2014, to March 17, 2014, and included 439 employees, 116 of whom opted to participate in the Just10 program, representing our intervention group and 323 nonparticipants, representing our comparison group. The pre-program sample included 419 employees from January 1, 2013, through February 2, 2014. Twenty individuals from nonparticipant group were employed after the pre-program period. The post-program period included intervention and comparison group employees from February 3, 2014, through February 2, 2015, time during which Just10 was ongoing in addition to the months following the end of Just10.
Measures
The data set provided by Well-Spring included dates of hire and termination, hourly wages, hours of work per day for all workers. For those who had been injured, we had dates of injury, injury-related modified duty days (present at work but cannot perform normal job requirements), and injury-related lost workdays (not present at work). The data set also included employee-level data such as gender, birth year, full-time status, department (health care and independent living), and program participation which we included as covariates in our analyses.
The primary outcome of interest in our economic evaluation is ROI. ROI is measured as the ratio of net benefit (the difference between benefit and cost) to cost (Phillips & Phillips, 2007). The benefit component is savings from total organizational costs and the cost component is Just10 program costs, both described below.
Total organizational costs were measured as the sum of turnover and injury costs. Thus, turnover, injury, and total organizational costs were examined as outcome measures in our analysis. These outcomes were identified by Well-Spring as organizational priorities that upper management hoped would be impacted by their wellness efforts. We estimated total organizational costs for both pre-program and post-program periods. Total organizational costs took positive values for every employee who was injured or terminated. All monetary values were adjusted to 2015 US dollars using the Consumer Price Index from the Bureau of Labor Statistics.
We calculated costs of workplace injuries by multiplying lost labor days, hours of work per day, and hourly wage. Lost labor days were the sum of modified duty days and lost work days that occurred due to injuries. Organizational turnover was measured using a dichotomous variable indicating employees who were terminated or left the organization within the study time period. Cost of turnover included fees for drug screens, background checks, registry checks, time paid for orientation, training, initial shadowing days on units, advertising, and lag time while positions are open. Terminated employees were assigned a turnover cost calculated from the midpoint of the following cost ranges based on their position: wait staff cost ranges from $0 to $500, in line staff cost ranges from $2,000 to $4,000, staff in professional or skilled positions cost ranges from $3,000 to $8,000, and some department managers cost ranges from $7,000 to $50,000. Wait staff could include voluntary interns which resulted in zero turnover cost to Well-Spring when they completed their internship and left.
The cost component in our ROI measure is Just10 program costs, which reflect the monetary value of the Just10 program inputs shown in Figure 1. Total program costs included labor and nonlabor costs that were required to implement and operate the program, which were measured from Well-Spring’s perspective and calculated using economic costing.
The labor costs included the fitness center coordinator’s time spent on program preparation, execution, and recording participants’ progress, and the maintenance and repair cost of the gym at the work site. The fitness coordinator spent 4 hours per week (16 hours per month on average) working for the program. The hourly wage of the fitness coordinator was $17.52. Cost of the gym maintenance and repair was $11.42 per user per month. The total number of users was 123 including 102 residents and 21 employees. The total labor cost for the entire 1½ months of the program was $780.21.
The nonlabor cost included cash incentives provided to motivate individuals to participate, and the space used for employee trainings. The opportunity cost of using the space for trainings rather than renting it out is the fixed rental fee for a half-day, which was $395. Prizes were provided based on the number of completed challenges. There were 40 participants who received $100 each and 34 participants who received $300 each. Total nonlabor cost of the program was $14,612.
We included demographic variables as covariates because of the effects they could have on our outcomes of interest. Older females may have difficulty losing weight for natural reasons such as hormones and metabolism (Sattler et al., 2018). Moreover, the older the person’s age, the lower his or her muscle mass, which might have been an obstacle to losing weight or exercising more (Siparsky et al., 2014). Full-time status and years of experience were also expected to impact employee engagement in the program. Full-time employees have greater risk for an on-the-job injury because they work more hours than part-time employees. More-experienced employees may have greater attachment to the workplace, confounding the effect of the WWP on employee retention. The employee’s department may be related to the intensity of the employee’s job and therefore risk of injury. For example, the health care department employees are subjected to physically heavier workloads compared with those in the independent living department.
Data Analysis
This quasi-experimental study uses observational data and a difference-in-difference (DID) regression to evaluate the differential average effect for an “intervention group” versus a “comparison group” in a natural experiment across time. The analysis serves to minimize the effects of individual differences between groups (Athey & Imbens, 2006; Puhani, 2012). Prior to calculating ROI, we estimated the effects of the Just10 program on turnover, injury, and organizational costs. In an effort to address selection bias as well as individual- and time-specific effects, all of our analyses included an interaction term of post-program period and Just10 program participation indicators as well as confounders of age, female, full-time status, department, and experience at Well-Spring.
Turnover and injury were modeled using logit models with results reported as odds ratios. Organizational cost was modeled using a two-part model which estimated the probability of zero costs using the logit and estimated costs conditional on costs being greater than zero using a generalized linear model (GLM) with a log link and gamma distribution. This method requires retransformation of log organizational costs into organizational costs to accommodate the positive skew in organizational costs (Buntin & Zaslavsky, 2004). Thus, we used marginal effects when we interpreted the significance and the magnitudes of effects. All models are estimated with cluster-robust standard errors to accommodate the longitudinal nature of our data.
Using results from the two-part model of organizational costs and the cost of program inputs, the ROI of Just10 was calculated. Average program costs per participant were estimated using ordinary least squares (OLS) regression to facilitate the calculation of a confidence interval for the ROI estimate. We used a nonparametric bootstrapping method to calculate confidence intervals around our ROI estimate, which is especially advantageous with our small sample size (Cameron & Trivedi, 2005). Bootstrapping uses an iterative process of estimations from current data to build a larger hypothetical data set that allows for estimating confidence intervals and other measures of statistical precision.
Results
Table 1 includes characteristics of participants and nonparticipants. Compared with nonparticipants, participants were more likely to be female and more likely to be full-time in both pre- and post-program periods. On average, participants were 7 years older than nonparticipants in both the pre- and post-program periods. Program participants had been employed at Well-Spring an average of 2.5 years longer than nonparticipants. All of these group differences were significant in both pre- and post-program periods. Participants were not significantly different based on work department. Around two-thirds of all employees were in the health care department, and one-third were in the independent living department.
Worker Demographics and Study Outcomes by Period of Just10 Program (N = 858)
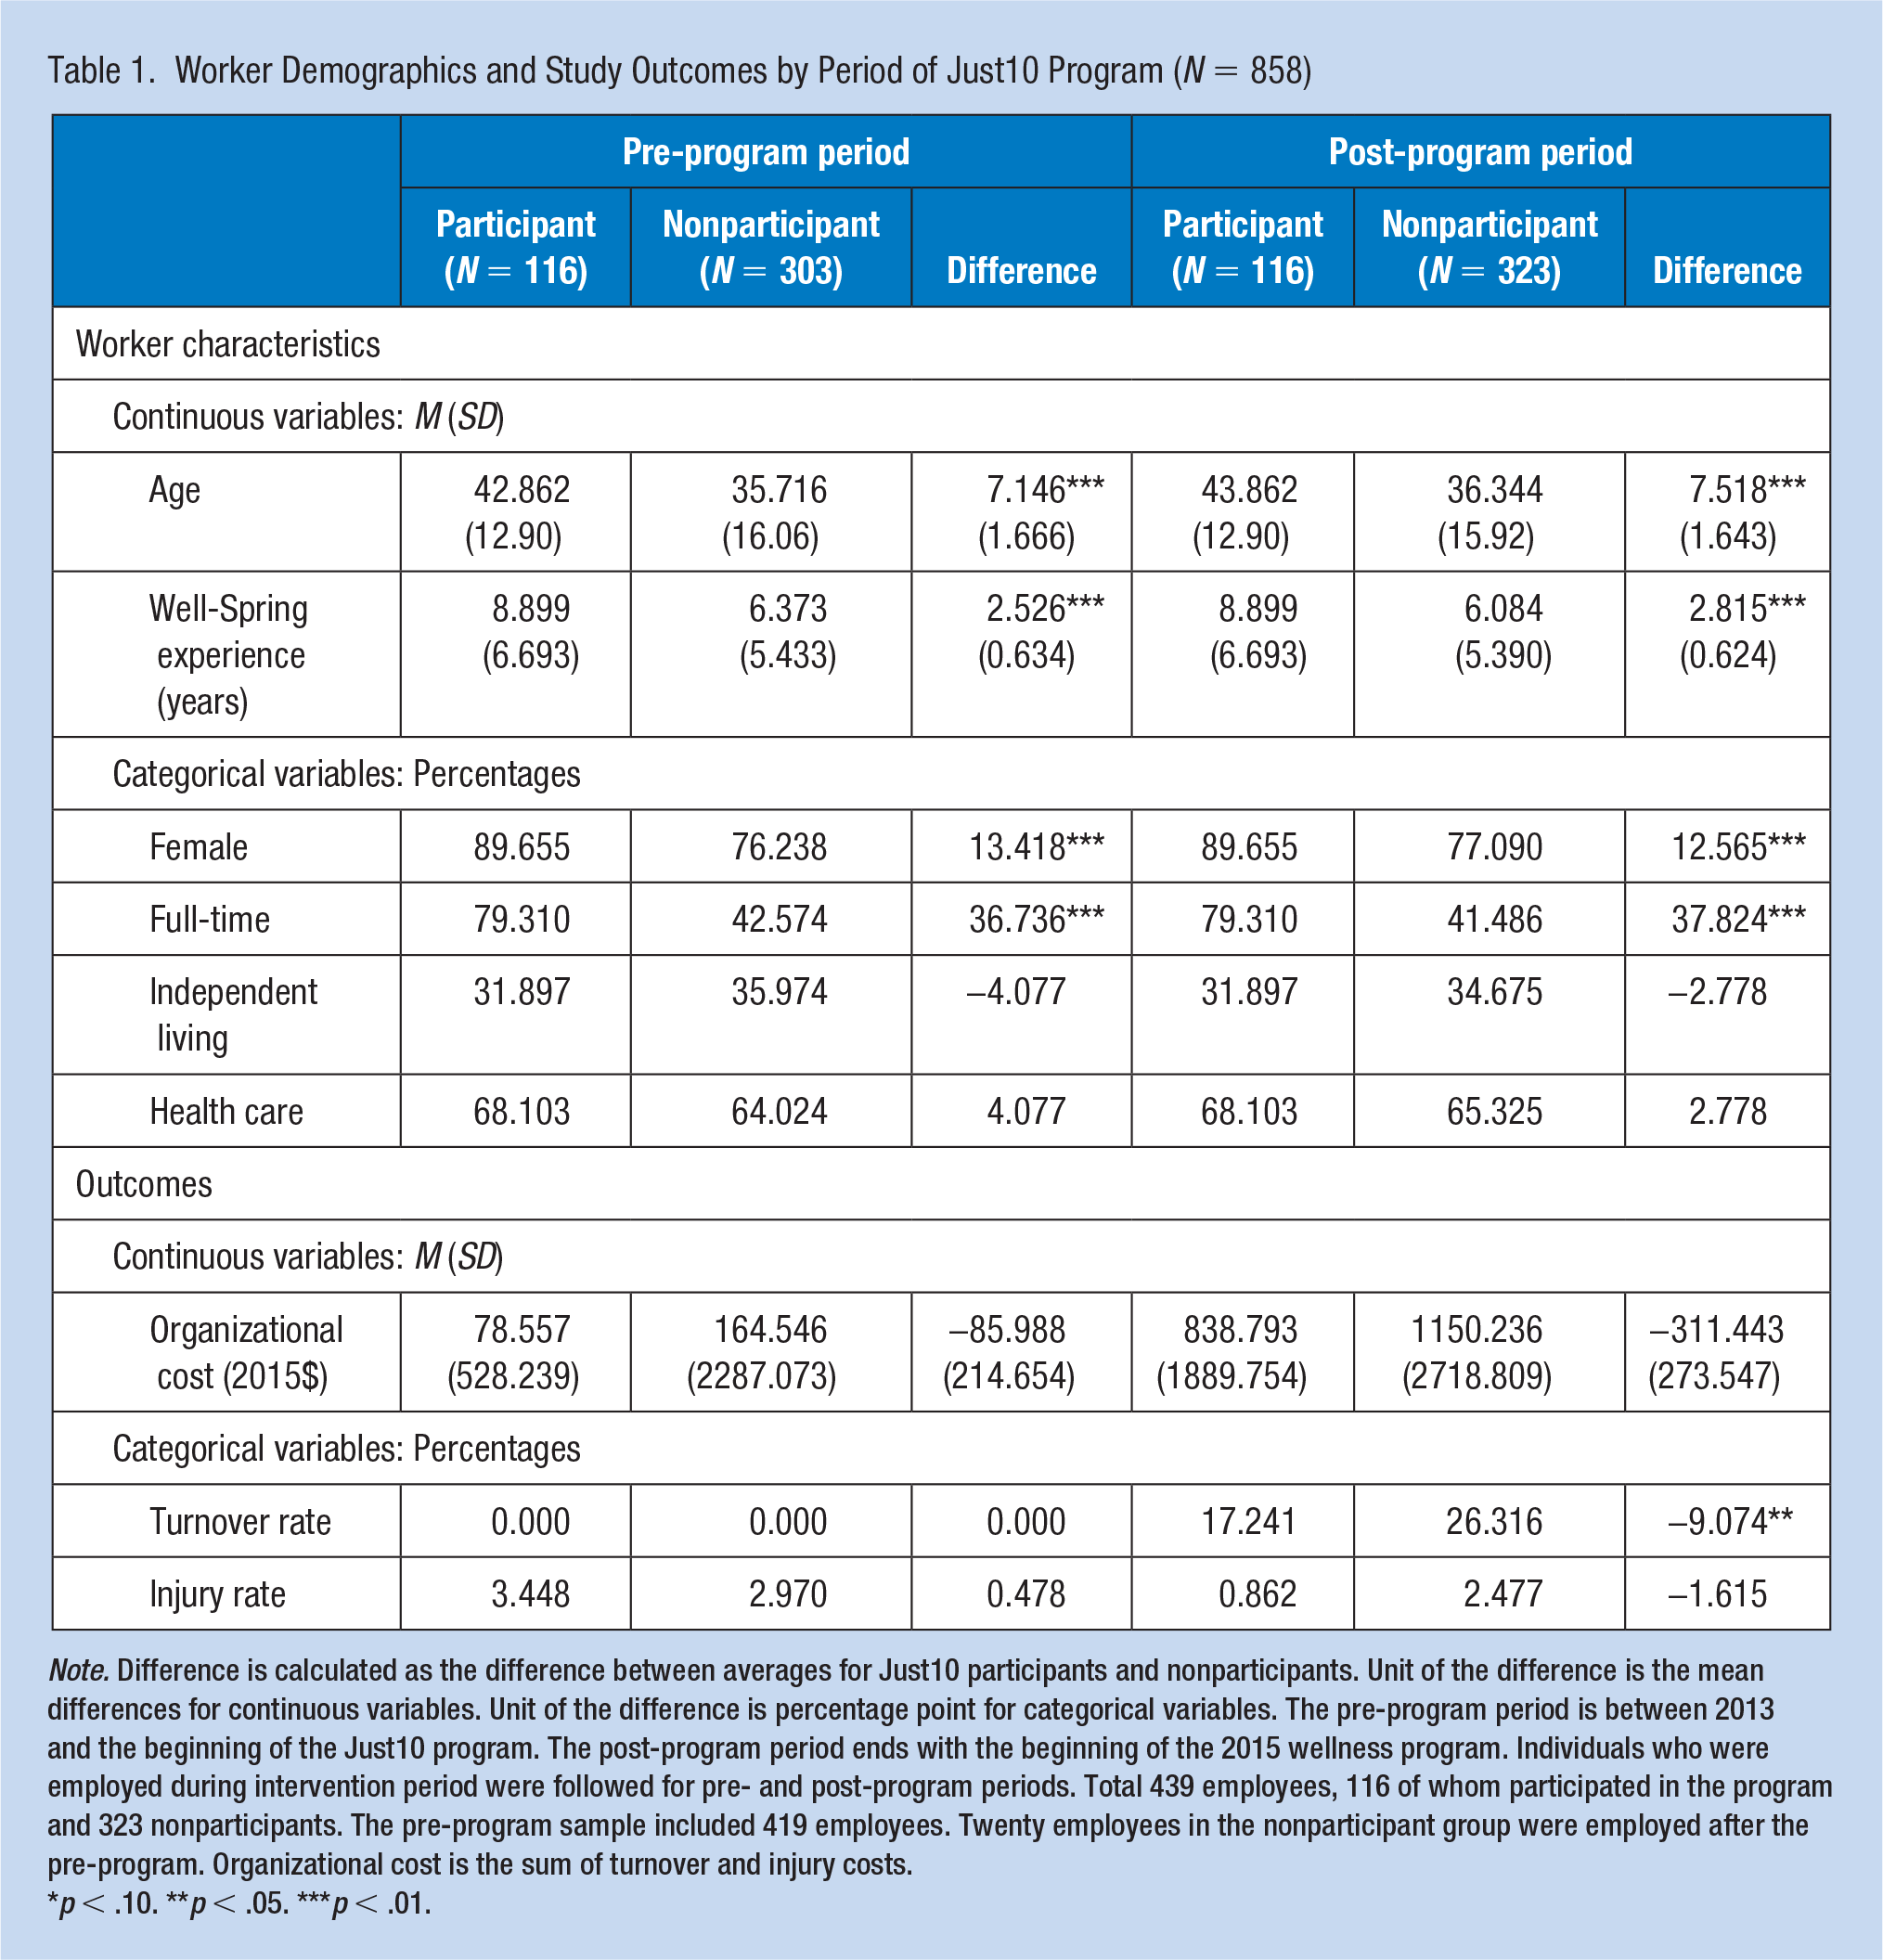
Note. Difference is calculated as the difference between averages for Just10 participants and nonparticipants. Unit of the difference is the mean differences for continuous variables. Unit of the difference is percentage point for categorical variables. The pre-program period is between 2013 and the beginning of the Just10 program. The post-program period ends with the beginning of the 2015 wellness program. Individuals who were employed during intervention period were followed for pre- and post-program periods. Total 439 employees, 116 of whom participated in the program and 323 nonparticipants. The pre-program sample included 419 employees. Twenty employees in the nonparticipant group were employed after the pre-program. Organizational cost is the sum of turnover and injury costs.
p < .10. **p < .05. ***p < .01.
The turnover rate was zero in the pre-program period due to how the study sample was defined. In the follow-up period, turnover was 9 percentage points lower for participants compared with nonparticipants. The injury rate was around 0.5 percentage points higher for participants in the pre-program period and 1.6 percentage points lower for participants in the post-program period. Organizational costs were $85.988 lower for participants in the pre-program period and $311.443 lower for participants in the post-program period. Across these three outcomes of interest, there was only one significant group difference between participants and nonparticipants, which was the 9-percentage point difference in turnover during the post-program period.
Turnover and Injury
Table 2 shows results for turnover and injury. The interaction term shows the interaction between Just10 participation and post-program period which indicates the post-program outcomes for participants compared with nonparticipants. After controlling for employee-level confounders, the Just10 program had no significant effect on turnover in the post-program period. Employees with full-time status at Well-Spring had a lower likelihood of turnover compared with part-time employees (odds ratio [OR] = 0.374; 95% CI: [0.199, 0.701]). Employees in the health care department had significantly less likelihood of turnover (OR = 0.604; 95% CI: [0.360, 1.015]), compared with those working in the independent living department. Employees with more experience at Well-Spring also had less likelihood of turnover (OR = 0.624; 95% CI: [0.471, 0.825]), compared with employees with less than 1 year of experience at Well-Spring.
Estimated Effect of the Just10 Intervention on Employee Turnover and Injuries
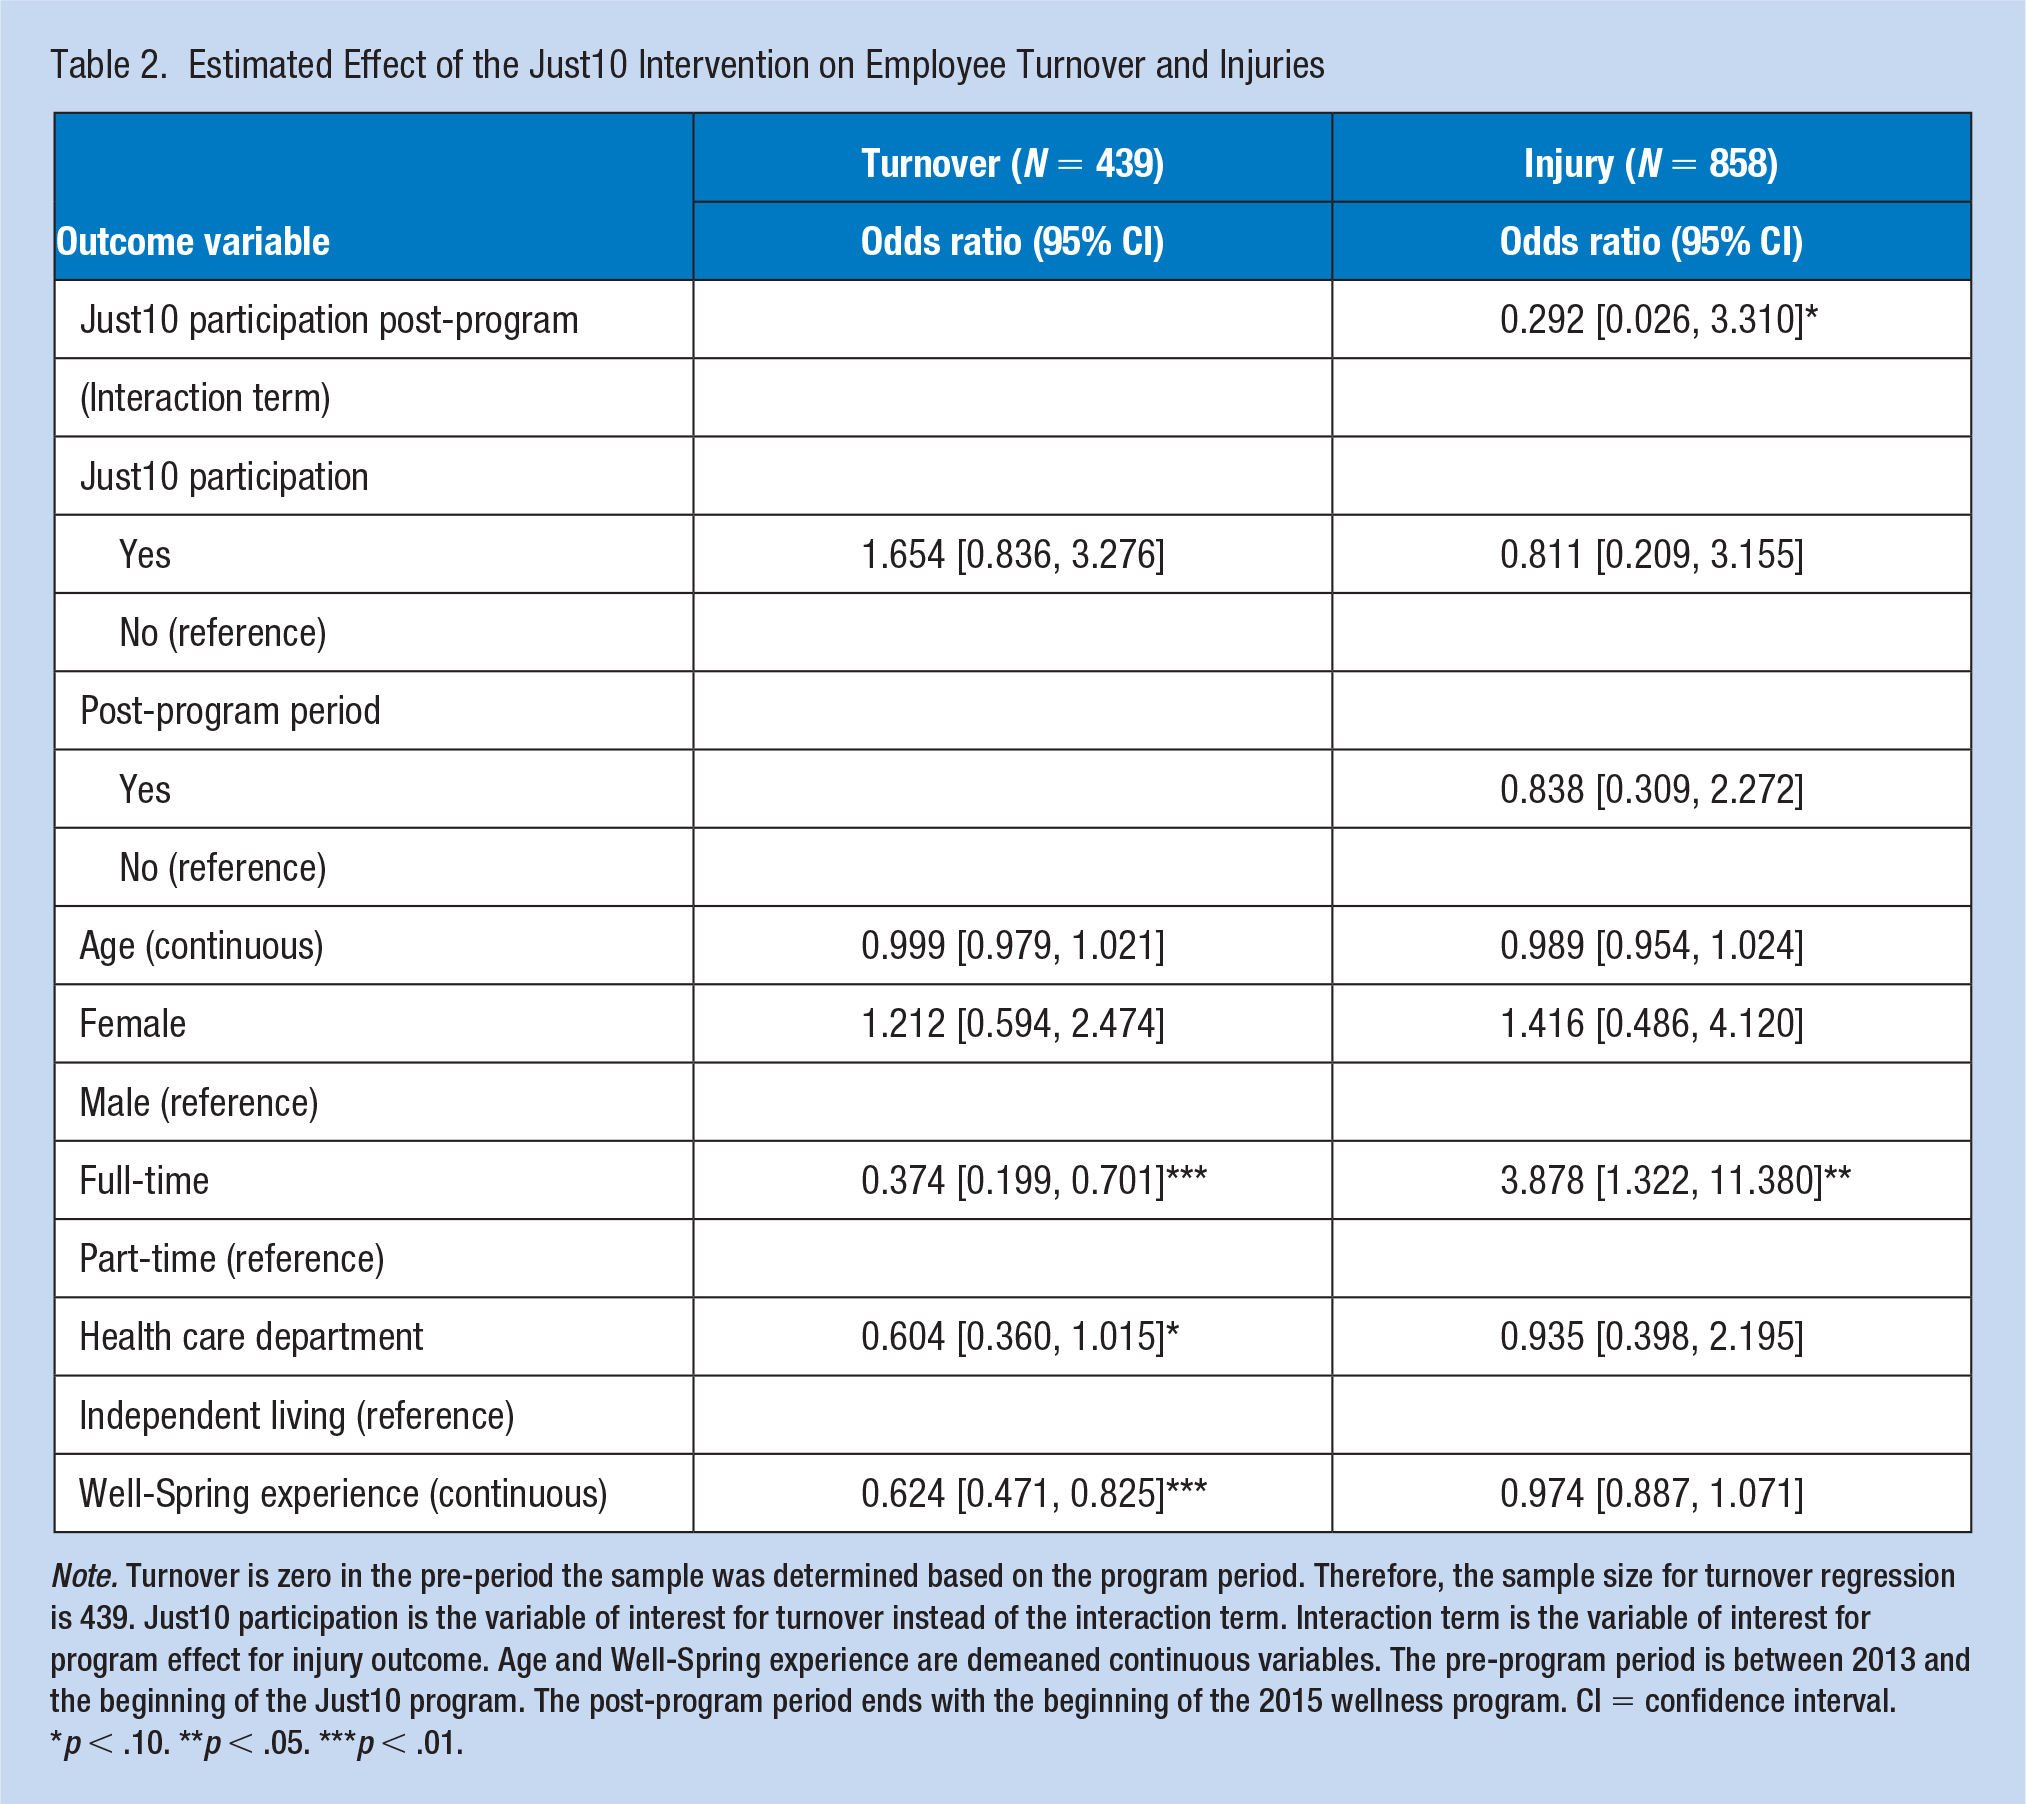
Note. Turnover is zero in the pre-period the sample was determined based on the program period. Therefore, the sample size for turnover regression is 439. Just10 participation is the variable of interest for turnover instead of the interaction term. Interaction term is the variable of interest for program effect for injury outcome. Age and Well-Spring experience are demeaned continuous variables. The pre-program period is between 2013 and the beginning of the Just10 program. The post-program period ends with the beginning of the 2015 wellness program. CI = confidence interval.
p < .10. **p < .05. ***p < .01.
Just10 participation had a decreased odds of injury in the post-program period relative to the comparison group (OR = 0.292; 95% CI: [0.026, 3.310]). Because injury was a rare event, the standard errors were quite high and the effect of the interaction term was not statistically significant. These injury cost estimates may suffer from small sample bias (King & Zeng, 2001). However, the likelihood of experiencing injury was significantly higher for full-time employees compared with part-time employees (OR = 3.878; 95% CI: [1.322, 11.380]).
Organizational Costs
Table 3 shows results for organizational costs. Just10 participation decreased organizational costs in the post-program period relative to the comparison sample after controlling for observed confounders. The estimated organizational cost savings per employee is $210.342 with a confidence interval of −4354.095 to 2002.890. Ultimately, the effects of the Just10 program on organizational costs were not statistically significant. However, there were significant effects of our confounding variables on organizational costs. Organizational costs per employee were higher for older employees and higher for employees in the health care department. Organizational costs were lower for female employees and those with more years of experience at Well-Spring.
Effect of Just10 on Organizational Cost and Return on Investment (ROI) From Just10 Intervention
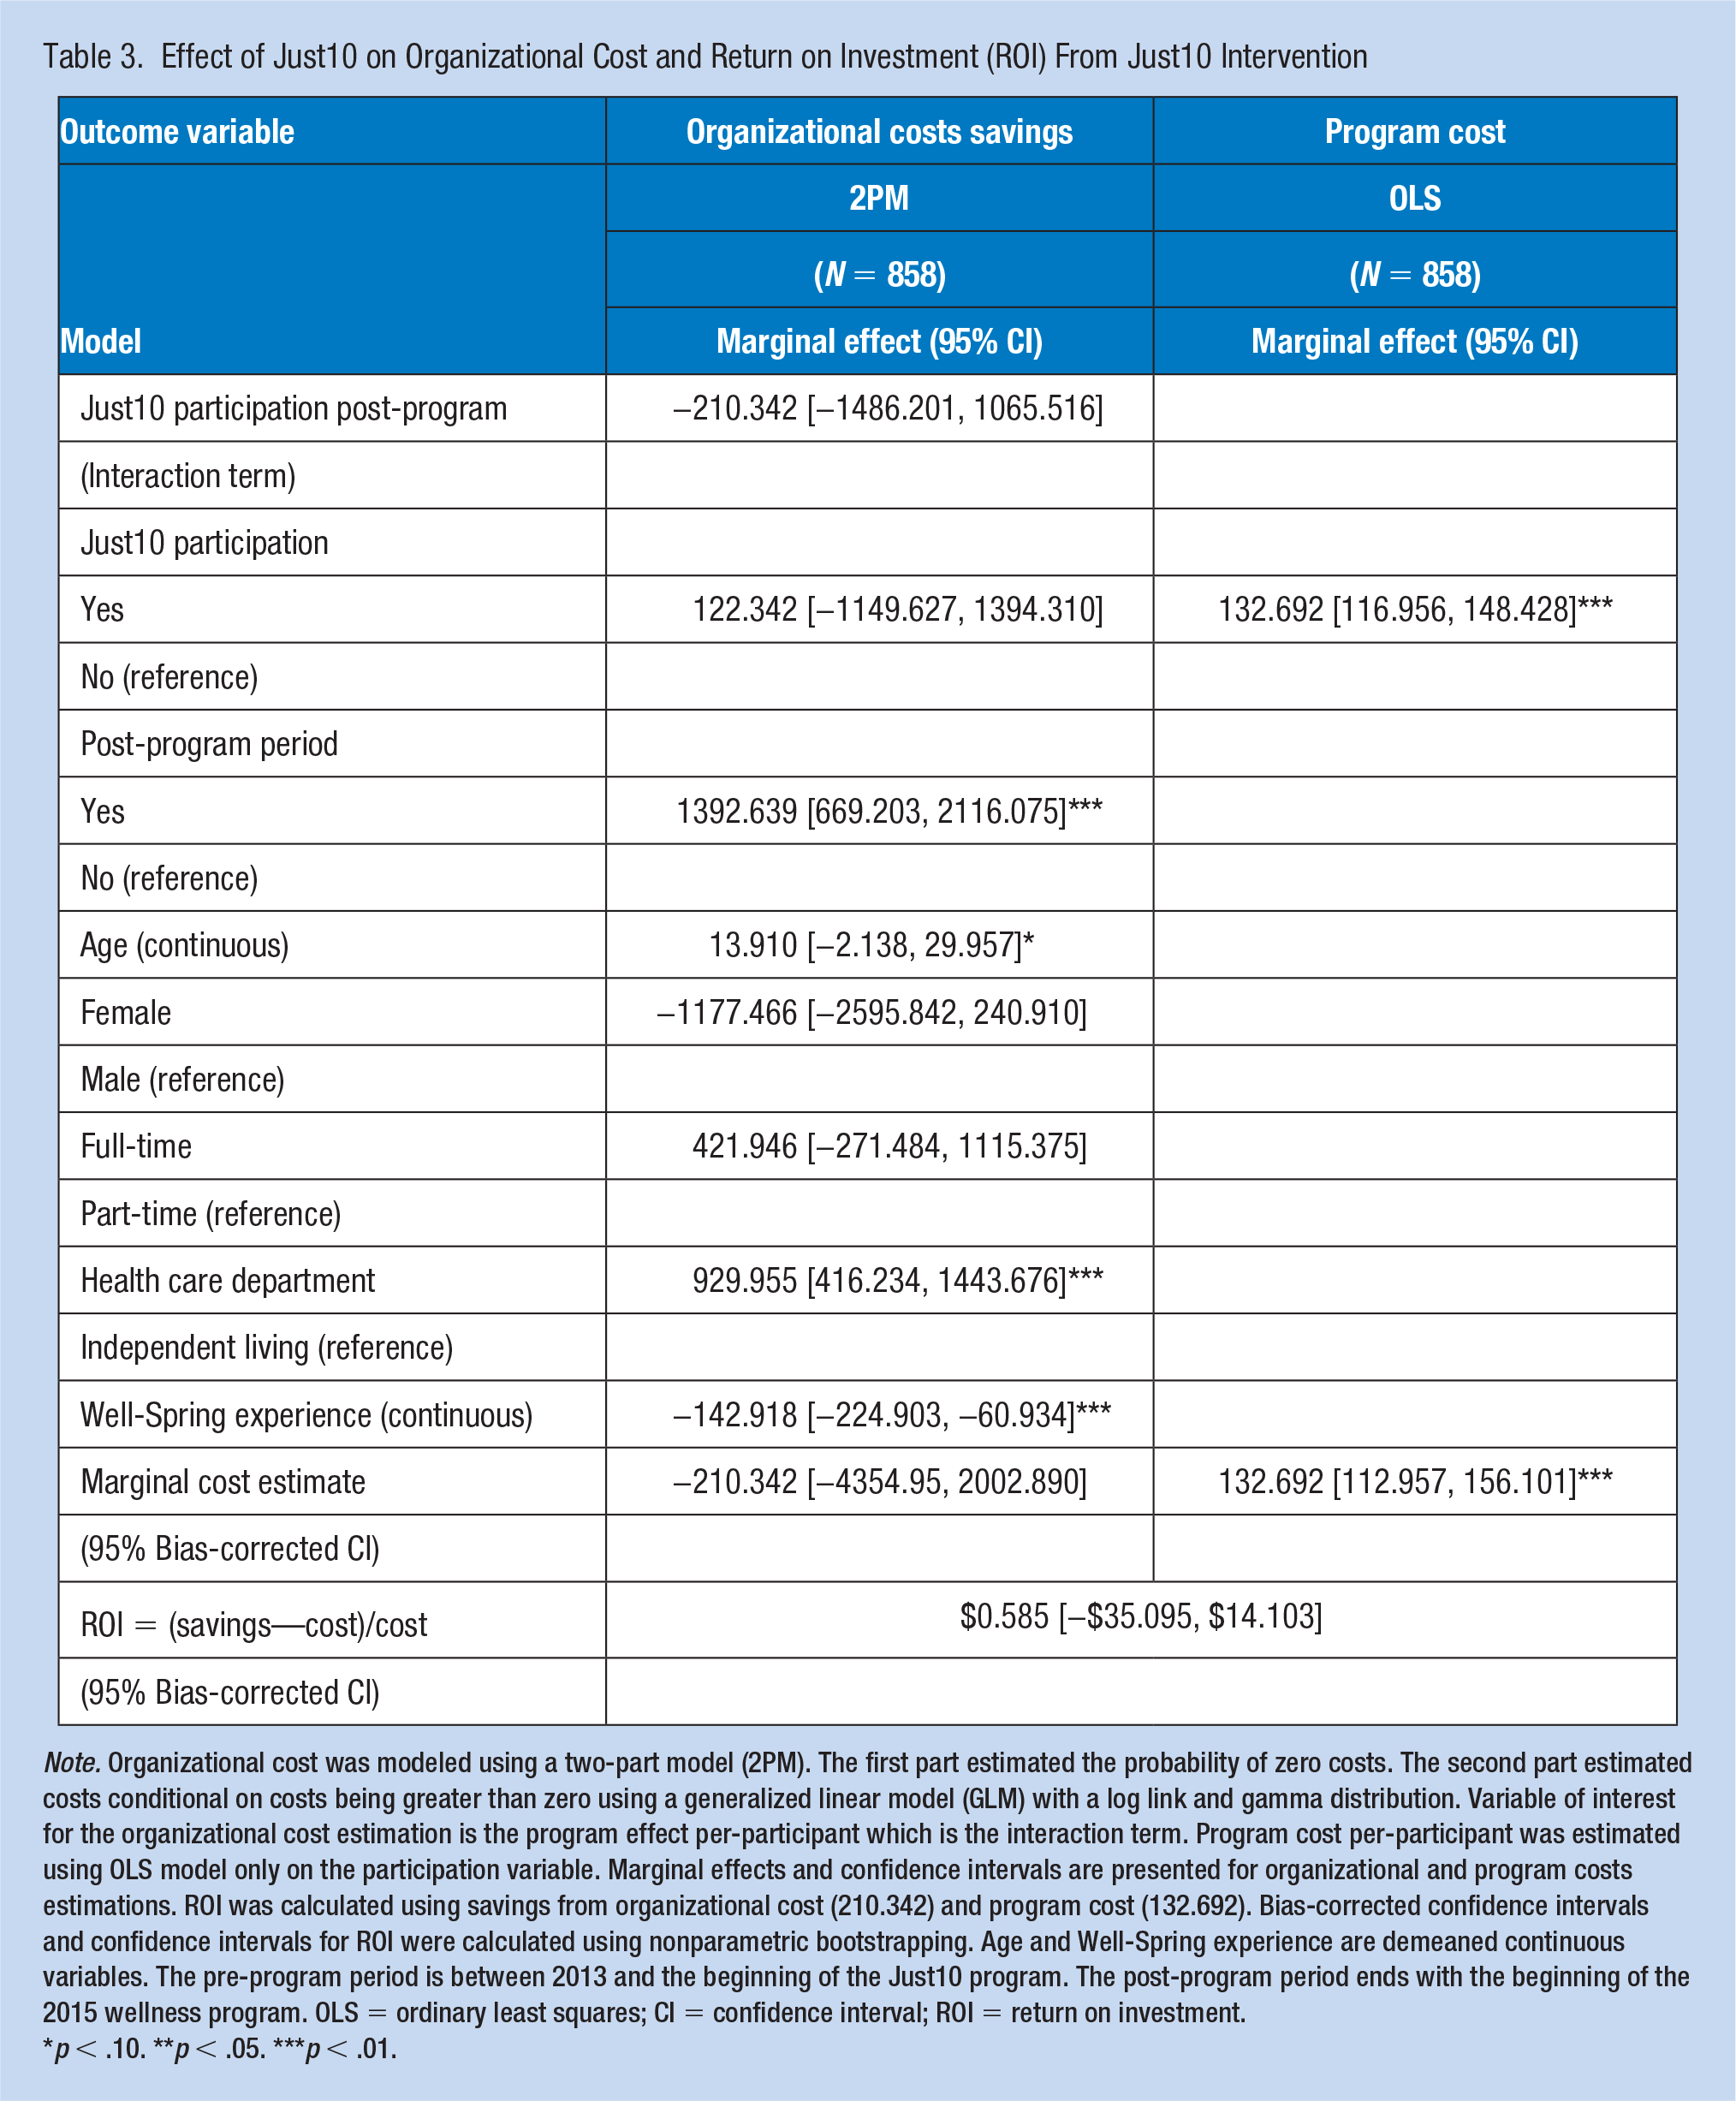
Note. Organizational cost was modeled using a two-part model (2PM). The first part estimated the probability of zero costs. The second part estimated costs conditional on costs being greater than zero using a generalized linear model (GLM) with a log link and gamma distribution. Variable of interest for the organizational cost estimation is the program effect per-participant which is the interaction term. Program cost per-participant was estimated using OLS model only on the participation variable. Marginal effects and confidence intervals are presented for organizational and program costs estimations. ROI was calculated using savings from organizational cost (210.342) and program cost (132.692). Bias-corrected confidence intervals and confidence intervals for ROI were calculated using nonparametric bootstrapping. Age and Well-Spring experience are demeaned continuous variables. The pre-program period is between 2013 and the beginning of the Just10 program. The post-program period ends with the beginning of the 2015 wellness program. OLS = ordinary least squares; CI = confidence interval; ROI = return on investment.
p < .10. **p < .05. ***p < .01.
ROI
Table 3 shows results for program costs and ROI as well as organizational costs. Overall, the Just10 program cost Well-Spring $15,392 to implement, averaging to $132.692 per participant with a confidence interval of 112.957 to 156.101. Using the ROI calculation of the difference between organizational costs savings and program costs, divided by program costs, the estimated ROI is [(−(−$210.342) − $132.692)/$132.692] = 0.585 with the bias-corrected confidence interval of −35.095 to 14.103. The wide range of the confidence interval for the ROI estimate was due to high variability in organizational cost. Although the results suggest that Well-Spring saved $1.585 for every $1 of program investment, this estimate was not significant.
Sensitivity Analysis for ROI Estimates
In the sensitivity analysis, minimum and maximum of turnover costs were used to calculate organizational costs, respectively (Table 4). When organizational costs were calculated using the minimum of turnover cost, then the ROI was (−1.415) with the bias-corrected confidence interval of −33.304 to 5.438, suggesting that Well-Spring lost $0.415 for every $1 of program investment. When organizational costs were calculated using the maximum of turnover cost, the ROI was −$0.232 with the bias-corrected confidence interval of −49.968 to 15.402, suggesting that Well-Spring saved only $0.768 for every $1 of program investment. The first part of the two-part model of organization costs changed with the minimum turnover costs, where the intervention did not prevent as many positive costs as before. This resulted in the intervention not saving as much money as expected.
Return on Investment (ROI) Sensitivity Analyses
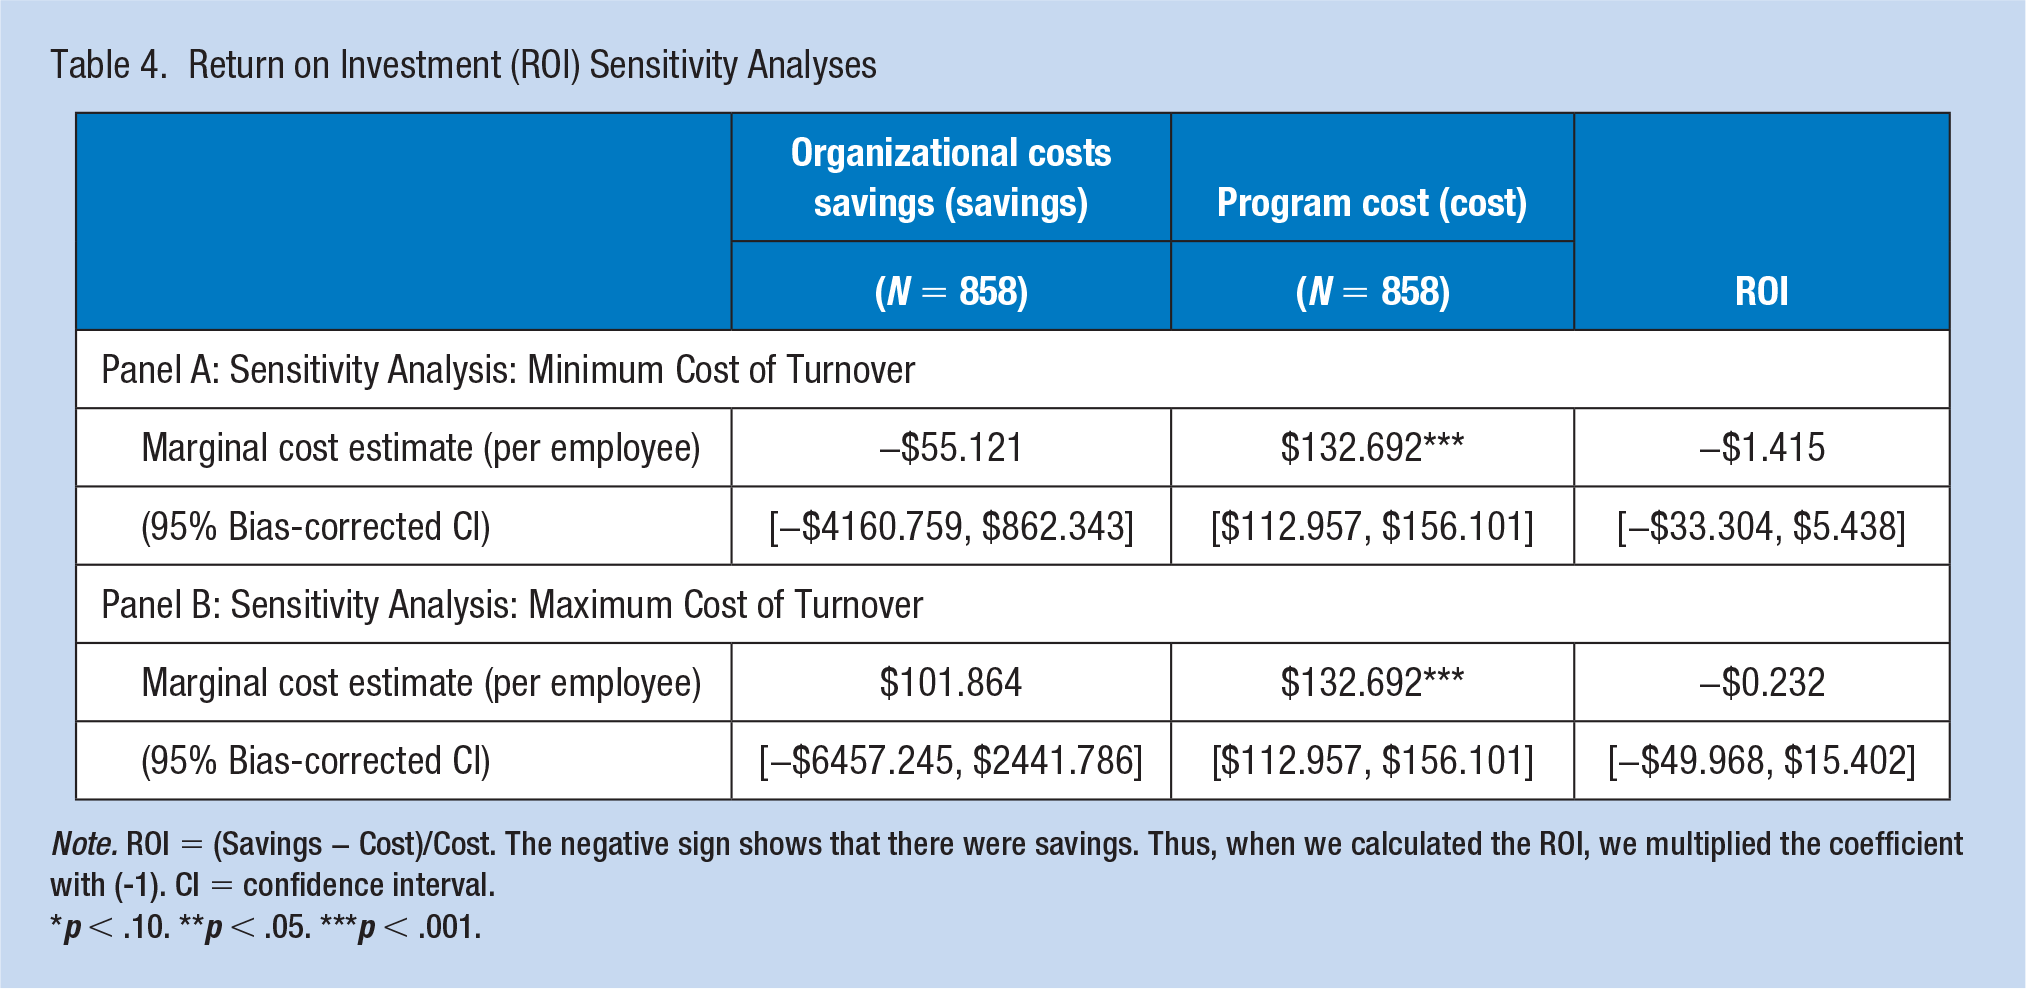
Note. ROI = (Savings − Cost)/Cost. The negative sign shows that there were savings. Thus, when we calculated the ROI, we multiplied the coefficient with (-1). CI = confidence interval.
p < .10. **p < .05. ***p < .001.
The wide range of confidence intervals for benefits, and therefore ROI, reduced the precision of the ROI in the sensitivity analysis, as well. We found that the ROI estimations were sensitive to turnover costs because the difference between minimum and maximum turnover cost increased as the position of the employee ranked higher. For example, this difference was $500 for the wait staff, whereas it was $43,000 for a department manager.
Discussion
This evaluation of a WWP at Well-Spring presented the ROI of a multicomponent wellness program in a small nonprofit company. The program’s inputs, combined with intervention activities, were intended to raise employees’ awareness of how to lose weight and exercise with the purpose of creating a healthier workplace environment. The main analysis assessed differences between program participants and nonparticipants in organizational outcomes identified by Well-Spring as priorities, specifically turnover, injury, and organizational costs. These outcomes may not have direct links with the WWP and activities in place at Well-Spring, which may limit the efficacy of the WWP with regard to these outcomes. Despite this limitation, we conducted our evaluation with the outcomes that were identified as priorities for Well-Spring. This situation is not uncommon, and we believe this study therefore highlights the importance of early collaborations between evaluators and implementers to get the strongest designs aligned with the most effective programming.
We estimated the program cost per participant for the post-program period and organizational costs per participant over a 2-year period. The savings from organizational costs exceeded program costs but the savings estimates were not significant. The overall ROI was 0.585, indicating that average organizational costs declined by $1.585 for every $1.00 spent on the Just10 wellness program. A recent systematic review (Unsal, 2018) that included nonexperimental studies such as ours found an average ROI of 0.675 for small companies. Although the ROI of Well-Spring was below the ROI average of systematic reviews, Well-Spring did indeed save money from the wellness program. However, the large confidence interval around the ROI estimate, estimated using a bootstrapping method, showed that the results were not significant.
Some limitations are worth noting. First, program participation in the exercising groups was self-reported, which might be overstated by participants. Program costs might have gone up due to measurement error caused by self-reporting. These measurement errors in the explanatory variable due to self-reporting could have led to biased estimates (Gujarati, 2009). Second, the ROI finding may have been understated or overstated due to missing workers’ compensation claims data. At the time the data were provided, the compensation claims were not available to the company. Third, the cost of turnover only varied by the employee position not by individual-level which would impact the organizational cost when calculating ROI. Measurement errors in the dependent variables in this analysis due to data observability issues produce biased estimates; however, the power of statistical tests was reduced due to larger variances (Gujarati, 2009). Fourth, despite the effort to reduce the selection bias using difference in differences specification, the estimation results may have been biased due to heterogeneous program effects. In addition, we are cautious about interpreting the findings as causal inference for the reasons explained in the model section. Fifth, injury is a rare event which could also impact the significance and magnitude of the findings (King & Zeng, 2001). Organizational costs had extreme outliers which impact the efficiency of the estimates due to heteroscedasticity. In a rare event case, the effect of extreme outliers on estimations could magnify. Sixth, the evaluation duration included 2 years, which could be too short a time period to see significant impacts of a wellness program, particularly for the organizational outcomes analyzed here.
Despite these limitations, this article contributes to the literature in terms of providing a high-quality evaluation for a small company and improving the quality of reporting and analysis methods. Our evaluation used outcomes of interest to the small nonprofit company, staying true to the value propositions of the organization and the WWP practices that they put in place. This nonrandomized study provided more rigorous ROI evidence compared with previous nonrandomized studies by using difference in differences methods and presenting confidence intervals on the ROI estimate (Musich et al., 2015; Yen et al., 2010). The methods and reporting elements used in this study could support meta-analyses of WWP ROI in small companies if more evaluations in small companies are published using the same methods. However, results do not necessarily generalize to WWPs in other small companies. This study is expected to shift the understanding of why and how we should evaluate WWPs and to assist employers deciding on provisions of WWPs.
Implications for Occupational Health Practice
Workplace wellness programs are increasingly promoted by businesses and governments as an important strategy to improve worker’s population overall health and well-being and reduce health care costs. Return-on-investment is used as an economic evaluation method for the investment in the work environment and occupational health. Rigorous return-on-investment research may encourage and promote the inclusion of quality workplace wellness programs to support the health and well-being of employees. If workplace wellness programs are adopted based on return-on-investment considerations, however, then employers should align wellness activities with the targeted organizational outcomes driving return-on-investment.
Applying Research to Occupational Health Practice
The evaluation of workplace wellness programs (WWPs) is essential to demonstrating value to employers and key stakeholders. This may be particularly important for small businesses that may have fewer resources and organizational bandwidth to allow for the implementation of WWPs. Although there are many outcomes that could be included in the evaluation of WWPs, this study assessed the return-on-investment of a WWP for a small business, an outcome of primary interest for the employer. The evaluation of a WWP in a small, nonprofit, long-term care company demonstrated a return-on-investment of $0.58. This organization saved $1.585 for every $1 of program investment. However, rigorous evaluation methods that included bootstrapping to obtain confidence intervals around the return-on-investment concluded that the results for the evaluation of this brief WWP were not significant. For future economic evaluations, following the methodological guidance of rigorous evaluation methods such as these will help to examine and establish evidence for cost-effectiveness of WWPs.
Footnotes
Acknowledgements
The authors thank Dr. Albert N. Link and Michael Pittard for their valuable contribution to this article. The authors also thank Well-Spring Retirement Community, Inc., for providing the opportunity to conduct this study.
Author Contributions
Nilay Unsal, PhD, is a faculty at the Department of Economics at Ankara University. She made ongoing and substantial contribution to the concept and design, acquired and interpreted the data and analysis, drafted and revised the manuscript, provided final approval for publication, and agrees to be accountable for all aspects of the work.
GracieLee Weaver, PhD, MPH, CHES, is a research associate at the Office of Research & Engagement at University of North Carolina at Greensboro. She made a substantial contribution to the concept and design, to interpreting the results and the editing of the manuscript, provided final approval for publication, and agrees to be accountable for all aspects of the work.
Jeremy W. Bray, PhD, is a professor of economics at UNCG. He made ongoing and substantial contributions to the conception and design of the study, to the writing and editing of the manuscript, provided final approval for publication, and agrees to be accountable for all aspects of the work.
Daniel Bibeau, PhD, is a professor of the Department of Public Health Education in the School of Health and Human Sciences at the University North Carolina at Greensboro. He made a substantial contribution to the concept and design, to interpreting the results and the editing of the manuscript, provided final approval for publication, and agrees to be accountable for all aspects of the work.
Garrett Saake, DMA, is director of Resident Relation Programs at Well-Spring Retirement Community at Greensboro, North Carolina. He made a substantial contribution to the design, to interpreting the results, and provided final approval for publication, and agrees to be accountable for all aspects of the work.
Declaration of Conflicting Interests
The author(s) declared no potential conflicts of interest with respect to the research, authorship, and/or publication of this article.
Funding
The author(s) received no financial support for the research, authorship, and/or publication of this article.
Author Biographies
Nilay Unsal, PhD, is a faculty at Department of Economics at Ankara University. Her research focuses on health economics and program evaluation. She conducts research on workplace wellness programs.
GracieLee Weaver, PhD, MPH, CHES, is an assistant professor of the Department of Public Health Education in the School of Health and Human Sciences at University of North Carolina at Greensboro. Her research interests include the development, implementation, and evaluation of health promotion interventions in workplaces.
Jeremy W. Bray, PhD, is a Jefferson-Pilot Excellence Professor of Economics in the Bryan School of Business and Economics at the University North Carolina at Greensboro. His research focuses on two primary areas of interest: the economics of substance abuse and the economic evaluation of behavioral health interventions.
Daniel Bibeau, PhD, is a professor of the Department of Public Health Education in the School of Health and Human Sciences at the University North Carolina at Greensboro. His scholarly interests focus on understanding and managing chronic disease risks among adults using a socioecological approach to health education and health promotion.
Garrett Saake, DMA, is director of Resident Relation Programs at Well-Spring Retirement Community at Greensboro, North Carolina.