
Abstract
The purpose of this pilot study was to explore the relationships between sleep, work practices, speed of processing, and 5-year motor vehicle crash risk among a group of older truck drivers. Anthropometric, demographic, and psychological data were recorded, along with health, sleep, and work histories from a sample of 23 truck drivers. Results from this pilot study suggest that physical fatigue may play a role in processing speed. Future studies should be designed with adequate power and include objective measures of sleep and repeated measures over time to determine 5-year MVC rates. Implications for occupational health nursing research, practice, and education are presented.
Keywords
The truck driving workforce is aging, reflecting current trends across all occupational sectors in the United States. Between the years 1994 and 2013, truck drivers aged 45 to 54 years and 55 to 64 years increased in number by 45% and 126%, respectively; the number of truck drivers aged 26 to 34 years and 35 to 44 years declined significantly (48% and 17 %, respectively; Short, 2014). Cognitive changes associated with aging in passenger vehicle drivers (e.g., processing speed) have been associated with increased risk of motor vehicle crashes (Friedmann, McGwin, Ball, & Owsley, 2013; Mathias & Lucas, 2009). It is unclear whether such cognitive changes, associated with increased vehicular crash risk, occur in the same way in aging truck drivers. However, changes in sleep and increased comorbid conditions are typically associated with aging, and may affect driving safety among aging truck drivers, a group known to have erratic and irregular schedules predisposing them to sleep problems. These sleep problems may further compound driving safety and increase the risk of motor vehicle crashes in this group of workers.
Background
Sleep quality declines with aging, and is related to a number of changes that occur in sleep architecture. Generally, older adults experience less restorative sleep. Older adults’ sleep onset occurs earlier in the night with subsequent earlier wake times compared with younger adults’ sleep and wake onset times. Older adults experience fragmented sleep due to frequent awakenings (Achermann & Borbely, 2011). Also, older individuals may experience multiple comorbid health conditions associated with medication use that impacts sleep and may subsequently affect safe driving ability.
The fragmentation of older adults’ sleep, medication use, and presence of sleep disorders (e.g., obstructive sleep apnea) may negatively impact driving performance. In actual and simulated driving tests, specific performance indicators (e.g., maintenance of lane position, reaction time, steering deviation, speed deviation, time estimation, temporal separation, and incidences of driving simulator “crashes”) consistently degrade in sleep loss states (Howard et al., 2014; Miro, Cano, Espinosa-Fernandez, & Buela-Casal, 2006; Moller Kayumov, Bulmash, & Nhan, Shapiro, 2006; Otmani, Pebayle, Roge, & Muzet, 2005; Philip & Akerstedt, 2006). In fact, driving performance impairment among sleep-deprived individuals is comparable to individuals with blood alcohol levels of 0.5% to 0.8% (Arnedt, Owens, Crouch, Stahl, & Carskadon, 2005; Fairclough & Graham, 1999).
Several cognitive changes that occur with aging are linked to driving safety in older adults. Of particular interest, older drivers must be able to divide their attention between central and peripheral locations and rapidly process visual information to be fully vigilant to potential hazards in the roadway (i.e., visual attention/visual processing speed). This skill degrades significantly with aging (Owsley, Ball, Sloane, Roenker, & Bruni, 1991), along with the ability to rapidly change focus of attention from one aspect of driving to another (Boot, Stothart, & Charness, 2013). Regarding visual attention and visual processing speed, declines in these skills, as measured by the Useful Field of View (UFOV) among older drivers, are predictive of motor vehicle crash risk (Cross et al., 2009). Older drivers with deterioration in ability to rapidly change attention while driving would likely respond much slower to a dynamic change in the roadway (e.g., when another vehicle suddenly pulls out into the driving lane) compared with a younger driver. Along with previously mentioned cognitive skills, older drivers experience a generalized slowing of information processing in the perceptual, cognitive, and motor domains (Dommes & Cavallo, 2011). Therefore, it may take older drivers longer to perceive, recognize, and take measures to respond to roadway hazards compared with younger drivers.
In contrast to the descriptions of medication use, sleep effects, and cognitive changes in older passenger vehicle drivers, much less is known about how these phenomena affect truck drivers. Driving safety among this group of workers is a critical occupational and public health issue. The number of commercial truck–related crashes increased overall in 2014 (n = 82,000), along with the number of associated nonfatal injuries related to these crashes (n = 111,000) compared with the previous year (Federal Motor Carrier Safety Administration [FMCSA], 2014). Also, 2011 commercial motor vehicle crashes were estimated to cost US$87 billion (FMCSA, 2013). Clearly, a study of factors that influence driving safety among truck drivers is highly relevant.
The purpose of this pilot study was to explore the relationships among sleep, work experience(s), and visual attention/visual speed of processing for a group of older truck drivers. Specifically, the study aimed to (a) describe the sleep of truck drivers ages 50+ years and older, including sleep quantity, propensity, and subjective sleepiness; (b) determine the visual attention/visual speed of processing of older truck drivers; (c) explore the relationships among sleep, work experience(s), and visual attention/visual speed of processing for the population.
Method
After receiving approval from the University of Alabama at Birmingham’s Institutional Review Board (IRB), participants (n = 23) were recruited using word of mouth and fliers posted in areas commonly populated by truck drivers (e.g., truck stops, rest areas, and diesel engine repair shops). Potential participants contacted the researcher via telephone, and eligibility was determined. Inclusion criteria for the study were (a) solo long-haul truck driver; (b) current Department of Transportation medical certificate; (c) age 50 years or older; (d) able to speak, read, and write English; and (e) had access to a cell phone. Truck drivers with a diagnosis of obstructive sleep apnea or pregnancy were excluded from the study. Once it was determined that inclusion was appropriate, informed consent was obtained, and data collection initiated.
Instrumentation
All participants completed measures including demographic and occupational characteristics, work practices, health and sleep histories, anthropometric measures (i.e., blood pressure, height, and weight), and UFOV during one session, which took approximately 45 minutes. Instruments targeting specific outcomes of interest are summarized in Table 1. When available, measures of validity and reliability are included.
Study Measures, Validity, and Reliability
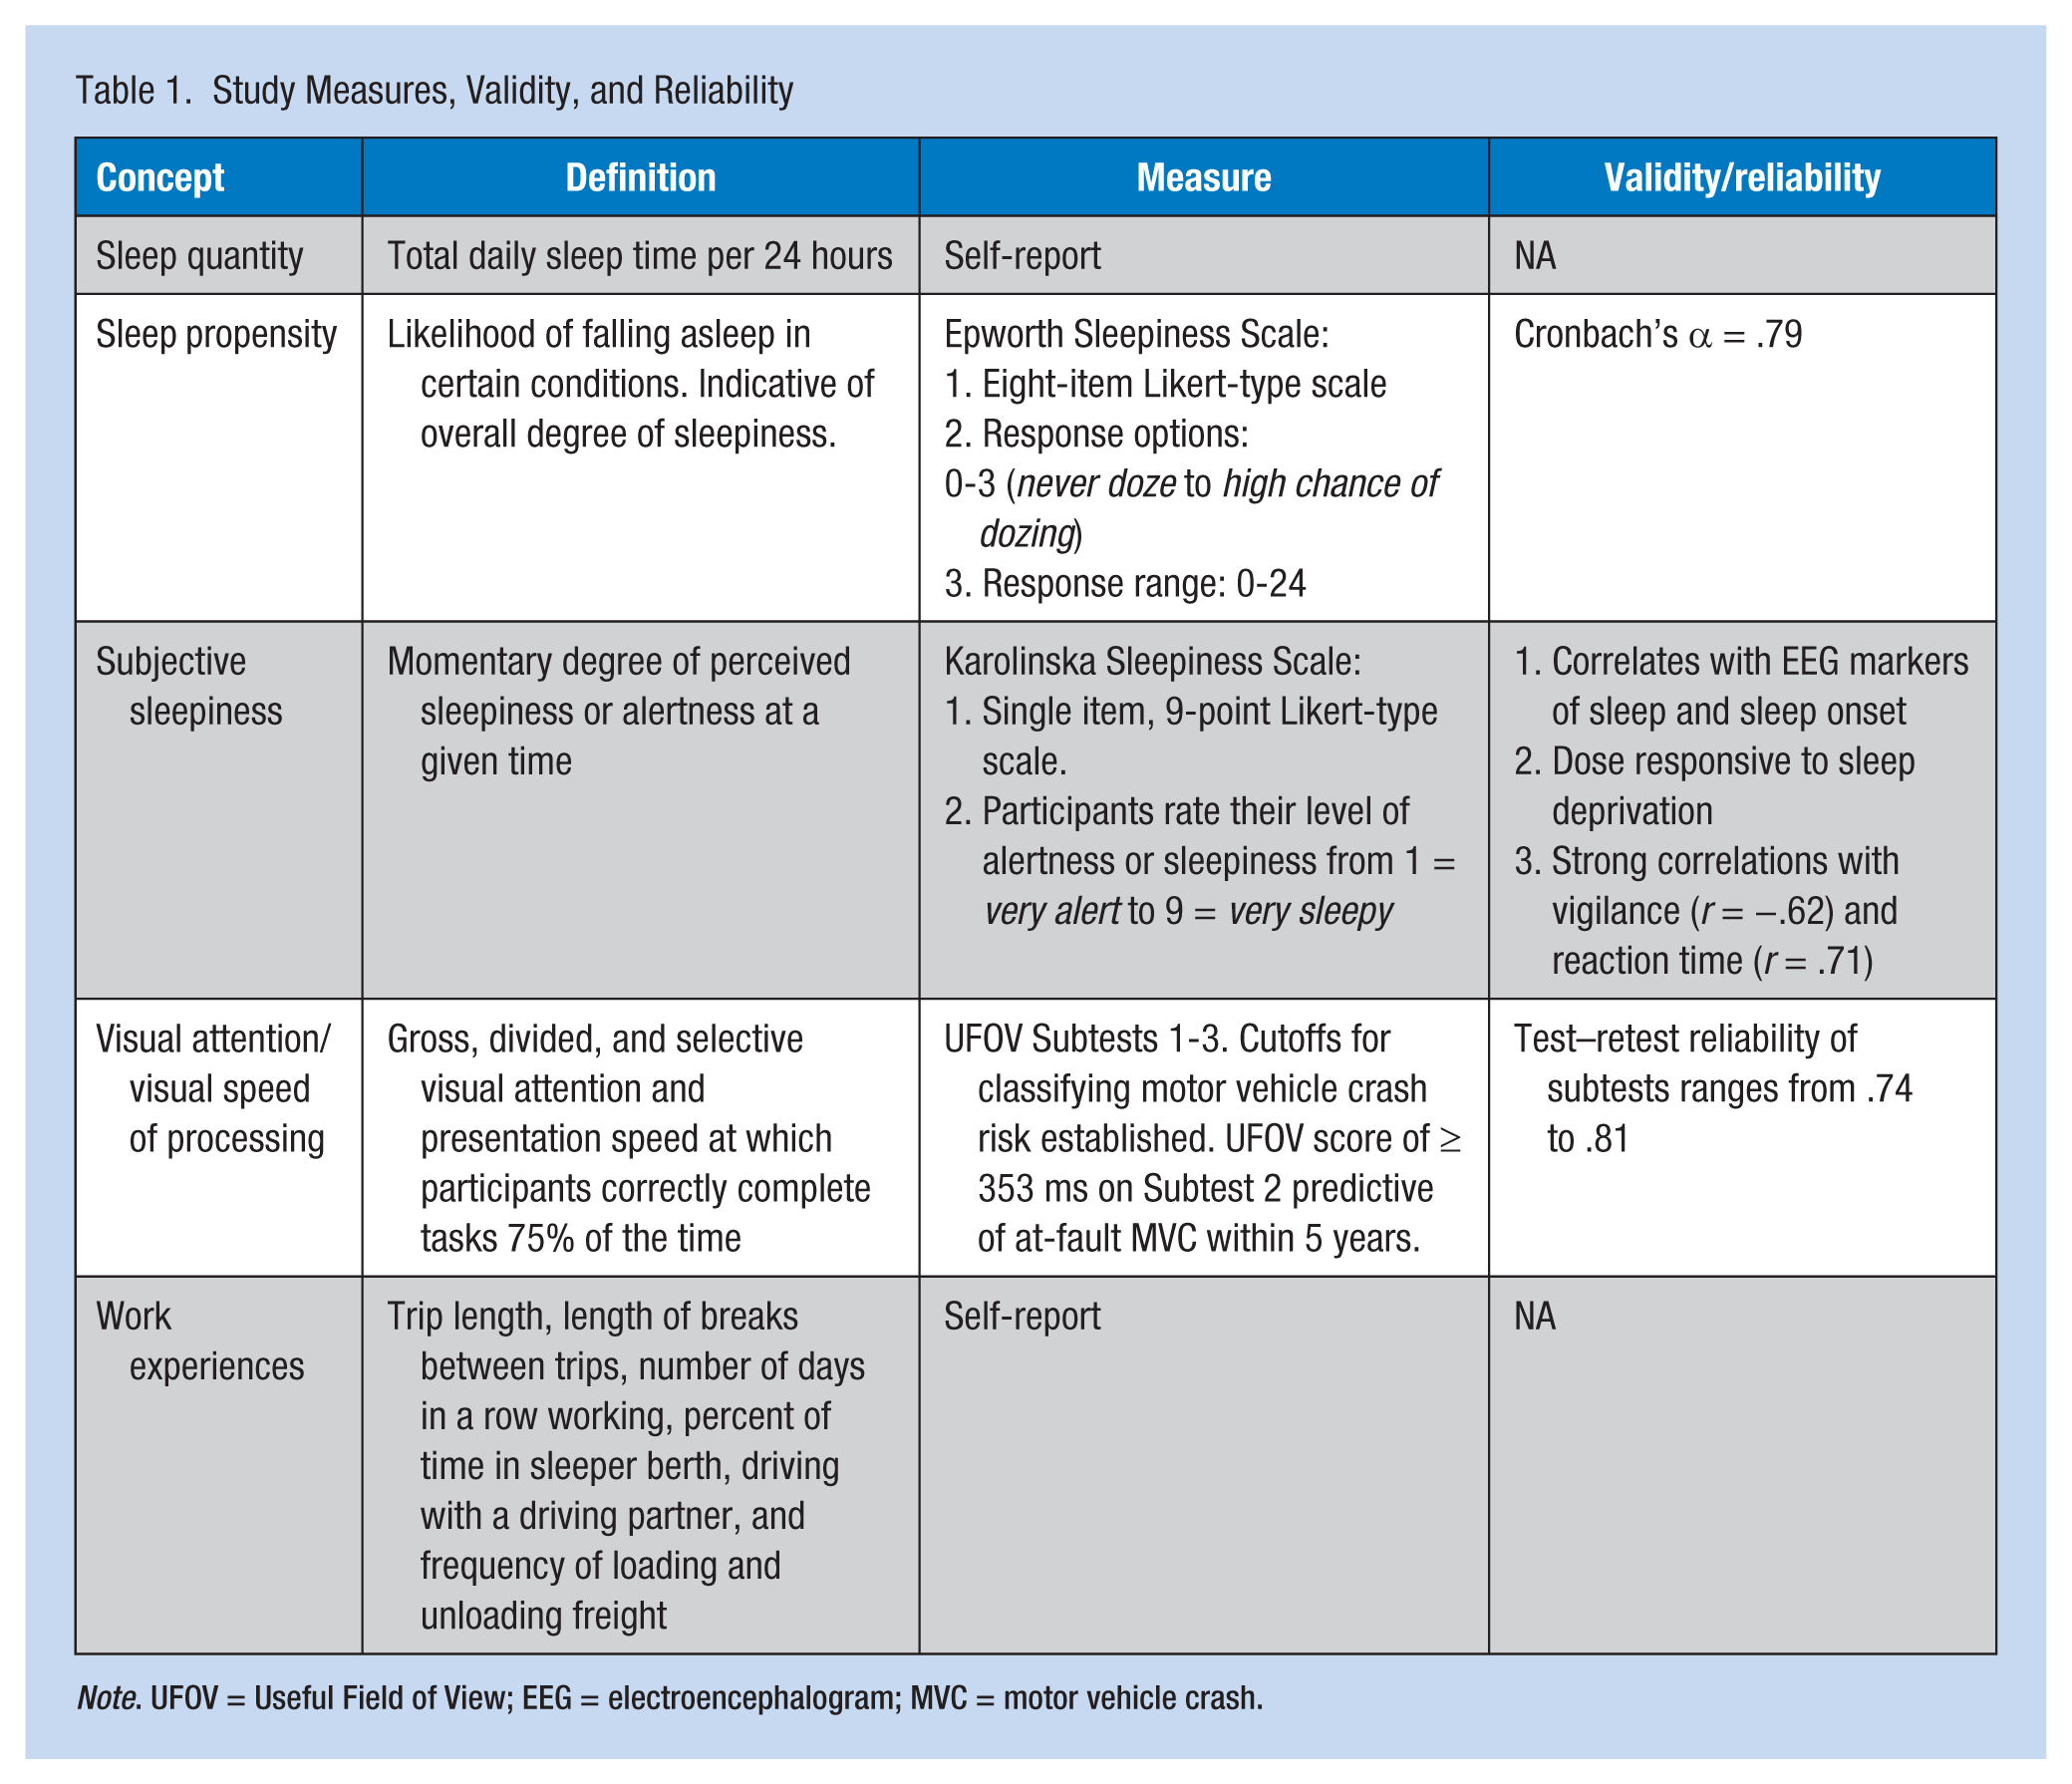
Note. UFOV = Useful Field of View; EEG = electroencephalogram; MVC = motor vehicle crash.
Sleep quantity
Sleep quantity was calculated by the difference between self-reported sleep onset and wake times.
Sleep propensity
The Epworth Sleepiness Scale (ESS) was used to determine sleep propensity, or the likelihood of falling asleep in certain conditions (Johns, 1991). This measure is an eight-item scale that asks participants their likelihood of dozing in various situations. Each item is scored on a 0 to 3 Likert-type scale (0 = would never doze; 3 = high chance of dozing). Responses from the eight items are summed for a possible score range from 0 to 24. An ESS score of 10 or higher indicates high sleep propensity and excessive daytime sleepiness (Johns, 1992).
Subjective sleepiness
Subjective sleepiness was measured using the Karolinska Sleepiness Scale. This measurement is a single-item, nine-point scale that asks individuals to rate their sleepiness at the current moment. Responses range from 1 = very alert, 3 = alert, 5 = neither alert nor sleepy, 7 = sleepy (but not fighting sleep), to 9 = very sleepy (fighting sleep) (Akerstedt & Gillberg, 1990).
Visual Attention/Visual Speed of Processing: The UFOV
This computerized test measures attention and visual speed of processing. In the three-subtest version, participants are presented numerous trials of visual stimuli ranging from 17 to 500 ms and must then respond appropriately to the stimuli that was just presented. In each subtest, the optimal presentation threshold for correctly responding 75% of the time is derived using a double-staircase method; thus, if participants respond incorrectly, the test slows down increasing presentation time for the target stimuli, and if they respond correctly, the test speeds up decreasing the presentation time for the target stimuli. These times are combined to derive a composite score; lower scores indicate lower threshold times needed to respond correctly, indicating better processing speed. The test–retest reliability for this instrument is quite high, ranging from 0.735 to 0.884 and has been shown to correlate to measures of everyday functioning such as driving simulator performance and motor vehicle crashes across clinical populations (Edwards et al., 2005; McManus, Cox, Vance, & Stavrinos, 2015; Vance, Fazeli, Ball, Slater, & Ross, 2014). Cutoff scores for 5-year motor vehicle crash risk have been established across all three subscales, and have been validated in a large study of older drivers (Ball et al., 2006; Okonkwo, Crowe, Wadley, & Ball, 2008; Ross et al., 2009).
Procedures
After enrollment, all participants completed a written instrument packet that assessed demographic characteristics; occupational, health, and sleep histories; medication use; and sleep quantity and propensity. Upon completion of the written instruments, all participants received anthropometric measures including height, weight, and neck circumference and measures of resting blood pressures. Participants who had abnormal findings commonly associated with pathologic conditions, such as uncontrolled or poorly controlled hypertension and obstructive sleep apnea, were given written documentation of the findings and referred to their primary care providers for diagnosis. Participants stating that they did not have a primary care provider were encouraged to seek evaluation and treatment at a walk-in clinic or urgent care facility. After completing the written instruments and anthropometric and blood pressure measurements, the UFOV Test was administered to participants by study personnel.
Initially, all data were entered into Microsoft Excel for cleaning, and were then transferred to SPSS (IBM SPSS Statistics v.22) for analysis. Frequencies were used to characterize the sample demographics represented by categorical data; descriptive statistics were used to characterize the sample on the demographic data represented by continuous variables and the UFOV test scores. Relationships between age, medication use, UFOV, and sleep variables were evaluated using correlations and multiple regression. Statistical significance was set a priori at p = .05.
Results
Sample Characteristics
The sample consisted of mostly White, married men who had completed high school or equivalency testing. The mean age of participants was 56 years, and the majority of participants earned between US$55,000 and US$100,000 in the year prior to data collection.
The most commonly reported health conditions were hypertension (n = 14, 60.9%), diabetes (n = 4, 17.4%), and kidney disease (n = 3, 13%). Obesity was common in this group. Results of the anthropometric measures indicated a mean body mass index (BMI) of 33.2 kg/m2 and mean neck circumference of 16.73 inches.
Sleep
Participants reported mean sleep time of just over 7 hours. Mean Epworth and Karolinska Sleepiness Scale scores were 6.39 and 2.22, respectively. The majority of participants (52%) reported snoring that disturbs others. The three other signs of sleep disturbance reported by the participants were kicking or twitching legs during sleep (26%), witnessed apnea (13%), and irresistible urge to sleep during the day (8.7%). Among participants who reported conditions that disturbed their sleep, the most commonly cited disturbances were noise from outside the truck and the telephone (13% each), heat (8.7%), coffee or caffeine use (8.7%), and stress due to weather (8.7%).
Visual Processing Speed
Not surprisingly, performance on UFOV subscales declined with increasing difficulty. Participants’ mean visual processing speed as measured by UFOV on Subscales 1, 2, and 3 was just under 22 ms (SD = 1.70), 104.17 ms (SD = 139.50), and 181.44 ms (SD = 106.26), respectively. The mean total UFOV score was 307.56 ms (SD = 224.54).
Work Experiences
Most participants were employed by trucking companies and had been licensed as commercial drivers for just over 20 years. The length of an average trip was approximately 1,300 miles, with participants reporting the mean number of days in a row “on the road” as just under 5 days, with a mean length of break between trips of 1.3 days. The participants spent almost 57% of their sleep time in the sleeper berths of their trucks, and just fewer than 17% of them drove with a driving partner at least occasionally (Table 2). In addition to driving, 30% of participants reported loading and unloading their own freight (13% occasionally, 4% frequently, and 13% always.
Sample Demographic and Occupational Characteristics (N = 23)
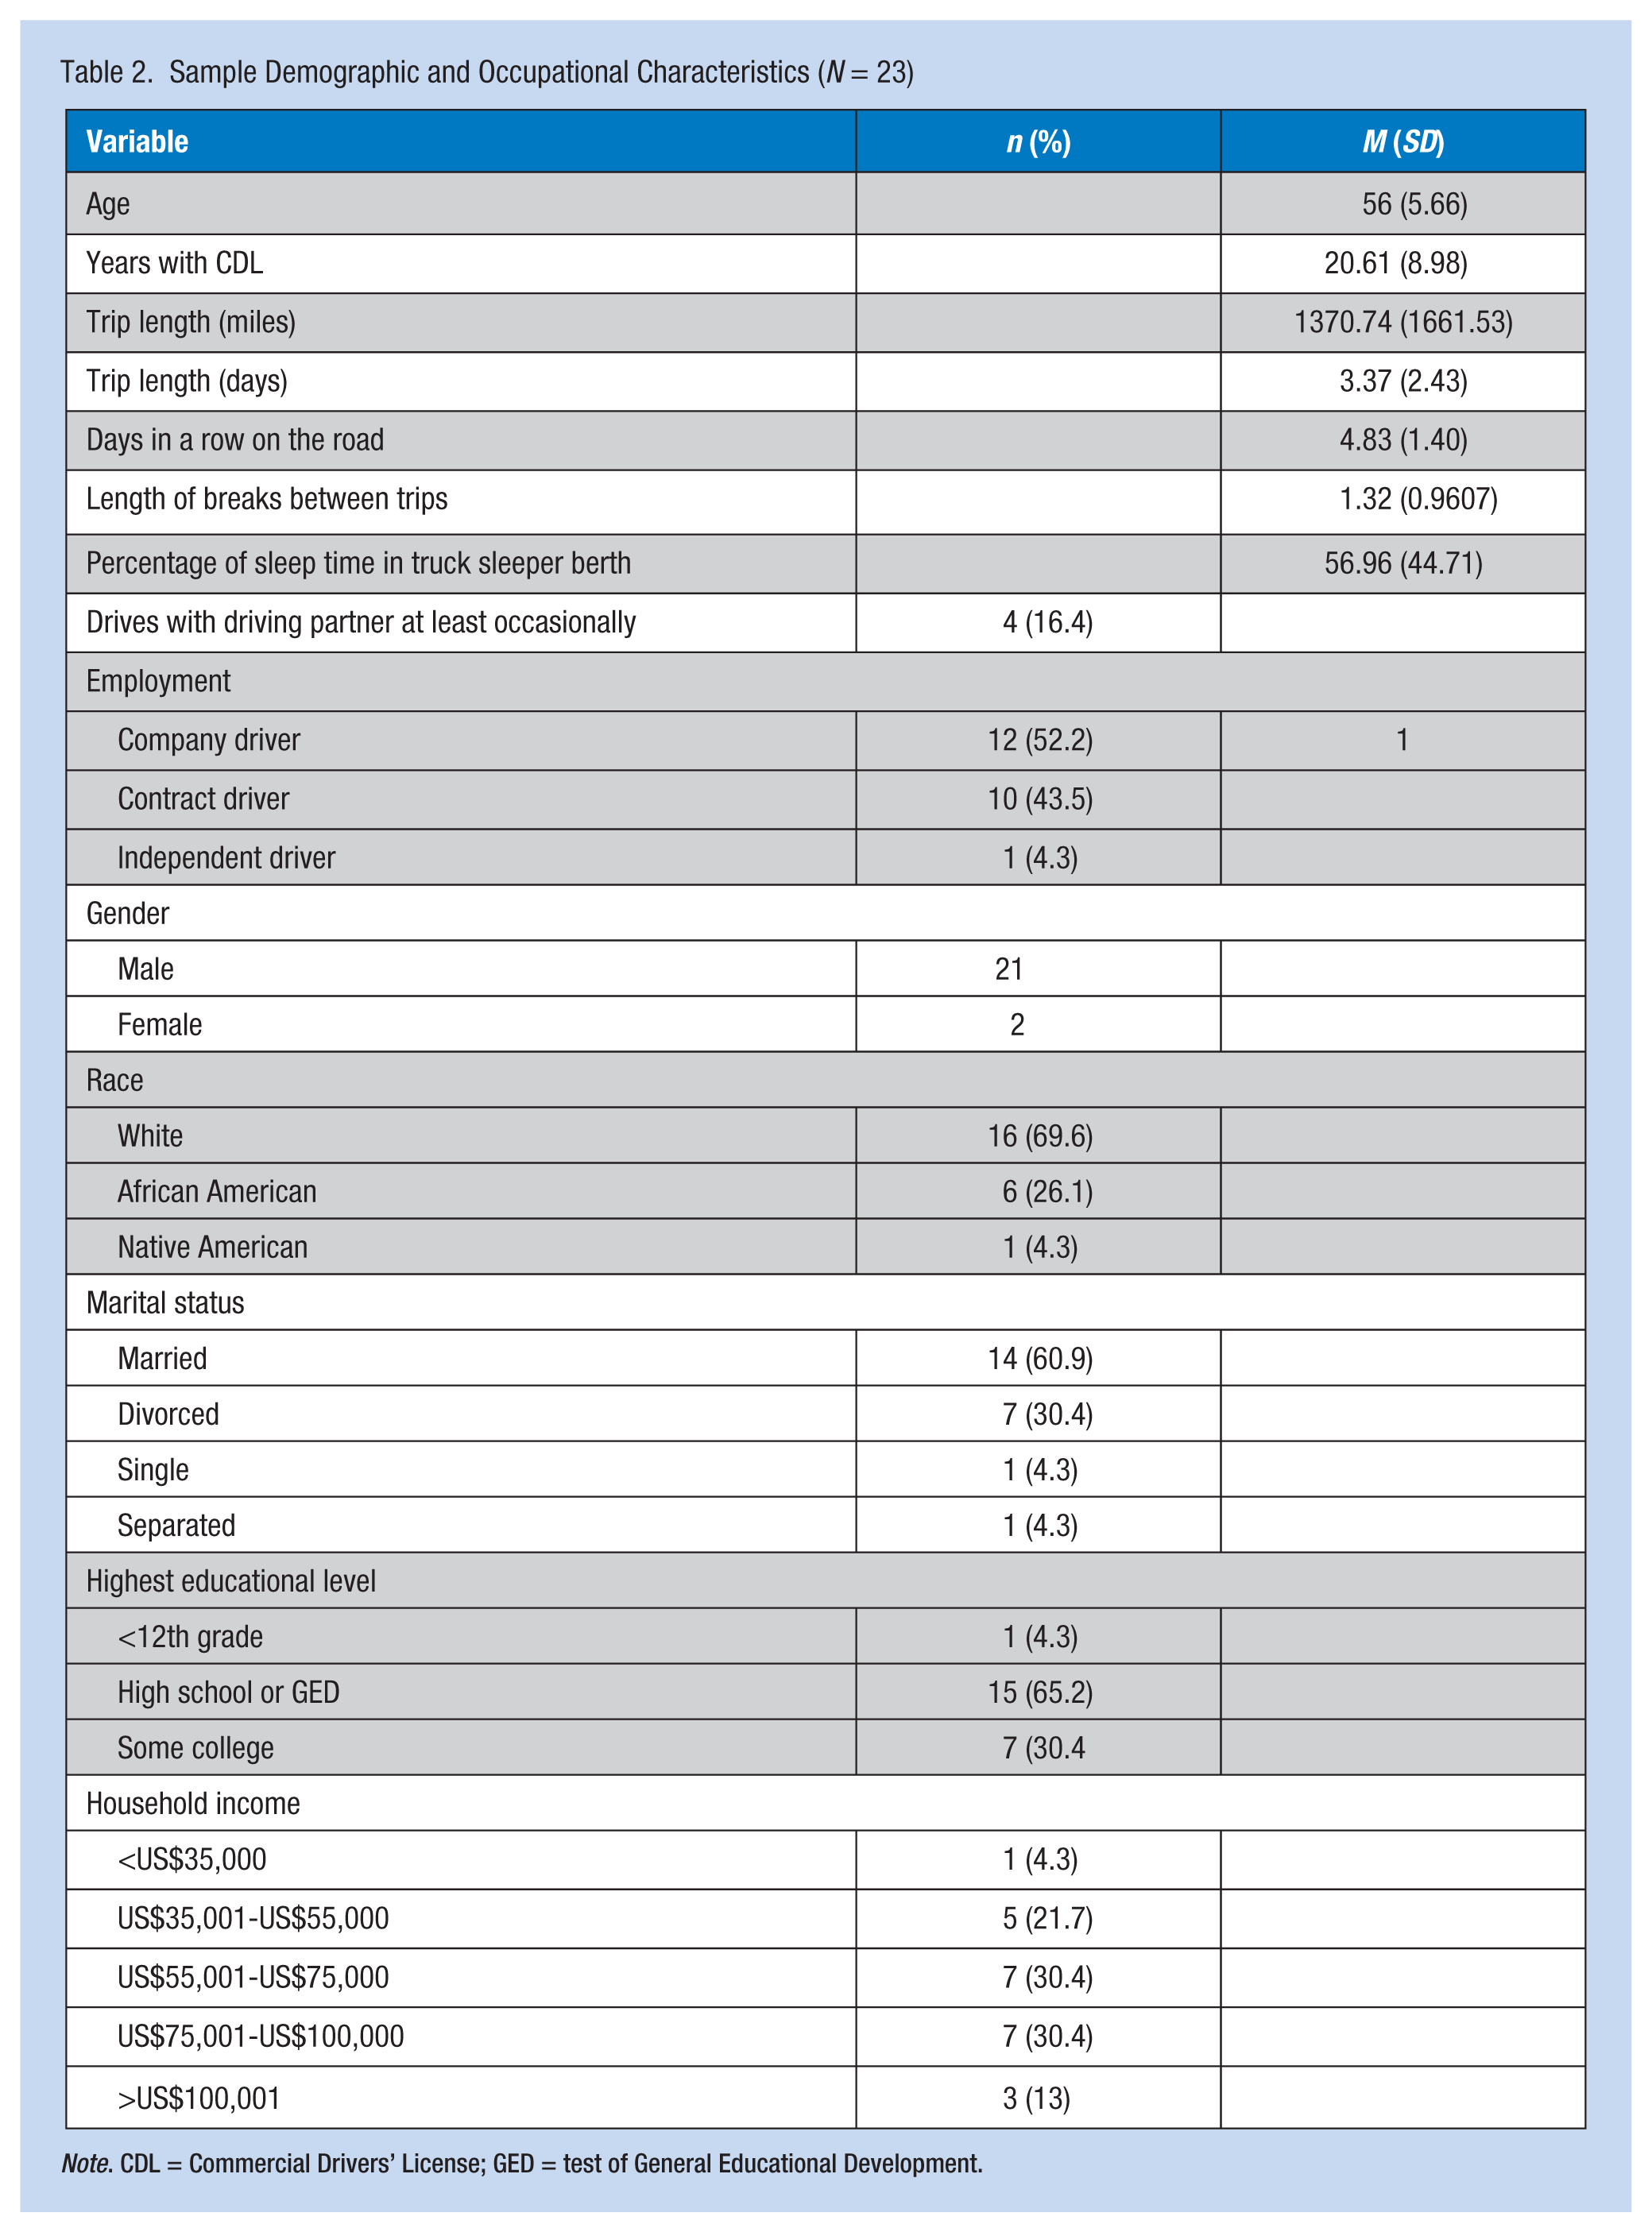
Note. CDL = Commercial Drivers’ License; GED = test of General Educational Development.
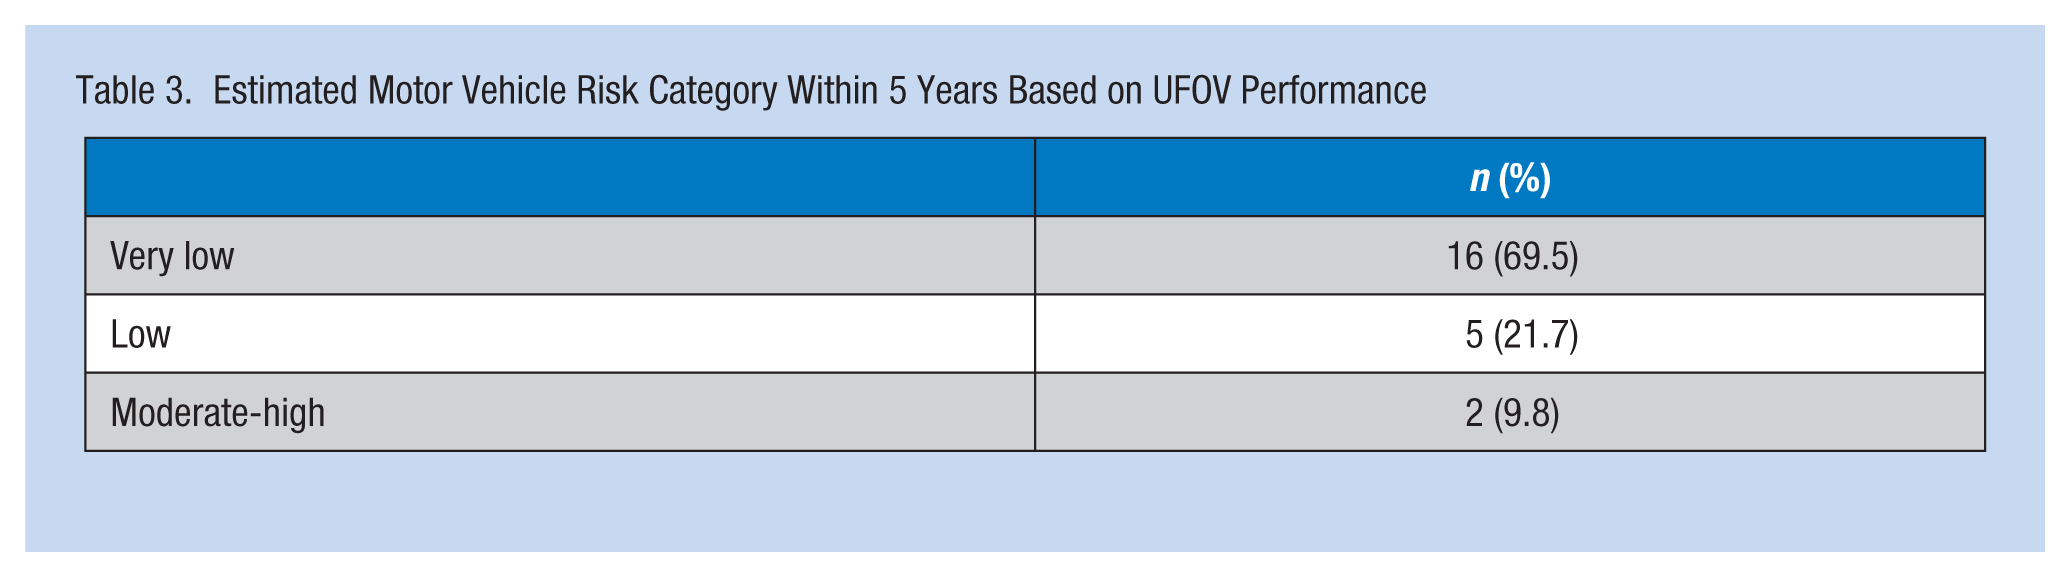
Five-Year Motor Vehicle Crash Risk
Two participants’ UFOV subscale scores fell within the classification criteria for moderate to high risk for a subsequent MVC within 5 years (Table 3). Among the remaining 21 participants’, subscale scores were classified as low risk for five (21.7%) drivers and very low risk for 16 (69.5%) drivers.
Estimated Motor Vehicle Risk Category Within 5 Years Based on UFOV Performance
Relationships Among the Variables
Results of correlations indicated that none of the variables were strongly correlated with each other. Only three independent variables were significantly correlated with UFOV: Age (r = .537, p < .01), Karolinska Sleepiness Scale scores (r = .429, p < .05), and how often drivers load and unload their own freight (r = .764, p < .001). Medication use was not significantly associated with UFOV (Table 4).
Bivariate Correlations (N = 23)
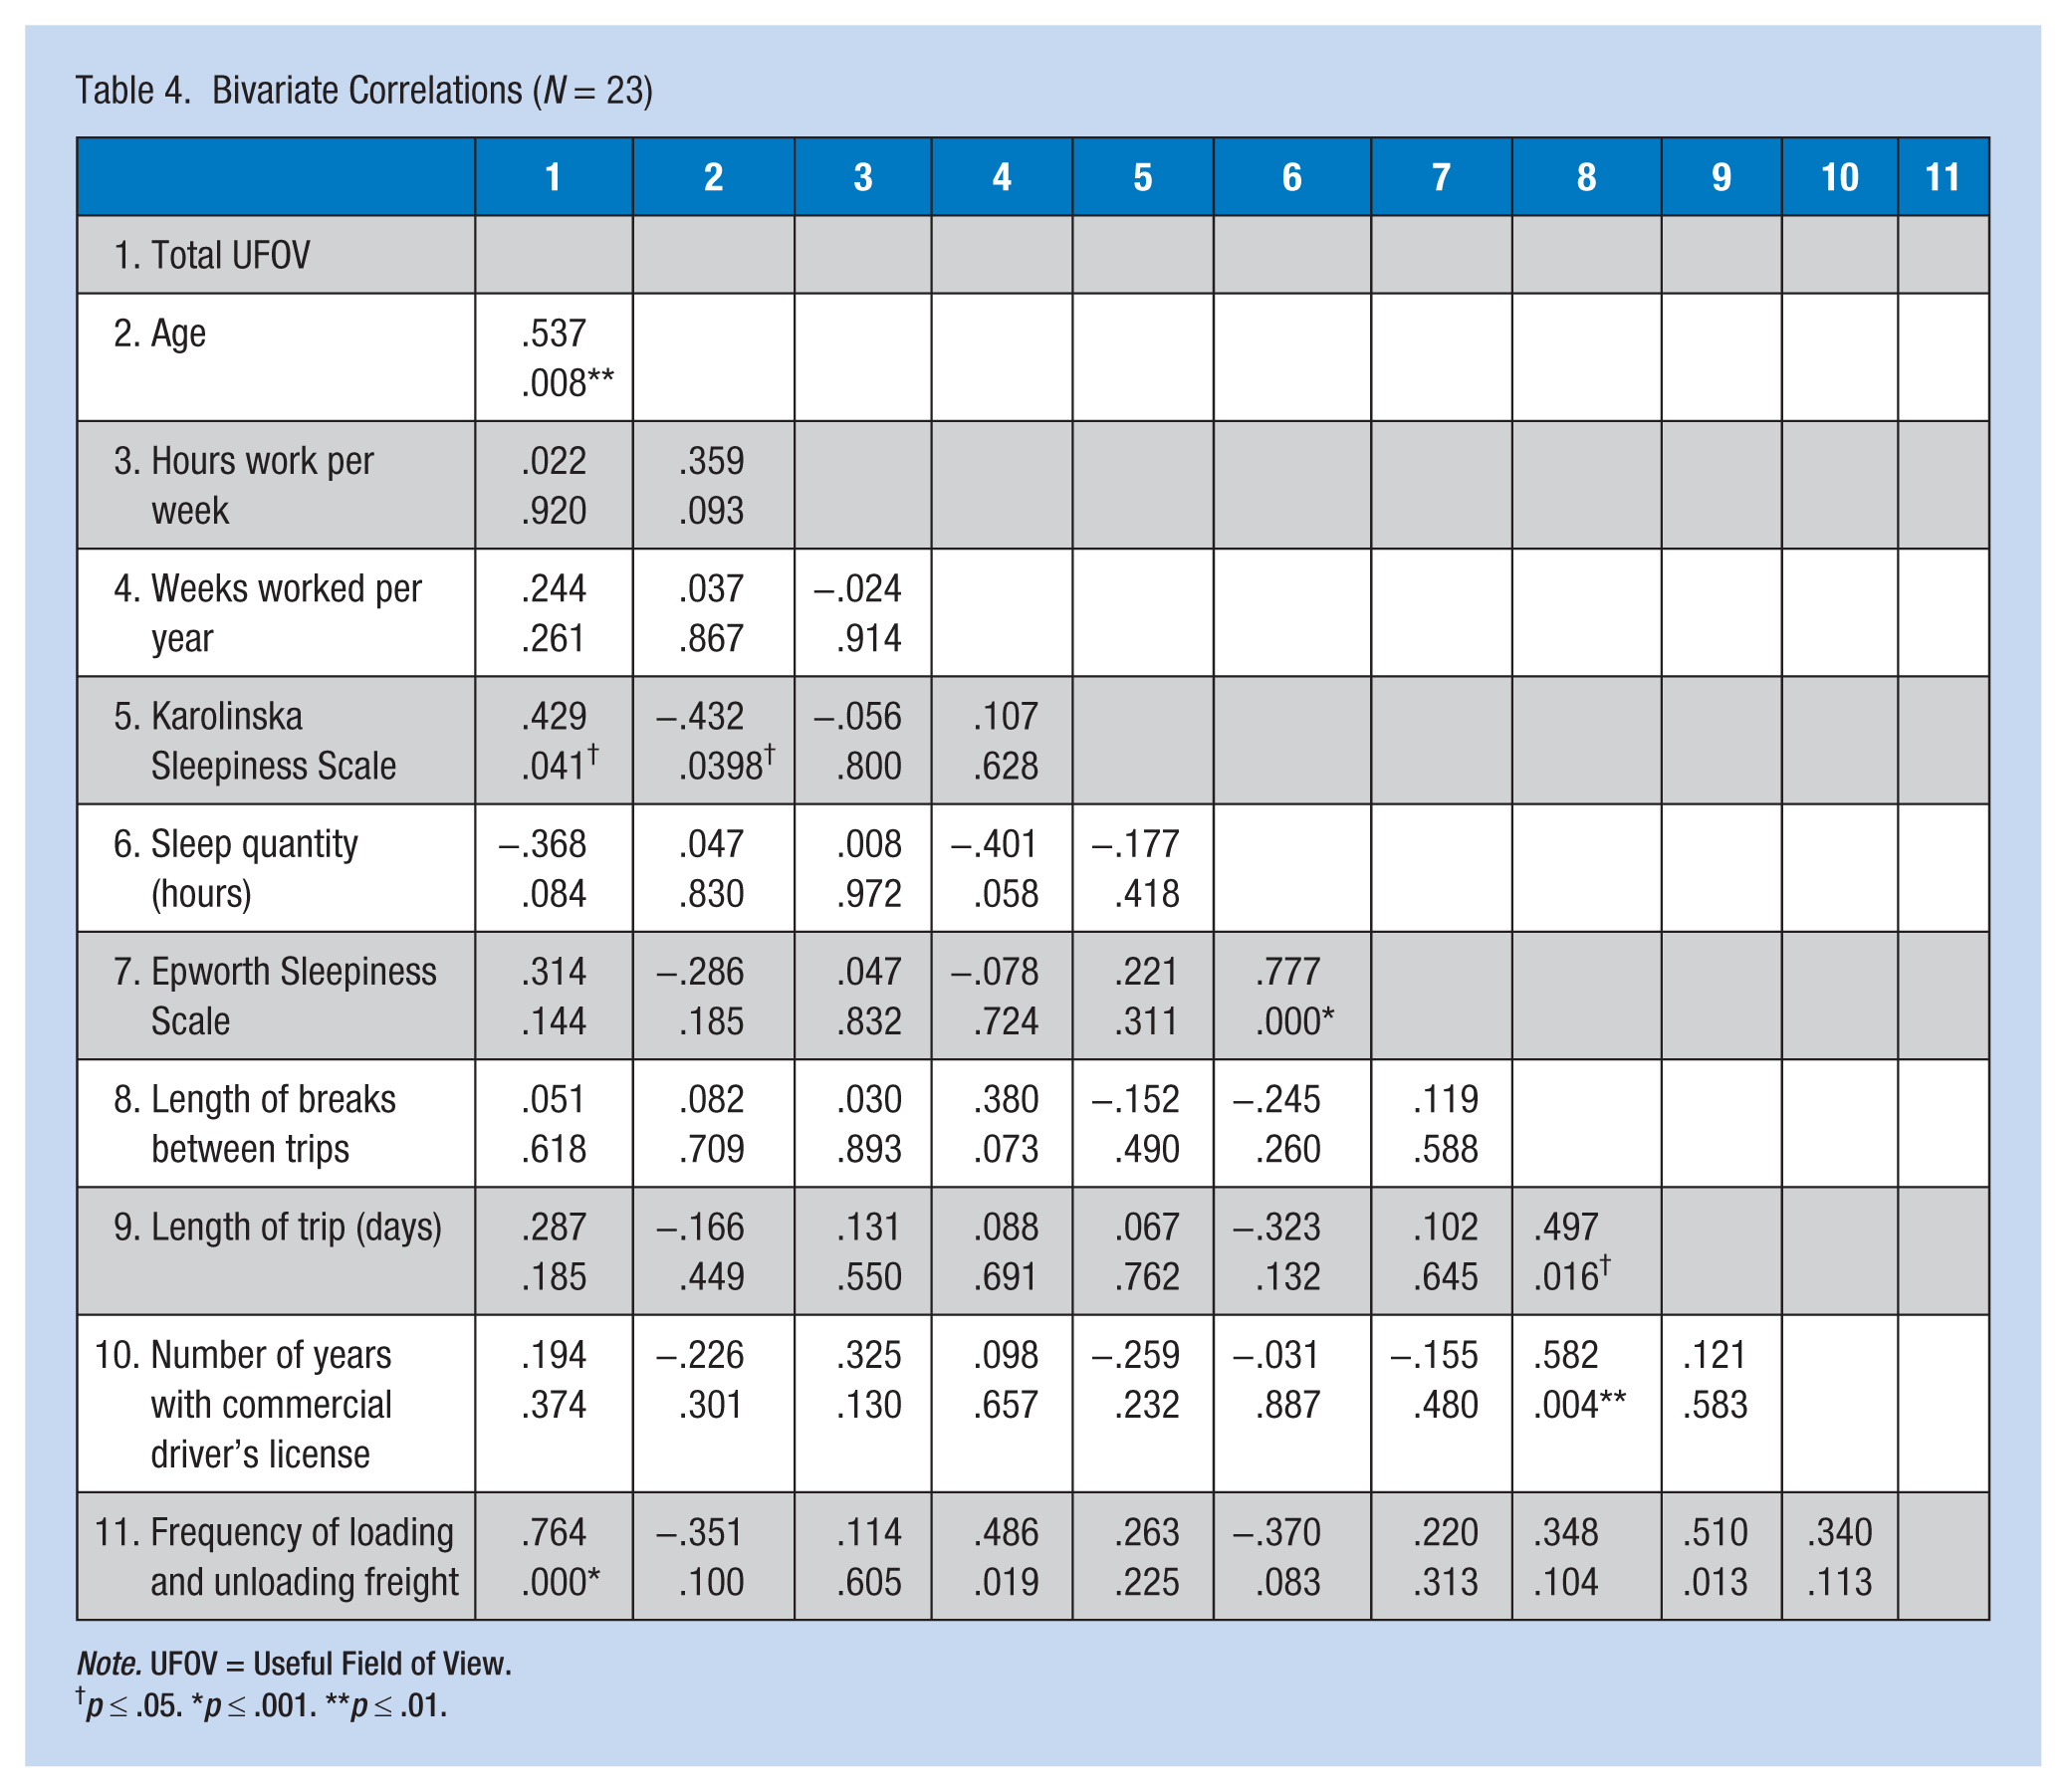
Note. UFOV = Useful Field of View.
p ≤ .05. *p ≤ .001. **p ≤ .01.
Because no strong intercorrelation between the variables significantly associated with UFOV was found, multicollinearity was not a concern. Therefore, age, sleepiness, and frequency of loading and unloading freight were entered into a multiple regression model which yielded R² = .686, F = 13.80, p < .001. As can be seen in Table 5, frequency of loading and unloading freight was statistically significant, and associated with positive regression weights. Age and sleepiness, as measured by the Karolinska Sleepiness Scale, did not contribute to the final predictive model for visual processing speed (UFOV).
Predictors of Total Useful Field of View Score (N = 23)
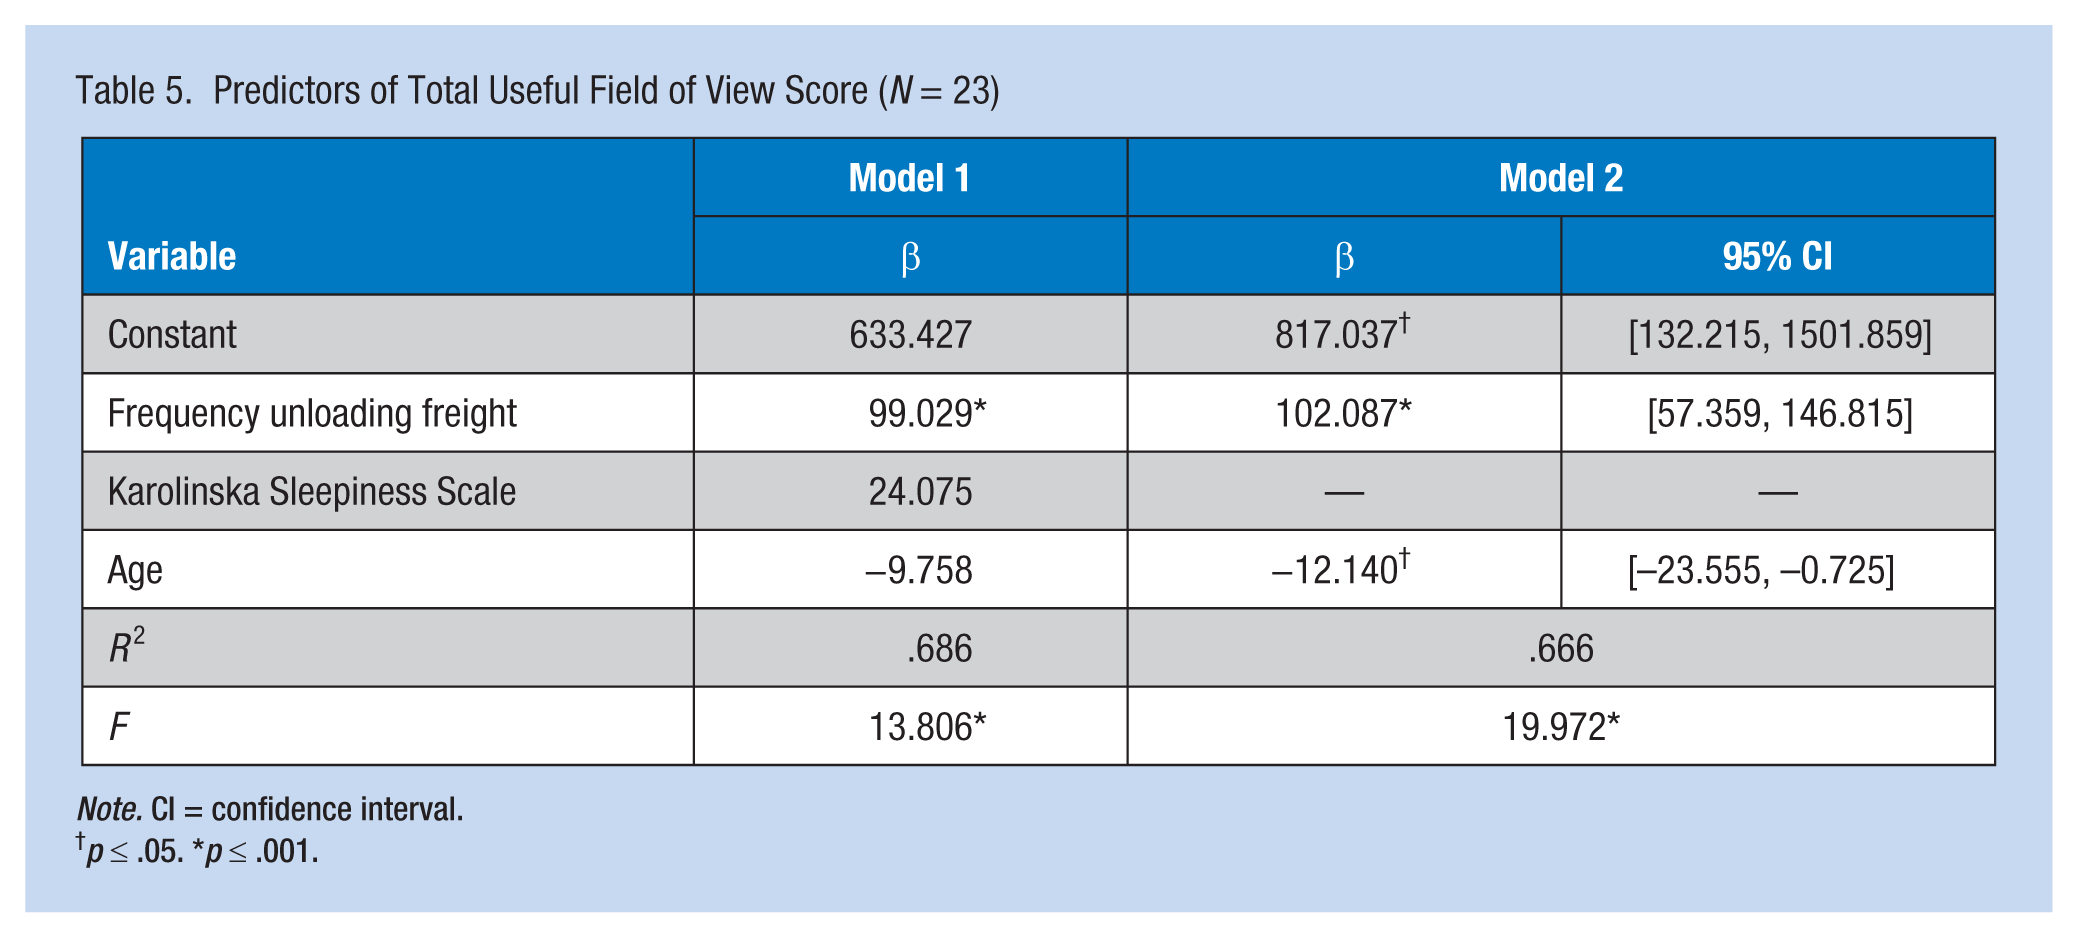
Note. CI = confidence interval.
†p ≤ .05. *p ≤ .001.
Discussion
To the best of the researchers’ knowledge, this pilot study is the first to examine relationships between sleep, work practices, and visual processing speed among older commercial drivers. Interesting relationships emerged from these analyses. It was surprising that neither age, sleep, nor medication use influenced visual processing speed in this group of participants. It is possible that logic can explain these findings. First, the mean age of the sample was 56 years, still a relatively young group. It is possible that age-related cognitive decline is not seen until later in life. Also, the instrumentation used to measure visual processing speed may explain why decline was not seen in this age group. As previously stated, UFOV is a reliable screener and predictor of poor driving performance for participants ages 65 years and older. Perhaps UFOV performs differently in a group of commercial drivers younger than 65 years of age. It is also possible that the time spent driving promotes maintenance of visual attention/visual processing speed that is not seen in aging passenger vehicle drivers who do not drive as much. Among this group of truck drivers, only two were classified as moderate to high risk for experiencing a MVC within 5 years based on their UFOV subscale scores. The remaining 21 had UFOV scores that classified them as either very low risk (n = 16/69.5%) or low risk (n = 5/21.7%).
Sleep quantity and propensity were not significantly correlated with visual processing speed. This finding was unexpected because of what is known about sleep deprivation and other measures of cognition. However, this group of participants did not describe themselves as particularly sleepy, nor with high propensity for sleep. Although initially, the Karolinska Sleepiness Scale was significantly and positively correlated with UFOV, it did not contribute to the final predictive model.
Most likely, this finding is related to participants who did not report excessive sleepiness. Participants did indicate some signs of obstructive sleep apnea, although they had not been diagnosed with the disorder. This finding was noted by the frequent reports of snoring that disturbed others, witnessed apnea, and mean BMI. In spite of these findings, continuous variables related to obstructive sleep apnea were not significantly correlated with visual processing speed. This finding is not consistent with the literature that showed direct effects of obstructive sleep apnea on visual attention and visual processing speed (Tippin, Sparks, & Rizzo, 2009), but again, these participants had not been diagnosed with obstructive sleep apnea. In the preliminary analyses, medication use was not significantly associated with processing speed in this group of participants. Very few medications were actually used by the participants which might explain the lack of significant correlation between medication use and processing speed as measured by UFOV. Frequency of loading and unloading freight was included in the regression analysis because of the suggestion in the literature that physical fatigue may negatively impact cognitive function. In this study, frequency of loading and unloading freight was significantly associated with UFOV, and explained almost 64% of variance in UFOV. Although commercial drivers are not typically considered physically active, some commercial drivers, such as flatbed drivers, perform significant physical activities such as securing loads with chains, straps, and tarps; climbing and jumping; overhead reaching; cranking handles; and using levers. The physical fatigue associated with these activities may contribute to prolonged UFOV measures (worsening) that threaten driving performance. It may be that commercial drivers who are physically active require rest and hours of service periods that differ from those of drivers who are not as physically active.
Although the findings form this pilot study are thought-provoking, they should be considered with caution. The size of the sample does not allow generalization of findings beyond the 23 participants. In spite of the interesting classifications of 5-year MVC risk that were described, due to the cross-sectional nature of the study, confirmation of these findings is not possible. Future studies should include validation of these risk classifications among truck drivers. In spite of the limitations of the study, the suggestion of relationships between physical fatigue and visual attention/processing speed in commercial drivers is intriguing and worthy of future studies. More powerful studies with larger samples examining relationships between these variables should be conducted. Also, objective measures of sleep should be included in future studies to avoid self-report bias. Finally, in the practice arena, providers of occupational and primary health care services to commercial drivers should evaluate their ability to perform more physically active tasks than driving; and should counsel drivers and employers regarding how physical fatigue may impact visual attention/processing speed, driving, and other activities associated with injury risk.
Applying Research to Practice
Findings from this research suggest that occupational health nurses should recognize the potential affect physical fatigue has on cognitive functioning among certain groups of truck drivers. Occupational health nurses should counsel drivers on the potential impact of physical fatigue on driving safety.
Footnotes
Conflict of Interest
The author(s) declared no potential conflicts of interest with respect to the research, authorship, and/or publication of this article.
Funding
The author(s) disclosed receipt of the following financial support for the research, authorship, and/or publication of this article: funding (Heaton) from the Deep South Center for Occupational Health and Safety Pilot Feasibility Program (T42OH008436).
Author Biographies
Karen Heaton is the director of Occupational Health Nursing in the Deep South Center for Occupational Health and Safety (T42OH008436) and the coordinator of the PhD Program at the University of Alabama at Birmingham School of Nursing (UABSON).
Benjamin J. McManus is a PhD Student in the Department of Psychology at the University of Alabama at Birmingham.
Rachael Mumbower is a PhD Student at the UABSON.
David E. Vance is a professor at the UABSON.