
Abstract
Stock market development (SMD) which triggers economic growth can be achieved with good governance proxies. The importance of these two variables in economic growth is the starting motivation of this study. The paper aims to examine the relationship between governance indicators and stock market development and find answers to whether there is a discrepancy between developing and developed countries via Fragile Five and G8 countries by using ARDL and NARDL models, 1996 to 2020 annually. Empirical analyses on the base of the corresponding relation gave results in favor of developed countries. Besides the results of the paper, the key finding involved the fact that although World Governance Indicators of the World Bank could explain the changes in SMD index in G8 countries; additional independent variables and/or other SMD indexes were needed for determining what exactly explained or influenced SMD in other Fragile Five countries except for Brazil. The convenient result for G8 countries shows the discrepancy between developed and developing countries in terms of governance indicators and SMD and supports the aim of the paper.
Introduction
Within the scope of globalization movements all around the world, the effective functioning of the state assumes a great deal of importance throughout the evolving process of developing countries into developed countries. The concept of good governance, which is among the basic criteria for an effectively functioning state mechanism, has strengthened its place within the globalization process. Good governance in the private sector is concerned with the extent to which an organization may accomplish its mission, project its vision, minimize current and potential risks, and optimize its performance.
Good governance in the public sector consists of a set of concepts designed to provide scarce public resources in compliance with priorities such as accountability, transparency, political stability, rule of law, human rights and democracy, equality, and inclusiveness, the balance of authority–responsibility, media freedom, and broad–based participation. Good governance covers not only state institutions and their operations but also the private sector and civil society organizations (Rotberg, 2004). An efficiently functioning government mechanism is one of the most fundamental factors for the formation of well–functioning financial systems. Nonetheless, the stock market and its development, as part of a well–functioning financial system, also play a crucial role in the maintenance of economic growth (Garcia & Liu, 1999, p. 30). The relationship between stock market development and growth may be achieved with governance proxies, which involve the key point of departure for this paper. Levine and Zervos (1998a) conducted the first study to present Stock Market Development (SMD) as quantitative indicators in six different manners. These indicators are as follows:
Total capitalization/GDP, Total value traded/GDP, Volatility, Turnover, International Arbitrage Pricing Model (IAPM), and International Capital Asset (ICAPM)
Stock market turnover (percentage of GDP) is used as the SMD indicator in some papers such as Levine and Zervos (1996), Levine and Zervos (1998a), F. M. Ajide (2019), Khan et al. (2020), and Islam and Bilal (2021). The SMD proxy, which is considered the dependent variable in this paper, is calculated as turnover for all the sample countries based on these studies.
Governance Indicators have been categorized into two different groups such as single and aggregated within the historical process. There are many different governance indicators generated in the World Bank, OECD, Eurostat, different centers, universities, and international institutions using poll, survey, and aggregated types and involving different numbers of countries (DESA, 2007; Kaufmann & Kraay, 2007; Kaufmann et al., 2011; Williams & Siddique, 2008). The Worldwide Governance Indicators (WGI) by the World Bank on six dimensions of governance for over 200 countries and territories between the 1996 and 2020 periods are utilized in this paper. These six dimensions of WGI combine the views of many enterprises, citizens, and expert survey respondents in both developing and developed countries (World Bank, 2022).
The paper aims to figure out the relationship between governance indicators and SMD and to find answers to the hypothesis that there is any discrepancy between developing and developed countries. This aim serves to the importance that SMD which triggers economic growth, can be achieved with good governance proxies. As developing countries Fragile Five Brazil, India, Indonesia, South Africa, and Turkey were taken as samples. The common reasons for these five countries to be gathered are high inflation, weak growth, high external deficit, and high dependence on hot money. As developed countries G8 countries such as Canada, France, Germany, Italy, Japan, Russia, the United Kingdom, and the United States were taken as versus sample. These eight developed countries constitute approximately 65% of the world economy. In the paper, as the dependent variable SMD, it was used the turnover ratio for SMD. Governance indicators as independent variables, it was addressed the selected governance indicators from the World Bank as WGI: political stability and absence of violence/terrorism; voice and accountability; rule of law and regulatory quality. In the literature, various papers consider different proxies of different institutions into consideration as governance indicators (Arndt & Oman, 2006; DESA, 2007; Kaufmann et al., 1999; Kaufmann et al., 2005, 2007, 2011; Williams & Siddique, 2008).
After the introduction part, Section 2 reviewed the literature via three subtitles as studies conducted on governance indicators, SMD, and particularly governance indicators–SMD together. Section 3 explained the methodology, data collection, and econometric model. Section 4 presented empirical evidence and analysis results including summary statistics of independent and dependent variables, the regression results, and the correlations between selected governance indicators and SMD by comparing Fragile Five and G8 countries statistics. Section 5 discussed the analysis results with literature review studies and Section 6 finalized with a conclusion with recommendations.
The originality of the sample and the hypothesis can be the contributions to the literature that studies the relationship between stock market development and government indicators. By including four of the total six governance indicators, the effects of transparency, accountability, and trust in the country, the rule of laws, and their applicability on SMD in 13 developing and developed countries were analyzed.
Literature Review
The literature review included the studies especially indexed on the Web of Sciences by terminological order. Firstly, the literature was given on good governance and SMD separately to achieve their relation with economic growth; secondly, the literature that examined good governance and SMD in the same studies. The crucial studies were explained with their hypotheses, results, and conclusions. Good governance would be appropriate to begin with Kaufmann and Kraay (2002), who created the governance indicators database, as the first example of the studies that have been conducted in this field so far. Further examples are Mauro (1995), Kaufmann et al. (2005), Arndt and Oman (2006), Shafique, et al. (2006), Han et al. (2014), Vinayagathasan and Ramesh (2019), and Bilan et al. (2019) studied the impact of WGI on economic growth.
There are studies in the literature indicating SMD as a variable that sheds light on future economic growth predictions (Adjasi & Biekpe, 2006; Atje & Jovanovic, 1993; Caporale et al., 2004; Cunha & Samanez, 2013; Dailami & Atkin, 1990; Demirgüç–Kunt & Levine, 1996; Garcia & Liu, 1999; Hatipoglu, 2020; Levine & Zervos, 1996; Levine & Zervos, 1998b; Naceur et al., 2007; Singh, 1997; Sukcharoensin & Sukcharoensin, 2013).
Kobrin (1979) and Aggarwal et al. (1999) emphasized that political risk, an indicator of government effectiveness, increased volatility of national stock markets. Beaulieu et al. (2006) investigated the short–term impact of political uncertainty, as a governance indicator, on the stock returns of Quebec firms during the 1995 Quebec referendum. Diamonte et al. (1996) defined political risk as a significant determinant of stock returns in emerging markets compared to developed markets. It is concluded that political risk has decreased in emerging stock markets and increased in developed markets.
Hooper et al. (2009) presented evidence on the effects of the governance indexes such as level of corruption, efficiency of government, political climate, and regulatory authority on the returns to shareholders in the stock market. Wong (2009) mentioned the substantial evidence between transparency in governance and SMD. Asongu (2012) investigated the extent to which government policies and institutions affected stock market performance by testing government quality dynamics as governance indicators.
K. B. Ajide (2014) tested the relationship between the stock market performance and governance indicators by utilizing the ARDL approach in Nigeria. The positive relation between governance indicators and stock market performance showed an increase in any of the governance indicators was expected to increase the value of stock market performance. Boadi and Amegbe (2017) investigated the link between the quality of governance and stock market performance within 23 countries between the 1996 and 2014 periods. According to F. M. Ajide (2019), the weaknesses of the governance system and its mismanagement of the economy were the significant problems of the Nigerian stock exchange market. Regulation quality with adequate respect for the rule of law, avoided violence, political instability, and tackling corruption were the most important factors for investors in the Nigerian stock market.
Appiah et al. (2020) studied financial development, institutional quality, and economic growth in 15 emerging economies within the Economic Community of West African States (ECOWAS) – 15 member countries, located in the Western African region- between the periods of 1996 and 2017. In the first result, financial development had no significant and positive impact on economic growth and in the second, regulatory quality increased growth, and control of corruption reduced growth, as institutional quality variables and also government indicators in the paper. Islam and Bilal (2021) studied the relationship between governance indicators, obtained from the World Bank WGI and SMD of Pakistan via ARDL and NARDL. The ARDL results indicated that two different indicators, political stability and absence of violence/terrorism and rule of law did not directly affect the SMD of Pakistan. Voice and accountability positively affected, and regulatory quality negatively affected SMD significantly. Contrarily, the NARDL results indicated significant differences among coefficients of components of governance indicators, denoting asymmetric links between the variables. The positive and negative sums of partial decompositions of rule of law, regulatory quality, political stability and absence of violence/terrorism, and voice and accountability indicators had significant impacts on SMD.
Darsono et al. (2022), as one of the newest studies investigating the relationship between governance indicators and SMD, employed panel data from six Asian countries. The empirical results indicated that as governance indicators political stability and absence of violence and regulatory quality had a positive effect on sustainable investment returns in the Asian region. Fagbemi et al. (2022), the other newest paper, found the possible short–term and long–term impacts of regulatory quality as a governance indicator on SMD in Nigeria between the 1996 and 2019 periods. The results of the empirical analysis indicated that regulatory quality positively and significantly influenced SMD.
Appiah et al. (2023), in their study, investigated the complex asymmetric relationships of exchange rates, financial development, and oil prices in Ghana between 1990 and 2017 using a non-linear model. They found that the global oil price had asymmetric effects on short- and long-term growth, and positive price changes produced different results than negative changes. However, no evidence has been found for the long-term asymmetric effect of exchange rates and financial development on growth. There were only short-term asymmetries.
Chang et al. (2023) estimated the cointegration between financial organizations and sustainable energy performance in their studies. The findings showed that, among the E7 economies, China was well ahead of other countries in terms of energy performance and Russia ranked second in the group. While Indonesia and Turkey rank fourth and fifth respectively, it was stated that they had demonstrated excellent performances in terms of sustainability. It was determined that the lowest scores in this ranking were in Mexico and Brazil. The study recommended effectively increasing financial inclusion to achieve sustainable economic growth for developing countries.
In this paper, the relationship between governance indicators and stock market development was examined to find out answers to whether there is a discrepancy between Fragile Five as developing and G8 as developed countries by using ARDL and NARDL models, 1996 to 2020 annually with the light of the literature review in stock market development and government indicators as the triggers of economic growth.
Methodology, Data Collection, and the Model
In this paper, stock market turnover (percentage of GDP) was used as SMD (dependent variable) for the 13 countries in the empirical model generated for the G8 countries on behalf of developed countries and Fragile Five countries on behalf of developing countries; whereas the independent variables consisted of regulatory quality (RQ.EST), rule of law (RL.EST), voice and accountability (VA.EST), and political stability and absence of violence/terrorism (PV.EST) were among the six indicators defined as the World Bank WGI.
The widest observation range covered the years 1996 when the WGI obtained from the World Bank (2022) legal website was first used, and 2020, when they were last announced, and the SMD index values over these years are included in the panel dataset, created by using the E–views 10 software package. In the empirical analysis, firstly, the stationarity of the variables was examined by performing the unit root test. The reason for performing the unit root test is a time series, which is stationary at I(2) level, cannot be utilized in the ARDL analyses.
Secondly, to detect the existence of the cointegration relationship among the variables, the ARDL model was established and the bounds test was performed. Cointegration tests are applied to examine the long-term relationship between variables. Classical cointegration tests require the variables to be stationary to the same degree. This situation creates a limitation for cointegration tests. However, Pesaran et al. (1996) suggested the ARDL approach, which allows testing the relationship between variables that are stationary to different degrees (Bahmani-Oskooee & Chi Wing Ng, 2002, p. 150).
The ARDL approach is based on the least squares method. Unlike classical cointegration analyses, it is not necessary to apply a unit root test beforehand in ARDL analysis. The reason for this situation is that variables do not need to be classified as I(1) and I(0; Sharifi-Renani, 2008, p. 4). The main advantage of the ARDL model is that cointegration tests can be performed and meaningful results can be obtained whether the variables are I(1) or I(0; Paudel & Jayanthakumaran, 2009, p. 137). Another important advantage is that it can be applied to small samples (Kamaruddin & Jusoff, 2009, p. 100). For all these reasons, the ARDL bounds test model was used to examine cointegration relationships in the study. In short, the ARDL method helps the model for the dynamic interactions between current and past data of dependent and independent variables and contributes to the understanding of long-term relationships between variables.
Thirdly, the short–term significance of the cointegration relationship was determined by establishing an Error Correction Model (ECM) for the variables whose cointegration relationship was detected by performing the ARDL bounds test. The error correction term is a lagged value of the residuals of the model from which the long-run relationship is obtained. The coefficient of this variable shows how much of an imbalance that occurs in the short term will be corrected in the long term. At the same time, the expectation is that the sign of this coefficient will be negative. In other words, the ECM (Error Correction Model) establishes a connection between cointegration relationship in the short-term and long-term. It gives the correction rate of the deviations between the short-term and the long-term values of the dependent variable in the next period.
The ARDL method is a symmetric and linear method. It is based on the assumption that the effects of increases and decreases in independent variables on the dependent variable are in the same direction. Symmetric analyses accept the effect size of negative and positive shocks in independent variables on the dependent variable. However, asymmetric analyses are to take into account the effects of the size of negative and positive shocks.
The reasons for preferring asymmetric method include the series used in the analysis not conforming to normal distribution, significant structural breaks within the scope of the study, and failure to detect a significant relationship in analyses conducted with symmetric method. In addition, the unique characteristics of the variables used in the analysis may cause asymmetric methods to be preferred. In particular, if an analysis includes a variable related to taxes or public expenditures, it is likely to be affected by the preferences of the political party or party groups that form the government. It should not be ignored that asymmetric effects may arise due to political preferences. As a result, in practice, examining the asymmetric relationship in variables with high volatility over time, such as stock market data, allows for deeper analysis compared to a symmetric examination. This reveals the fact that the examination will yield healthier results.
In the fourth part of the study with all these detailed reasons, the NARDL test was performed for the variable pairs determined by the ARDL model to detect cointegration relationships among them, and it was examined whether or not the cointegration relationship exhibited asymmetrical features. Granger and Yoon (2002) stated that if the positive and negative components of two variables are cointegrated with each other, there is hidden cointegration between the variables. As a result, they introduced the term hidden cointegration. Therefore, the NARDL cointegration model developed by Shin et al. (2014) allows the detection of hidden cointegration between variables. In addition, the NARDL model can also take into account asymmetric effects that may occur in the short and long term. Finally, for those with asymmetric cointegration relationships, positive and negative coefficients were determined and interpreted.
There are several important limitations in terms of designing the study and collecting data. Since 1996 was the year when World Governance Indicators of the World Bank started to be announced, 1996 was chosen as the starting year for the data set of the study. Since WGI values are announced annually, SMD values of relevant countries are also considered annually. For this reason, the time range for the data set to be examined was determined as 1996 to 2020 and the annual values of the variables were used. In the study, annual data was used due to the nature of the variables considered and the reasons arising from the periods of public announcement.
Higher frequency data sets can be used for variables where shorter term data can be obtained. It is thought that if higher frequency data sets are used for future studies, a more detailed interpretation can be made and the possibility of periodic comparison will increase. In addition to these limitations, since the research is limited to the Fragile Five and G-8 countries, the applicability of the results all over the world decreases. The analysis ignores other macroeconomic factors that would affect the relationship between SMD and WGI indicators. The final limitation is that secondary data cannot fully capture the nature of the relationship between variables.
The main research question of the study is whether there is cointegration between WGI values and SMD values of relevant countries. For this purpose, the following hypothesis will be tested to test the existence of cointegration in the ARDL model to be established;


To test these hypotheses, an F statistic is calculated with the Wald test. The F statistic obtained here is compared with the significance levels derived asymptotically in the study of Pesaran et al. (2001). In this study, values are shown by giving lower and upper values. If the calculated F statistic is less than the lower bound, the null hypothesis will not be rejected and it will be concluded that there is no cointegration between the variables. If the calculated F statistic is greater than the upper limit, the null hypothesis will be rejected and it will be concluded that there is cointegration between the variables. In the third and last case, if the calculated F statistic remains between the lower and upper limit values, then the calculated F statistic value will be in the region of instability and no comment can be made as to whether there is cointegration between the variables (Banerjee et al., 1998; Kremers et al., 1992).
The use of annual data in the study may result in a relatively low sensitivity of the findings obtained as a result of the analysis. In short, analyses made with annual data may prevent the effects of periodic structural breaks that may occur in shorter periods from being revealed. This situation constitutes another limitation of the study. However, such an analysis cannot be made with the variables in question for a time period narrower than annual data. Table 1 summarizes the methodology of the model.
Summary of the Analysis Methodology.

The empirical analysis process in this paper is initiated with the ADF unit root test introduced by Dickey and Fuller (1979). This paper, proceeds based on the model with constant in Equation 1.

The ARDL boundary test approach, the boundary test unrestricted error correction model (UECM) model is generated as follows (Narayan and Smyth, 2008, p. 337; Pesaran & Shin, 1999, p. 3; Pesaran et al., 2001, p. 290).

The model to be established is estimated by the Least Squares Method (LSM). Equation 3 indicates the long–run relationship of the variables.

The coefficient of the term ECM in Equation 4 defines the extent to which the inconsistency in the short–run would be corrected in the long–run. The error correction term is expected to be negative and significant.

In the NARDL model by Shin et al. (2014), nonlinear relationships are determined by considering the short– and long–term asymmetry among the variables.


In the model shown in (5), (L) denotes the lag length value and


In the next phase, with the help of the Wald test, it is examined whether or not it has long–term symmetry (

Analysis Results
The Results of Fragile Five Countries
The analysis of the Fragile Five countries in the paper is first initiated by performing the ADF (Augmented Dickey–Fuller) unit root test on the variables as α = .10. Upon taking the second difference of the VA.EST variables for India and Turkey, as two of the fragile five countries, the series becomes stationary. A time series, which is stationary at I(2) level, cannot be utilized in the ARDL analyses. Therefore, these two variables are excluded from the other analyses by which the relationships are measured. It is determined that all other variables belonging to the other Fragile Five countries are stationary at I(0) or I(1) levels, and therefore there is no drawback in utilizing them in the cointegration analysis.
In the next phase of this paper, separate ARDL models are established using SMD as the dependent variable and RQ.EST, RL.EST, VA.EST, and PV.EST as independent variables for the ARDL test to be performed for the Fragile Five countries. The long–term coefficients and cointegration relationship among the variables are examined by performing the ARDL limit test, and all the analysis results are summarized in Table 2.
ARDL Results of Fragile Five Countries.

Null hypothesis: There is no Heteroskedasticity α = 0.10.
Null hypothesis: There is no Serial Correlations α = 0.10.
Null hypothesis: There is no Specification Error α = 0.10.
Null hypothesis: There is no Cointegration α = 0.10.
In Table 2; the heteroscedasticity problem in the model established between SMD–RQ.EST for Turkey; both serial correlation and model-building error problems in the model established between SMD–RQ.EST for Indonesia; the heteroscedasticity problem in the model established between SMD – RL.EST for Brazil. In the ARDL models, the cointegration relationship between SMD–RL.EST for India; the cointegration relationship between SMD–RQ.EST for South Africa and Brazil; the cointegration relationship between SMD–VA.EST for Indonesia and Brazil; and the cointegration relationship between SMD–PV.EST only for Brazil is detected. A noteworthy result suggests that all four independent variables for Brazil, except for RL.EST, have cointegrated relationships with SMD. The ARDL models for the Fragile Five countries, the error correction model and the analysis results regarding whether or not the cointegration relationship is significant in the short–run are summarized in Table 3.
Cointegration Relationships of Fragile Five Countries.

The short–term coefficient for the cointegration relationship between SMD–VA.EST in the ARDL model established for Indonesia as a result of the error correction model is calculated as −0.7098 and it is a significant coefficient. Once a deviation from equilibrium occurs, approximately 70% of the deviations are corrected within a period and this dependent variable returns to equilibrium in approximately 1.5 years. Similarly, as a result of the analyses conducted for Brazil, the short–term coefficients of the independent variables VA.EST and PV.EST are found significant. Although approximately 40% of a shock in SMD is offset by VA.EST within one period, approximately 58% of the resulting difference is compensated by PV.EST. In the next part of the study, as a result of the analyses conducted for the Fragile Five countries, the NARDL test is performed for the variable pairs whose short–term coefficients are significant, and it is determined whether or not an asymmetrical impact exists in the cointegration relationship. The NARDL test results are presented in Table 4.
NARDL Results of Fragile Five Countries.

Note. Null hypothesis: There is no Cointegration α = 0.10.
After establishing the NARDL model, both positive and negative impacts of the independent variable are included in the model through coefficients. Then, whether or not significant differences exist among these coefficients is determined by the Wald Coefficient Test. As can be seen in Table 4, three relationships are found to be asymmetrical at α = 0.10 significance level. As a result of the analysis, an asymmetrical relationship exists between SMD–RQ.EST for South Africa. Besides, it is determined that an asymmetric cointegration relationship exists between SMD and both VA.EST and PV.EST for Brazil. After detecting the relationship, the positive and negative cointegration coefficients in Equation 9 are calculated and presented in Tables 5 to 7.
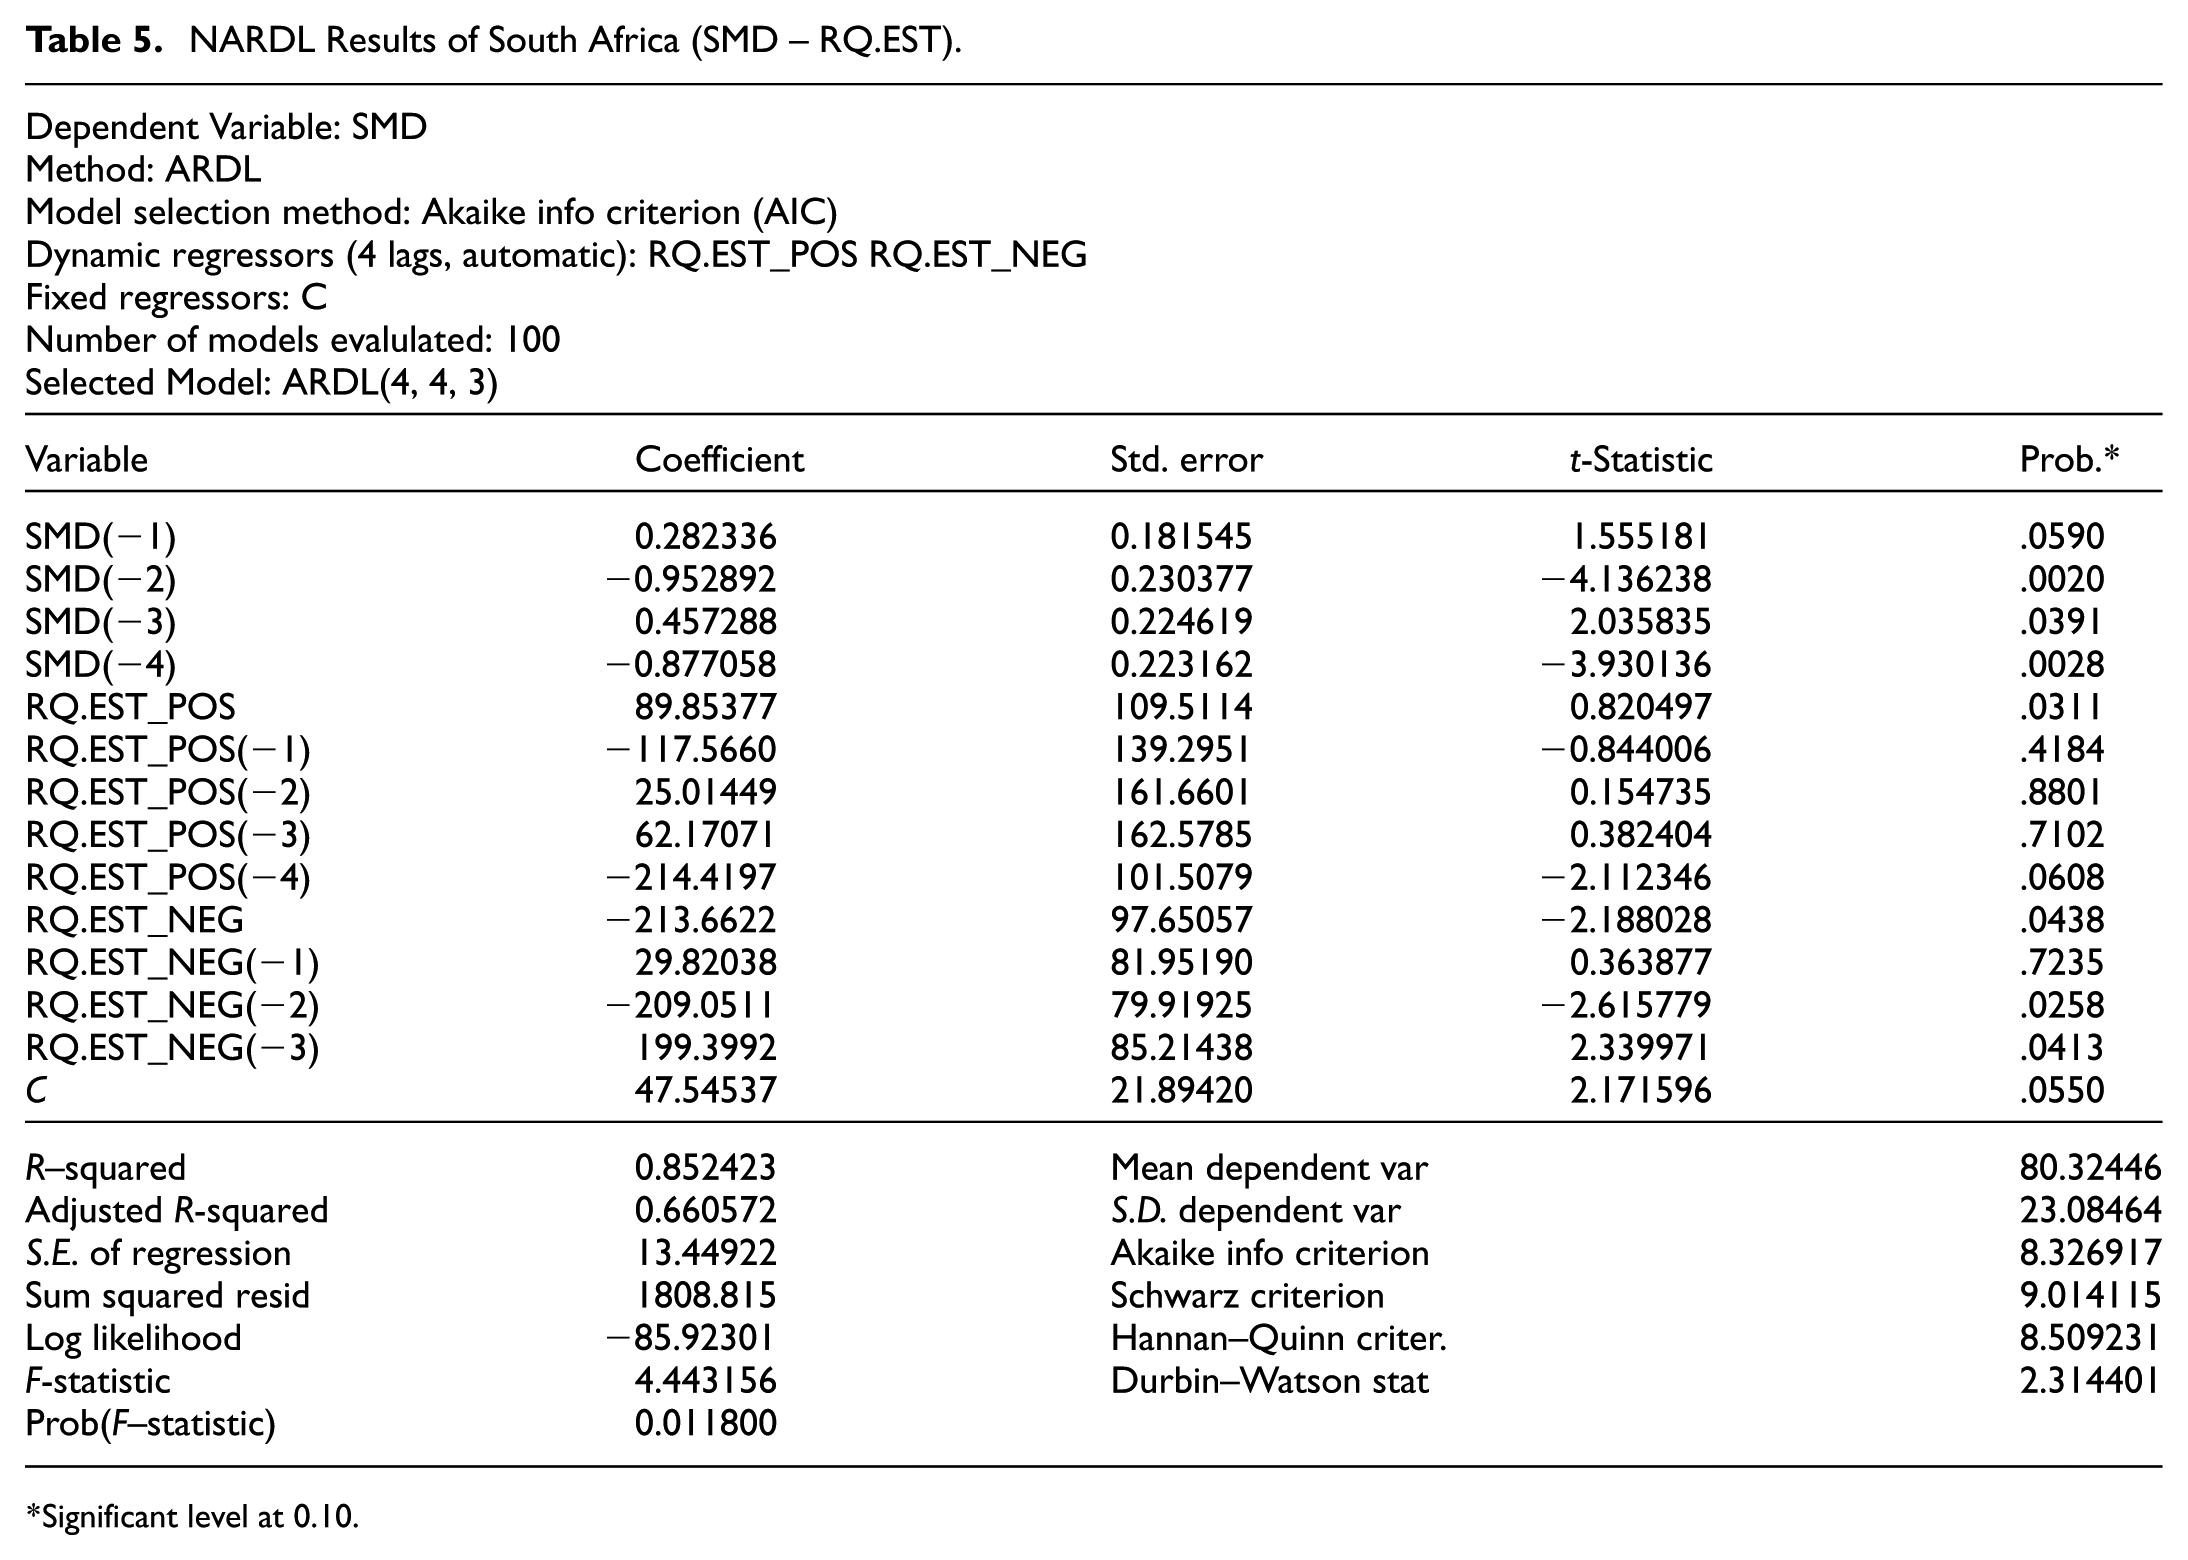
NARDL Results of South Africa (SMD – RQ.EST).
Significant level at 0.10.
NARDL Results of Brazil (SMD – VA.EST).

Significant level at 0.10.
NARDL Results of Brazil (SMD – PV.EST).

Significant level at 0.10.
In Table 5, the ARDL (4,4,3) model is determined as the most appropriate model regarding SMD–RQ.EST variables for South Africa. To determine the positive impact of the cointegration relationship, the sum of the ratios of the coefficients of SMD(−1), SMD(−2), SMD(−3), and SMD(−4) variables to the positive effect coefficient of the RQ.EST variable is calculated as (−0.0121), as expressed in Equation 9. In order to determine the negative impact of the cointegration relationship, the sum of the ratios of the coefficients of SMD(−1), SMD(−2), SMD(−3), SMD(−4) variables to the negative effect coefficient of the RQ.EST variable is calculated as (0.0051), as expressed in Equation 9. That is, a 1 unit increase in RQ.EST variable results in a 1.21% increase in SMD; however, when RQ.EST variable decreases by 1 unit, the SMD variable would be in an upward trend by 0.51%.
In Table 6, the ARDL (3,4,4) model is determined as the most appropriate model regarding the SMD–VA.EST variables for Brazil. The positive effect coefficient of the VA.EST variable was calculated as (−0.0087). The negative effect coefficient of the VA.EST variable was calculated as (−0.011). These obtained values indicate that a 1–unit increase in the VA.EST variable causes a 0.87% decline in the SMD variable, whereas a 1–unit decrease in the VA.EST variable leads to a 1.1% decrease in the SMD variable.
In Table 7, the ARDL (4,4,4) model is determined as the most appropriate model regarding the SMD–PV.EST variables for Brazil. The positive effect coefficient of the PV.EST variable was calculated as (−0.0413). The negative effect coefficient of the PV.EST variable was calculated as (−0.0183). These obtained values indicate that a 1–unit increase in the PV.EST variable leads to a 4.13% decline in the SMD variable; whereas a 1–unit decline in the PV.EST variable would cause a 1.83% decrease in the SMD variable. Figure 1 showed that Asymmetry multipliers for RQ.EST of South Africa, asymmetric links amid the variables under NARDL that give an asymmetric dynamic graphical presentation of this study.Similarly, Figure 2 shows the asymmetry multipliers for Brazil's VA.EST and the asymmetric correlations between variables under NARDL. Finally, Figure 3 shows the asymmetry multipliers for Brazil's PV.EST and the asymmetric relationships between the variables under NARDL.

Asymmetry multipliers for RQ.EST of South Africa.

Asymmetry multipliers for VA.EST of Brazil.

Asymmetry multipliers for PV.EST of Brazil.
Figure 1 shows that the positive multiplier of the regulatory quality (RQ) indicator for South Africa is usually near or below the base/zero line, whereas the negative multiplier is usually near and above the zero line. Although the negative multiplier effect causes the asymmetry curve (red dashed line) to assume positive values due to the inverse relationship detected as a result of the analysis; the positive multiplier effect causes the asymmetry curve to turn negative. It can be claimed that the impact of POS decomposition creates a larger asymmetry than the impact of NEG decomposition does. Since the POS multiplier causes greater volatility, it has a greater asymmetry impact on the SMD.
Figure 2 illustrates that the positive multiplier and negative multiplier of the voice and accountability (VA) indicator for Brazil are quite close to the base/zero line. Due to the negative relationship detected as a result of the analysis, both the negative multiplier effect and the positive multiplier effect cause the asymmetry curve to follow through, in general, the zero line or slightly below it. It can be claimed that the impact of POS decomposition creates a smaller asymmetric impact than the NEG decomposition does. The POS multiplier has a lower asymmetry effect on the SMD since it causes smaller volatility. The impact of VA on Brazilian stock market development as it is quite close to the zero line. The asymmetrical curve (red dashed line) usually reacts with quite a low volatility, but it gives a reaction with a high volatility in the long run.
Figure 3 indicates the asymmetric effects of the POS and NEG decompositions of the political stability and absence of violence/terrorism (PV) indicator for Brazil. It is seen that the positive multiplier is below the base/zero line and the negative multiplier is above the base/zero line. Due to the negative relationship detected as a result of the analysis, both the negative and positive multiplier effects cause the asymmetry curve to follow through, in general, below the zero line. It can be claimed that the impact of POS decomposition creates a larger asymmetric effect than that of NEG decomposition. Since the POS multiplier causes greater volatility, it has a higher asymmetric effect on the SMD. It is seen that the indicator of the political stability and absence of violence/terrorism is, in general, below the zero line in terms of its impacts on the stock market development of Brazil. The asymmetrical curve (red dashed line) usually exhibits quite a large volatility. Although the asymmetry curve is, in general, located between the POS and NEG multipliers, it lies below the baseline.
The Results of G8 Countries
The analysis of this paper conducted for the G8 countries is first initiated by performing the ADF unit root test as α = .10 to measure the stationarity of the variables belonging to the G8 countries. According to the results of the stationarity analysis, once the second difference of the VA.EST variables of both France and Italy, as G8 countries, of Italy is taken, stationarity would be fulfilled. A time series with I(2) stationary cannot be utilized in the ARDL analyses. Therefore, these two variables are excluded from other analyses by which the relationships are measured. Apart from these, all other variables belonging to the G8 countries are determined to be stationary at I(0) or I(1) levels, and therefore, there are no drawbacks in utilizing them in the cointegration analysis. In the next phase of the study, separate ARDL models are established using SMD as the dependent variable and RQ.EST, RL.EST, VA.EST, and PV.EST as independent variables for the ARDL test to be performed for the G8 countries, and all analysis results are presented in Table 8.
ARDL Results of G-8 Countries.

Null hypothesis: There is no Heteroskedasticity α = .10.
Null hypothesis: There is no Serial Correlations α = .10.
Null hypothesis: There is no Specification Error α = .10.
Null hypothesis: There is no Cointegration α = .10.
In Table 8, the heteroscedasticity problem occurs in the models established between SMD–RL.EST and SMD–PV.EST for Germany. For Canada, a model-building error problem is detected between SMD–RQ.EST. There is no cointegration relationship is found between Germany’s SMD and any of the four selected indicators. Moreover, it is seen that a cointegration relationship exists only between SMD–RL.EST for Great Britain, whereas no such relationship exists for the other three indicators. For Canada, no cointegration relationship is detected between SMD–RQ.EST and SMD–RL.EST and for France, no cointegration relationship can be detected between SMD–PV.EST. Apart from these, a cointegrated relationship exists in all other variable pairs. In order to examine the short–term significance of the cointegration relationships determined for the G8 countries, an error correction model should be established again as before, and it should be examined whether or not the cointegration relationship is significant in the short–run and the results are in Table 9.
Cointegration Relationships of G-8 Countries.

In Table 9, the short–term coefficient for the cointegration relationship between SMD–RQ.EST in the ARDL model established for France is calculated as −0.8299. Approximately 83% of the deviations are corrected within one period once a deviation from equilibrium occurs. The short–term coefficient for the cointegration relationship between SMD–RL.EST for France is calculated as −0.7404. Here, approximately 74% of the deviations are corrected within one period once a deviation from the equilibrium occurs. The short–run coefficient for the cointegration relationship between SMD–RQ.EST for Italy is calculated as −0.7963. Approximately 80% of the deviations are corrected within one period once a deviation from equilibrium occurs. Furthermore, the short–run coefficient for the cointegration relationship between SMD–PV.EST for Italy is calculated as −0.8058. After one period, approximately 80% of a possible shock ceases to exist. Upon considering the obtained results of the error correction model for Canada, once a deviation between SMD–VA.EST occurs, approximately 77.71% of the deviation is automatically corrected after one period. For Russia, approximately 63% of the deviation between SMD–RQ.EST and approximately 51% of the deviation between SMD–PV.EST ceases to exist within one period. There is also a significant short–term relationship between SMD–RL.EST for Great Britain. Approximately 56% of a possible deviation is automatically corrected within one period. Subsequently, upon considering the short–term relationships for the USA, once a deviation between SMD–RL.EST occurs, 57.16% of the deviation is corrected within one period, and once a deviation between SMD–PV.EST occurs, and approximately 94% of the deviation is observed to be eliminated within one period.
For the G8 countries, the NARDL test is performed for the variable pairs with cointegration relationships, and it is determined whether an asymmetric effect exists in the cointegration relationship, and the obtained results are presented in Table 10.
NARDL Results of G-8 Countries.

Note. Null hypothesis: There is no Cointegration α = .10.
In Table 10, both positive and negative impacts of the independent variable are included in the NARDL model through coefficients. Then, whether or not significant discrepancies exist among these coefficients is determined by performing the Wald Coefficient Test. As it can be seen in Table 9, two relationships are found to be asymmetrical at α = .10 significance level. As a result of the analysis, it is determined that asymmetrical relationships exist between SMD–VA.EST and SMD–PV.EST for Canada. For Canada, asymmetrical relationships are found between SMD–VA.EST and SMD–PV.EST. The NARDL test results obtained for Canada are presented in Tables 10 and 11, and the cointegration coefficients are obtained using these results.
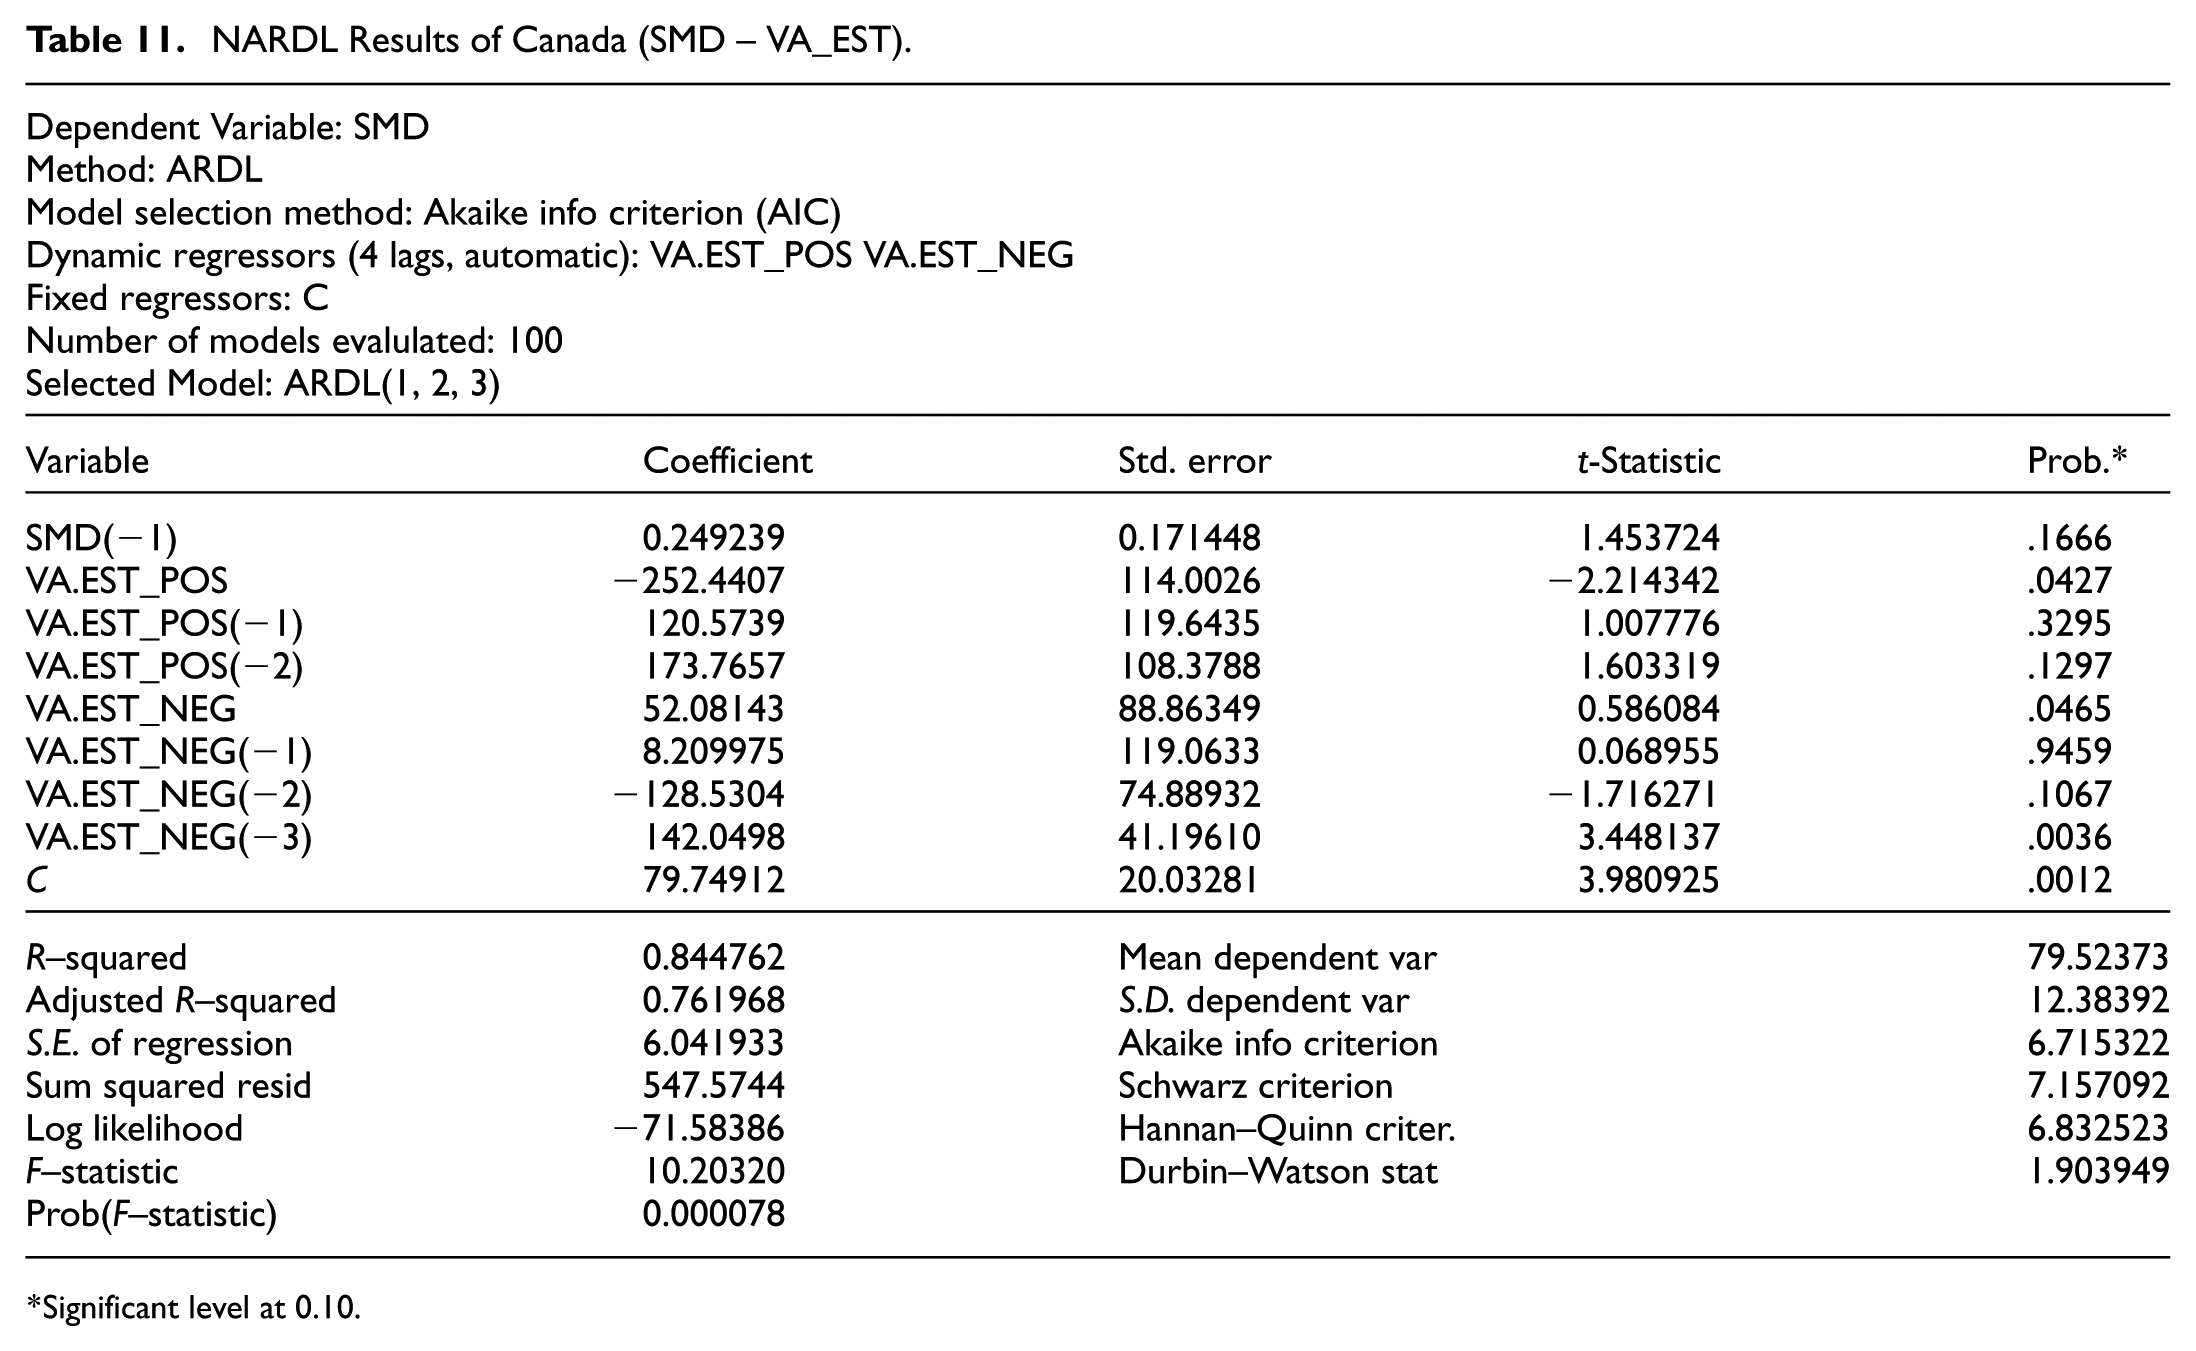
NARDL Results of Canada (SMD – VA_EST).
Significant level at 0.10.
In Table 11, the ARDL (1,2,3) model is determined as the most appropriate model regarding the SMD–VA.EST variables for Canada. The positive effect coefficient of the VA.EST variable was calculated as (−0.0009). The negative effect coefficient of the VA.EST variable was calculated as (0.0047). In other words, a 1–unit increase in the VA.EST variable leads to a 0.09% decline in the SMD variable due to the coefficient of −0.0009. Nonetheless, a 1–unit decrease in the VA.EST variable causes a 0.47% rise in the SMD variable due to the coefficient of 0.0047.
In Table 12, the ARDL (4,3,4) model is determined as the most appropriate model regarding the SMD–PV.EST variables for Canada. The positive effect coefficient of the PV.EST variable was calculated as (0.0506). The negative effect coefficient of the PV.EST variable was calculated as (0.0055). In other words, a 1–unit increase in the PV variable leads to a 5.06% rise in the SMD variable due to the coefficient of 0.0506. Likewise, a 1–unit decline in the PV variable causes a 0.55% increase in the SMD variable due to the coefficient of 0.0055. Figures 4 and 5 are asymmetric link amid the variables under NARDL that give an asymmetric dynamic graphical presentation of the paper.
NARDL Results of Canada (SMD – PV.EST).

Significant level at 0.10.
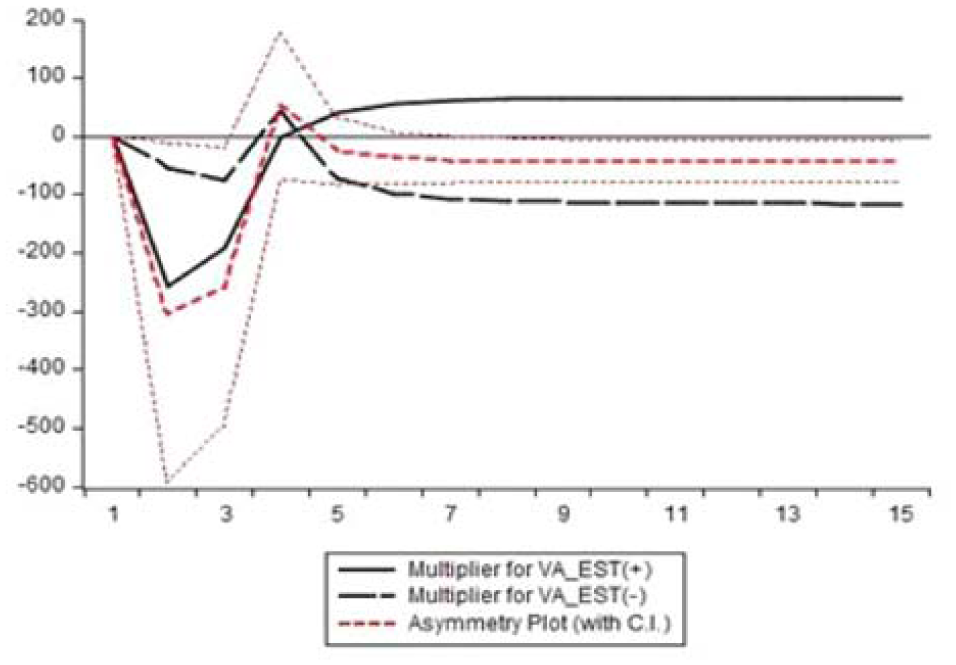
Asymmetry multipliers for VA.EST of Canada.

Asymmetry multipliers for PV.EST of Canada.
Figure 4 illustrates the asymmetric effects of the POS and NEG decompositions of the voice and accountability (VA) indicator for Canada. The positive multiplier of VA.EST is, in general, above the base/zero line, whereas the negative multiplier lies below the base/zero line. Due to the negative relationship detected as a result of the analysis, both the negative and positive multiplier effects cause the asymmetry curve to follow through, in general, the zero line. It can be claimed that the impact of POS decomposition creates a smaller asymmetric effect than that of NEG decomposition. The POS multiplier has a lower asymmetric effect on the SMD since it causes smaller volatility. It is seen that the impacts of the VA indicator on Canadian stock market development are below the zero line. The asymmetrical curve (red dashed line) exhibits a stable image. Although the asymmetry curve is located, in general, between the POS and NEG multipliers, it lies below the zero/baseline.
Figure 5 examines the asymmetric effects of POS and NEG decompositions of the indicator of the political stability and absence of violence/terrorism (PV) for Canada. Due to the positive relationship detected as a result of the analysis, the negative and the positive multiplier effects cause the asymmetry curve to follow through, in general, the zero line or slightly above it. It can be claimed with certainty that the impact of POS decomposition creates a larger asymmetric effect than that of NEG decomposition. The POS multiplier has a higher asymmetry effect on the SMD since it causes greater volatility. It can graphically determine the impacts of the political stability and absence of violence/terrorism indicators on Brazilian stock market development since it lies quite close to the zero line. The asymmetrical curve (red dashed line) usually reacts with quite a low volatility. The asymmetrical curve should follow through the baseline to avoid asymmetry. Nevertheless, although being located between the POS and NEG multipliers, it is slightly above the baseline. In the long run, it gives a reaction with high volatility.
Discussion
In the Fragile Five ARDL results, cointegration was determined in 6 out of 18 relationships and the relationships were detected to be linear. On the other hand, in G8 ARDL results, cointegration was determined in 20 out of 30 relationships and the relationships were determined to be linear. Although three out of six cointegration relationships in the Fragile Five countries yielded significant coefficients in the short–run; 10 out of 20 cointegration relationships in the G8 countries yielded significant coefficients in the short–run. In the NARDL analysis for the Fragile Five, it was determined that three out of the six linear relationships had asymmetric effects; however, as a result of the NARDL analysis conducted for the G8 countries, it was determined that there were asymmetric effects in 2 out of the 20 linear relationships. From these three separate evaluations, it is possible to claim that the WGIs selected for the G8 countries were more compatible with SMD in the long–run compared to the same relationship in the Fragile Five countries.
In the paper, the NARDL model is employed for South Africa and Brazil of the Fragile Five. An asymmetric and inverse cointegration relationship is detected between SMD–RQ.EST for South Africa. In other words, if RQ.EST_POS increases, SMD decreases, whereas if RQ.EST_NEG increases, and SMD also increases. This situation contradicts with the results of Khan et al. (2020) and Islam and Bilal (2021). In other words, in terms of the asymmetrical relationship between the RQ variable and SMD, the exact opposite results are obtained for South Africa and Pakistan. It can be claimed that the additional rules and regulations of the state regulating the private sector adversely affect the development of the stock market.
For Brazil, an asymmetric but negative relationship exists between SMD–VA.EST. Both VA.EST_POS and VA.EST_NEG reduce SMD. This asymmetrical relationship contradicts with the results of Charfeddine and Barkat (2020) and Islam and Bilal (2021). That is, different results are obtained for Brazil and Pakistan in terms of the asymmetric relationship between the VA variable and SMD. The increase and decrease in the additional efforts of the state on issues such as democratic rights, accountability of public officials, and human rights for Brazil have an interesting negative impact on the development of the stock market. For Brazil, an asymmetrical negative relationship exists between SMD–PV.EST. Both PV.EST_POS and PV.EST_NEG reduce SMD. The cointegration relationship between SMD–PV.EST for Brazil is supported by the cointegration relationship asserted by K. B. Ajide (2014). Nonetheless, multiplier results contradict with the results yielded by Haseeb et al. (2019), Abdul Rahman and Saif (2020), Uzelac et al. (2020), and Islam and Bilal (2021). How may an increase or decrease in political stability and absence of violence and terrorism negatively affect SMD? This result involves an interesting situation specific to Brazil.
For Brazil, three out of four indicators are found to be cointegrated with SMD. Brazil exhibits a different view compared to the other Fragile Five countries and an image similar to the G8 countries in terms of cointegration relationships. Subsequently, no cointegration relationship is detected for Turkey in the Fragile Five countries.
Upon considering the G8 countries, an asymmetric and inverse cointegration is detected between SMD–VA.EST for Canada and the NARDL is conducted. If VA.EST_POS increases, SMD decreases, and if VA.EST_NEG decreases, SMD increases. An asymmetric, but positive relationship exists between SMD–PV.EST for Canada. Multiplier results, however, contradict with the results yielded by Islam and Bilal (2021), Ming and Jais (2020), Modugu and Dempere (2020), and Charfeddine and Barkat (2020). Another finding regarding Canada is that both PV.EST_POS and PV.EST_NEG increase SMD. This multiplier result complies with the results yielded by Haseeb et al. (2019), Abdul Rahman and Saif (2020), Uzelac et al. (2020), and Islam and Bilal (2021). In terms of the variables examined for the G8 countries, a more symmetrical cointegration formation stands out. For the asymmetric relationship, it may be more useful to examine Canada within different periods and with other variables to comprehend the reasons. No other asymmetrical relationships are found in the G8 countries besides Canada.
Conclusion
In conclusion, the G8 countries (developed countries) yield more consistent and predictable results along with ARDL and NARDL analysis methods than the Fragile Five countries (developing countries) in this paper, where SMD is intended to explain using WGI. In other words, Worldwide Governance Indicators are convenient to be used to explain the changes in Stock Market Development indexes of the G8 countries. Except for Brazil, the extent to which SMD is explained or affected in the Fragile Five countries could not be determined within the scope of this paper. It can be argued that this is due to the lack of consideration of other macroeconomic factors that may have an impact on SMD, as is mentioned in the limitations section of this study. Therefore, it is imperative to make sense of the direction of movement and behavior by analyzing the SMD values of the Fragile Five countries with the inclusion of other indexes and/or independent variable(s) as in K. B. Ajide (2014). This assessment could be made using a following paper derived from this paper in the future.
Almustafa (2022) handled the relationship between governance quality, COVID-19, and stock index returns in OECD countries. In conclusion, it was determined that the higher the national governance quality weakened the effect of COVID-19 on stock returns. The negative impact of COVID-19 on stock market returns was more pronounced in countries where the national governance quality index was lower in the paper. The Coronavirus Pandemic might affect the stock markets via other governance indicators as governance quality that can be searched in a following paper. Gulcemal (2021) emphasized that the rule of law, the effectiveness of government and property rights, will promote economic growth and development the development of domestic markets. It was mentioned that as the quality of institutions in the financial sector increases, it will enable developing and developed economies with higher growth rates in global economy.
In macroeconomic respective, governance indicators can explain the SMD index in developed countries because regulatory quality, rule of law, voice and accountability, and political stability, and absence of violence/terrorism are clearer for investors of the stock market. Although the study is limited to Fragile Five and G8 countries, the level of development in terms of governance indicators is a measure that affect stock markets and explain the SMD index, and can be applied to various country groups. In microeconomic respectively, the results of the study give directions to domestic and international investors to make investments in the stock markets by taking into consideration of SMD and governance inditators relationship. Relating to the results of the paper for policymakers, financial market practitioners and business operators, the improvement of the paper’s six governance indicators can be anticipated to contribute stock market performance. This relationship has a positive influence on countries economic performance and also helps policymakers to know the role of governance indicators in the performance of stock markets.
Economic growth and also safe stock market can be achieved through political, legal and transparent government policies which can be measured in Worldwide Governance Indicators. The convenient result for developed countries shows the discrepancy between developed and developing countries in terms of governance indicators and SMD and supports the aim of the paper.
Footnotes
Funding
The authors received no financial support for the research, authorship, and/or publication of this article.
Declaration of Conflicting Interests
The authors declared no potential conflicts of interest with respect to the research, authorship, and/or publication of this article.
Data Availability Statement
All data used in this paper are already public; the Worldwide Governance Indicators can be downloaded from the website of the World Bank, and the Stock Market Turnover Ratios from the website of the Databank World Bank. In this paper, stock market turnover (percentage of GDP) was used as SMD (dependent variable) for the 13 countries in the empirical model generated for the G8 countries on behalf of developed countries and Fragile Five countries on behalf of developing countries; Whereas the independent variables consisted of regulatory quality (RQ.EST), rule of law (RL.EST), voice and accountability (VA.EST), and political stability and absence of violence/terrorism (PV.EST) were among the six indicators defined as the World Bank WGI.