
Abstract
Stock markets augment industries by raising and circulating capital in the economic system. This article examines the relationship between economic policy uncertainty (EPU) shocks and stock market development (SMD) in China. To this end, we utilize a novel EPU index the Nonlinear Autoregressive Distributed Lag (NARDL), and the Breitung-Candelon spectral causality approaches. The empirical outcomes suggest that positive (negative) shocks of EPU significantly decrease (increase) China’s SMD. The spectral causality approach confirms the lead-lag relationships among EPU shocks, stock market liquidity, banking sector development, savings, and trade openness. To propel the size of China’s stock market, the concerned authorities should strive to appease high EPU and ensure stability in macroeconomic and financial dynamics.
Introduction
Despite being tagged as unstable and sophisticated, stock markets are now considered vital components of financial systems (Hsieh, 1991), playing a crucial role in propelling economic growth (Pan & Mishra, 2018; Razmi et al., 2020). Finance practitioners took a keen interest in uncertainties affecting both stock market returns and volatility in recent times, which are vital indicators of companies’ current and prospective financial positions; assisting them in portfolio management and capital budgeting decisions (Poon & Granger, 2003). Economic policy uncertainty (henceforth, EPU) refers to the uncertainties pertaining to fiscal, monetary, and regulatory policies (Baker et al., 2016). Policy uncertainty decelerates the workings of various sectors of the economy, particularly the policy-sensitive sectors. These sectors include but are not limited to finance, defense, construction, and health care (Baker et al., 2016). Economic-cum-firm level uncertainties preclude economic expansion (Colombo, 2013). Owing to EPU, not only does the external financing costs of firms amplify, but it also compels managers to adopt a more conservative investment approach (Tran, 2019).
It is a well-established phenomenon that stock markets are sensitive to speculations and policy changes, and the Chinese stock market is no exception (Jin et al., 2019; Wang et al., 2018). Ko and Lee (2015) associated EPU with stock prices and concluded that EPU and stock prices are negatively linked. Yang and Jiang (2016) argue that policy uncertainty bears an adverse impact on stock market returns in China. Chen et al. (2017) inquired whether EPU affects stock market returns in China. They observed that EPU is negatively associated with Chinese stock market returns. They ascertained that when EPU is increased by one standard deviation, it trims the monthly expected returns by 1.2%. Jin et al. (2019) relate EPU with stock price crash risk in China, confirming that EPU and stock price crash risk go hand in hand. Wang et al. and Gulen and Ion (2015) probed whether corporate decisions are affected by EPU. They observed that as EPU increases, the corporate capital investment decreases. X. Li et al. (2018) examined the relationship between uncertainty and firms’ cost of capital. They obtained that the firm’s cost of capital raises in the wake of uncertainty. G. Zhang et al. (2015) report that in the case of Chinese-listed firms, EPU adversely impacts financial leverage.
The theoretical underpinning of this study predicates two famous concepts in finance and behavioral economics. Firstly, it takes insights from the Efficient Market Hypothesis (EMH), which entails that in an efficient market, stock prices ideally embed all available information. This phenomenon makes it tough for investors to outperform the market by leveraging such data. EMH comes in three forms, that is, weak, semi-strong, and strong. The weak form infers that past information is already embedded into the stock prices. The semi-strong form claims all publicly available information is in there. The strong form of efficiency takes it a step further, stating that stock prices even incorporate private insider information. The other theory supporting this research work is the Prospect Theory, pioneered by Daniel Kahneman and Tversky (1979). This theory states how individuals make choices when they are confronted by risk and uncertainty. Prospect Theory opposes the notion that investors always make rational decisions. It argues that their choices are markedly influenced by emotions such as fear overconfidence and other cognitive biases. The prime aspect of the Prospect Theory is that individuals exhibit risk-averse attitude in risky or highly uncertain investment situations, thereby prefer certain expected outcomes, regardless of low potential returns, as long as they are less risky. This research works aims to affirm the following hypothesis: whether the positive and negative shocks of economic policy uncertainty increase (decrease) the size of China’s stock market. Put differently, this study aims to determine the responsiveness of China stock market development toward the positive and negative changes in economic policy uncertainty. Doing so will enable us to affirm whether the impact of shocks pertaining to EPU is symmetric or asymmetric concerning stock market development in China. Based on the above discussion, this research attempts to answer how EPU is related to SMD in China.
The core contributions of this research article are: First, this paper utilizes a new EPU index specially constructed for China by Huang and Luk (2020). Researchers mainly use the EPU index of Baker et al. (2013, 2016), who pioneered the EPU index for the world’s major economies. In this respect, they developed China’s EPU index, but this index holds some limitations. While constructing China’s EPU index, Baker et al. (2013, 2016) utilized English newspaper based in Hong Kong, that is, the South China Morning Post (SCMP), and ignores China’s mainland newspapers for text searches (Huang & Luk, 2020). According to Huang and Luk (2020), the Hong Kong-based newspaper mostly covers Hong Kong’s economy. It may not be suitable for the derivation of China’s economic policy uncertainty (EPU). They further argue that the EPU index based on one newspaper might raise the question about the index reliability; as it is vulnerable to editorial policy changes or preferences. Therefore, they constructed a new EPU index for China while taking into account China’s 10 mainland newspapers and is capable of gauging China’s uncertainty in a proper manner compared to the Baker et al. (2016) China’s EPU index. Huang and Luk (2020) extracted the keywords pertinent to economic policy uncertainty from 10 newspapers namely, Guangzhou Daily, Beijing Youth Daily, Shanghai Morning Post, The Beijing News, People’s Daily Overseas Edition, Today Evening Post, Jiefeng Daily, Wen Hui Daily, Southern Metropolis Daily, and Yangcheng Daily. Articles containing at least one term of the mentioned categories, that is, (1) Economy (2) Policy, and (3) uncertainty were picked and number of articles published in each month was scaled by the number of articles fulfilling the criteria (1) for the same month. Subsequently, the simple monthly average for 10 newspapers was computed, and the series was standardized to compute the standard deviation of unity. Finally, to obtain the average value of 100, the index was normalized for the given period. 1 Huang and Luk (2020) argue that investor’s decisions will be more influenced by the news published in the local newspapers rather than the English language newspaper published from Hong Kong. Moreover, investors may easily discern authority policy comments on China’s stock market from China’s official media, which may affect China’s SMD.
Second, unlike the linear autoregressive distributed lag (ARDL) methodology, which purports the symmetric effect of the exogenous series on the dependent variable, we are utilizing the nonlinear autoregressive distributed lag (NARDL) methodology. According to Shin et al. (2014), this technique can capture the hidden cointegration in time series data. The NARDL approach not only to determines cointegration among variables for small samples efficiently but also shows flexibility in variables integration. It accommodates both I(0), I(1) excluding I(2) and also tackles the endogeneity problems (Fedoseeva & Zeidan, 2018; Narayan, 2005; H. H. Pesaran & Shin, 1998; Shin et al., 2014). The NARDL approach is an advanced version of the linear ARDL approach. This technique decomposes the variable of interest into partial sum positive and negative changes and traces both the short- and long-run asymmetries (Pesaran et al., 2001; Shin et al., 2014). Third utilizing Baker et al. (2016) EPU index, researchers have determined the impact of EPU on stock market volatility/returns in China. Nonetheless, they have missed whether EPU relates to SMD in China. Fourth, we intend to delineate the causal linkages among variables included in the study; utilizing Breitung and Candelon (2006) spectral causality approach. Unlike the traditional Granger causality approach, this technique determine causality between variables at various frequencies, which allow us to determine whether variables have casual linkage in the short, medium and long-run. Knowing the response of SMD toward positive and negative changes in EPU will provide useful insight to policymakers, investors and other stakeholders to devise appropriate strategies. This research article fills the void by probing the asymmetric linkage between EPU and SMD in the context of China. In a nutshell, the significance of this research work lies in the fact that that we have used a novel EPU index which is based on 10 mainland Chinese newspapers. Hence, relating it to stock market in China is worth probing, as it will enable policymakers to know about the impact of local uncertainties on Chinese stock markets. Another proposition that add to the vitality of the study is the application of the nonlinear model, which enables us to determine the homogenous/heterogeneous response of China’s stock markets vis-à-vis EPU shocks. Disaggregating EPU into positive and negative shocks will enable policymakers to devise biased policy inferences. Lastly, determining the short, medium and long-run casualties will enable readers to allocate the causal inferences among the studied variables at various intervals.
The rest of the article unfolds as follows. Section “Literature Review” discusses the pertinent literature. Section “Model, Data, and Estimation Methodology” showcases model, data, and estimation methodology. Section “Empirical Results” reports empirical results and discussion. Section “Robustness of the Results” presents a robustness check. Section “Concluding Remarks” concludes the research and Section “Future Research Avenues” offers future research avenues.
Literature Review
Uncertainty about government decisions concerning the economy influences prices in the financial markets and makes investors risk-averse (Brogaard & Detzel, 2015; Demir et al., 2018; Pastor & Veronesi, 2012). Economic Policy Uncertainty (EPU) changes urge investors to reconsider their investment choices to minimize financial loss. Phan et al. (2019) state that it is more arduous to determine the firm value when uncertainty is high. A plethora of research has documented the negative consequences of EPU. High uncertainty pushes the financing costs (Duong et al., 2020) trims mergers and acquisitions (M&A) deals (Bonaime et al., 2018); forces firms to design conservative dividend payout policies (Walkup, 2016); amplifies firm entry period (Handley & Limão, 2015), and trims consumption and investment (Arbatli et al., 2017). Researchers have established that owing to credit constraints, the effect of EPU propagates in emerging economies (Carrière-Swallow & Céspedes, 2013). Lam et al. (2020) tested whether international equity returns are susceptible to policy uncertainty. They obtained that policy uncertainty is priced in international equity returns. Other studies supporting the irreversibility of investment owing to high economic policy uncertainty include (Bloom et al., 2007; Gulen & Ion, 2015).
Quite a few studies have attempted to probe the impact of macroeconomic, financial and institutional variables on stock markets (inter alia, Verma & Bansal, 2023; Yartey, 2010). Determining the impact of news-based uncertainties on financial markets has become a hot area of research. In this respect, Tsai (2017) probed the impact of Economic Policy Uncertainty (EPU) in China, Japan, Europe, and the United States on the contagion risk in the global stock market. The findings affirmed that China’s EPU has significant spillover on various regional markets, except Europe. EPU in the United States is lagging behind China in terms of spillover, whereas Japan primarily affects contagion risk in emerging markets. Notably, the European markets remained undisturbed by the EPU indices. However, the market volatility is influenced by economic uncertainties in both Europe and China, especially the Asian and European countries owing to their high trade dependencies.
Studying the impact of EPU on global key markets, D. Zhang et al. (2019) argued that recent trade dispute between China and the US has instilled substantial uncertainty into the global markets. They deduced that although China’s EPU is affecting global markets, the dominancy of the US EPU over the global markets has still an edge. Hu et al. (2018) studied whether economic policy uncertainty in the United States is priced in China’s A-shares market and obtained that China’s A-shares market exhibits sensitivity to the former in terms of market, industry, and individual stock levels. They concluded that investors demand a premium on those stocks that are vulnerable to EPU in the US. In another study, Cai et al. (2022) confirmed the postulation of whether EPU instills volatility in China’s stock market. Hadood and Irani (2020) studied whether economic sentiment and economic policy uncertainty are related to travel and leisure stock returns in top European Union tourism destinations, including France, Germany, Spain, and the UK. They established that changes in economic sentiment have a favorable impact on stock returns in Spain and France. In the short term, the European economic sentiment has a positive effect on future stock returns in the UK and Spain. Moreover, changes in European economic policy uncertainty have a marginally negative effect on future stock returns in France.
Investigating the transmission of the US EPU shocks to the global financial markets, Kido (2018) validated that commodity prices, equity prices, and exchange rates alter vis-à-vis EPU shocks. Irani et al. (2022) investigated the impacts of country risk (political and economic), global economic policy uncertainty (GEPU), and macroeconomic factors on stock prices in Turkish tourism firms. Highlighting the structural break in the studied sample, the author(s) deduced that stock prices of tourism firms in Turkey are vulnerable to studied factors in the long-run. The short-run outcomes affirmed that the stock prices react negatively to real exchange rate and GPU, and positively when political risk increases.
The macroeconomic expectation postulation purports that stock markets have forward-looking nature as they embed economic information (Ellington, 2018; Switzer & Picard, 2016). Hence, it is imminent that the trading behavior of the market participants will be influenced by the rise/decline in EPU. In the context of China and other large economies, researchers have explored the linkage between EPU and stock market volatility/returns (Aksoy & Demiralay, 2019; T. Li et al., 2019). We propose that uncertainty leads to potential loss of prospective investors and may trim stock market growth (hereafter, SMG). Given that SMD plays a prominent role in economic development (Beck et al., 2008; Beck & Levine, 2004; Levine, 2005; Razmi et al., 2020), no attention is directed to inquire the association between EPU and SMD. Studies confirming nonlinearities between equity markets and macroeconomic variables include but are not limited to Liang et al. (2019) and Raza et al. (2016). Against this backdrop, this research article augments the literature by examining the asymmetric impact of EPU on China’s SMD.
This research article augments the literature by linking the novel EPU index to stock market growth in China by utilizing the nonlinear ARDL approach pioneered by Shin et al. (2014). The recent research entails that linear models may not be suitable for financial and economic data owing to their non-linear behavior, and the inferences drawn from economic or financial data based on the linear models may not be reliable (Atil et al., 2014; Shin et al., 2014). The conventional linear methodologies such as the Johansen and Juselius cointegration and ARDL bounds testing involves constant disturbance terms having constant velocity of adjustments. Such assumptions do not suit the financial markets (Dufrénot et al., 2012). The econometric techniques such as Markov switching, Threshold ECM, and Smooth transition regression, etc., address these shortcomings. The NARDL technique is preferred over Markov Switching, Threshold ECM, and Smooth transition regression, as it not only delineates both short- and long-run asymmetries but simultaneously captures the uneven dynamic adjustments. The cardinal advantage of the NARDL technique is that it unearths the hidden cointegration in the series —otherwise missed by the linear models. Besides the core advantage of delineating the short- and long-run asymmetries and grasping the uneven dynamic adjustments, the NARDL technique is meritorious in some other aspects as well. It relaxes the variables’ integration order Hoang et al. (2016), produces reliable results for data the having small sample size (Romilly et al., 2001), and resolves the data multicollinearity issues; as it selects optimal lag order for the respective variable (Shin et al., 2014). The jargon of hidden cointegration was initially coined by Granger and Yoon (2002). They stated that variables might not signify cointegration in their pure form; nonetheless, cointegration maybe be traced when we separate variables into their positive and negative changes.
Model, Data, and Estimation Methodology
Model
The outcomes obtained pertaining to the influence of EPU and Chinese stock market returns are inconclusive (Arouri & Roubaud, 2016). Chen et al. (2017) inquired the linkage between EPU in China and Stock returns and obtained a neutral relationship between the two. Conversely, Guo et al. (2018) established that as Chinese EPU amplifies, it trims the stock market returns. According to economic theory, when a high level of uncertainty prevails in the market, it tends to reduce its performance (Bernanke, 1983). Owing to high uncertainty, firms forgo prospective investments (Gilchrist et al., 2014; Tran, 2019).
The existing literature lacks evidence on the relationship between positive and negative changes in EPU and SMD in China. Taking insights from the extant literature, we posit that the positive changes in EPU curtail stock market growth whereas, negative changes in EPU tend to bolster SMD in China. Following the extant literature Garcia and Liu (1999), Shahbaz et al. (2016), and Yartey (2010), we have incorporated a set of control variables in our model, which influences the Chinese stock market growth. We have gauged banking sector development via credit to the private sector to GDP and expect that banking sector development strengthens the equity market. Growth in the banking sector is a precursor to stock market growth (Chinn & Ito, 2006; Garcia & Liu, 1999). Liquid stock markets provide funds to projects having long-term nature, thereby propelling labor demand (Blau, 2018). Liquid capital markets lure more investors as funds are readily available at their disposal, propels the equity market size, and augment economic activities (Bencivenga et al., 1996; Demirgüç-Kunt & Levine, 1996; Jordaan et al., 2016). Stock markets channel savings toward investment projects. A high ratio of savings in the economy bolsters the equity market size as they turn into further productive investments. Openness in trade acts as a catalyst for foreign capital inflows and lures foreign investors to undertake long-term investment projects, which in turn accelerates stock market activities ultimately energizes the overall health of the economy (Levine et al., 2000; Udegbunam, 2002). In line with the extant literature (inter alia, Jordaan et al., 2016; Yartey, 2010), we expect that stock market liquidity, banking sector development, domestic savings, and openness in trade stimulate China’s stock market growth.
This research work is based on the stock market growth model pioneered by Calderon-Rossell (1991). The central premise of this model is that macroeconomic variables and stock market liquidity (henceforth, SML) propel SMG. Taking insights from Yartey (2010), we will modify Calderon-Rossell (1991) model by incorporating other financial and macroeconomic variables. Specifically, we examine the role of economic policy uncertainty shocks in explaining Chia’s stock market growth in the presence of banking sector development, domestic savings, and trade openness. Following the work Belcaid and El Ghini (2019), we replace macroeconomic variables with China’s EPU and propose the following models;


Where,
Equations (1) and (2) are presented in their linear form. To accommodate changes in EPU, we can rewrite both the equations as;


Data and Estimation Methodology
To measure the development of both the Shanghai and Shenzhen stock markets, we used monthly capitalization of companies listed on both markets for the period January 2000 to December 2018. Researchers deem stock market capitalization as the best proxy for gauging the SMD. They argue that this measure is less arbitrary than other measures (Billmeier & Massa, 2009; Yartey, 2010). Market liquidity represents total stock value traded, banking sector development denotes credit to the private sector by banks, saving represents gross domestic savings, and openness in trade is measured through the ratio of exports plus imports to GDP. To examine robustness, we used monthly capitalization of Shanghai and Shenzhen’s A and B shares, respectively. We have retrieved data of all the variables from the CEIC database except for monthly EPU data, which is sourced from the website (www.economicpolicyuncertaintyinchina.weebly.com). To cope with dimensional differences and potential heteroskedasticity, we have converted original data into their natural logarithmic form.
The application of the NARDL methodology introduced by Shin et al. (2014) requires several steps. Firstly, we confirmed the variables’ stationarity; utilizing Phillips-Perron unit root test. The stationarity of the variables is mandatory because the NARDL methodology is conditioned that all the variables should be I(0) and I(1) integrated, and no variable integrated of order two, I(2) or higher should be included in the model. The inclusion of I(2) variables in the model will render biased results. Second, we chose the optimal lag length following the Schwarz-Bayesian Information Criterion (SIC). We employed Zivot and Andrews (1992) test to account for structural breaks in time series data. Upon confirmation of time breaks, we utilized the BDS test by Broock et al. (1996) for possible nonlinearities. The absence of I(2) variables and the confirmation of nonlinearity in the data allowed us to proceed with the NARDL methodology. To ascertain the asymmetric cointegration, we used the bounds testing approach of Pesaran et al. (2001). If the estimated F-statistic value crosses the upper bound, then it will validate the existence of long-run asymmetric cointegration. Hence, we will analyze the association among variables in the long-run when the computed F-statistic value is higher than the upper bound. The final step involves some diagnostic checks for the estimated coefficients, such as autocorrelation, heteroskedasticity, and model specification. To develop the asymmetric version of the autoregressive distributed lag (ARDL) model, the partial sum decomposition technique of Schroeder (2001) was utilized by Shin et al. (2014) in order to determine the asymmetric effect of the impulse variable on the response variable. In other words, they determined whether the impact of the positive and negative changes in the impulse variable is akin concerning the size and magnitude. The general form of the ARDL methodology introduced by Pesaran et al. (2001), in our case, takes the following form.


We can rewrite equations (5) and (6) in asymmetric ARDL version following Shin et al. (2014) as;


The parameter

and

In equations (7) and (8), the long-run positive and negative impact of EPU shocks on SMDSH and SMDSZ can be computed as;


Note: as
Subsequent to the determination of cointegration, we also intend to determine causal association among the variables included in the model. To this end, we employ Breitung-Candelon (2006) spectral causality approach.
Empirical Results
Descriptive Statistics
We report the descriptive properties of the variables in Table 1. The probability of the Jarque-Bera implies that the series contains a non-normality issue. In such cases, the application of the nonlinear model is required (Shahbaz et al., 2017), as employed by this research work.
Descriptive Analysis.

Unit Root Test
In time series settings, the inclusion of nonstationary variables may lead to spurious regression. To handle this issue, we used the traditional Phillips-Perron (PP) unit root test to ascertain the unit root for respective variables and ensure the stationarity of variables before proceeding to the NARDL analysis. The outcomes of the Phillips-Perron test are given in Table 2. We observed that SMDSH, SMDSZ, SMLSH, SMLSZ, BSD, SAV, and TO are stationary at first difference whereas, EPU is level stationary at 5% significance level. Based on these outcomes, we confirm that our variables have a mixed order of integration. Moreover, our model does not have I(2) integrated variables, thereby allowing us to proceed with the NARDL analysis.
Phillips-Perron Unit Root Test Results.

The standard stationarity tests do not account for the possible structural breaks and may produce biased inferences (Henry & Shields, 2004). In this respect, researchers recommend Zivot and Andrews (Z&A) (1992) structural break unit root test. This Z&A test not only identifies breaks in the series but also further validates the integration order of the variables. In our case, the Z&A test results given in Table 3 identified breaks in the series. Moreover, it confirmed that our model is free of I(2) integrated variables.
Zivot and Andrews Structural Break Test Results.
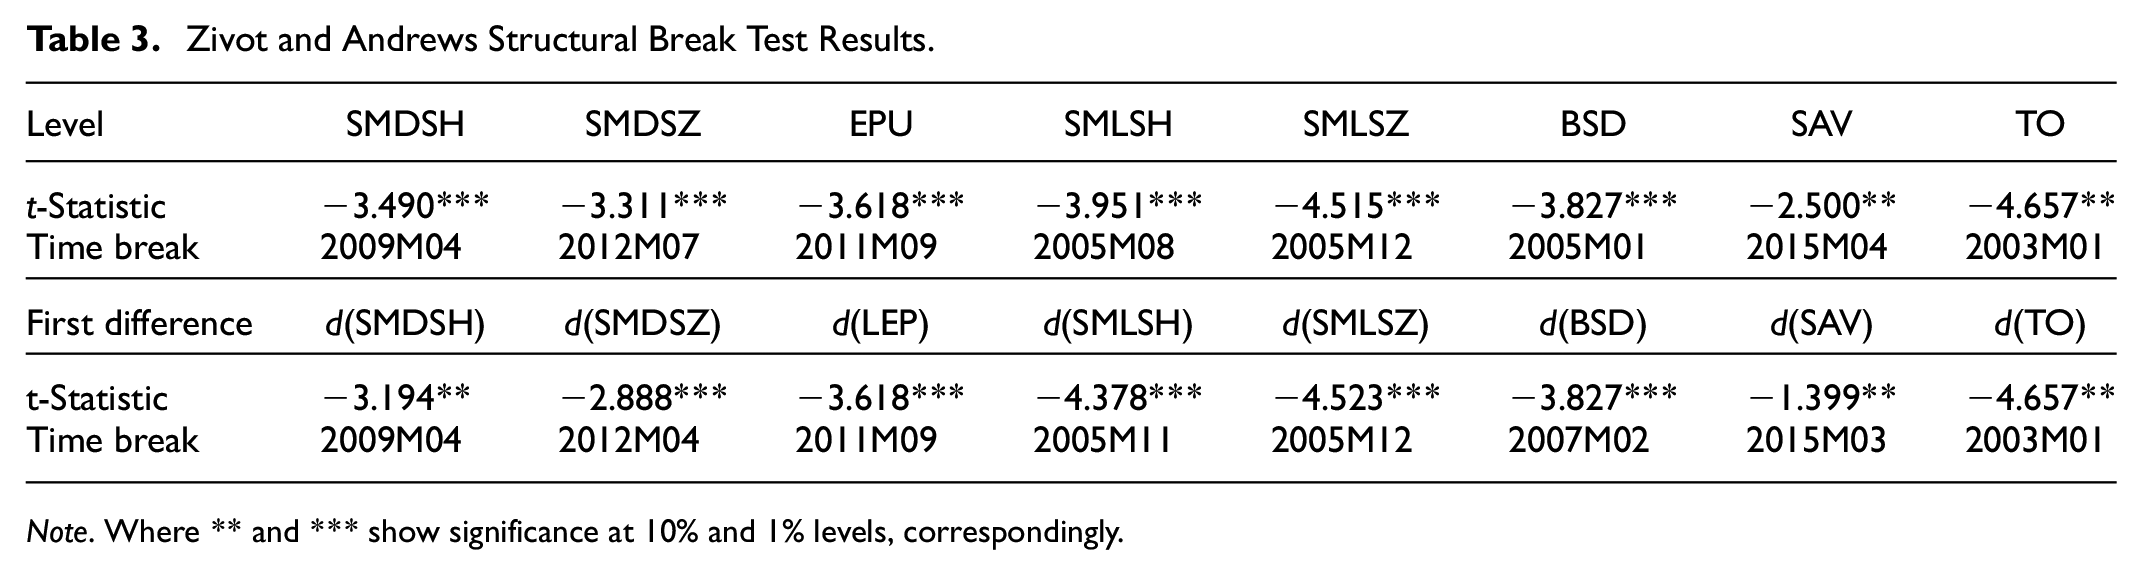
Note. Where ** and *** show significance at 10% and 1% levels, correspondingly.
Since Zivot & Andrews (Z&A) test identifies breaks in the series, we move forward to employ Clemente et al. (1998) unit root test which is capable to detect two structural breaks in the series. The outcomes of this test are reported in Table 4. In this test, the null hypothesis has a unit root with structural break(s) and the alternative hypothesis that the series is stationary with break(s). The prime advantage of this test is that it an a priori knowledge of the breaks dates is not compulsory. We l reject the null hypothesis as the t-statistic is greater (in absolute values) than the critical values.
Clemente-Montanes-Reyes Unit Root Test with Two Structural Breaks.

Note. TB1 and TB2 are the dates of the structural breaks, ***, ** and * show significant at 1%, 5% and 10% levels, respectively.
Broock, Dechert, and Scheinkman (BDS) Nonlinearity Test
To detect nonlinearity in the series, the Brock, Dechert, and Scheinkman (BDS) test is useful. The Broock et al. (1996) test spots the model misspecifications and is considered superior to other available nonlinearity tests in terms of nonlinearity detection. This test estimate residuals and removes linear dependencies via the VAR model. Observing the nonlinear dependencies in VAR residuals, the null hypothesis of the BDS test postulates that series is independently and identically distributed (i.i.d). Since the BDS statistics show significance across all variables’ dimensions, it signifies that the null hypothesis does not hold and confirms the nonlinear dependence as in our series. The outcomes of the BDS test have been reported in Table 5. As the linear dependence does not hold across all variables at a level of 5% significance, it ensures nonlinearity in the series, which guides us to utilize the nonlinear methodology.
Bounds Test for Non-Linear Specifications.

The selection of optimal lags plays an essential role in delineating cointegration among variables (Bahmani-Oskooee & Bohl, 2000; Stock & Watson, 2002). The Schwarz Bayesian Information Criterion (SIC) suggest that lag is appropriate in our case. The obtained outcomes of the bounds test affirm the asymmetric cointegration between EPU and SMD both in the short and long-run. The diagnostic tests are satisfactory, showing that our model befits policy recommendations. The outcomes of the diagnostic check are reported in the lower part of Tables 6 and 7. Subsequently, we checked for the asymmetric effects of changes in EPU on SMD of both the Shanghai and Shenzhen stock exchanges. We observed that in both models, the value of F-statistics is higher than their respective upper critical bounds, thereby confirming the asymmetric cointegration between changes in EPU shocks and China’s SMD. Table 5 reports these outcomes.
BDS Non-Linearity Test Results.

Note. The asterisks *** show the rejection of the residuals null (H0) at 1% level correspondingly.
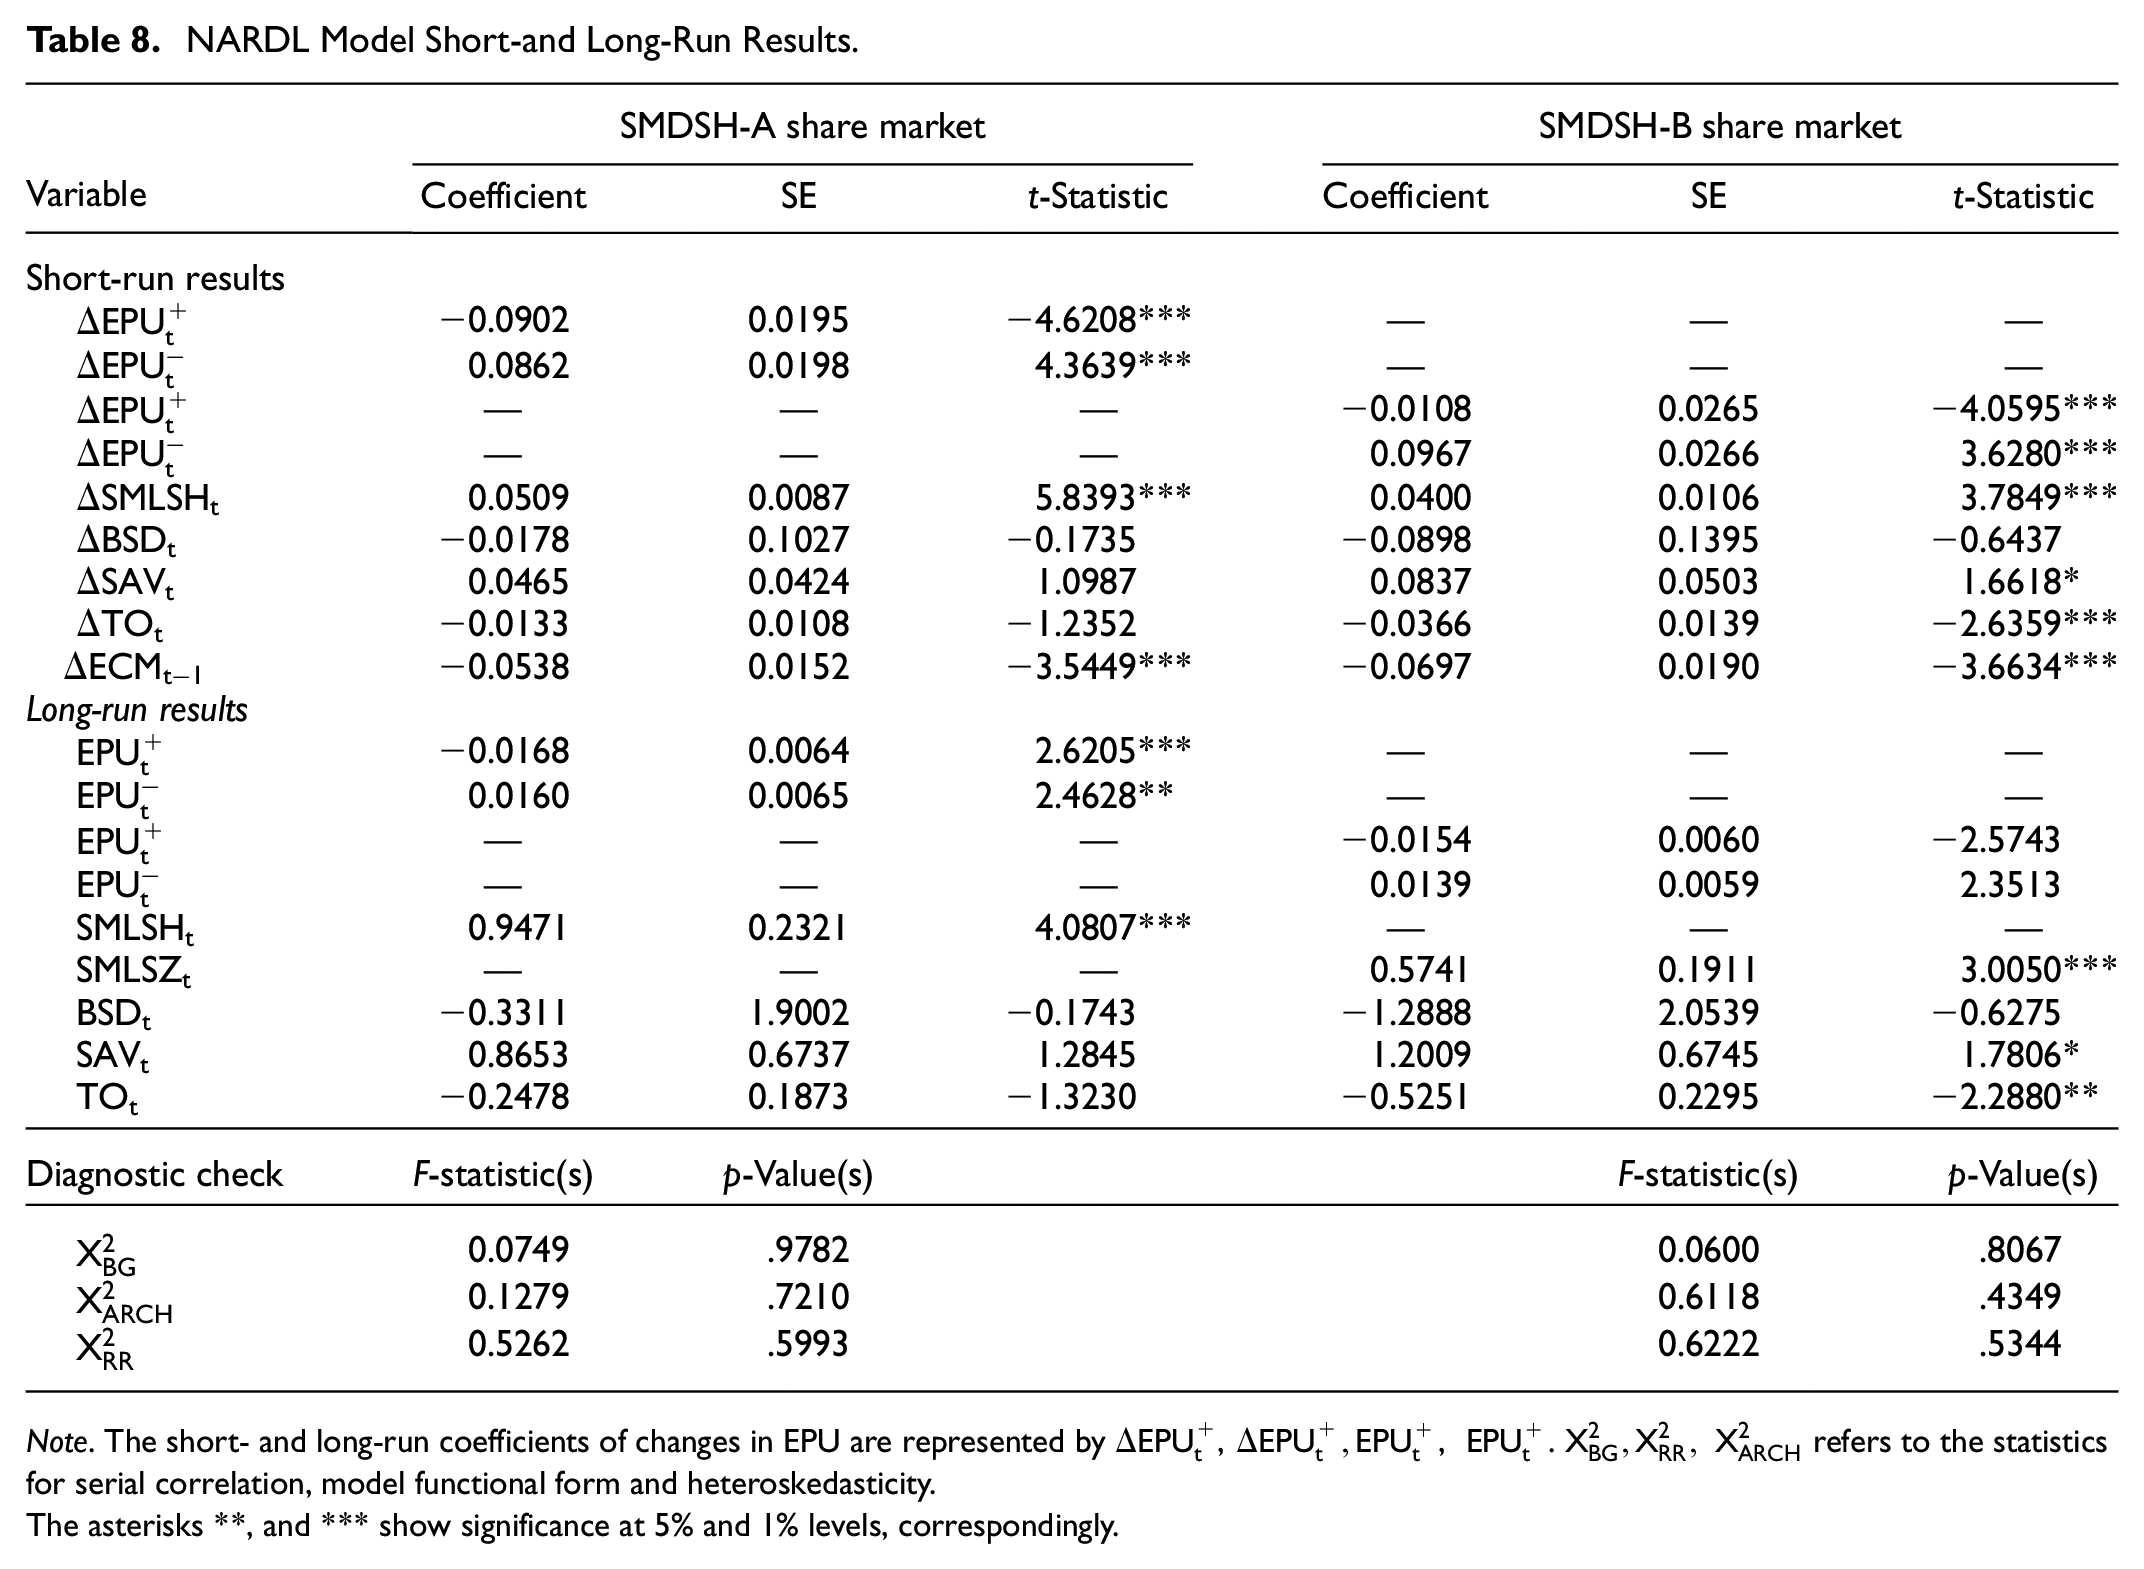
NARDL Model Short-and Long-Run Results.

Note. The short- and long-run coefficients of changes in EPU are represented by
The asterisks **, and *** show significance at 5% and 1% levels, correspondingly.
Table 8 showcases the short and long-run outcomes estimated via the NARDL approach. The outcomes reveal that in the short-run, an increase in EPU positive shocks decreases the growth of both Shanghai and Shenzhen stock exchanges. On the other hand, both stock exchanges exhibit growth when negative shocks are given to EPU. The short-run coefficients of the positive/negative changes in EPU signify that 1% increase (decrease) in EPU trims (grows) the Shanghai market by 8.1% (7.7%) at 95% confidence level, respectively. In the same way, when EPU rises (declines) by 1%, it decreases (increases) the Shenzhen market by 5.8% (4.8%), respectively. The Shanghai and Shenzhen stock exchanges show a similar response to EPU shocks in the long-run. When EPU increases (decreases) by 1%, it decreases (increases) the Shanghai market by 1.56% (1.49%) at 5% level of significance, correspondingly. The Shenzhen stock exchange growth falls (rises) by 6.7% (6.3%) when EPU rises (declines) by 1%. We noticed that the size of the coefficients, as well as signs, are not the same in both models, which testifies the asymmetric cointegration between EPU and stock market growth in China. Asymmetric cointegration can be affirmed via the magnitude and the signs of the coefficients (Fareed et al., 2018). These outcomes imply that when EPU is high, stock market growth contracts significantly in China, and when EPU is low, the stock market in China exhibits growth. In the literature our findings are congruent to the findings of Cai et al. (2022) and Tsai (2017), which states that volatility in the stock markets increases owing to EPU. Similarly, D. Zhang et al. (2019). Hu et al. (2018) affirmed that both the USA and China’s EPU affect global markets and investors demand premium for the stocks which are inevitably sensitive to economic uncertainties. Supporting the above discussion, Kido (2018) validated that commodity prices, equity prices, exchange rates alter vis-à-vis the EPU shocks. Similarly, Hadood and Irani (2020) also confirmed that stock returns shrink amid high EPU level (Table 9).
NARDL Model Short-and Long-Run Results.
Note. The short- and long-run coefficients of changes in EPU are represented by
The asterisks **, and *** show significance at 5% and 1% levels, correspondingly.
NARDL Model Short-and Long-Run Results.

Note. The short- and long-run coefficients of changes in EPU are represented by
The asterisks **, and *** show significance at 5% and 1% levels, correspondingly.
These results also support precautionary measures motive, which assert that firms refrain from announcing dividends, holding more cash, and liquid instrument when confronted with high uncertainty (Alfaro et al., 2018). Heightened uncertainty slows down real economic activities and hampers financial market performance (Popp & Zhang, 2016). Z. Li and Zhong (2019) assert that compared to external uncertainties, the domestic policy uncertainty is responsible for high volatility in Chinese financial markets. Methodologically, our findings confirm the short- and long-run nonlinearities between EPU and SMD in China. Hence, we suggest that modeling the linear relationship between EPU and SMD may produce inconsistent and biased estimators.
Regarding control variables, the SML is noticed to be the prime predictor of SMD in China. The outcomes purport that there is a direct association between SML and SMG in China. High liquidity is the characteristic of a sound stock market, which ensures capital provision to the investors (Bencivenga et al., 1996; Jordaan et al., 2016). In both model’s insignificant relationship has been obtained between banking sector development and SMG. Nonetheless, the positive and negative coefficients of banking sector growth suggest that the banking sector can complement/substitute SMG. In the beginning, the banking sector augments the stock market through financing, but later on, both the stock markets and banks contend for investment and financing population. The relationship of openness in trade with the development of both the Shanghai and Shenzhen stock exchanges is neutral. However, its coefficient is carrying a negative sign, which implies that trade openness may influence China’s SMG through portfolio investment. Savings has a neutral association with the development of the Shanghai stock exchange; however, in case of the Shenzhen stock exchange, we obtained a positive and significant relationship between savings and the long-run growth of the Shenzhen stock market growth. These results portray that domestic savings bolster the SMG in China. Our results corroborate the findings of Garcia and Liu (1999), Jordaan et al. (2016), and Quartey and Gaddah (2017) in the literature. They opine that savings and stock market capitalization (development) goes hand in hand. The stock markets channelize savings into productive investments; hence savings are favorable to the stock markets’ growth (Ben Naceur et al., 2008; Shahbaz et al., 2013). In both models, the coefficient of error correction term (ECT) is negative and significant—lying between 0 and 1, which is a standard range of the error correction model (Kremers et al., 1992; Ullah et al., 2018). These outcomes further validate the obtained asymmetric cointegration.
Overall, our results portray an asymmetric relationship between EPU and China’s SMD in the short- and long-run. We notice that China’s equity market exhibits hostility toward uncertainty as it bears negative effect on equity prices hence slows down the SMG and the other way around. Such outcomes demand steadiness in economic policies, that is, if there will be some delay in the implementation in economic policies, it will raise the bar of uncertainty and investors will refrain from investment, thereby hampering the SMG. On the other hand, if there are predictability and continuation of economic policies, it will boost the investor’s confidence. They will opt for further investments, which will result in the development of China stock market. Hence, our study provides insights to investors and policymakers to design strategies that will assist in subsiding the effects of heightened economic policy uncertainty. Speculative buying and selling behaviors are pervasive in the Chinese stock market, and investors seldom opt for long-term investment. Mei & McNown (2001) argue that the Chinese stock market is mostly dominated by retail investors prone to behavioral biases. Being a retail market, the individual investors account for a large volume of trading and majority of them are inclined toward herd behavior, which makes the market more volatile due to which uncertainty in the market prevails. By taking insights from the nonlinear association between EPU and SMD in China, policymakers should strive to appease economic policy uncertainty in order to boost economic efficiency and SMG. Doing so will enable them to create a conducive investment climate; necessary for further growth of China’s stock market.
Spectral Causality Results
Figures 1 to 10 represent the outcomes of Breitung-Candelon spectral causality approach. Based on the results we infer that there is a lead-lag relationship between the positive and negative shocks of EPU and the size of both the Shanghai and Shenzhen stock market development at different frequencies. We also noticed that stock market liquidity, banking sector development, savings and trade openness have causal linkages with the development of both markets across various intervals (Figures 11–14).

Conceptual model.

Dynamic multiplier graph (SMDSH model).
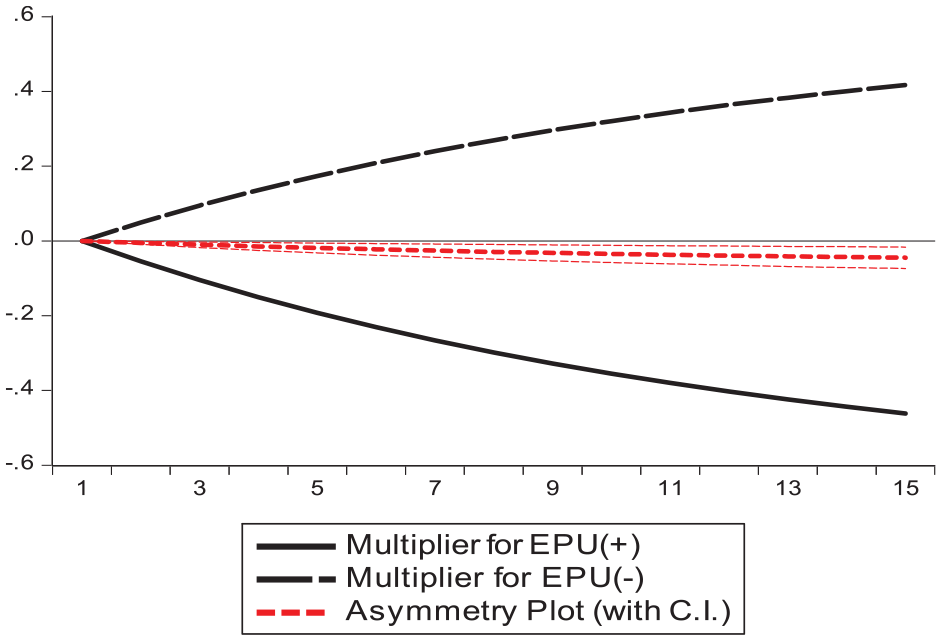
Dynamic multiplier graph (SMDSZ model).

Causality between EPU-P and Shanghai stock market development.

Causality between EPU-N and Shanghai stock market development.

Causality between banking sector development and Shanghai stock market development.

Causality between savings and Shanghai stock market development.

Causality between trade openness and Shanghai stock market development.
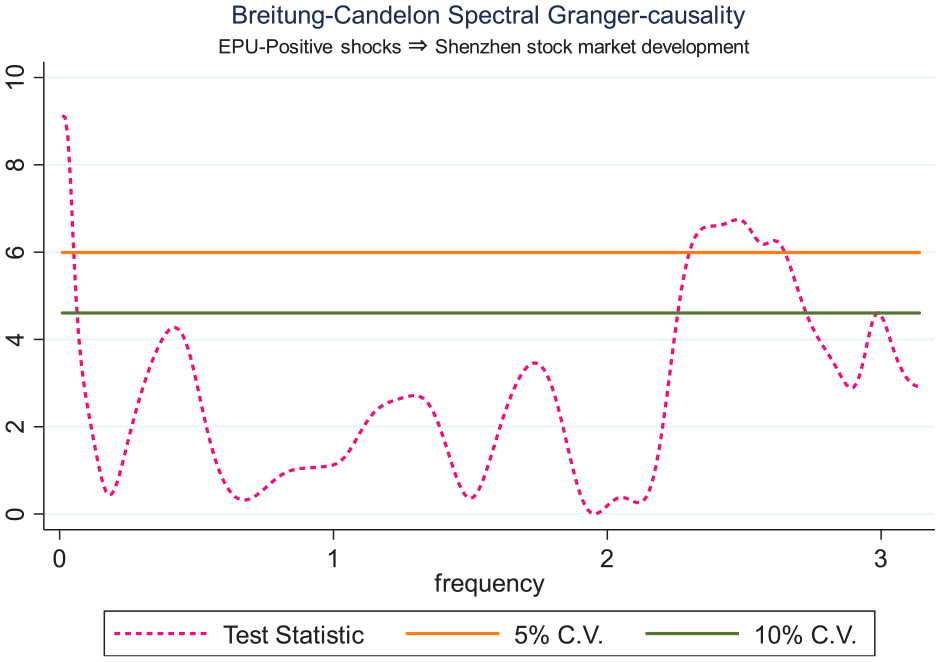
Causality between EPU-P and Shenzhen stock market development.

Causality between EPU-N and Shenzhen stock market development.

Causality between EPU-P and Shenzhen stock market development.

Causality between banking sector development and Shenzhen stock market development.

Causality between savings and Shenzhen stock market development.

Causality between trade openness and Shenzhen stock market development.
Robustness of the Results
For robustness check, we linked EPU with China’s A-share market development (capitalization) and B share market development (capitalization). China has two leading organized stock exchanges, that is, the Shanghai stock exchange (SSE) and the Shenzhen stock exchange (SZE). Two different types are equities are trading in both markets. These are Shanghai A shares, Shanghai B, Shenzhen A, and Shenzhen B, respectively. The prime difference between A and B shares is the latter is traded in US dollars denomination on SSE and in Hong Kong dollars on SZE. The proportion of A-shares is high compared to B shares as they comprise highly liquid ordinary shares. The outcomes exhibit that on a disaggregate level, changes in EPU exhibit the same behavior on the development of Shanghai and Shenzhen’s A and B share markets correspondingly, thereby validating our results. When EPU is given positive and negative shocks in the short-run and the long-run, it brings upward (downward) movement in the development of both Shanghai and Shenzhen’s A and B share markets, respectively. Liquidity and savings foster SMG (Jordaan et al., 2016; Yartey, 2010). Banking sector development has an insignificant relationship with the growth of both A and B shares markets.
Stock market liquidity and savings have positive and significant association with the growth of Shanghai and Shenzhen’s A and B share market development. We observed that trade openness is bearing a negative and significant impact on SMD, which entails that trade openness may reduce the growth of China’s stock market through portfolio investment channel. Shahbaz et al. (2016) also observed the same phenomenon while investigating the openness in the trade as a predictor of SMG. Moreover, the diagnostic tests of alternative proxies are reasonable. We have reported the sensitivity checks in the lower part of Tables 6 and 8, respectively.
The dynamic multipliers exhibit that rise in EPU mars the development of both Shanghai and Shenzhen stock markets; notwithstanding, both markets display growth when EPU falls. The outcomes of the dynamic multipliers further validate our main estimations.
Concluding Remarks
Prior studies have identified quite a few factors determining the SMD. Researchers have recently taken a keen interest in ascertaining the relationship between EPU and market volatility/returns in the world’s major economies; however, the relationship between EPU and SMD remains unnoticed. This research article addresses the gap by linking EPU with SMD in case of China, utilizing the nonlinear ARDL (NARDL) approach. This methodology empirically analyzes the short- and long-run response of SMD to both positive and negative changes in EPU. Our results reveal that positive (negative) shocks of EPU increase (decrease) China’s SMD. The results of our research are further corroborated by the dynamic multipliers exhibiting the nonlinear association between EPU and SMD in China. To further validate our estimations, we utilized the Shanghai and Shenzhen’s A and B share markets development (capitalization) as alternative SMD proxies and observed that the outcomes are robust. The outcomes of this research are potent for prospective policy recommendations, that is, it purports that in the wake of heightened economic policy uncertainty, investors become risk-averse and often delay their investment, which mars the SMG. On the other side of the coin, when economic policy uncertainty is low, investors are willing to invest as they perceive the business environment to be favorable for investment. The findings of this research further imply that the application of linear models would provide biased recommendations on the association between EPU and SMD if we ignore nonlinearities in the underlying series.
Based on our study’s findings, investors can judge the effects of positive and negatives changes in EPU on China’s stock market and make appropriate investment decisions accordingly. The economic risk in a country can be judged through the level of EPU. Understanding the nonlinear response of SMD toward EPU is worth studying as it offers valuable information to the policymakers pertaining to SMG in China. The higher the level of EPU, the higher will be economic risk, ultimately hampering the SMG and vice versa. The Chinese government mostly pursues conservative policies, which increase the systematic risk for companies, affecting their stock prices, all of which ultimately affect SMG. The Chinese stock market exhibited turbulence in recent times, particularly in June 2015, in which the SSE lost one-third of A-shares equity in less than a month. The aftershocks were felt subsequently, and on August 24, 2015, the SSE index recorded 30% slump in 3 weeks. High Uncertainty in the economy could be one reason for this decline.
The authorities in China should maintain steadiness and ensure transparency relating to economic policies. Uncertainty espouses economic and financial losses and investors need to become cognizant when they are faced with a high level of EPU. Doing so will help them in mitigating risk. Uncertainties pertaining to sudden regulatory changes vastly affect a large number of domestic and foreign investors. Such activities on behalf of the government mar the long-term growth of the stock market. The findings of our research will assist policymakers in designing appropriate monetary, fiscal, exchange rate trade policies in order to minimize economic uncertainty. In this respect, conspicuous communication with market participants about economic policies will assist the policymakers in dealing with uncertainty. To subside high economic uncertainty, the Chinese policymakers should intimate the economic agents about the proposed changes in economic policies such as monetary, fiscal, exchange rate and trade policies on a timely basis. In a nutshell, the outcomes of this research equip investors to design savvy investment strategies vis-à-vis the positive and negative changes in economic policy uncertainties. Policymakers can prevent abnormal fluctuations and amplify the size of China’s stock market via diminishing economic uncertainties.
Future Research Avenues
Studies have well probed the macroeconomic consequences of the COVID-19 pandemic (inter alia, Verma et al., 2021; Walmsley et al., 2023), as it has further exacerbated economic policy uncertainty in China, which may trim stock market growth. Future research should bridge this gap by considering the impact of COVID-19 on China’s stock market growth. This research article addresses the impact of endogenous economic uncertainty shocks on China’s stock market growth. Determining the impact of exogenous economic uncertainty shocks on China’s stock market growth is also worth exploring as we expect that the global economic uncertainty level and overall economic outlook has increased owing to the recent Russia-Ukraine conflict (e.g., Maurya et al., 2023). We hope to bridge these gaps in our future research.
Footnotes
Appendix Figures
See Figures A1 and A2.
Declaration of Conflicting Interests
The author(s) declared no potential conflicts of interest with respect to the research, authorship, and/or publication of this article.
Funding
The author(s) received no financial support for the research, authorship, and/or publication of this article.
Data Availability Statement
The data that support the findings of the study is available from the corresponding author upon reasonable request.