
Abstract
The development of smart teller machines (STMs) which incorporate artificial intelligence (AI) raises new research questions around customer satisfaction. This study provides insights into satisfaction factors amidst the AI-driven transformation of banking services. We reveal complex dynamics between factors that are vital for developing customer-centric strategies. A conceptual framework is established by using variables from the American customer satisfaction index (ACSI) model with the variable of trust. A hybrid SEM-fsQCA approach is employed to examine data collected from 252 samples. The findings substantiate positive and significant impacts of perceived quality, customer expectations, perceived value, and trust on overall satisfaction, and reveal that perceived quality and customer expectations exhibit indirect effects through perceive value. Meanwhile, the fsQCA analysis explores intricate non-linear dynamics and reveals that no isolated factor is necessary for high satisfaction, but combinations of condition variables can play a pivotal role. The sufficiency analysis emphasizes the requirement of at least two condition variables for achieving high satisfaction. Overall, we highlight the necessity for comprehensive strategies in shaping the banking ecosystem undergoing rapid adoption of AI.
Plain Language Summary
This study investigates what makes customers satisfied when using new smart teller machines (STMs) that use artificial intelligence in banks. With banking services changing rapidly due to technology, understanding what keeps customers happy is crucial for banks. This research collected information from 252 bank customers and analyzed it using two different methods to get a complete picture. Four main factors were studied: how good customers think the service is, what customers expect from their banking experience, whether customers feel they’re getting good value, and how much they trust the bank. The findings show that all four factors contribute to customer satisfaction. When customers perceive the service quality to be high, have positive expectations, feel they’re getting good value, and trust the bank, they’re more likely to be satisfied overall. Interestingly, the study found that no single factor alone guarantees customer satisfaction. Instead, different combinations of factors working together create happy customers. At minimum, at least two factors need to be strong for customers to feel satisfied with their banking experience. For banks rolling out new AI-powered machines, this means they should focus on comprehensive strategies that address multiple aspects of the customer experience simultaneously, rather than improving just one area. As banks continue to adopt more AI technology, understanding these customer satisfaction dynamics will help them create better customer experiences.
Introduction
Commercial banks face significant challenges as advanced technologies become more pervasive in the financial industry. Banks have to develop robust strategies to remain competitive and profitable in the face of increasing competition. Non-banks, in particular FinTech (financial technology) companies have been able to capture market share by providing customers with more specialized and efficient services that are tailored to their specific needs (Murinde et al., 2022). These financial services encompass peer-to-peer lending, alternative financing choices, digital payments, mobile wallets, and robo-advisors. Non-banking institutions are projected to draw a growing customer base away from conventional banks (Banik & Gao, 2023). Consequently, to enhance customer involvement, it is advisable for banks to consider strategies that entail investing in digital transformation and incorporating cutting-edge technologies like artificial intelligence, blockchain, and machine learning into their operations (Shahid et al., 2022). The continuous development of artificial intelligence (AI) is increasingly reshaping the form and delivery characteristics of banking services. Major state-owned commercial banks, such as the Industrial and Commercial Bank of China (ICBC) and China Construction Bank (CCB), have been at the forefront of deploying thousands of these AI-powered machines to reshape their branch services, and their growth has been motivated by a desire to enhance customer experience and expedite banking operations. STMs can also help reduce costs by replacing or supplementing traditional bank tellers.
While automated teller machines (ATMs) are electronic machines that allow customers to perform basic banking transactions such as withdrawing cash, depositing checks, and checking account balances, STMs incorporate the functionality of ATMs with the addition of more AI-powered features, such as virtual banking assistants and smart lending. Moreover, there are indeed some emerging applications of STMs that have not yet been widely adopted but show vast potential for transforming the banking industry in China. For example, STMs could be used to display interactive educational content that teaches customers about personal finance, corporate finance, fund investment, currency exchange, and many others. This may help increase financial literacy of the general public and promote digital financial inclusion. STMs could also be integrated with chatbots and voice assistants, and older customers could then use natural language commands to perform various banking tasks.
Some studies focus on key technical aspects, such as artificial intelligence algorithms, authentication technology, and more. The successful implementation of AI-driven banking undoubtedly relies on technology as the underlying infrastructure, but it also necessitates an understanding of customer behavior. Recent studies offer valuable insights into various aspects of the banking industry’s digital transformation and customer behavior. Taneja and Ali (2021) emphasize the significance of understanding customer values and preferences. Kruzikova et al. (2022) explore user perceptions of authentication methods for mobile banking and highlight the importance of security and user experience. Belanche et al. (2022) further delve into the role of perceived risk. Porfírio et al. (2024) provide insights into what drives digital transformation in bank, and this contextualizes the need to understand customer perceptions and expectations, as addressed in the study on consumer reviews of mobile banking services by Basu et al. (2024). However, there still exists a scarcity of investigations with respect to AI-powered STMs from psychological perspectives. Gaining insight into customer interactions with STMs is essential, as it directly affects the effectiveness of STMs in terms of customer experience. The satisfaction of customers with STMs is intricately connected to the user experience they provide. Commercial banks that can provide a seamless, efficient, and secure user experience are more likely to satisfy their customers and build brand loyalty.
Customer satisfaction can be a critical component of the success of STMs, and it is important for commercial banks to understand how customers perceive these terminals. By analyzing factors affecting customers’ overall satisfaction with STMs, banks can identify pain points and areas for improvement and make changes that can enhance user experience and improve satisfaction, eventually resulting in differentiating themselves from competitors and attract new customers. This study investigates factors affecting customers’ overall satisfaction with STMs based on a modified American Customer Satisfaction Index (ACSI) model using empirical evidence from China. Specifically, a structural equation modeling (SEM) approach is adopted to reveal causal relationships between factors, and this study further employs a fuzzy-set qualitative comparative analysis (fsQCA) to unveil synergistic pathways for high customer satisfaction.
This research contributes to the extant literature on three grounds. First, it is demonstrated that the variables in the ACSI model can be used in the context of AI-driven banking, and perceived quality, customer expectations, and perceived value, all have direct positive impacts on customers’ overall satisfaction, while perceived quality and customer expectations have indirect impacts on customer satisfaction through perceive value. Second, this study validates the critical role of trust in shaping customer satisfaction. Third, it is revealed that at least two factors must be collectively present for achieving high customer satisfaction through the fsQCA analysis, supplementing the findings from the SEM analysis.
Literature Review
Interaction with Intelligent Systems
Intelligent systems are computer-based systems that exhibit characteristics associated with human intelligence. These systems frequently employ sophisticated AI methods like machine learning and natural language processing to formulate predictions or choices. However, the deployment of AI in customer-facing roles introduces significance to the study of customer satisfaction. For example, Noor et al. (2022) argue that the unique nature of AI service agents (AISAs) shapes service quality expectations in new ways, and they identify 12 service quality dimensions specific to the AISA context. This implies that foundational models of satisfaction, which rely on traditional quality metrics, must be critically assessed, and adapted for the AI era. recent studies across various sectors confirm the importance of several core determinants of satisfaction with AI services. Research on AI in public services by Y. Kim et al. (2023) found that factors such as service reliability and security were significant drivers of user satisfaction and continued use. Similarly, in the context of AI-driven video streaming, Ahmed and Aziz (2025) demonstrate that personalization is a major influence on customer satisfaction, and that trust is a crucial factor that enhances the user experience. Furthermore, a study in the tourism sector by A. Huang et al. (2024), which expanded the expectation-confirmation model, revealed that perceived enjoyment can be a hedonic dimension and it is a significant predictor of satisfaction with AI services, alongside the confirmation of expectations and perceived performance. There is an emerging body of knowledge on how human users interact with intelligent systems, as technology is evolving rapidly, and machines are becoming increasingly versatile and cognitive. Researchers explore the increasing integration of AI agents, including chatbots, virtual agents, and intelligent personal assistants, across retail and service contexts. Several studies have examined consumer perceptions, sentiment, trust, and behavioral responses to AI interfaces (Guo & Luo, 2023; J. Kim & Im, 2023; Silva & Bonetti, 2021; Soderlund et al., 2021; Tran et al., 2021; Wang et al., 2023). Key factors impacting consumer interactions with AI include the perceived credibility and humanness of the agents (J. Kim & Im, 2023; Soderlund et al., 2021), as well as the valence of experiential responses evoked through verbal and non-verbal cues (Wang et al., 2023). Research also traces impacts on important downstream outcomes like purchase intentions, expectations, and customer satisfaction (Guo & Luo, 2023; Tran et al., 2021). As AI adoption grows, further exploration of the nuances underpinning fruitful human-AI collaboration across retail, marketing, and service domains remains needed. With respect to the current context, understanding customer satisfaction with STMs could provide meaningful guidance for commercial banks. As a result of the escalating embrace of digital banking solutions, commercial banks face greater competition from each other and also from FinTech companies. Studying human engagement with STMs has the potential to assist commercial banks in pinpointing areas for enhancing customer experiences and delivering superior service, ultimately leading to an enhanced reputation. Contented clients are inclined to express favorable opinions about a bank and suggest it to others, potentially aiding in the attraction of new customers and the cultivation of a favorable brand reputation.
The ACSI Model
The American customer satisfaction index (ACSI) framework is a commonly employed instrument in the United States for evaluating customer satisfaction with respect to products and services (Fornell et al., 2020a). The ACSI model proposes three critical components that have causal effects on customer satisfaction. The first component is customer expectations (CE), and it is an indicator of the extent to which a customer anticipates the quality of a company’s good or service. The second component is perceived quality (PQ), and it pertains to how a customer perceives the quality linked to the product or service they have received. The third component is perceived value (PV), and it mirrors a customer’s evaluation of the value they obtain in relation to the cost they incur for a particular product or service. The ACSI model has been used by many companies in the consumer goods sector to measure customer satisfaction levels and identify areas for improvement, and it has recently been applied in other sectors as well (Li & Wang, 2021; Y. Xie et al., 2022). The ACSI model offers valuable benchmarking information that can be utilized for assessing levels of customer satisfaction across different businesses and industries. The relevant information can be analyzed to find best practices, gage performance against competitors, and support strategic decision-making.
Recent papers have explored using the ACSI to assess customer satisfaction in various technology-enabled service contexts, such as online banking (Keskar et al., 2020) and intelligent communities (Li & Wang, 2021). While Fornell et al. (2020b) provide an overview of the ACSI model and how customer expectations are a key driver of satisfaction, Keskar et al. (2020) demonstrate a direct application of using ACSI in a specific online banking context. Li and Wang (2021) use the ACSI model to study how to improve public trust in intelligent aging communities. Ioannou et al. (2023) investigate how perceived greenwashing affects customer satisfaction and the moderating role of capability reputation. Liu et al. (2022) study customer reactions in an online shopping carnival context using an expanded ACSI model. Cui et al. (2023) examine factors that influence customer loyalty to online fresh food retailers in China. Using survey data, they identify quality attributes that drive satisfaction and customer retention. Ljepava et al. (2023) and X. Xie et al. (2023) further demonstrate demonstrated the flexibility of the ACSI model. Synthesizing the existing literature, the ACSI can represent a viable model, and it has proven adaptable across many service industries and technology applications. The ACSI may correlate with key consumer behavior outcomes including loyalty and word-of-mouth recommendation, it can be a leading indicator of customer retention and growth for AI banking products. As the ACSI emphasizes both transactional and relational cumulative satisfaction, it is a suited choice since AI banking tools often aim for sticky and personalized relationships. This study evaluates the application of the variables from the ACSI model in the context of STMs and further explore the integration of a trust factor into the conceptual framework.
Hypothesis Development
Overall Satisfaction
“Overall Satisfaction” entails a subjective assessment of an individual’s comprehensive sentiments regarding a specific product or service, signifying the level of satisfaction derived from the product or service (Otto et al., 2020; Xu et al., 2023). It hinges on the individual’s perception of the entirety of the product or service (Hsu & Lin, 2023). Overall satisfaction has been recognized in various contexts. For example, Zhao et al. (2019) establish a model of predicting overall satisfaction using a big data of online textual reviews in a hotel context. Overall satisfaction is often related with customer behavior. Goel et al. (2022) investigate how e-impulse buying tendencies and e-impulse buying behavior influence customer satisfaction and continuance intention in online shopping. M. Kim (2022) examines how social media platform attributes and content creator attributes influence user experiences and behaviors in context of at-home fitness video streaming during COVID-19 pandemic, the author reveals that YouTube channel satisfaction and flow experience in turn both heighten intention for sustained YouTube fitness video usage. With respect to the context of STMs in commercial banks, this study suggests a conceptual framework derived from the ACSI model, incorporating an extra trust component for further enhancement, as shown in Figure 1. The dependent variable is overall satisfaction, which pertains to the degree of customer satisfaction experienced with STMs installed in commercial banks. The corresponding hypotheses are described in the following sections.

The conceptual framework.
Perceived Value
According to the basic ACSI model, “perceived value” (PV) is acknowledged as a pivotal driver of customer satisfaction. Typically, PV is described as the degree to which an individual’s assessment of the anticipated benefits of a product or service for the associated cost paid (Sweeney & Soutar, 2001). In fact, perceived value is multi-faceted and can encompass several dimensions, including the functional value derived from the product’s performance and efficiency (Sánchez et al., 2006), the monetary value related to savings in time and cost (Blut et al., 2024), and the emotional value generated by positive feelings from the user experience (Y. Wu & Huang, 2023). Some researchers considered PV to be an equilibrium between perceived benefits and perceived costs (Boksberger & Melsen, 2011). Rooted in equity theory, PV has received great attention in various research fields (Kol & Levy, 2023; Yuen et al., 2023). Empirically, some investigations have highlighted that PV holds the capability to forecast overall satisfaction. For example, Samudro et al. (2020) suggested that PV might wield the most substantial influence on customer satisfaction, using a sample collected from the chemical industry. Zhong and Chen (2023) examine factors influencing user satisfaction and loyalty toward mobile payment platforms. Using data from 410 users using Alipay and WeChat Pay in China, the authors find perceived value factors drive satisfaction and loyalty. Drawing from the preceding analysis, the following hypothesis is formulated.
Perceived Quality
“Perceived Quality” (PQ) encompasses the personal assessment made by customers regarding the overall excellence of a product or service, derived from their perceptions of its attributes and characteristics. In the context of STMs, this could be evaluated through key dimensions such as system quality (Qin et al., 2022), which reflects reliability and error-free operation, and information quality (X. Wu et al., 2021), which often suggest accuracy and sufficiency of information provided. The foundation of the ACSI model rests on the idea that PQ can impact customer satisfaction. The foundation of the ACSI model rests on the idea that PQ can impact customer satisfaction. Some empirical studies have supported the notion (Ananda et al., 2023; Pooya et al., 2020). Ahn et al. (2025) show that PQ exhibits a positive effect on customer satisfaction within a food service mobile application context. Similarly, a study by Oliveira et al. (2023) suggest that the positive effect is significant in an e-commerce context. In addition, PQ can also affect customer perceptions of value (Zhong & Chen, 2023). When customers view a product or service as having better quality, they tend to associate it with greater value, which would then lead to increased satisfaction. Consequently, the following hypotheses are delineated.
Customer Expectations
The term “Customer Expectations” (CE) has been defined as the beliefs, perceptions, and anticipations that customers hold about a product, service, or brand prior to usage, purchase, or consumption (Mehta et al., 2023). The basic ACSI model suggests that if a customer’s expectations are met, the customer is likely to perceive the product or service to be high in value, which would lead to a higher level of satisfaction (Fornell et al., 2020a). Various studies have indicated the relationships and the importance of CE (Siwiec & Pacana, 2021; Vollero et al., 2023). However, it should be noted that an elevated absolute degree of CE might not inevitably result in an increased level of satisfaction. For example, if a customer’s expectations are too high (unrealistic expectations) and cannot be met, the customer is likely to experience disappointment and dissatisfaction. In other words, the difference in CE between before and after usage is critical. In fact, this conceptualization aligns with the expectation-confirmation theory, which posits that satisfaction is determined by the extent to which a product’s performance confirms or disconfirms a user’s pre-use expectations (Y. Huang & Yu, 2023; Pan et al., 2024). In this study, CE is thus deliberately crafted as the degree to which an STM exceeds an individual’s initial expectations after using it. The higher excess, the higher perceived value and overall satisfaction. Therefore, the following hypotheses are formulated.
Trust
Trust has been regarded as one of the most pivotal psychological elements that impact individuals’ behaviors (Chi et al., 2023). In this study, trust is characterized as the level to which a person has confidence in the dependability and reliability of STMs, and the belief that STMs are beneficial, trustworthy, and less technologically anxious. On account of the pronounced magnitude of uncertainty and inherent risk entwined with financial transactions for customers, trust is therefore a crucial factor that must be considered in contexts relating to finance. Consumers frequently have to provide sensitive financial information and make financial commitments when using STMs in banks, and they may feel anxious and apprehensive as a result, making them become more cautious about financial transactions through STMs. Theoretically, the relationship between trust and satisfaction may be rooted in the theories regarding affective commitment (Ren et al., 2023), which propounds that people possessing a profound emotional allegiance to an organization are inclined to derive satisfaction from their involvement. Since trust is a critical component of affective commitment (Mercurio, 2015), it is plausible that customers who place their trust in a bank along with its products or services are more prone to developing an emotional connection with the establishment. Therefore, the following hypotheses are proposed.
Research Methodology
Data Collection
Offline responses were collected from December 2023 to January 2024. The 5-point Likert scale was measured by five similar items. Details can be found in the Appendix Table A1. Before collecting data, the questionnaire underwent preliminary testing by a panel of experts to ensure its validity, with particular attention given to its comprehensibility and accuracy of translation. At multiple local bank branches in Shanghai, customers were approached and asked if they were conveniently available for engagement in the survey, subsequent to their use of smart teller machines. The data was collected in Shanghai, a primary financial hub where the deployment of Smart Teller Machines (STMs) is most advanced. This choice was deliberate to ensure that respondents had actual, recent experience with the specific AI-powered features being studied. All participants were thoroughly briefed about the study’s objectives and explicitly granted the privilege to discontinue their involvement at any point during the survey. At last, after eliminating incomplete responses, a total of 252 responses were gathered and used for subsequent data analysis. Harman’s single factor test yielded a value lower than 50%, suggesting no serious common method bias.
Data Analysis
Structural equation modeling (SEM) was adopted to empirically test the hypothesized direct and indirect influencing paths in the proposed theoretical model. Prior to the SEM analysis, an exploratory factor analysis (EFA) was performed to affirm the structure of measurement items. This study further implemented a fuzzy-set qualitative comparative analysis (fsQCA) to supplement the findings from the SEM analysis. Unlike traditional statistical methods that focus on linear relationships and precise measurements, fsQCA deals with qualitative and often complex causal configurations (Kumar et al., 2022). Calibration of condition variables and outcome variable is a crucial step in the fsQCA analysis, and the process involves assigning membership scores between 0 and 1 to cases based on the extent to which they meet a condition. Fuzzy-set theory acknowledges the idea of partial membership. Calibration allows for varying degrees of membership to conditions, reflecting the uncertainty and imprecision inherent in many social science phenomena (Ragin, 2014). During the fsQCA analysis, a truth table enumerates all the conceivable configurations of the causal conditions and Boolean algebra is used to logically minimize configurations into prime implicants, which are then analyzed to obtain parsimonious, intermediate, and complex solutions (Pappas & Woodside, 2021). Overall, the hybrid SEM-fsQCA analysis provides a rigorous test of the theoretical model from both quantitative and set-theoretic lenses to deeply examine causal mechanisms.
Results
The EFA Analysis
The exploratory factor analysis (EFA) was conducted using SPSS 26 to ascertain the structure of items. The Kaiser-Meyer-Olkin (KMO) test (the calculated test statistic is 0.929) and the Bartlett’s test for sphericity (the calculated p-value is less than .001) were both carried out prior to analysis. Table 1 shows the extracted component matrix (condition: eigenvalue greater than 1) with VARIMAX rotation and factor loadings greater than 0.5 are highlighted in bold. It can be seen from the result that the calculated factor structure (explains 66.451% of the total variance) is in line with the pre-determined constructs.
The EFA Analysis Results.
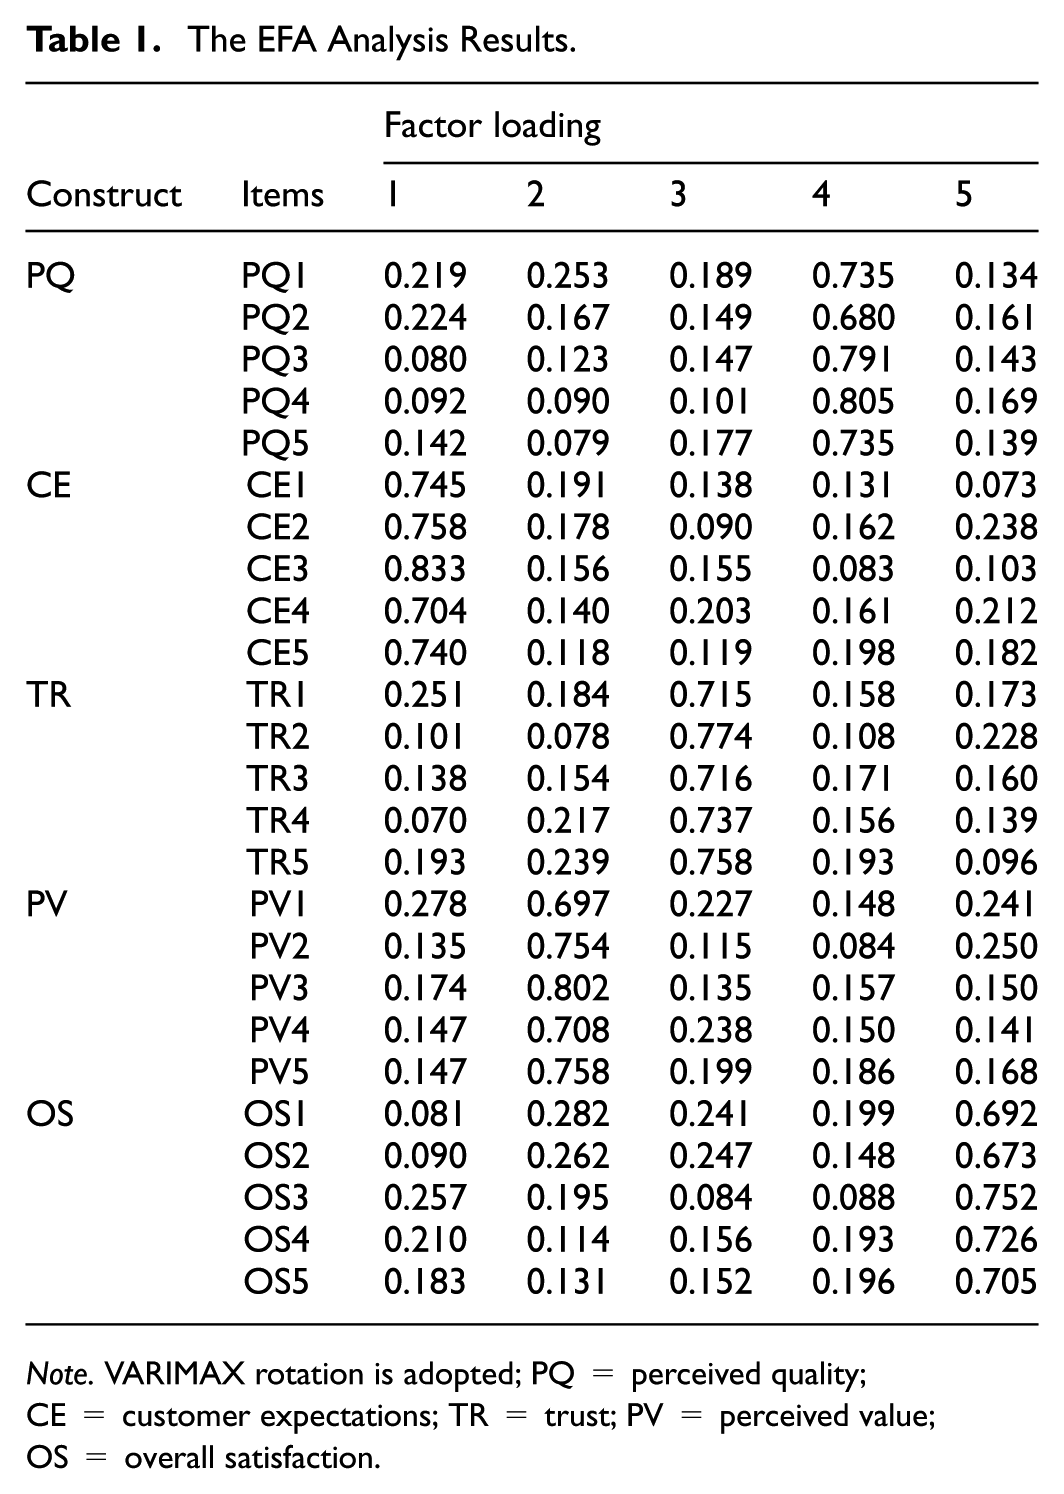
Note. VARIMAX rotation is adopted; PQ = perceived quality; CE = customer expectations; TR = trust; PV = perceived value; OS = overall satisfaction.
The SEM Analysis
The results of measurement model were summarized in Table 2. First, the standard factor loadings for items are all greater than 0.5, and the Cronbach’s alpha values are all greater than .8. Second, composite reliability (CR) scores and average variance extracted (AVE) scores for all constructs are greater than an acceptable level of 0.7 and an acceptable level of 0.5, respectively. Overall, the results clearly indicate composite reliability and convergent validity. Meanwhile, Table 3 presents the inter-construct correlation matrix, where the diagonal elements comprise the square root of AVE values. It is apparent that the square root of the AVE value for each variable surpasses its correlation coefficients with other variables, indicating discriminant validity. The standard estimates for proposed paths were calculated using maximum likelihood estimation. The results are succinctly outlined in Table 4. It is observable that perceived quality (β = .187, p = .020), customer expectations (β = .181, p = .024), perceived value (β = .332, p < .001), and trust (β = .214, p = .006), all have significantly positive impacts on overall satisfaction at the 5% significance level, supporting the corresponding hypotheses (
Reliability and Convergent Validity.
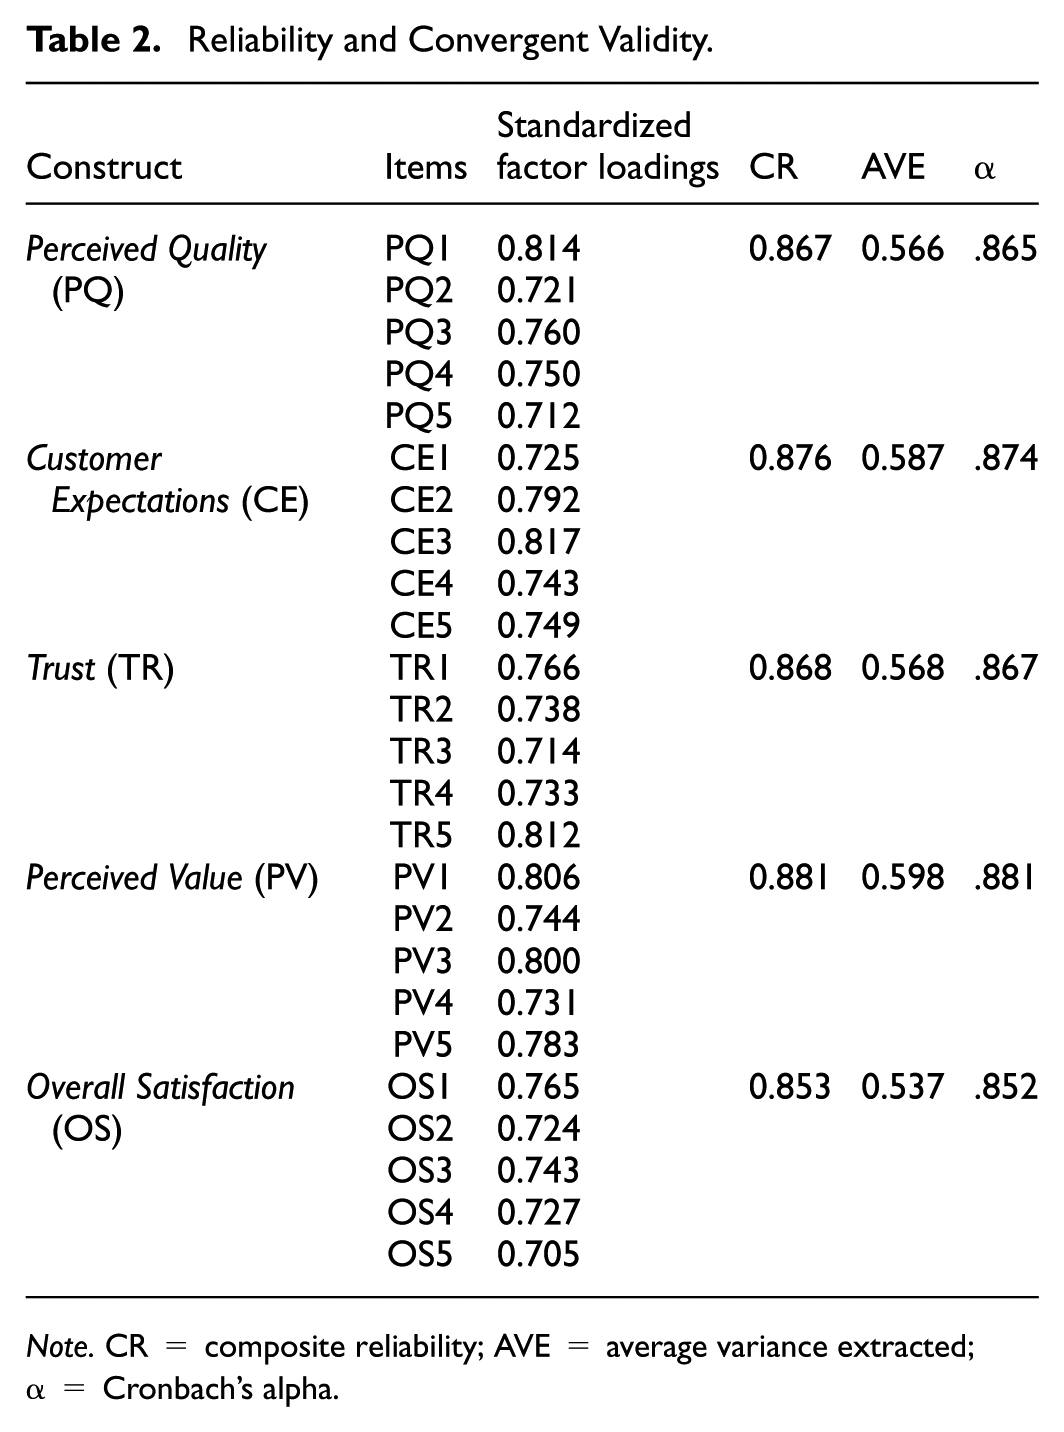
Note. CR = composite reliability; AVE = average variance extracted; α = Cronbach’s alpha.
The Inter-Construct Correlation Matrix.
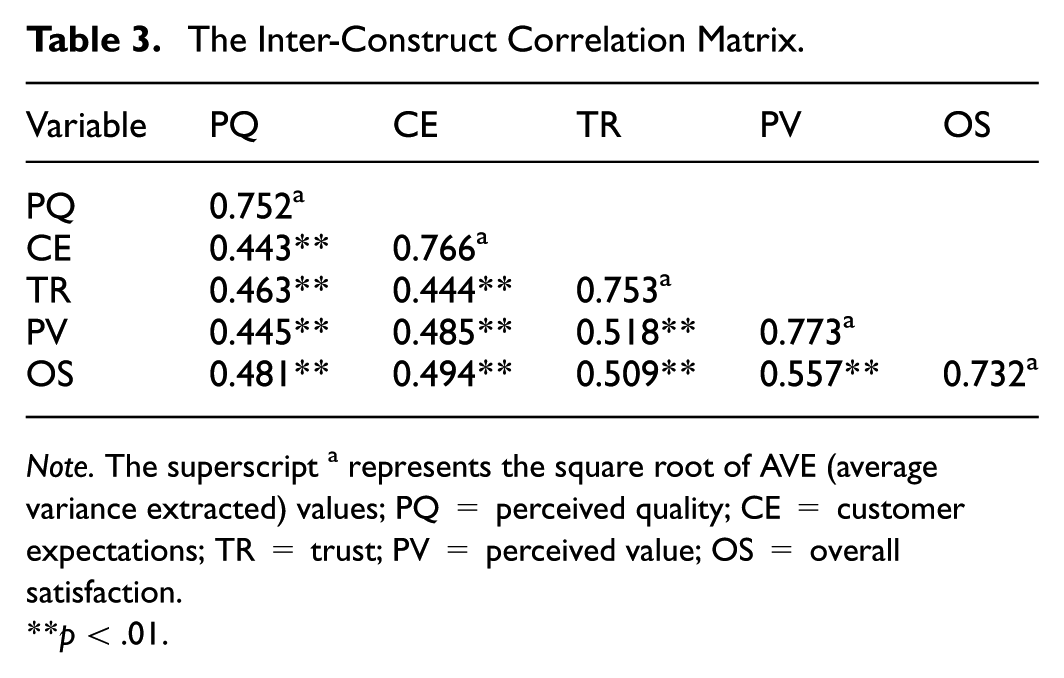
Note. The superscript a represents the square root of AVE (average variance extracted) values; PQ = perceived quality; CE = customer expectations; TR = trust; PV = perceived value; OS = overall satisfaction.
p < .01.
Results of Estimated Path Coefficients.

Note. S.E = standard error; PQ = perceived quality; CE = customer expectations; TR = trust; PV = perceived value; OS = overall satisfaction.
p < .001.
The Structural Model Fit Indices.

Note. CMIN = Chi-square statistics; DF = degree of freedom; GFI = goodness-of-fit index; RMSEA = root mean square error of approximation; IFI = incremental fit index; TLI = Tucker-Lewis index; CFI = comparative fit index.
Results of Mediation Analysis.

Note. CI = confidence interval; S.E = standard error; PQ = perceived quality; CE = customer expectations; TR = trust; PV = perceived value; OS = overall satisfaction.
The fsQCA Analysis
The average values of the five associated items for each variable (as a set in the fsQCA analysis) in the Likert scale were first calculated. The data were then converted into membership scores spanning from 0 to 1. This study follows the guidance of existing literature (Kumar et al., 2022; Pappas & Woodside, 2021) and the thresholds for fully in, crossover, and fully out were established using the 95th, 50th, and 5th percentiles of the data. Table 7 shows the descriptive statistics and the corresponding calibration anchors. In this study, a necessity analysis was carried out to ascertain whether any single condition is requisite for attaining high or low overall satisfaction. Evidently discernible from Table 8 is the fact that, no single condition variable can be deemed necessary to exclusively predict high or low overall satisfaction, as the calculated consistency values are all below 0.9. This study further conducted the necessity analysis in NCA (necessary condition analysis) method proposed by Dul (2016), As NCA and fsQCA provide complementary insights (Dul et al., 2020). First, Table 9 indicates that the results of NCA analysis appear to be consistent with the necessity analysis from fsQCA. Effect size indicates the minimum level required for a necessary condition to produce a specific outcome. The value of the effect size ranges from 0 to 1. According to Dul et al. (2020), there are two recommended criteria for determining whether a condition is necessary: first, the effect size must be greater than 0.1, as smaller effect sizes are deemed insignificant; second, the p-value from the permutation test should be below .05 to confirm that the effect size is not due to random chance. When the effect size is less than 0.1, it usually represents a low level. When the effect size is between 0.1 and 0.3, it represents a medium level, and the closer the effect size is to 1, the higher the level it represents. As can be seen from Table 9, CE, PV, and TR are all not necessary “in degree” using either the ceiling regression with a free disposal hull (CR-FDH) or the ceiling envelopment with a free disposal hull (CE-FDH). Regarding PQ, although the p-value is less than .05, the values of d fluctuate slightly around the 0.1 threshold, making it insufficient to convincingly establish PQ as a single necessary condition. The NCA scatter plots with ceiling lines are illustrated in Figure 2. The results clearly suggest that a single condition variable is highly unlikely to be necessary. Additionally, Table 10 suggests that, for a particular level of the outcome variable OS, the levels (%) specified for each condition variable in the bottleneck table must be satisfied. For example, perceived quality > 23.7% is necessary for overall satisfaction > 80%. Overall, the results from the NCA analysis is similar to the fsQCA analysis. The necessity analysis underscores the intricate and nonlinear nature of customer satisfaction. Therefore, the interplay of multiple factors and their combinations can be essential to comprehend the diverse pathways that lead to varying levels of satisfaction.
Descriptive Statistics and Calibration Anchors.

Note. This study employs the 95th-50th-5th percentile calibration; SD = standard deviation; Max = maximum value; Min = minimum value; PQ = perceived quality; CE = customer expectations; TR = trust; PV = perceived value; OS = overall satisfaction.
Results of Necessity Analysis.
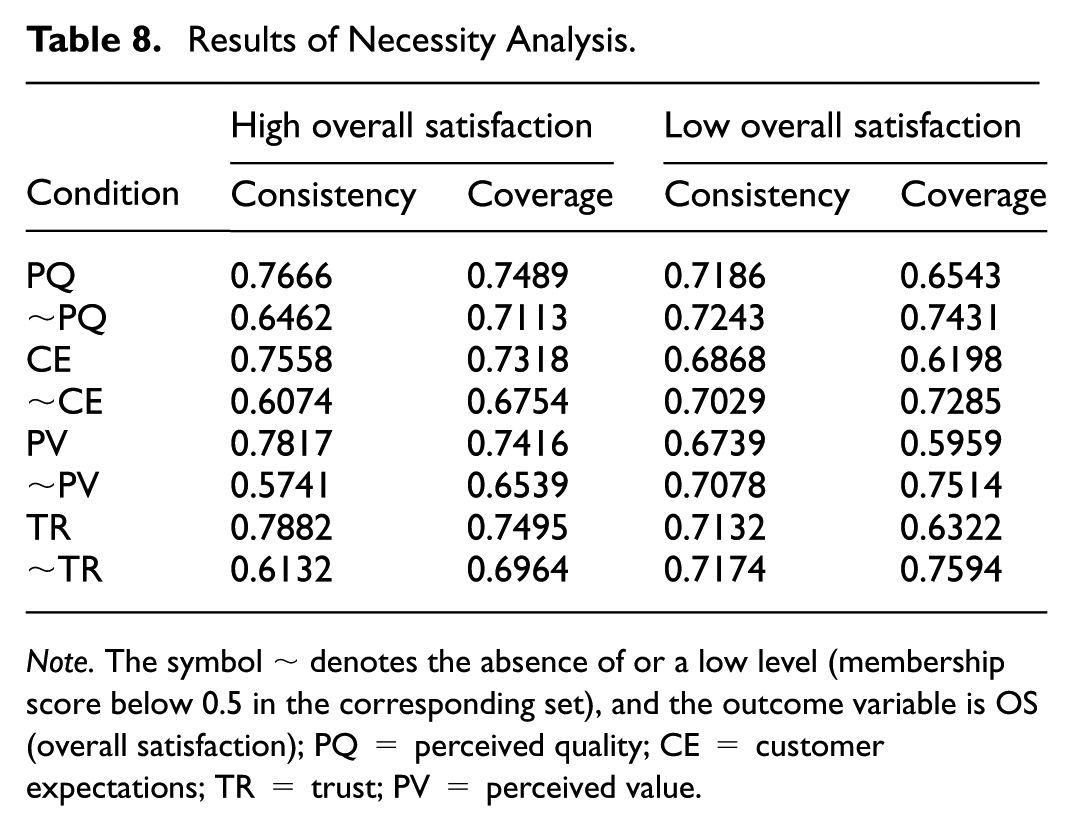
Note. The symbol ∼ denotes the absence of or a low level (membership score below 0.5 in the corresponding set), and the outcome variable is OS (overall satisfaction); PQ = perceived quality; CE = customer expectations; TR = trust; PV = perceived value.
Results of the NCA Analysis.
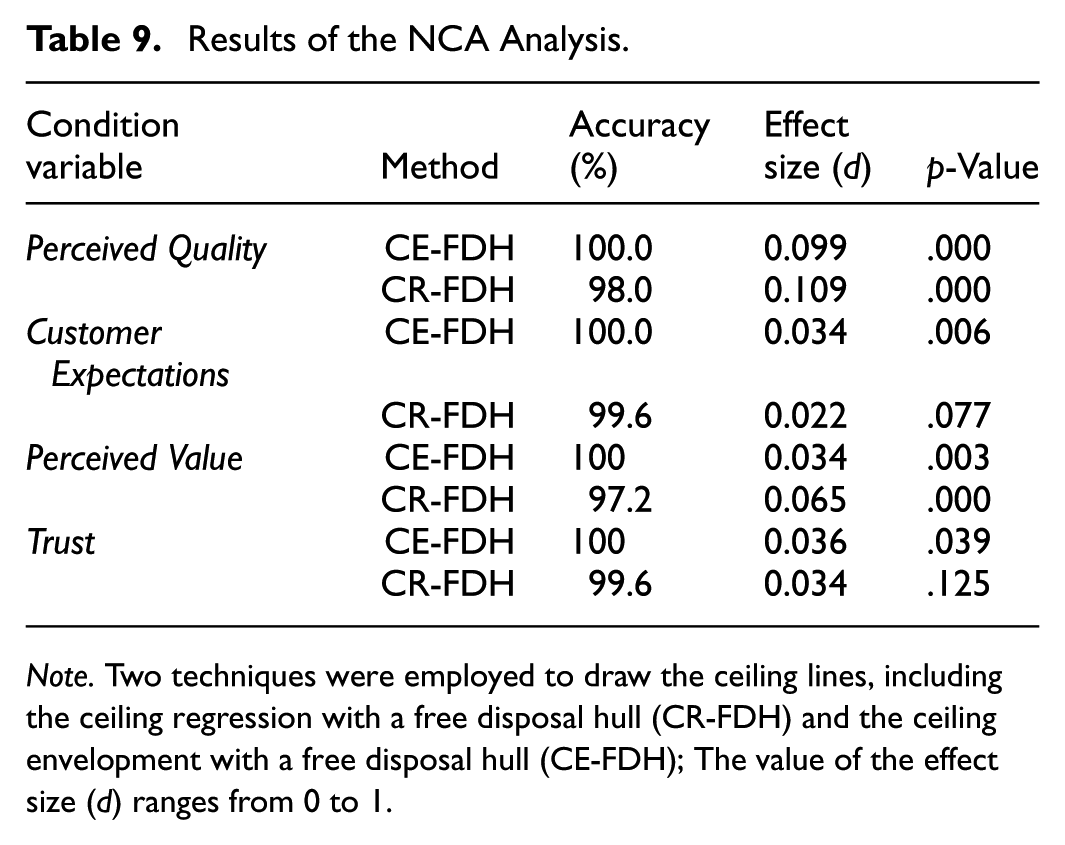
Note. Two techniques were employed to draw the ceiling lines, including the ceiling regression with a free disposal hull (CR-FDH) and the ceiling envelopment with a free disposal hull (CE-FDH); The value of the effect size (d) ranges from 0 to 1.

The NCA scatter plots.
Results of the Bottleneck Level (%) by NCA Approach.

Note. The outcome variable is OS (overall satisfaction); The term “NN” denotes “Not Necessary”; The necessary condition analysis (NCA) approach specifically seeks to find conditions that must be present for an outcome to be possible; We adopt the ceiling regression with a free disposal hull (CR-FDH) method to produce the results.
A sufficiency analysis was then conducted using a frequency benchmark value of 1 and a raw consistency score of 0.80. The proportional reduction in inconsistency (PRI) cutoff level of 0.70 was selected (Pappas & Woodside, 2021; Patala et al., 2021). Table 11 shows six configuration pathways (intermediate solutions) for achieving high overall satisfaction in the context of STMs. The dark black circle and the cross-out circle denote the condition exists (•) or not (⊗) respectively. First, the values concerning consistency and coverage all pass recommended thresholds (Kumar et al., 2022). Consistency is the proportion of cases exhibiting a given combination of causal conditions also exhibit the outcome. In other words, consistency reflects how likely it is that a specific combination of condition variables will produce the outcome. The overall solution coverage is 0.734, suggesting that 73.4% of the respondents with high overall satisfactions can be explained by the six configurations. Second, our fsQCA analysis mandates the presence of a minimum of two condition variables for attaining high overall satisfaction. For example, the solution S1 suggests a configuration for high overall satisfaction that requires the collective presence of high perceived quality, high customer expectations, and high trust. Overall, the fsQCA results indicate customer satisfaction’s multifaceted essence and non-linear governing dynamics, implying the fusion of multiple conditions for achieving higher customer satisfaction toward STMs installed by commercial banks.
Configuration Pathways for High Overall Satisfaction.

Note. Proportional Reduction in Inconsistency (PRI) was set at a level of 0.70, the minimization was performance through Quine-McCluskey algorithm; (•) and (⊗) represent whether the condition exists or not, respectively; The big symbols indicate the conditions are core while the small symbols indicate the conditions are peripheral; The blank space signifies that the presence or absence of a condition variable is inconsequential.
Discussion
This study investigates factors determining customers’ satisfaction with STMs in commercial banks according to an expanded ACSI model. First, the research findings posit that perceived quality exerts a direct influence on overall satisfaction, aligning with the extant literature (Ananda et al., 2023; Oliveira et al., 2023; Samudro et al., 2020; Zhong & Chen, 2023). It has been demonstrated that there is an indirect impact on overall satisfaction through perceived value, indicating that customers may use perceived quality as a cue to evaluate the value of STMs. When customers perceive STMs to exhibit high quality, they are inclined to regard them as imbued with high intrinsic value, which can further lead to increased satisfaction. Second, it has been shown that customer expectations can be another important factor that contributes to overall satisfaction with STMs. The more STMs that exceed customer expectations, the more likely STMs to be perceived as satisfactory. This finding resonates with previous scholarly investigations in other contexts (Deng et al., 2013; Tukiran et al., 2021). Moreover, the effect of customer expectations on perceived value is significant, suggesting that customers may use their expectations as a reference point for evaluating the value of STMs. The more STMs exceed their expectations, the more likely they perceive STMs as valuable. It has also been illustrated that there is a notable positive impact of perceived value on overall satisfaction, and this finding not only aligns well with research in diverse scenarios, but also remains consistent across various cultural environments (Jalil et al., 2016; Preko et al., 2020). Besides, the path coefficient regarding the effect of perceived value on overall satisfaction has a value of 0.332, greater than other factors. This study also demonstrated the suitability of integrating trust into the basic ACSI framework. It has further been unveiled that trust has a positive impact on overall satisfaction, indicating that customers who perceive STMs to be trustworthy would likely to feel satisfied. Contributing to a growing body of literature concerning customer behavior within finance-related contexts (Firmansyah et al., 2022; Utami et al., 2021), this study validates the crucial role of trust in molding satisfaction.
In light of the fsQCA results, it appears that there is a complex interaction among variables, which emphasizes synergistic relationships at its core. In the necessity analysis, a noteworthy insight has been revealed that high satisfaction is not dictated by any isolated factor. In the sufficiency analysis, the finding suggests a compelling pattern that achieving the outcome requires the presence of at least two condition variables. This finding resonates with the notion that the modern customer experience can be a web of intertwined elements (Jain et al., 2017). In supplement to the SEM results, insights from the fsQCA analysis illuminate intricate, non-linear customer satisfaction dynamics, stressing comprehensive, multidimensional strategies for enhancing customer satisfaction.
This study provides several significant implications. Academically, this study contributes to the academic discourse by revealing the intricate, non-linear nature of customer satisfaction. This enriches theories surrounding consumer behavior and highlights the need for more studies to comprehend the dynamics at play. It has been shown that the application of fsQCA in conjunction with SEM is suitable. The hybrid approach not only provides information regarding the individual effects, but also uncovers synergistic pathways for achieving a specific outcome. This study may offer some guidance on research methodology for exploring complex phenomena. Practically, the research findings have implications for commercial banks and policymakers. First, banks are recommended to install smart teller machines that are user-friendly, reliable, and efficient. Banks should also adopt high-quality software or hardware to provide customers with a hassle-free experience. It is suggested that banks should continuously gather feedback from customers to understand their expectations and improve the functionality of STMs accordingly. Second, banks are recommended to offer various value-added services on STMs, such as financial planning, investment advice, etc., to enhance perceived value. Third, since trust is an important factor determining overall satisfaction, banks can implement various security measures, maintain transparency in communications with customers, and inform customers of any potential risks associated with STMs. These actions would help build trust to enhance customer satisfaction. Fourth, banks can allocate resources strategically by prioritizing the condition variables that consistently contribute to high satisfaction. As for policymakers, they can introduce incentives such as tax credits and subsidies for research and development, to encourage banks to invest in technological innovations. Meanwhile, policymakers are also recommended to establish appropriate regulations and guidelines regarding STMs, to protect customers’ data and privacy. This would also help build public trust to enhance customer satisfaction with STMs. Overall, it is imperative to ensure that both consumers and industries benefit from improved satisfaction outcomes and a more comprehensive understanding of the multifaceted nature of customer experiences.
Concluding Remarks
Conclusions
This study investigates customers’ overall satisfaction with STMs according to a conceptual framework adapted from the ACSI model, along with the inclusion of a trust variable. The established model allows for a comprehensive examination of the factors affecting customer satisfaction. A hybrid SEM-fsQCA approach has been adopted to uncover the dynamics between variables. First, the SEM results indicated that perceived quality, customer expectations, perceived value, and trust all played important roles in shaping overall satisfaction levels. Perceived quality and customer expectations also exhibit indirect effects through the mediation of perceived value. Second, the fsQCA results provide supplementary information with respect to the configuration pathways for high customer satisfaction outcome. It has been revealed that none of the factors deemed necessary, but a certain combination of multiple conditions could be sufficient to produce a high level of satisfaction.
Limitations and Future Research
The present research has some limitations. First, this study only adopted a cross-sectional design, precluding the ability to ascertain how the relationships between variables may change over time. A longitudinal study is highly recommended for future research to capture potential temporal dynamics and provide a more complete understanding of the customer’s evolving relationship with AI-driven banking services. Second, this study relied heavily on quantitative survey data, which may not capture the richness and complexity of customers’ perceptions with respect to STMs. We strongly recommend that future research employ a mixed-methods approach, supplementing quantitative surveys with qualitative methods such as in-depth interviews or case studies. This would provide invaluable context to our findings and help generate more actionable, in-depth recommendations for bank managers and system designers. Third, it is also academically interesting to examine customer satisfaction with other types of advanced technologies or systems, and this may help ascertain the reliability of the current conceptual model. Fourth, our sample was collected exclusively from customers in Shanghai, a major metropolitan area in China. The geographical concentration and the use of convenience sampling may limit the generalizability of our findings to other regions, particularly rural or less-developed areas where consumer demographics, technology infrastructure, and adoption patterns may differ significantly. Our sampling strategy was based on the current reality that STMs are an emerging technology primarily deployed in large, urban financial centers. Nevertheless, as these systems become more widespread, their role in financial inclusion will be critical to study. Therefore, we strongly recommend that future research validate and extend our findings by using a more diverse sample that includes participants from various regions, age groups, and levels of technological proficiency.
Footnotes
Appendix
The Measurement Items.

| Constructs | Measurement items |
|---|---|
| Perceived Quality | PQ1. The STM provides reliable information. |
| PQ2. The STM provides sufficient information. | |
| PQ3. The interface of the STM is well-designed and easy to navigate. | |
| PQ4. The STM is free from errors. | |
| PQ5. The STM has excellent features. | |
| Customer Expectations | CE1. The performance of the STM was better than what I expected. |
| CE2. The range of services offered by the STM exceeded my initial assumptions. | |
| CE3. The ease of use of the STM surpassed my expectations. | |
| CE4. My overall experience using the STM was more positive than I anticipated. | |
| CE5. The STM has impressed me more than I originally thought it would. | |
| Perceived Value | PV1. The STM helps me complete my banking tasks efficiently. |
| PV2. Using the STM saves me time and potential costs compared to other methods. | |
| PV3. I feel smart and in control when using the STM for my banking needs. | |
| PV4. Banking with the STM offers great monetary value. | |
| PV5. The STM is leaving me with an impression of notable emotional value. | |
| Trust | TR1. I am confident my personal information is secure when using the STM. |
| TR2. I believe the STM will process my transactions accurately. | |
| TR3. The STM operates reliably and consistently. | |
| TR4. I feel I can depend on the STM to handle my banking needs correctly. | |
| TR5. I am not technologically anxious when using the STM. | |
| Overall Satisfaction | OS1. I am generally satisfied with the performance of the STM. |
| OS2. My experience with the STM has been consistently satisfying. | |
| OS3. My interactions with the STM are always satisfying. | |
| OS4. I am content with the service provided by the STM. | |
| OS5. Banking with the STM has been very satisfactory. |
Ethical Considerations
This research was approved by the Ethics Committee of Sanda University (No. 2023125), and it adhered to the principles and guidelines of the Declaration of Helsinki. This study ensured voluntary participation, with completed surveys signifying informed consent and the responses from participants were handled confidentially and anonymously.
Author Contributions
Both authors have made equal contributions to the work and share first authorship.
Funding
The authors disclosed receipt of the following financial support for the research, authorship, and/or publication of this article: This research was supported by Humanities and Social Sciences Project of the Ministry of Education (Grant No. 24YJCZH339).
Declaration of Conflicting Interests
The authors declared no potential conflicts of interest with respect to the research, authorship, and/or publication of this article.
Declaration of Generative AI in the Writing Process
During the preparation of this work the author(s) used Gemini 2.5 and DeepSeek-R1, in order to improve language and readability. After using this tool/service, the author(s) reviewed and edited the content as needed and take(s) full responsibility for the content of the publication.
Data Availability Statement
Data will be made available on request.