
Abstract
Capital structure directly affects the financial health of companies. This research addresses a significant gap in understanding the relationship between capital structure and key economic-financial variables in the road transport sector in Spain. Its analysis seeks to improve SME financial management and strengthen the economic framework in Spain and Europe. Robust analyses of 398 Spanish road transport SMEs (2012–2021) were performed using the Arellano-Bond GMM model with lagged variables to address endogeneity. GMM estimator deals with the problem of endogeneity, serial correlation, and unobserved heterogeneity. This approach enables a detailed examination of the impact of ROA, ROE, tangibility, asset size, and type of indebtedness on capital structure. Additionally, a fixed-effects regression model was employed to ensure greater robustness. The empirical findings reveal that capital structure is positively related to short- and long-term debt and ROA, but negatively related to ROE. Annual fluctuations indicate a pattern where increases in debt levels 1 year are often followed by reductions in the next, reflecting a conservative approach to financial management. Tangibility, trade credit ratio, and asset size showed no significant effect. The findings primarily support the Trade-Off Theory. The econometric model enables the design of new debt policies to improve the profitability of transport companies. In turn, it helps to understand intertemporal dynamics, reducing debt-related risks while strengthening resilience. It also fills a key research gap and helps financiers assess capital structure with other financial metrics.
Introduction
Capital structure refers to the mix of debt and equity a company uses for financing. In particular, in the road transport sector, financial health is crucial for firm growth and sustainability. Moreover, Ting et al. (2021) highlight that capital structure plays a fundamental role in determining a company’s performance. More broadly, transportation is vital for quality of life, governance, and social organization. Consequently, this highlights the need for sound financial management in the transport sector. Furthermore, it is an important pillar in the economy of any country, since exports and imports depend on transport, just as the digital economy is nourished by transport systems.
While prior studies have analyzed factors influencing capital structure, none have focused on the road transport sector. Therefore, building on this context, this work seeks to fill that gap, using mathematical and statistical techniques to optimize financial management in this sector. Specifically, this approach evaluates the impact of capital structure and its annual variations, introducing a novel perspective to corporate finance research.
The study analyzes 398 Spanish road transport SMEs (2012–2021) with operating income between €2 to €50 million. At the macroeconomic level, according to ICEX (2022), this sector constitutes 6.9% of Spain’s GDP. Moreover, this percentage rises to 10% if logistics activities carried out by industrial, commercial and service companies are incorporated.
Based on the above, the main objective is to assess how variables such as return on assets (ROA), return on equity (ROE), asset size, current and non-current liabilities, among others, influence the capital structure. Furthermore, it seeks to examine the dynamics of these interactions in response to fluctuations in the variables mentioned from year to year. To this end, the aim is to develop a model and analyze which variables, as identified in previous literature, significantly influence the capital structure within the context of established theories. This objective is important because greater control over the capital structure in the road transport sector allows for greater resilience in the face of crises and fluctuations in fuel prices. As a result, this strengthens product supply and indirectly impacts other sectors.
There are several theories that explain capital structure, with the most widely supported being the Pecking Order Theory, Supply-Based Theories, the Traditional Financial Equilibrium Theory, and the Agency Theory (Fukui et al., 2023). Moreover, there are various assumptions as to how each variable can influence the capital structure from existing theories, and how this relationship can have a significant influence on effective financial management in road transport SMEs. This understanding assists researchers and transport company managers in examining the scientific implications of capital structure on business performance.
The main research questions addressed are:
Do return on assets (ROA), return on equity (ROE), current liabilities, and non-current liabilities influence the capital structure of SMEs in the road transport sector?
What about the impact of asset size, tangibility, and the commercial credit ratio?
How does the capital structure fluctuate, as explained by the performance of various business performance indicators, based on a decade of data?
How do the study’s findings align with capital structure theories, such as the Trade-Off Theory and the Pecking Order Theory, in the context of road transport?
Which findings align with or diverge from those in other regions and sectors concerning capital structure?
Methodologically, we apply econometric models to identify factors that enhance business viability. For this purpose, we employed a fixed-effect regression model with temporary dummy variables and robust standard errors. This model captures linear and quadratic effects in the explanatory variables, considering residuals and lags in model fit. We also compared it with the Arellano–Bond model to assess the robustness of each variable’s effect. We also measured variable correlations to identify significant relationships.
A key finding is the significant influence of certain variables on the capital structure of road transport companies. Specifically, there is evidence of a positive and remarkable relationship between the variables “current liabilities,”“non-current liabilities” and “ROA” with the capital structure. By contrast, a significant negative relationship was observed with “ROE.” This reveals a complex dynamic that can help firms manage their finances more efficiently.
Historically, the research is justified by following the capital structure trend initiated by Miller (1958), Myers (1984), and Frank and Goyal (2009), who laid the foundations for understanding capital structure. Furthermore, recent studies such as those by Damayanti and Darmayanti (2022), and N. P. Singh and Bagga (2019) analyzed how variables like profitability, company size, and liquidity affect companies’ capital structure. Additionally, Kuč and Kaličanin (2021) and Ngatno et al., (2021) studied the differentiated effects of short-term and long-term debt on capital structure, highlighting the importance of theories like the Trade-Off and Pecking Order. In addition, debt adjustment speed varies by country, sector, and firm size, consistent with different capital structure theories (Sunitha, 2024). Moreover, international studies highlight regional transport differences, underscoring the need to study Spain’s transport capital structure (Mazanec, 2023a).
By contrast, our study indicates no significant relationship for “size of the company based on total assets,”“tangibility,” and “trade credit ratio.” This distinction clarifies the essential variables for subsequent analyses and decision-making. Furthermore, the model explains 53.17% of the debt-to-equity ratio variance, capturing how annual fluctuations affect capital structure. This level of explanatory power is consistent with previous studies, such as Mazanec (2023b), which found explanatory power values between 44% and 60%.
These findings support more informed financial strategies for road transport SMEs, optimizing their capital structure. For it, this study has the potential to benefit the financial and strategic management of companies in this vital sector of the Spanish economy. In a broader context, it strengthens transport networks connecting smart towns, cities, and digital enterprises nationally and internationally.
Literature Review
Business financing, particularly the firm’s capital structure, is a key determinant of corporate success and competitiveness (Brusov & Filatova, 2023). In this context, economic models help decision-makers make informed choices about capital structure. More specifically, analytical models typically distinguish between external determinants (macroeconomic, institutional, market conditions) and internal choices (profitability, size, asset structure). Together, both influence each other and provide a clear foundation for understanding the financial structure of companies. However, the application of these models often depends on contextual and environmental factors. Notably, capital structure behavior varies across countries due to sector-specific market characteristics. Therefore, it is vital to analyze the capital structure in a homogeneous market, such as a specific country, where external factors affect firms more uniformly across the market. Consequently, this topic continues to draw the attention of researchers and business leaders from various fields, all seeking to make sound financial decisions (Hai, 2021). In this vein, capital structure has been studied, with some of the main variables explored being size, profitability, growth potential, risk, and tangibility, among others (Booth et al., 2001; Chakraborty, 2010; Rajan & Zingales, 1995; Titman & Wessels, 1988).
Beyond empirical observations, information asymmetry arises when one party (e.g., management) possesses more accurate information than another (e.g., investors). This discrepancy can result in suboptimal decisions or create distrust between the parties involved. In this context, capital structure techniques aim to determine the optimal mix of funding sources for a corporation. In particular, some of the prominent theories related to capital structure include the Signaling Theory, Trade-Off Theory, and Pecking Order Theory. The Trade-Off Theory (TOT) proposes that firms balance borrowing costs and benefits to achieve an optimal capital structure that maximizes value and minimizes risk (Agyei et al., 2020). Accordingly, based on these theoretical frameworks, recent studies have explored how short-term and long-term debts differently affect the capital structure.
Turning to the empirical evidence, several studies find that ROE and ROA are key profitability indicators for predicting the debt structure and financial health of companies, including those in the logistics and transport sector (Agliardi et al., 2024; Brahmana, 2025; Bužinskienė & Gelashvili, 2024; Digdowiseiso & Amalia, 2025; Mahima Ima et al., 2024; Nguyen et al., 2024; Ra, 2024). These studies further show that the relationship between the capital structure and variables such as profitability, company size, and liquidity, significantly impacts the value of the company. In certain cases, such as that of Damayanti and Darmayanti (2022), it was observed that in the context of transport and logistics companies listed on the Indonesian Stock Exchange, the capital structure negatively and significantly influenced the value of these companies.
Consistently, several studies align with the findings reported by Riwu-Manu et al. (2019), who concluded that profitability positively impacts both the capital structure and the value of the company. This dynamic is echoed by N. P. Singh and Bagga (2019), who identified a significant positive correlation between capital structure and corporate profitability. Likewise, it was emphasized that the size of the company positively and significantly influenced the capital structure, while the growth of the company exhibited a negative and significant impact on said structure. Taken together, these studies underline the multifaceted nature of capital structure determinants, which justify the relevance of analyzing working capital and liquidity management.
Building on the above evidence, efficient working capital management is crucial to prevent overinvestment in short-term assets, optimize profitability, and maintain the necessary operational liquidity (Demiraj et al., 2022). For example, empirical evidence further shows that profitability, firm age, liquidity, growth, size, and asset tangibility have a significant impact on the capital structure of SMEs in Ghana (Agyei et al., 2020).
Similarly, in East Africa, capital and asset structure strongly affect performance: debt and fixed assets raise return on assets, but excessive long-term debt lowers return on equity (Priyan et al., 2024).
Drawing on these theoretical frameworks, recent studies have examined the differing effects of short-term and long-term debt on capital structure. Kuč and Kaličanin (2021) show that short-term indebtedness and total debt, aligning with the theory of hierarchical order, have a negative correlation with respect to the capital structure. Conversely, when long-term indebtedness is considered as a dependent variable, a positive relationship is observed, consistent with the trade-off theory. In contrast, Ngatno et al., (2021) found that corporate governance positively moderates the effect of capital structure decisions on short-term financial performance. By contrast, long-term debt shows a small negative association with ROA and return on capital.
From a macroeconomic perspective, transport plays a crucial role in economic growth, contributing to outcomes like agricultural sales, expanded trade, and the promotion of education. Moreover, as companies expand digitally and adopt models like digital twins, they depend on transport to move products between firms and customers. As a result, advancements in transport enhance productivity across other sectors of the Spanish economy. In fact, advances in transport improve mobility, delivery speed, cost efficiency, service quality, and resource use (Gimeno, 2024).
Building upon these premises, recent research highlights the growing relevance of data-driven mathematical models for strategic decision-making in resource allocation, aiming to maximize profit margins in transport companies (Derkacz et al., 2023; Kovács, 2023; Rykała & Rykała, 2021). Consequently, this study analyzes how capital structure affects the financial performance of Spanish transport companies, a sector contributing 6.9% of Gross Domestic Product (ICEX, 2022).
In addition to internal determinants, external factors also influence capital structure. One of them is economic crises, an aspect little analyzed, since most studies focus on internal variables. For instance, Moradi and Paulet (2019) point out that the euro crisis impacted the transport and tourism sector more noticeably compared to the retail and services, manufacturing and construction sectors. Growth, profitability, tax shields, and the euro crisis are negatively related to leverage and the debt-to-equity ratio, but positively associated with net worth.
Furthermore, the borrowing capacity can affect companies and governments to handle extreme adverse situations, since in certain cases it is a public service. In this regard, Eichengreen et al. (2021) argue that the ability of governments to contract debts has been key to responding to critical situations, from armed conflicts and disease outbreaks to economic and financial turbulence. Moreover, public debt is essential for providing key services such as transport, education, and health care.
Turning to valuation and performance, market value is markedly influenced by the composition of debt. In particular, both overall leverage and short-term obligations adversely affect market value, indicating that increasing debt is not always beneficial (Massadeh et al., 2021). The economic performance model indicates that both profitability and productivity have a positive and noticeable influence on the performance of transport companies. Conversely, indebtedness adversely affects their performance (Açikgöz & Fidan, 2023).
Finally, in the specific case of the transport sector, there is a relationship between sustainability levels and financial performance, meaning that companies committed to environmental responsibility also tend to show greater commitment to their financial management, leading to an increase in firm value (Abdi et al., 2020). This suggests a link between capital-structure choices and green finance.
Methodology
Market conditions, financial decisions, and funding constraints jointly influence firms’ capital structure (Kumar et al., 2020). In accounting terms, this refers to the combination of elements that are reflected on the right side of the balance sheet. For this analysis, 398 Spanish companies were selected under the CNAE 2009 code “4,941 – Road freight transport.” From this initial sample, we focused on companies that were active between 2012 and 2021 and reported operating income between 2 and 50 million euros. The financial and economic data used in this study were obtained from the Balance Sheet Analysis System (SABI) database, a widely used and well-documented commercial database that compiles harmonized financial statements for Spanish firms. In particular, SABI is frequently employed in academic research on firm-level capital structure and performance, which ensures the reliability and comparability of the information (García-Sánchez, 2021; Gomes et al., 2022; Hernández-Nicolás et al., 2021).
As most firms are SMEs, the analysis focuses on this group to avoid distortions from large firms or microenterprises. The period is justified by data availability, providing a 10-year span that is sufficiently broad for conducting a time series study from an econometric perspective. Moreover, the provided data is highly balanced.
The Hausman test indicated that the fixed-effects model was most suitable for capturing unobserved firm differences and temporal lags (Baltagi & Liu, 2016). The Arellano-Bond GMM addresses endogeneity and prevents bias in long-term panel data, ensuring robust estimates, particularly in the economic-financial context. To address this limitation, annual dummy variables were added to capture unexplained time effects, such as macroeconomic shocks. In addition, quadratic terms detect nonlinear patterns, while lagged variables capture the impact of past decisions on current capital structure. Taken together, all of this, along with the use of standardized residuals and robust standard errors (robust VCE), ensures that the model can provide accurate and reliable estimates even when the data exhibit heteroscedasticity and autocorrelation issues.
Various researchers have considered different variables when studying the capital structure. Priyanka and R. Singh and Singh (2023) and Dsouza et al. (2024), for example, incorporated into their model variables such as the commercial credit ratio (CC), long-term debt ratio (LD), short-term debt ratio (SD), state participation ratio (SS) and asset size (SZTA). Likewise, Jaworski and Czerwonka (2021), Daskalakis et al. (2023) and Mazanec (2023b) took into account variables such as tangibility (TANG) and return on assets (ROA). N. P. Singh and Bagga (2019) focused on profitability metrics, including return on assets (ROA) and return on equity (ROE). Drawing on these previous studies, we defined and calculated the following variables in Table 1:
Independent Variables and Dependent Variable

Source. Own elaboration.
As part of the secondary processing of the data, we computed the corresponding financial ratios, applied a logarithmic transformation to total assets (SZTA = ln(TA)), created quadratic terms (SD2) to capture potential nonlinearities, and generated lagged variables (L1 and L2) to model leverage dynamics. We also constructed yearly dummy variables for the period 2012 to 2021 to capture time-specific shocks and macroeconomic conditions that are not directly observable in the financial statements. In addition, we used standardized residuals to identify and remove extreme outliers (|standardized residual > 3) before estimating the econometric models.
Since the data cover a period of 10 years (2012–2021), we applied various econometric techniques. Specifically, regression analysis was used to understand the relationships, correlation to identify the strength and direction of associations, and the Arellano Bond method.
Within this framework, we applied Hausman’s test to decide whether it is more appropriate to use a fixed-effect model or a random-effects model. This method, applied in panel data analysis, helps determine the suitability between a random-effects model or a fixed-effect model in capital structure (Ali et al., 2022). This test contrasts the coefficient estimates of both models to see if the discrepancies are statistically relevant Mendoza (2022). After the test, it was determined that the best choice was fixed effects. In a fixed-effect regression model, dummy variables are used for each entity, capturing unobservable differences. These variables eliminate the influence of constant characteristics, improving the accuracy in estimating effects of interest (Eltayeb & Hag-Elsafi, 2023). Moreover, in the process, we incorporated quadratic and linear effects, standardized residuals of the dependent variable, and robust methods such as robust vce. We also included temporal differences to address autocorrelation and lags to fine-tune model fit. Thus, it is a fixed-effect regression model with time dummies variables using robust standard errors.

Quadratic effects help detect nonlinear relationships and improve estimation accuracy (Henseler et al., 2012). In parallel, these values help assess how well a management system is performing and detect unusual data or points that can significantly affect the model. From here, values that exceed the value three are deleted. On the other hand, robust methods for calculating standard errors provide accurate estimates even when there is anomalous or extreme data. This approach is crucial when data violate normality or homoscedasticity assumptions. Additionally, lags refer to previous data of a variable over time. Specifically, Arellano and Bover (1990) define lags as previous records of a variable taken at earlier times. These are often employed in regression models to understand dynamic relationships, that is, how past observations of a variable can influence its present or future values.
Model assumptions were tested for heteroscedasticity (Modified Wald), autocorrelation (Wooldridge), multicollinearity (VIF), and linearity and normality (histograms). The Wooldridge test assesses heteroscedasticity and autocorrelation in panel regressions using squared residuals to produce a chi-square statistic.

The Variance inflation factor (VIF) is an indicator used in linear regression to identify and quantify multicollinearity, evaluating how independent variables are interrelated (Kalnins & Praitis Hill, 2025).

Moreover, the modified Wald test represents an improvement over the Wald test, which uses the restricted maximum likelihood estimate (CMLE) for the standard error. Instead, this test replaces the maximum likelihood estimate of the reference standard deviation with a sample-derived estimate (Yakubu & Abdul-Jalil, 2016).
Furthermore, as Zhang and Zhou (2020) point out, the Arellano-Bond GMM estimator method is an estimation approach to data analysis that models the temporal trends of variables. This method was previously employed in studies on capital structure and its relationship with firm performance (Tran et al., 2025; Xuan Nguyen et al., 2025). Therefore, this strategy uses a regression model with fixed effects and lagged variables as predictors. It is used in economic and financial studies for its ability to manage fixed effects and the endogeneity of independent variables.
Next, the methodology is fully reflected visually in Figure 1.

Methodology in a simplified way.
Results
Capital structure remains an enigma among financial scholars. It shapes investors’ decisions by affecting firm value (Diantimala et al., 2021). Sound capital-structure management improves financial health; our transport-sector model offers decision support for a key Spanish industry. Therefore, it becomes essential to create a well-organized transport system, with effective leadership, clear financing options, transparency and a medium and long-term perspective (Santos et al., 2020).
The regression captures nonlinearity and uses the following fixed-effects notation:
- sq → A quadratic term with a polynomial variable is introduced to capture nonlinear effects. The affected variable is SD_sq_diff2.
- lag → Lags of the variable are included to control autocorrelation with the dependent variable. The affected variable is DER_lag_diff2.
- diff2 → Represents year-to-year temporal differences. It affects variables like DER_lag_diff2, LD_diff2, and SD_sq_diff2, allowing us to observe how these variables’ fluctuations influence the model.
As an innovative contribution, the model presented below explains how changes in indebtedness, together with ROA and ROE, affect the growth or decrease of the debt-to-equity ratio (DER) in both the short and the long term.
Fixed-Effect Model
We estimate a fixed-effects regression with robust standard errors (vce robust). Specifically, as can be seen in Table 2, we model DER_diff2 as a function of established economic-financial covariates. The period of the data panel covers from 2012 to 2021 in all the investigations consulted.
Regression Explaining Capital Structure.
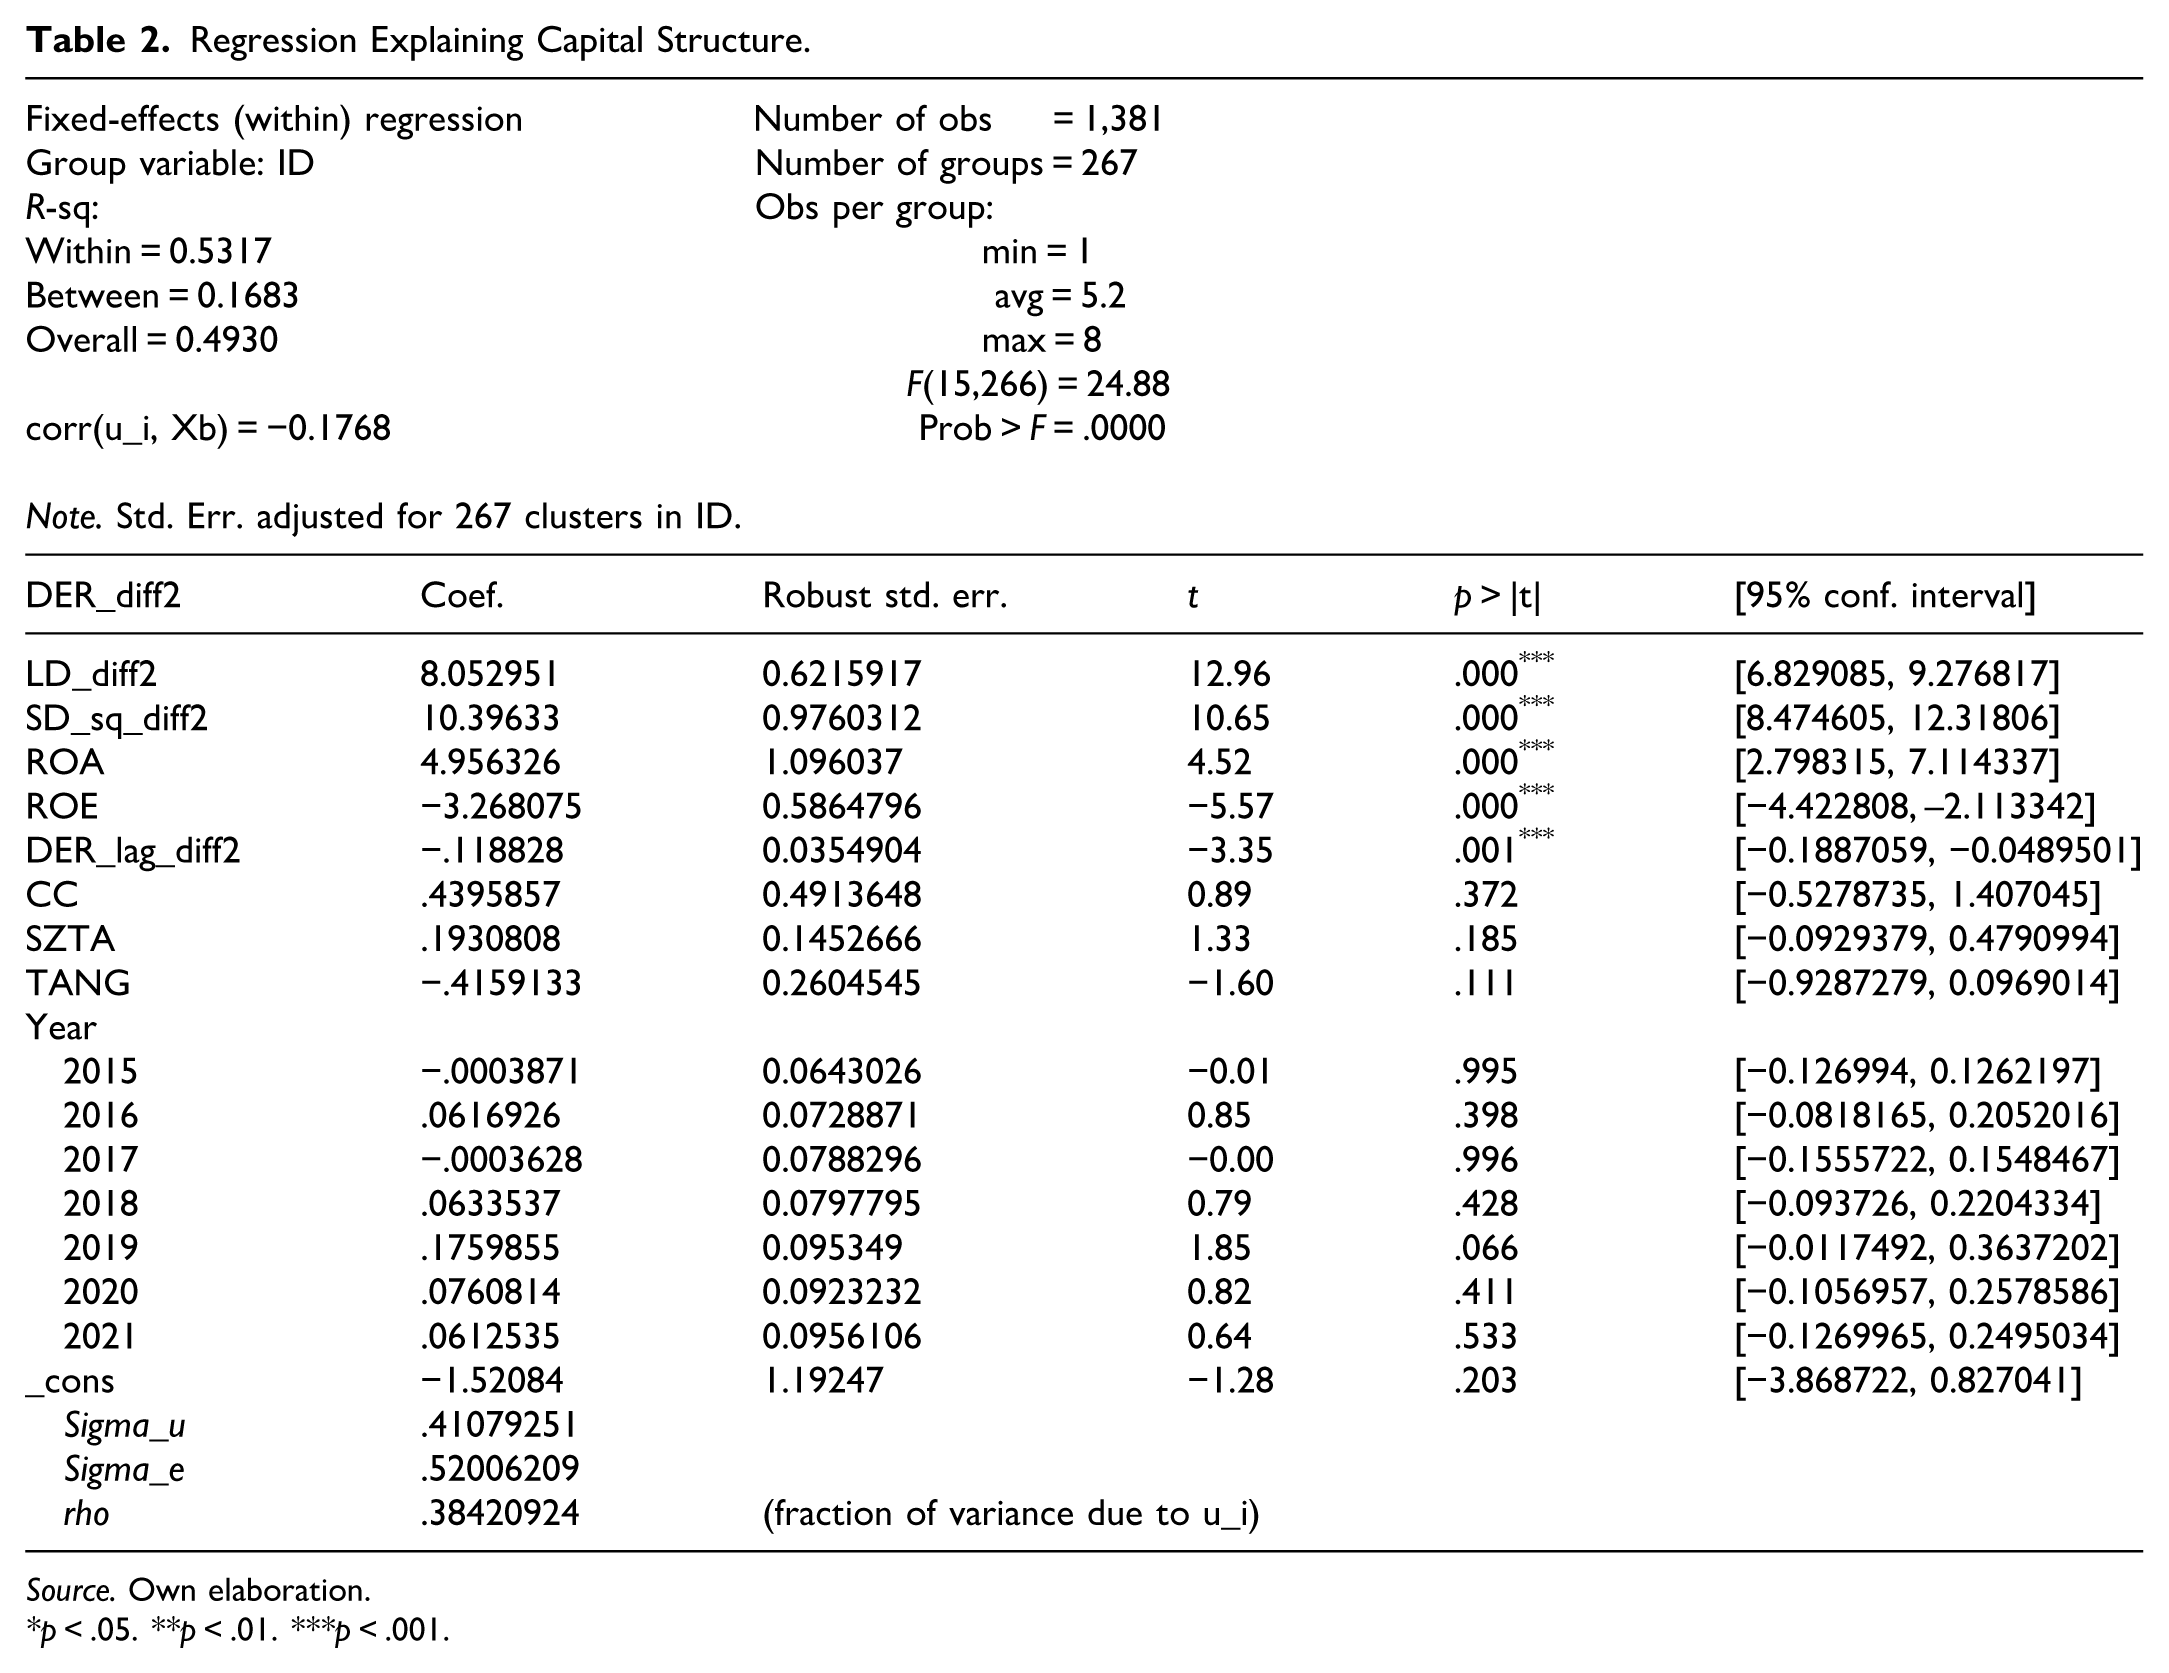
Source. Own elaboration.
p < .05. **p < .01. ***p < .001.
Regarding model fit, we have used 267 groups and 1,381 observations, generating an R-square (within) of 0.5317. Therefore, the model explains approximately 53.17% of the variability within the groups. In addition, the model is statistically significant with an F (15,266) of 24.88 and an associated p-value less than .05.
With respect to the estimated coefficients, the significant variables, ordered from highest to lowest coefficient, are:
- Short-term debt (SD_sq_diff2): A positive coefficient of 10.40 suggests a quadratic effect, indicating a non-linear relationship between short-term debt and debt-to-equity ratio. The linear relationship was tested, but it reduced the explanatory power of the model, for this reason it is claimed that there is a quadratic effect in this variable. As the ratio is positive, it shows that changes in short-term debt have an increasing effect on the debt-to-equity ratio.
- Long-term debt (LD_diff2): It has a positive ratio of 8.05 which shows that an increase in long-term debt is associated with an increase in the debt-to-equity ratio. This indicates that a unit increase in long-term debt is associated with an increase of approximately 8.05 units in the debt-to-equity ratio.
- Return on assets (ROA): With a positive coefficient of 4.96, it suggests that a higher return on assets linearly increases the debt-to-equity ratio.
- Return on equity (ROE): A negative coefficient of −3.26 indicates that a unit increase in return on equity is associated with a decrease of approximately 3.26 units in the ratio of debt to annual equity. In other words, this means that, if the ROE is positive in the year, it reduces the debt on equity and if the ROE is negative, the debt on equity will increase.
By contrast, the non-significant variables after testing linear and polynomial effects have been:
- Trade credit ratio (CC) with a significance level of .37 and a positive coefficient of .43.
- Size of total assets of the company (SZTA) with a significance level of .18 and a positive coefficient of .19.
- Tangibility (TANG) also has no significant effect, given its p-value of .11, which is above the model’s acceptance threshold of .05. On the other hand, its coefficient is negative −.41. All non-significant coefficients are close to 0.
No clear time trend; dynamics depend on covariates rather than calendar year. The correlation between unobserved effects and explanatory variables is −.1768, suggesting a slight negative relationship. Robust standard errors were used to correct for heteroskedasticity.
However, although in other models all variables turned out to be significant, due to differences in markets and sectors, non-significant variables are discarded due to their lack of explanatory power in the road transport sector for SMEs in Spain.
Based on these results, the definitive fixed-effect model, based on the significant variables, is presented below:

Concretely:

Being:
Δ: Difference between the present value and the value in the previous period.
μ: The constant term.
To justify the choice of the fixed-effect model, the Hausman test shown in Table 3 was performed. The null hypothesis (

Hausman Test.

Source. Own elaboration.
Note. b = consistent under Ho and Ha; obtained from xtreg; B = inconsistent under Ha, efficient under Ho; obtained from xtreg; Test: Ho = difference in coefficients not systematic; chi2(12) = (b–B)’[(V_b–V_B)^(–1)](b–B) = 86.20; Prob > chi2 = .0000***.
The statistic of the test
As shown in Figure 2, the modified Wald test detected groupwise heteroscedasticity (p < .0000). In this test, the null hypothesis (

Modified Wald asticity in the fixed-effect model.
The coefficients are robust, and the adjusted standard errors account for heteroscedasticity, ensuring reliable variance estimates and valid statistical inferences even with complex nonlinear relationships. In short, the model is robust to heteroskedasticity, given that robust standard errors are used.
Table 4 reports Wooldridge test results for autocorrelation in the panel model. The coefficient value for the correlation between residuals and lags is .0781. If it is away from the values 1 and −1, and close to 0, showing that there is no autocorrelation. Similarly, robust estimation methods have been used for greater accuracy in the model. Therefore, the lack of residual serial correlation in the fixed-effects specification is compatible with the significant lagged dependent variables found in the Arellano–Bond model, which capture the dynamic adjustment of leverage rather than residual autocorrelation.
Wooldridge Autocorrelation Test (obs = 1,085).

Source. Own elaboration.
To measure multicollinearity, the variance inflation factor (VIF) is used. In our case, its highest value is 3.04 and its average is 2.20. We used variables deviated from the mean and ran an OLS regression with them to calculate the VIF. As the value is less than 5 (being conservative), there are no problems of multicollinearity (Kalnins & Praitis Hill, 2025; See Table 5).
Multicollinearity Analysis.

Source. Own elaboration.
Note. VIF = variance inflation factor.
Figure 3 shows no trend; residuals are randomly distributed around 0. So, there are no patterns, which indicates that, once the quadratic term for short-term debt has been included, the functional form is adequately specified and no additional nonlinear terms are required.

Linearity test.
Figure 4 indicates an approximately normal data distribution. In addition, theoretically the Central Limit Theorem is fulfilled by being a large sample of 1,381 observations. Delgado-Álvarez (2022) states that the distribution of the sample means of a large number of independent and identically distributed random variables will be approximately normal, regardless of the underlying distribution of the population.
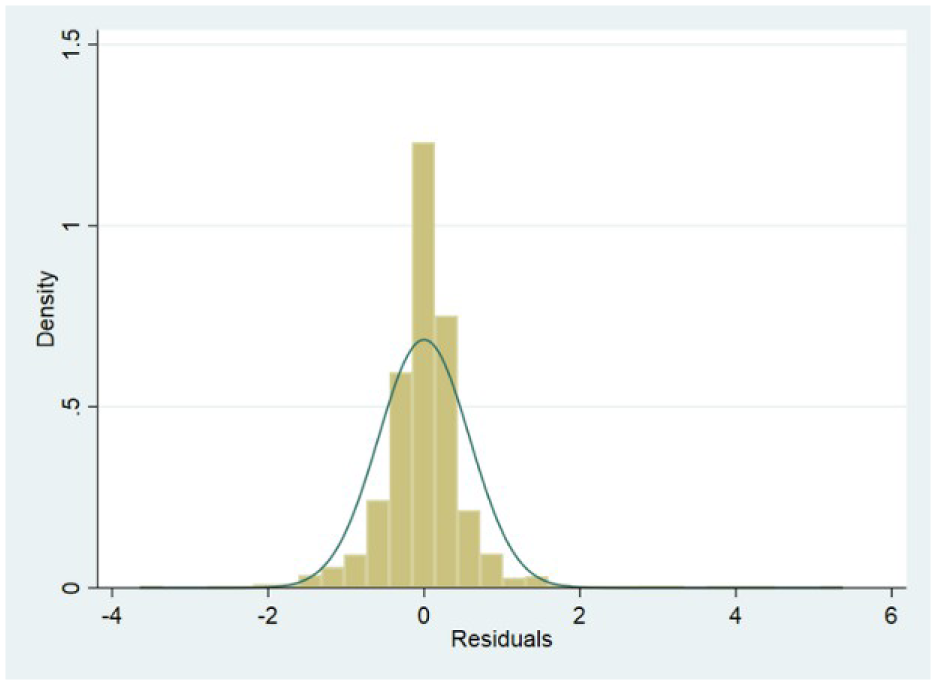
Normality graph. Histogram of residues.
Overall, all the assumptions of the model are met, using vce (robust). And, the explanatory power stands at 53.17%, placing it among the valid thresholds in scientific publications such as the case of Mazanec (2023b) in Mathematics, who also studied the capital structure in the transport sector, with an explanatory power of between 44% and 60% in his models. In this way, it is pointed out that there are no mathematical-statistical problems of overestimation or underestimation in the model.
The Arellano-Bond GMM Estimator Method
This estimator provides new insight into how the capital structure behaves over the specified period. More precisely, it employs delays (L1 and L2) in the debt-to-equity ratio to elucidate the capital structure. The model uses the generalized moments method (GMM; Arellano & Bover, 1990).
As shown in Table 6, the number of observations is 849 and the number of groups is 210, with an average of observations per group of 4.04.
Arellano-Bond Dynamic Panel-Data Estimation.

Source. Own elaboration.
Note. Instruments for differenced equation; Instruments for level equation; GMM-type = L(2/.).DER_diff2; Standard = D.LD_diff2 D.SD_sq_diff2 D.ROA D.ROE D.DER_lag_diff2; Standard = _cons.
p < .05. **p < .01. ***p < .001
The dynamic variables (L1 and L2) show a significant negative correlation, indicating a year-on-year reversal trend. In other words, this suggests that an increase in the debt-to-equity ratio 1 year may lead to a decrease the next, and vice versa. This pattern reflects firms’ efforts to balance conservative and expansionary debt management to preserve financial health.
The coefficient of −.160 for
The variables:
LD_diff2 (Long-term debt ratio variability): The positive and significant ratio of 8.1823 suggests that an increase in the long-term debt ratio is associated with an increase in DER_diff2.
SD_sq_diff2 (Variability of the Short-Term Debt Ratio Squared): The positive and significant ratio of 11.0153 indicates a positive nonlinear relationship between the short-term debt ratio squared and DER_diff2.
ROA (Return on assets): A positive and significant ratio of 5.9796 suggests that return on assets is positively related to DER_diff2.
ROE (Return on equity): The negative and significant coefficient of −3.9329 indicates a negative relationship between return on equity and DER_diff2.
Overall, the coefficients and significance of the model reflect results similar to those of the fixed-effect model, indicating stability and robustness in the findings. The constant in both models is not significant. On the other hand, the chi-square Wald test is highly significant, indicating that the model as a whole is statistically significant.
The Arellano Bond model is as follows:

Concretely:

Where:
Δ: Difference between the current value and the value from the previous period.
μ: The constant term.
Correlation Analysis Between Variables
A correlation analysis and interpretation are presented below in Tables 7 and 8.
Correlation Analysis.

Source. Own elaboration.
Interpretation of Correlation Analysis.
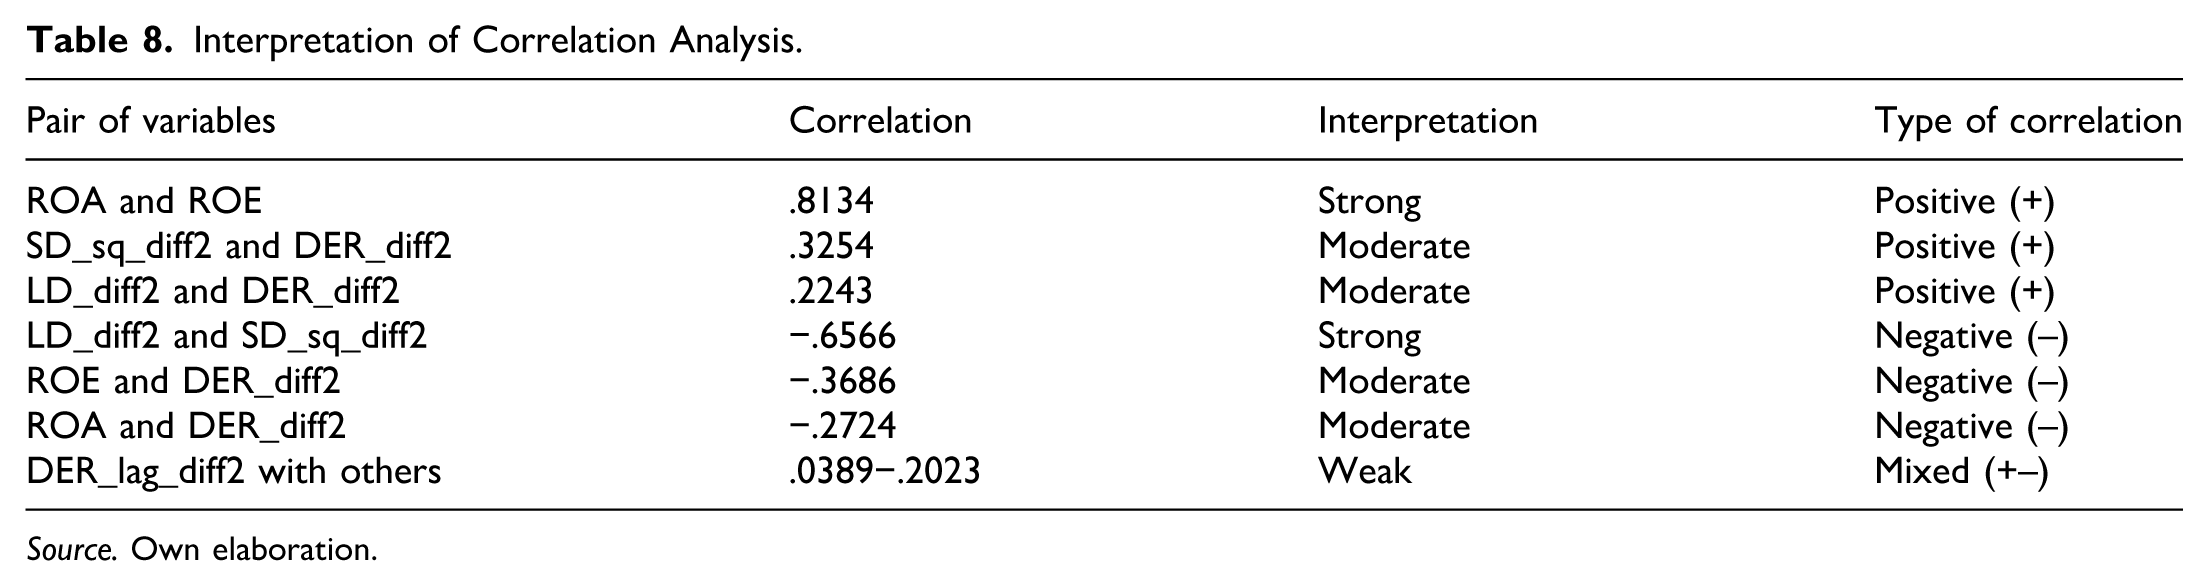
Source. Own elaboration.
It is worth noting that, although the simple correlation between ROA and ΔDER_it is negative, the regression coefficients for ROA are positive and significant once LD, SD_sq_diff2, ROE and firm fixed effects are controlled for. This suggests a conditional effect of profitability on leverage and the presence of collinearity effects, especially given the high correlation between ROA and ROE, when time series are not applied.
Descriptive Analysis of the Evolution of the Capital Structure According to the Legal Form
Beyond econometric results, the legal structure can influence capital structure variations, as the level of owner responsibility for company obligations affects risk aversion. Other factors include tax implications, lender and investor risk perception, and access to capital. For instance, during 2012 to 2013, corporations’ debt-to-equity ratios declined. In 2014, values equalized as Corporations’ ratios rose and Limited Liability Companies’ ratios fell. From 2015 to 2017, Corporations slightly outperformed Limited Liability Companies, though both decreased yearly. In 2018, Limited Liability Companies’ DER rose sharply, surpassing Corporations, which also grew. In 2019, both saw drastic reductions, followed by significant increases in 2020 and decreases again in 2021. This pattern aligns with the Arellano-Bond GMM model’s L1 and L2 variables, showing an inverse relationship where increases are followed by decreases, aiming for optimal management (See Figure 5).

Evolution of the capital structure according to legal form, between 2012 and 2021.
Figure 6 shows no need to separate the model by legal structures. In both cases, the distributions are homogeneous overall, with similar medians and ranges, as depicted in the figure. Although, they vary from year to year, as a whole there are no notable differences, except for a slight bulge in the bow of the violin at the thresholds of 3 to 5 between them. However, the length, width and shape are identical in both types.

DER by legal form in the years 2012 to 2021 average.
Comparison Between the Fixed-Effects Model and That of Arellano Bond
The following table (Table 9) compares the values of the significant coefficients, which explain the changes in the capital structure in the land transport sector in Spain of small and medium-sized enterprises.
Comparison Between the Arellano Bond Model and the Fixed Effects Model Between Significant Variables.

Source. Own elaboration.
The consistency between the two models’ results suggests that the findings aren’t solely due to the specific model’s specifications. This reinforces the robustness and stability of the relationships across estimation methods. This indicates the quality of the model and its robustness.
Relation to Theories of Capital Structure
The theories of capital structure to which the findings are linked are Trade Off Theory (TOT) and Pecking Order Theory (POT). As highlighted by Adair and Adaskou (2015), TOT posits that companies aim to balance tax benefits derived from debts and their associated costs. On the other hand, the POT indicates that companies prioritize internal financing over external financing, and that the acquisition of debt is perceived unfavorably by investors. Additionally, while the TOT suggests that companies determine their ideal capital structure based on investment opportunities and profitability, the POT argues that this structure is influenced by the availability of domestic resources and that debt is acquired only when these resources do not cover needs (See Table 10).
Variables that Affect the Capital Structure Together with the TOT and POT Theories for Small and Medium-Sized Spanish Companies in the Road Transport Sector.
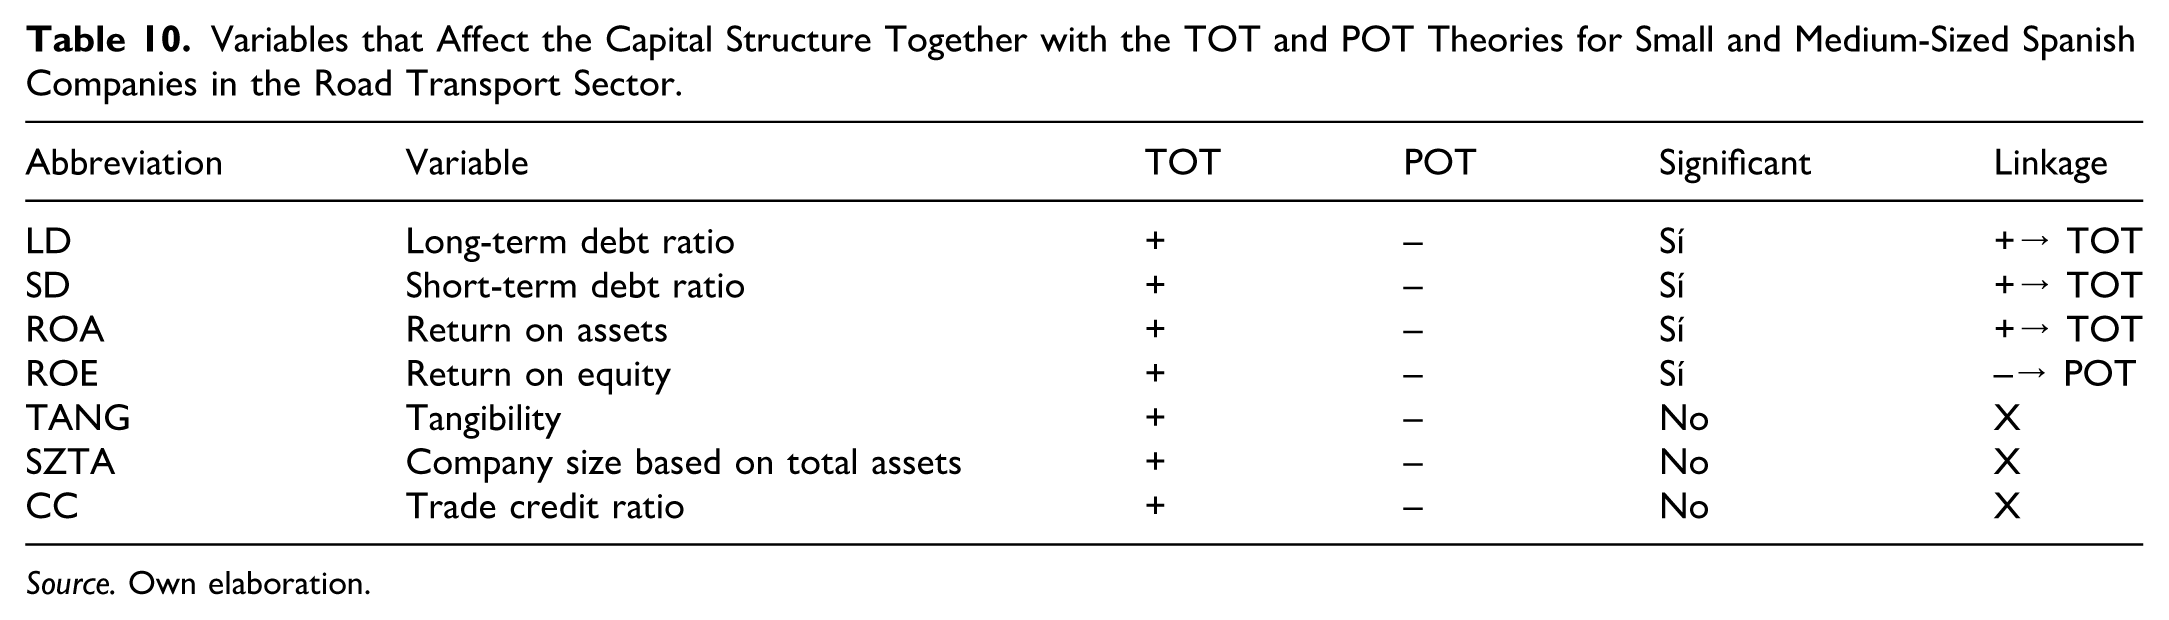
Source. Own elaboration.
Under the Trade-Off Theory, a positive coefficient (e.g., for ROA) is consistent with the idea that higher values of the independent variable are associated with higher indebtedness.
Under the Pecking-Order Theory, a negative coefficient (e.g., for ROE) is consistent with the idea that higher values of the independent variable are associated with lower indebtedness, because firms rely more on internal funds.
the signs of the coefficients for LD, the quadratic term of short-term debt (SD_sq_diff2) and ROA are more consistent with the predictions of the Trade-Off Theory. By contrast, the negative sign of ROE is compatible with the Pecking-Order Theory. Collectively, these significant variables explain 53.17% of the within-firm variation in ΔDER_it. The variables TANG, SZTA and CC, although they display positive or negative coefficients, are not statistically significant in this sector and are therefore not linked to either theory in our final specification.
As depicted in Figures 5 and 6, companies within the Spanish road transport sector, irrespective of their legal structure, aim to strike a balance between the costs and benefits of debt financing. This ties in and supports the results that they mostly relate to TOT. It is supported by the fact that the evolution is inverse in L1 and L2 of the Arellano Bond model, since companies seek to achieve the financial optimum.
Discussion and Conclusion
Discussion of Results in Light of Previous Literature
Corporate economies rest on several pillars—transport, finance, and investment—that are essential for recovery following economic slowdowns or crises (Zhou et al., 2019). When effectively managed, these pillars can improve a country’s socio-economic performance; within this framework, corporate capital structure plays a central role.
Understanding the links between capital structure and development helps managers adjust financing, foster durable growth, and manage risk (Mensah et al., 2025; Tanin et al., 2024). When making financial decisions, managers often give more weight to the internal situation of their company than to the macroeconomic landscape of the country (Bilgin, 2019). However, both managers and investors should also consider market conditions, firm type, and country-specific factors when making decisions. In the Spanish case, financial variables significantly affect leverage, but the period (crisis vs. non-crisis years) is not explanatory—possibly because the sample spans heterogeneous economic phases that dilute period effects. By contrast shows that crises decisively shaped Chinese firms’ capital structures across sectors (Hamouda et al., 2025).
Motivated by firm heterogeneity, we focus on internal variables because each company’s individuality shapes its capital structure. Kahya et al. (2020) show that firm characteristics—size and sector—primarily determine capital structure. Specifically, size affects both leverage and profitability; given our SME sample, the lack of size significance is plausible because leverage’s impact on performance is weaker in smaller firms (Danso et al., 2021). Across SMEs in Greece, France, Italy, and Portugal, similar capital-structure patterns arise from institutional and legal contexts: size relates positively to leverage and profitability, while risk relates negatively (Psillaki & Daskalakis, 2009).
For Spanish SMEs, capital structure is mainly driven by firm type (micro/small/medium), profitability, and size (log total assets; Moya-Martínez & Del Pozo-Rubio, 2021). Within this broader SME context, transport-sector SMEs behave similarly in ROA and ROE, but differ in the effect of asset size. In our setting, however, size is not significant. There is growing consensus on the need to consider both long- and short-term financing sources (Rao & Pillai, 2011). This aligns with our results: LD and SD are significant in fixed-effects models and Arellano-Bond GMM. Moreover, in Pakistani IPOs, firm size, post-sale risk, and the subscription index are significantly associated with undervaluation; in transport and investment, firm-level factors such as size remain pivotal (Javid & Malik, 2016).
Competing theories reflect the complexity of capital-structure determinants but are not mutually exclusive. Rather, they provide complementary perspectives and tools for analyzing corporate capital structure. In our data, this theoretical diversity is reflected in practice, as shown in Table 10, where both TOT and POT coexist, although TOT is more strongly associated with LD, SD, and ROA. A positive correlation between leverage and profitability indicates that firms actively rebalance their capital structures (Eckbo & Kisser, 2021), consistent with the Trade-Off Theory and our findings. Prior work documents a nonlinear debt–profitability link with a turning point where the leverage–ROE relation becomes negative (Horvathova et al., 2022); accordingly, we include quadratic terms to detect nonlinearities and turning points.
For example, in transport companies listed on the Indonesian Stock Exchange, profitability and capital structure affect enterprise value (Huda et al., 2020). Hence, the leverage–profitability link warrants systematic analysis given its implications for firm value. Likewise, Sigalas (2025) finds ROE to be significant and linked to intentions to acquire transport vehicles via financial leverage. The mechanism is straightforward: when debt yields positive returns, investors commit both own and borrowed funds to transport-sector growth. In our study, both ROA and ROE affect the capital structure in our study, which aligns with this argument. This pattern is also consistent with Sunaryo (2020), who shows that profitability and asset structure jointly affect capital structure. However, this model explains only 19.3% of the variance, leaving 80.7% to unobserved factors. This may reflect the omission of variables such as CC, SZTA, LD, SD, and TANG; by including them, our model explains over 53%.
Tangibility is not significant, whereas profitability is significantly negative (Dsouza et al., 2024). This broadly aligns with our results, except that in our case ROA has a positive impact on leverage. In another setting, the leverage ratio positively affects ROA and ROE, whereas short- and long-term debt have negative effects, with long-term debt being insignificant (Bui et al., 2023). Furthermore, for Vietnam, capital structure and performance are bidirectionally negative and strengthened by size (Xuan Nguyen et al., 2025); by contrast, in Spanish transport firms size is not significant.
These discrepancies underscore the need to account for sector- and country-specific contexts when analyzing capital structure. For example, Mazanec (2023b) includes tangibility (TANG) among the explanatory variables, which, however, is not significant in our study. The relationship between tangibility and capital structure varies depending on the sector and region (Jaworski & Czerwonka, 2021; Khaki & Akin, 2020; Logreira-Vargas et al., 2025), which explains why tangibility is not significant in our case. Trade credit may be insignificant because it largely depends on financial working capital—an indicator of short-term financial health not explicitly modeled here (Cao et al., 2021). For instance, the trade credit ratio, the inventory conversion period, the accounts payable period, and the cash conversion cycle have a significant negative impact on ROA in both the pre-pandemic and pandemic periods (Demiraj et al., 2022). However, in our case these variables affect profitability but not capital structure. Other variables, such as earnings per share and the cost of borrowing, also affect capital structure in sectors such as banking, due to the nature of their business (Shahriar & Alam, 2021).
The financing of a company through debt carries a greater risk than financing through equity (Youlianto, 2021). In this regard, LD and SD provide levers to stabilize finances by adjusting debt maturity and levels to firm conditions.
For air transport, long-term debt aligns with TOT, whereas short-term debt aligns with POT (Kiraci & Asker, 2020). In Swedish road transport, financing decisions follow POT (Parviziomran et al., 2024), whereas in our data both LD and SD behave in line with TOT. Taken together, debt reversals may arise from active managerial adjustment or mechanically via external macroeconomic forces (Carvalho et al., 2023).
Spain aligns with Austria, Belgium, Finland, France, Germany, Italy, Portugal, Sweden, and the UK, where SME credit risk moderates the capital-structure–performance link (K. Li et al., 2019); in our case, this link remains significant even without an explicit risk measure. Against this backdrop, to our knowledge, no prior study analyzes the capital structure of Spain’s road transport sector, despite its macroeconomic relevance.
Innovative Contribution and Scientific Gap
The study of capital structure is one of the most relevant topics in finance, since despite the various existing theories, there is still no consensus on its determining factors or on the behavior of firms’ financing decisions (Pinillos et al., 2025). In this context, analyzing the capital structure in the Spanish transport sector is particularly relevant due to the sector’s economic importance and the limited prior research focused on this area. However, a clear gap remains: sector-specific, firm-level evidence on the capital structure of Spanish road-transport SMEs is scarce. Most Spanish studies either focus on tourism and energy or rely on multisector samples. Furthermore, few examine the dynamic adjustment of leverage using dynamic panel estimators, and to the best of our knowledge none tests a potential non-linear effect of short-term debt on the debt-to-equity ratio in this sector or systematically maps the signs of the estimated coefficients to Trade-Off and Pecking-Order theories.
Likewise, studies on the capital structure of SMEs in European countries are not as common as in other regions (Czerwonka & Jaworski, 2021). Because regulatory factors and market characteristics make countries differ from one another, which makes it necessary to conduct analyses on a sectoral and regional basis. Using restricted and unrestricted regressions, Priyan et al. (2023) demonstrate differences between countries and types of firms. For this reason, it is justified to analyze the capital structure in the Spanish transport sector, as it has not been previously examined.
The most studied sectors in terms of capital structure in Spain have been the tourism and energy industries (Bistuer-Talavera et al., 2024; Camisón-Zornoza et al., 2020; Moya-Martínez & Del Pozo-Rubio, 2021). By contrast, analyzing the transport sector is particularly relevant due to its strategic role in the economy. From a historical perspective, in the Spanish case, excessive debt dependence increases vulnerability during recessions and crises (Betrán & Pons, 2022; Fernández de Guevara et al., 2021; Martínez & Gil, 2024; Pelaez-Verdet & Loscertales-Sanchez, 2021). As a result, understanding how capital structure operates in SMEs is crucial to prevent business risk overexposure during financial crises, particularly in a sector as cross-cutting for the entire economy as transport.
In our model, the main selected variables are also justified, since previous studies in the Spanish context have shown that firm size, profitability, and asset tangibility are key determinants of leverage, especially among SMEs (Camisón-Zornoza et al., 2020; Serrasqueiro et al., 2022). Moreover, there are other factors that influence profitability beyond capital structure, such as fleet management and its efficiency (Grzelak et al., 2024). The influence of additional factors like this may explain why the explanatory power (R2 ≈ .53) is not excessively high, which is actually positive because it helps to prevent overfitting. Consistent with previous literature on capital structure in the transport sector, published in high-impact Q1 journals such as Mathematics, where Mazanec (2023b) reports explanatory levels between 40% and 60%, our results fall within the range considered robust in comparable research, supporting the model’s validity and statistical soundness. This is because optimal explanatory power is achieved when the model captures most of the relevant variance without overfitting the econometric model (C. Li & Müller, 2021).
This paper fills that gap by:
Assembling a 2012–2021 panel of Spanish road-transport SMEs.
Jointly estimating a fixed-effects model with robust standard errors—supported by the Hausman test—and an Arellano Bond GMM model to capture leverage dynamics.
Documenting a positive quadratic effect of short-term debt (SD2) on the debt-to-equity ratio, meaning that increases in short-term debt have a disproportionately larger impact on leverage at higher levels. By contrast, long-term debt (LD) enters linearly in the model, so its marginal effect on leverage is approximately constant. This asymmetry highlights that non-linear leverage adjustments are driven mainly by short-term debt, suggesting that excessive reliance on short-term funding is particularly sensitive for firms’ capital-structure decisions.
Uncovering year-over-year mean reversion in leverage, reflected in the negative coefficients on the first and second lag of the change in the debt-to-equity ratio (L1 and L2). This means that increases (decreases) in leverage in 1 year tend to be partially offset by decreases (increases) in subsequent years, which is consistent with a partial adjustment process toward a target capital structure rather than a random walk in leverage. Showing that coefficient magnitudes and signs are stable across estimators.
Showing that the signs of LD, SD2 and ROA are consistent with the predictions of Trade-Off Theory, while the sign of ROE is consistent with the Pecking-Order Theory.
Showing that legal form does not materially alter DER distributions, so separate models are unnecessary.
The fixed-effects model also shows that tangibility (TANG), firm size (SZTA), and trade credit (CC) are not significant determinants of capital structure. Therefore, they are excluded from the final econometric model and are not linked to TOT/POT in this sector.
Overall, these contributions yield actionable insights for managers and policymakers in a strategically important yet under-researched sector.
Concluding Implications
The results have several actionable implications for Spanish road-transport SMEs:
First, the convex (quadratic) effect of short-term debt (SD2) on DER implies that increases in short-term borrowing have disproportionately larger impacts on leverage at higher levels; firms should manage the maturity mix and avoid excessive reliance on short-term funding when leverage is already elevated.
Second, the opposite signs of ROA (+) and ROE (–) indicate two financing paths: profitable asset use can support prudent leveraging for growth, while strong equity returns are consistent with self-financing and deleveraging; capital-structure policies should be contingent on the firm’s profitability profile.
Third, the negative and significant L1 and L2 in the dynamic model suggest mean reversion toward a target leverage; formalizing a target-adjustment rule can help avoid excess debt accumulation.
Fourth, the non-significance of TANG, SZTA and CC once firm effects are controlled for means these variables are less informative as standalone screens for leverage decisions in this sector; emphasis should be placed on profitability-based metrics and the composition of debt (short vs. long term).
Finally, the absence of material differences by legal form supports sector-level guidance (rather than legal-form segmentation) when designing managerial playbooks and lender checklists for transport SMEs.
Conclusion
This research employs two models to explain capital-structure variability using economic and financial variables identified in prior studies. The sample consisted of companies active from 2012 to 2021, in the road transport sector in Spain. The sample includes 398 SMEs (operating income €2–50M).
Analyzing its dynamics through econometric models provides insight into capital-structure fluctuations and determinants. In our model, the debt-to-equity ratio (DER) represents the dependent variable for capital structure. In addition, linear and quadratic effects are included, following the approach adopted in previous transport studies published in high-impact journals. In addition, both the Arellano–Bond model and the fixed-effects regression model identify the same significant variables, which provides greater robustness to the results.
Specifically, significant economic and financial variables, as identified by a fixed-effects panel model and subsequently verified by an Arellano Bond GMM model, include: return on assets (ROA) with coefficients of +4.956 and +5.980 (+); return on equity (ROE) with coefficients of −3.268 and −3.933 (–); the long-term debt (LD) ratio with coefficients of +8.052 and +8.182 (+); and the short-term debt (SD) ratio with +10.396 and +11.015 (+). All of them with similar values, which provides greater robustness and coherence to the findings. High ROA promotes borrowing for growth, whereas high ROE reduces debt needs via self-financing.
Overall, although an
By contrast, some variables, such as the trade credit ratio (CC), the size of assets (SZTA) and tangibility (TANG), were not significant and therefore do not affect the fluctuations in the capital structure of these companies.
As an innovative factor in capital structure research, we analyze how fluctuations in SD and LD, combined with ROA and ROE values, influence current and prospective changes in the capital structure, with the Arellano Bond model helping to explain these oscillations. In particular, this model shows a significant tendency toward reversal in the DER. If it increases (or decreases) in 1 year, it will likely do the opposite in the subsequent years, always seeking an optimum balance. According to the fixed-effect model, an increase in return on assets leads to an increase in the debt-to-equity ratio. Conversely, a negative return on equity is associated with an increase in debt. This may be due to a reduction in capital for undesired results and also the unwillingness of investors to add capital in unwanted scenarios, prompting companies to seek external financing.
As for the significant variables, most, such as ROA, LD and SD, align with the Trade-Off Theory. Whereas ROE aligns with the Pecking Order Theory. This is consistent with the idea that companies in Spain’s road transport sector seek a balance between the costs and benefits of debt financing, as proposed by the Trade-Off Theory. Variables such as ROA, LD and SD reflect the search for that optimal balance between indebtedness and equity, regardless of company type.
Furthermore, the European Sovereign Debt Crisis and the COVID-19 offer a context to assess firm behavior under stress. Our analysis indicates no significant difference in capital-structure behavior during crisis years versus other periods. The key variables remained significant, and the coefficients for the crisis years were not significantly different from those for other years, indicating that the explanatory power lies mainly in the financial variables.
The implications are vital for companies in the transport sector in Spain, suggesting the need to maintain a financial balance while considering factors such as profitability and debt to optimize their capital structure. Simultaneously, this research fills a scientific void, as no prior studies have specifically tackled the capital structure in Spain’s transport sector. Comparisons with other transport modes and regions show that context shapes the relevance of financial variables. Hence the importance of measurement in this specific case, which is relevant for both the Spanish and European economies, since Spanish transport companies hold significant weight in the broader European economy, but these findings are not transferable to other sectors, countries, or company sizes.
Regarding the limitations, this research has focused on explaining the capital structure, using certain variables supported by prior literature. However, other variables could have been included, such as corporate governance standards, tax policies, dynamics between borrowers and lenders, interactions with capital markets, and levels of investor protection in the country where the company operates, as used in Alasfour and Dahmash (2019) study. Other potential variables exist, but we prioritized those most cited in transport-sector studies.
Future research could benefit from analyzing the capital structure of larger road transport companies with operating incomes exceeding €50 million, as well as investigating other transport sectors, such as maritime or air transport, to understand their capital structures. Additionally, understanding how the adaptation of vehicles to sustainable practices might influence indebtedness levels and affect debt and investment leverage.
These findings have important implications for transport companies in Spain, suggesting the need to maintain financial balance while considering factors such as profitability and debt to optimize capital structure. At the same time, this research fills a scientific gap, as no prior studies have specifically examined capital structure in Spain’s road-transport sector. Comparisons with other transport modes and regions show that context shapes the relevance of financial variables: markets such as Indonesian transport or air transport display different sensitivities, so findings are not directly transferable across sectors, countries, or firm sizes. Consequently, measuring capital structure in this specific context is particularly relevant for both the Spanish and broader European economies, given the weight of Spanish transport companies.
Footnotes
List of Abbreviations
ANE: average net worth.
AP: accounts payable.
CC: trade credit ratio.
DER: debt-to-equity ratio.
EBIT: earnings before interest and taxes.
LD: long-term debt ratio.
LTL: long-term liabilities.
NP: net profit.
POT: pecking order theory
ROA: return on assets.
ROE: return on equity.
SD: short-term debt ratio.
STL: short-term liabilities.
SZTA: company size based on total assets.
TA: total assets.
TOT: trade off theory
Ethical Considerations
The sample used in this study consists of economic and financial data. The data collection was carried out lawfully, fully complying with the applicable data protection regulations, including the General Data Protection Regulation (GDPR) and other relevant legal provisions. Confidentiality, security, and the ethical use of all collected information were strictly ensured.
Consent to Participate
No identifiable personal data were used; therefore, individual informed consent was not required.
Consent for Publication
The authors give consent to publish the article if it is selected.
Author Contributions
Conceptualization, Á.B.F. and J.D.B.J.; methodology, Á.B.F.; software, Á.B.F.; validation, J.D.B.J., J.D.P.V. and Á.B.F.; formal analysis, Á.B.F.; investigation, Á.B.F.; re-sources, Á.B.F.; data curation, Á.B.F.; writing—original draft preparation, Á.B.F.; writing—review and editing, J.D.B.J.; visualization, Á.B.F.; supervision, J.D.B.J.; project administration, J.D.P.V.; funding acquisition, J.D.P.V.
Funding
The authors disclosed receipt of the following financial support for the research, authorship, and/or publication of this article: University of Almeria.
Declaration of Conflicting Interests
The authors declared no potential conflicts of interest with respect to the research, authorship, and/or publication of this article.
Data Availability Statement
Data will be available upon request.