
Abstract
This study addresses the problem of whether China’s Low-Carbon City Pilot Policy (LCCP) unintentionally induces corporate green innovation bubbles. The aim is to investigate the policy’s effect on firms’ green innovation behavior and uncover the mechanisms behind potential bubble formation. Using panel data of Chinese A-share listed companies from 2000 to 2022 and applying a staggered DID model, the study examines how the LCCP influences the divergence between the quantity and quality of green innovation. The empirical results show that the LCCP significantly increases green innovation bubbles, as firms tend to prioritize the number of green patent applications over substantive technological breakthroughs. Mechanism analyses indicate that intensified market competition and strengthened herd behavior are key channels through which the policy amplifies bubble effects. Additional heterogeneity tests reveal that the bubble effect is more pronounced in firms with higher ownership concentration, lower environmental subsidies, and those operating in non-high-pollution industries. This study concludes that while low-carbon policies promote green transition, they may also lead to unintended distortions in corporate innovation strategies. Future research may explore policy designs that better balance innovation quality and quantity, as well as assess long-term economic and environmental consequences of green innovation bubbles.
Introduction
The report of the 20th National Congress of the Communist Party of China clearly states that “achieving carbon peak and carbon neutrality represents a profound systemic transformation in the economy and society.” China has undergone rapid economic growth through industrialization, but this has come at the cost of intensified environmental pollution and resource depletion, with carbon emissions contributing to increasingly severe climate change issues (Gao et al., 2025; Y. J. Zhang et al., 2017). To promote high-quality economic development and achieve sustainable growth, China is in urgent need of speeding up the transition to a new economic development model, reinforcing environmental governance, and promoting green progress (X. Liu et al., 2022; K. Liu et al., 2025). As a key environmental governance initiative implemented at the national level (X. Li et al., 2025; H. Zhang et al., 2022), the LCCP aims to guide local governments and enterprises in exploring and practicing green transition strategies and fostering a symbiotic relationship between humanity and the natural world (G. Yuan et al., 2025).
As an all-encompassing environmental governance approach, the LCCP primarily facilitates the transition of local economic and social systems toward a green model through a government-led and market-driven approach (Zeng et al., 2023). In August 2010, the National Development and Reform Commission (NDRC) released the Notice on Launching LCCP, formally commencing the first round of pilot projects. In November 2012, the second round of pilot programs expanded to incorporate Hainan Province and 28 more cities. In January 2017, the third round of pilot policies was rolled out, further extending the low-carbon development pilot program to an additional 45 cities (Yu & Zhang, 2021). Each pilot region tailored its low-carbon development model based on its resource endowments and economic development level, accumulating valuable experience for nationwide low-carbon transformation. The core objective of this policy is to strengthen environmental regulations, prompting enterprises and local governments to accelerate their green transition and promoting the balanced progress of economic expansion and environmental conservation.
The LCCP is an urban-level environmental governance measure in China. Drawing on the Porter Hypothesis, environmental regulations can encourage companies to boost their investment in research, using innovation to offset the additional costs imposed by policies while improving resource efficiency and reducing pollution emissions (Stoever & Weche, 2018). Specifically, in low-carbon city pilot regions, firms must adapt to stricter carbon emission standards and environmental policies, which often leads them to intensify their R&D (Pan et al., 2022; G. Yang, 2023) to improve market competitiveness and enhance long-term growth capability. Firms may reduce carbon emission costs by adopting clean technologies, optimizing production processes, and developing low-carbon products. However, when firms focus excessively on the quantity of green innovation while overlooking its quality, a green innovation bubble may emerge (Geng et al., 2024). A green innovation bubble refers to the divergence between the growth in the number of green patents and the actual technological quality of green innovations (Lyon & Maxwell, 2011). Under policy incentives, firms might emphasize immediate benefits by filing a multitude of green patent applications or initiating environmental projects to secure government support or market recognition, rather than focusing on substantive breakthroughs in high-quality green technologies. Since government assessments of green innovation outcomes often rely on quantifiable indicators such as patent counts and project numbers, firms may engage in “tactical innovation” by blindly following industry trends and imitating others despite insufficient technological accumulation, further inflating the green innovation bubble (Geng et al., 2024).
The rapid expansion of green innovation activities under China’s Low-Carbon City Pilot Policy (LCCP) has raised concerns that policy incentives may unintentionally distort firms’ innovation strategies. In particular, although the policy aims to promote substantive technological progress, many firms appear to emphasize the quantity of green patents over their technological quality, suggesting a potential mismatch between innovation output and real technological advancement. This situation leads to an important scientific problem: Does the LCCP inadvertently contribute to the formation of green innovation bubbles, and through what mechanisms does this occur? Addressing this question is essential for understanding the unintended consequences of low-carbon policies on corporate innovation behavior. To this end, this study examines whether the LCCP exacerbates green innovation bubbles and investigates the underlying channels through which the policy affects firms’ innovation decisions.
The findings reveal that the LCCP contributes to the accumulation of green innovation bubbles, as firms tend to focus on increasing the quantity rather than enhancing the quality of green innovations under policy incentives. Further analysis of the underlying mechanisms reveals that the policy amplifies green innovation bubbles by intensifying market competition and reinforcing the herding effect in corporate innovation. Additionally, heterogeneity analysis reveals significant variations in the policy’s impact across different types of firms. Specifically, the policy has a stronger bubbles for firms with higher ownership concentration, firms receiving fewer government environmental subsidies, and firms in non-heavy-polluting industries. These analyses aim to provide a more comprehensive understanding of the policy’s influence and offer evidence to support the refinement of low-carbon policy design.
The contributions of this study are threefold. First, while existing research primarily focuses on the positive impact of the Low-Carbon City Pilot (LCCP) policy on corporate green innovation (Liu et al., 2023), this paper is the first to systematically examine its influence on green innovation bubbles, thereby filling an important gap in the literature. Second, through the analysis of market competition and herding mechanisms, this study uncovers how the LCCP policy generates green innovation bubbles at the firm level, enriching the theoretical understanding of the relationship between environmental policies and corporate behavior. Finally, the heterogeneity analysis provides targeted implications for policy refinement, helping enhance the precision and effectiveness of policy design. The findings can guide corporate managers in adjusting their R&D structures; enable policymakers to implement differentiated incentives and regulatory measures based on firm characteristics; and help society and the public recognize that increases in green innovation quantity may contain “inflated” elements, thereby encouraging a greater emphasis on innovation quality and supporting the long-term realization of green development goals.
This paper is organized as follows: Section 2 provides a literature review, systematically synthesizing prior studies and developing hypotheses based on existing research. Section 3 delves into data and model construction, outlining data sources, variable definitions, and the design of the econometric model. Section 4 presents the regression analysis results. Section 5 investigates the underlying mechanisms by analyzing how the LCCP affects green innovation bubbles in firms. Section 6 carries out heterogeneity analysis to explore differences in policy impacts across firms with varying characteristics and industry contexts. The final section summarizes the key findings.
Literature Review and Research Hypotheses
Literature Review
The drivers of green innovation are multifaceted, encompassing both macro-level policy guidance and external environmental factors, as well as micro-level corporate internal governance and strategic decision-making. At the macro level, green credit policies, as an important financial support tool, can effectively direct corporate funds toward green industries (H. Wang et al., 2022). The uncertainty of climate policies increases the difficulty for enterprises to anticipate future environmental policies, prompting them to take early steps in green innovation to cope with potential policy risks (Sun et al., 2024). Meanwhile, the digital finance has provided enterprises with more convenient financing channels and information acquisition platforms, which helps companies integrate resources (X. Li et al., 2022). At the micro level, existing research has found that digital transformation can effectively enhance corporate green innovation capabilities (Tang et al., 2023). Effective investor communication helps to enhance corporate green innovation output (J. Wang, 2023). Through active interaction with investors, companies can better convey their green innovation strategies and achievements to the market, attract more green investments. Moreover, extending the CEO’s tenure can increase corporate long-term investment in green innovation (L. Liu et al., 2024).
Existing studies primarily focus on the determinants of corporate green innovation, while research on the drivers of green innovation bubbles remains limited. The available literature has examined how factors such as strategic ESG disclosure (M. Li & Gan, 2025), competitive culture (G. Yang & Liu, 2025), supply chain risk perception (J. Zhou & Xie, 2025), and the application of artificial intelligence (K. Zhao & Liu, 2025) influence the formation of green innovation bubbles.
The research on the LCCP mainly focuses on the evaluation of its policy effects. Existing literature centers on both the macro urban level and the micro corporate level, revealing the extensive impacts of this policy at different levels. At the macro urban level, the policy has improved the green quality of life for residents (J. Zhang & Zheng, 2023). Through measures such as promoting green transportation, optimizing urban energy structures, and increasing urban green space, residents in pilot cities have enjoyed a cleaner, more comfortable, and more livable environment. At the same time, the LCCP has reduced individual carbon emissions (X. Li & Xing, 2024; X. Liu & Xu, 2022). By promoting low-carbon lifestyles among residents, such as reducing private car use and promoting energy-saving household appliances, carbon emissions in the residential life sector have been controlled. The policy has reduced the overall carbon emissions, driving urban low-carbon transformation (Huo et al., 2022). The policy has driven the upgrading of urban industrial structures (J. Zheng et al., 2021). Meanwhile, the policy has also alleviated the problem of energy poverty (Song et al., 2024). By optimizing energy distribution and promoting clean energy, the difficulties of low-income groups in pilot cities in accessing and using energy have been mitigated, improving their quality of life. The LCCP has also promoted overall technological innovation in cities (C. Zou et al., 2022).
At the micro corporate level, the LCCP has also had a profound impact. Studies indicate that the policy can boost the total factor productivity of local firms (H. Chen et al., 2021). At the same time, the LCCP has also reduced corporate pollution emissions (S. Yang et al., 2023). By strictly enforcing environmental standards and promoting clean production technologies, enterprises have effectively controlled their pollutant emissions, reducing their environmental risks. In addition, the policy has increased the labor demand of enterprises in pilot areas (C. A. Wang et al., 2023). With the swift progress of low-carbon industries, enterprises’ demand for high-quality labor has been growing, providing more job opportunities for local residents and promoting the stability of the job market. The LCCP has also accelerated the digital transformation of enterprises (C. Zhu & Lee, 2022). Meanwhile, the policy has also improved corporate ESG practices (Wan et al., 2024). Under policy guidance, enterprises have paid more attention to fulfilling their environmental and social responsibilities, enhancing their social image and brand value, and promoting sustainable corporate development.
While extensive research has explored the role of LCCP in green development and corporate innovation, no existing literature examines its impact on corporate green innovation bubbles. Given that green innovation bubbles may affect resource allocation efficiency and weaken firms’ sustainable development capabilities, investigating whether LCCP triggers or mitigates green innovation bubbles holds both theoretical significance and practical policy implications. Thus, this research seeks to address this gap in the literature and provide a new perspective for understanding the economic consequences of LCCP.
Research Hypotheses
The LCCP, while promoting urban green transformation, may give rise to the phenomenon of “bubble-like” green innovation among companies by intensifying market competition. Specifically, local governments in pilot regions encourage firms to undertake green innovation by providing policy incentives such as innovation subsidies, tax reductions, and financing support (H. Li et al., 2018), thereby motivating enterprises to actively engage in green innovation activities (S. Li et al., 2024). These measures effectively enhance firms’ willingness to invest in green innovation and stimulate their technological innovation efforts. However, as policy incentives intensify, competitive pressure within industries also increases (Jiang et al., 2024). Abu Afifa et al. (2025) emphasize that internal governance mechanisms and strategic intentions play a crucial role in determining the quality of environmental disclosure. When firms face policy or competitive pressure, they are more likely to adopt symbolic disclosure strategies—exaggerating innovation quantity while downplaying innovation quality—to enhance external legitimacy (Nguyen et al., 2025). Applying this perspective to green innovation reveals that firms’ extensive filing of low-quality green patents essentially constitutes a form of “misleading innovation disclosure.” Such practices fail to reflect firms’ true technological capabilities and instead accelerate the formation of green innovation bubbles. Moreover, to effectively signal innovation capability and enhance corporate reputation, firms may file a large number of green patents in the short term to showcase their perceived leadership in green technologies. During this process, firms leverage market reputation, trust networks, and relationships with government authorities to obtain additional informal support, further intensifying the spread of “bubble-like” phenomena. This strategic innovation behavior typically emphasizes the expansion of patent quantity while neglecting breakthroughs in technology and improvements in innovation quality, thereby weakening the long-term effectiveness of the green innovation system. If firms excessively rely on short-term policy incentives and overlook core technological innovation and improvements in green technology quality, this may result in resource misallocation, diminishing innovation returns, and even undermine the sustainability of urban green and low-carbon transition.
The LCCP, while driving green transformation, may induce a strong “herd effect” at the market level, thereby exacerbating the formation of a corporate green innovation bubble. Motivated by policy incentives, firms often adopt a “follow-the-crowd” strategy to secure government subsidies, tax benefits, or financing advantages, rather than formulating long-term green innovation strategies based on their technological capabilities and market demand. From a cost perspective, green innovation is typically a high-investment, long-cycle strategic decision associated with significant uncertainty (J. Zhao et al., 2023). Corporate executives must allocate substantial resources to identify green innovation projects with genuine market value and technological potential. However, the processes of information collection and technological assessment are complex and costly, leading managers to adopt an “information substitution” strategy—relying on the green innovation decisions of peer firms as a reference for their own actions (Tan et al., 2022). In this context, imitating the innovation behavior of industry pioneers not only becomes the optimal choice for reducing cognitive costs and decision-making risks but also reinforces the herd effect (Wen et al., 2022; D. Yuan et al., 2022). Since low-carbon policies impose similar incentive constraints on all firms within an industry, companies operating under comparable market conditions and resource constraints are more inclined to follow their peers’ green innovation paths to avoid competitive disadvantages in policy-driven competition. From a competitive perspective, firms under low-carbon policies place greater emphasis on their relative competitive position rather than their absolute innovation capability (Roberts, 1998; Weerawardena & Mavondo, 2011). When peer firms significantly increase green innovation efforts, even those aware of potential bubble risks find it difficult to remain passive. In an environment where a widespread green innovation wave takes hold, firms that fail to follow suit may suffer from reputational damage, loss of market share, or even rising financing costs. Consequently, to maintain competitiveness (Abu Afifa et al., 2024), firms are compelled to actively respond to industry trends, even if this means adopting short-term, low-quality green innovation strategies. The spread of such passive innovation behavior results in the formation of a collective green innovation bubble across the market. Moreover, the green innovation bubble driven by policy incentives is not only reflected in the short-term and homogenized nature of corporate innovation behavior but may also lead to misallocation of innovation resources and a decline in market efficiency. In pursuit of policy support, firms may prioritize green patents with short approval cycles and high success rates over genuine breakthroughs in core technologies that ensure long-term competitiveness (Y. Zou & Park, 2025). If government assessments of green innovation focus primarily on quantitative indicators, such as the number of green patents or total investment in green technology, rather than innovation quality and environmental performance, companies are more inclined to participate in strategic innovation activities to meet policy evaluation criteria, further amplifying the formation of a green innovation bubble. Thus, we formulate Hypothesis 1:
Data and Model
Data
This research employs panel data from A-share listed companies in China’s Shanghai and Shenzhen stock exchanges over the period from 2000 to 2022 as the sample. To guarantee data quality and the robustness of the findings, the initial sample is subjected to the following screening and processing procedures: (a) Given the unique financial structures and accounting treatments in the financial industry, financial sector firms are excluded; (b) Companies designated as special treatment are removed to avoid the influence of financially abnormal firms or those facing delisting risks; (c) Samples with severe missing data in key financial indicators are excluded to ensure data completeness; (d) Continuous variables are subjected to winsorization at the 1% level, meaning that the most extreme 1% high values and 1% low values are directly removed. Following the application of these screening criteria, the final sample includes 40,241 observations. The data processing procedure Is presented in Table A1.
The key explanatory variable in this study is the LCCP (did), which is created as an interaction between the treatment group indicator (Treat) and the policy timing indicator (Post). Specifically, the treatment group assignment (Treat) is determined based on the Implementation Plan for the LCCP released by the NDRC, which identifies three batches of pilot cities (H. Chen et al., 2021; L. Wang & Zhan, 2025). If a firm’s registered location is within the administrative area of a pilot city, Treat is set to 1; otherwise, it is 0. The policy timing variable (Post) indicates whether the observation period is after the policy implementation—if so, Post is set to 1; otherwise, it is 0. Consequently, the did variable, defined as Treat × Post, captures the effect of the LCCP on corporate behavior.
The dependent variable is “corporate green innovation bubbles.” The baseline indicator, CGI_bub, follows the approach of Geng et al. (2024) and standardizes the gap between the number of green patent applications and the number of green patents granted, including both green invention patents and green utility model patents. The granting of a green patent typically indicates that the technology has passed the more rigorous quality and substantive examination of the China National Intellectual Property Administration (SIPO). Therefore, when the number of applications significantly exceeds the number of granted patents, this application–grant gap provides a direct reflection that part of the innovation input has not translated into recognized, quality-assured technological outcomes. In other words, a larger gap indicates a more pronounced structural imbalance in which “quantity expands while quality lags,” thereby signaling a greater degree of green innovation bubbles.
It is important to note that under China’s patent system, different types of green patents are subject to markedly different examination standards. Green utility model patents involve lower application costs, shorter examination cycles, and higher grant rates, making it easier for firms to accumulate a large volume of “quantity-oriented” outcomes in the short term. In contrast, green invention patents must undergo a strict technical examination, with higher technological thresholds and greater difficulty in obtaining approval. Consequently, if firms engage in strategic behavior to inflate the quantity of green patents, such behavior is more likely to manifest first in utility model patents.
To examine whether our findings are driven solely by low-quality green patents, we construct an alternative indicator, CGI_bub1, which includes only green invention patents—patents with higher technological content and more rigorous examination procedures—and calculates the standardized application–grant gap in the same manner. This indicator focuses on whether bubbles also exist in high-quality green innovation. If the results remain robust when using CGI_bub1, it suggests that the inflated quantity of green innovation is not confined to low-threshold utility models but extends to invention patents with higher technical content. All patent data are obtained from the China National Intellectual Property Administration (SIPO).
In line with the analytical framework of multiple factors influencing corporate green innovation behavior, this study selects control variables from three aspects: financial structure, corporate governance, and business dynamics. Specifically, the control variables include: operating cash flow to total assets ratio (Cash), leverage ratio (Lev), firm size (Size), Tobin’s Q (TQ), proportion of independent directors (Indboard), return on assets (Roa), sales revenue growth rate (SaleGrowth), and board size (Board).
Model
Given that the LCCP policy was implemented in three separate batches, this study follows J. Zhang and Zheng (2023) and employs a multi-period difference-in-differences model for the analysis.
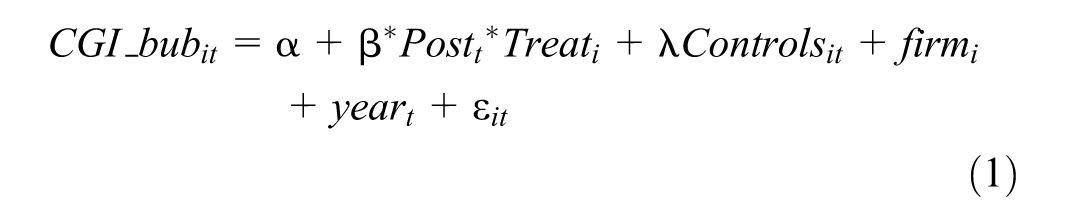
Where CGI_bub it represents the green innovation bubble of listed company i in year t, Post t × Treat i is the core explanatory variable, denoted as the multiple-period DID variable (did), which indicates whether the city where firm i is located was included in the LCCP list in year t. The coefficient β on the interaction term Post t × Treat i is the main focus of this study.
Descriptive Statistics
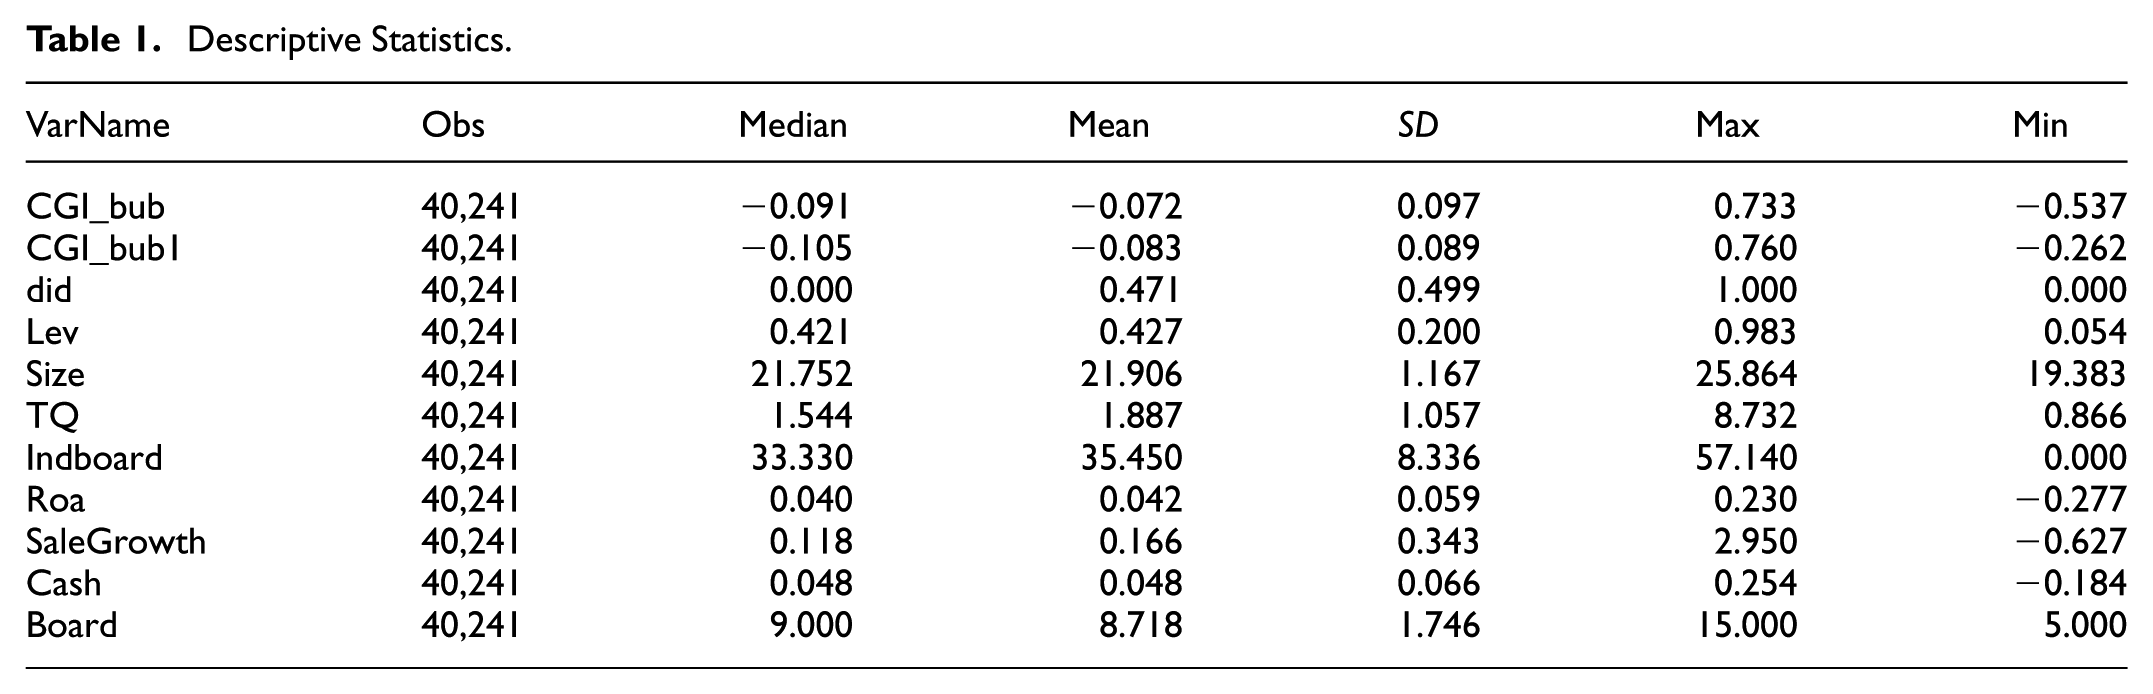
The descriptive statistics are presented in Table 1. The mean value of CGI_bub is −0.072, indicating that, on average, the level of green innovation bubbles among firms is slightly below zero—that is, the number of green patent applications generally exceeds the number of green patent grants. The maximum value is 0.733 and the minimum value is −0.537, suggesting that some firms exhibit relatively high levels of green innovation bubbles, while others show low or even negative bubble levels. A negative value may imply that certain firms have a higher authorization rate for green patents, reflecting more substantial innovation outcomes. CGI_bub1, an alternative variable used for robustness testing, is calculated based solely on the difference between green invention patent applications and grants. Its overall characteristics are similar to those of CGI_bub. Did represents the implementation status of the Low-Carbon City Pilot Policy, with a mean value of 0.471, indicating that approximately 47.1% of the observations are from pilot cities after the policy implementation, while the remaining 52.9% correspond to the control group or pre-policy period.
Descriptive Statistics.
Regression Results
Baseline Regression
The baseline regression results are displayed in Table 2. Specifically, Columns (1) and (2) utilize CGI_bub as the measure of corporate green innovation bubbles. The analysis reveals that the coefficient of did is positive. To further test the robustness of these findings, Columns (3) and (4) employ CGI_bub1 as an alternative measure for regression analysis. The coefficient remains positive, reinforcing the conclusion that the LCCP significantly contributes to the increase in corporate green innovation bubbles. Therefore, Hypothesis 1 is strongly supported.
Baseline Regression.

Note. CGI_bub measures the overall green innovation bubble. It is constructed by standardizing the gap between the number of all green patent applications (including both green invention patents and green utility model patents) and all green patent grants. CGI_bub1 is an alternative indicator focusing on the bubble in high-quality green innovation. It is calculated in the same way as CGI_bub but is based only on green invention patents, which have the highest technological content and the most rigorous examination standards. t-Values reported in parentheses.
, **, and *** indicate significance at the 10%, 5%, and 1% levels, respectively.
Robustness Tests
The Parallel Trends Test
Figures 1 and 2 illustrate the dynamic trends of green innovation bubbles before and after policy implementation under different measurement approaches. The results indicate that, regardless of whether CGI_bub or CGI_bub1 is used as the measurement indicator, the regression coefficients before policy implementation are not statistically significant. This finding supports the validity of the parallel trends assumption, confirming that both groups of firms followed a similar trajectory in green innovation bubbles before the policy was enacted. This provides strong justification for causal inference based on the DID method.

The parallel trends test-CGI_bub.

The parallel trends test-CGI_bub1.
Propensity Score Matching
Specifically, with various control variables serving as covariates, the nearest neighbor matching method (1:3 matching) is employed to ensure that the absolute value of the bias rate for the matched covariates is below 10%. The regression results after matching are presented in Table 3. This suggests that the positive effect of the LCCP on corporate green innovation bubbles is not attributable to sample selection bias but rather indicates a robust causal relationship.
Propensity Score Matching.

Note. *, **, and *** indicate significance at the 10%, 5%, and 1% levels, respectively.
Controlling for the Effects of Similar Policies
During the dynamic evolution of the LCCP, the carbon trading mechanism and the green loan interest subsidy policy, which were implemented concurrently as national-level environmental regulation tools, have created a multidimensional policy overlay effect. The carbon emissions trading pilot began in October 2011 with the release of the “Notice on the Implementation of Carbon Emissions Trading Pilot Work.” In 2013, seven provinces and cities, including Beijing and Shanghai, established regional carbon markets, forcing companies to optimize their carbon asset management strategies through the quota allocation and trading mechanisms (Z. Zhang, 2015). The green loan interest subsidy policy is a coordinated fiscal and financial policy, where local governments bear part or all of the loan interest to encourage banks and financial institutions to allocate more funds to green projects. It entered the deepening stage in 2017 (Jin et al., 2022).
Given that these two policies overlap in space and time with the low-carbon city pilot, their interaction may introduce confounding effects on the research subject. To exclude the interference from concurrent policies, this study treats these two policies as quasi-natural experiments. Specifically, the study controls for the interaction term “carbon_emissionDID” to account for whether a city is included in the carbon trading program and the time trend, and the interaction term “green_creditDID” to control for the green loan interest subsidy pilot cities and the time trend. These variables are added to the model (1). The results presented in Table 4 demonstrate that when both policies are accounted for, the significance level and direction of the core conclusion are still robust.
Controlling for the Effects of Similar Policies.

Note. *, **, and *** indicate significance at the 10%, 5%, and 1% levels, respectively.
Placebo Test
This study uses a random process repeated estimation method, performing 500 repeated sampling estimations of the model and plotting the corresponding coefficient distribution (see Figures 3 and 4). As shown in the figures, the distribution of the estimated coefficients is primarily concentrated around the value of 0, with no significant shift or abnormal fluctuations.

Placebo test-CGI_bub.

Placebo test-CGI_bub1.
Mechanism Analysis
Mechanism Analysis of Market Competition
This study uses the Herfindahl-Hirschman Index (HHI) as a proxy for market competition, measuring the level of competition in the industry through the sum of the squares of the market share of each firm’s revenue in the industry. A smaller HHI indicates more intense market competition.
According to the empirical analysis results in Table 5, interaction term between the LCCP and the HHI is significantly negative. This suggests that in industries with more intense market competition, the effect of the LCCP on driving corporate green innovation bubbles is more significant. Essentially, the policy may intensify market competition, which in turn further fuels the bubble phenomenon in corporate green innovation. The intensification of market competition creates greater survival pressure for firms. Under the incentives of the LCCP, firms may choose to increase the number of green patent applications to showcase their green innovation capabilities, thereby gaining more policy support and market recognition. While this strategic behavior can enhance the company’s market image in the short term, it often overlooks the quality of green innovation, resulting in the formation of a green innovation bubble.
Mechanism Analysis of Market Competition.

Note. *, **, and *** indicate significance at the 10%, 5%, and 1% levels, respectively.
Mechanism Analysis of Herd Behavior
This study uses the ratio of a firm’s annual R&D expenditure to total assets (RD) as a measure of innovation level and further examines the convergence of a firm’s innovation level with the industry average innovation level to assess the firm’s tendency toward “herding behavior” in innovation decisions (Herd). Specifically, the Herd variable is defined as follows:

Where RD represents the firm’s innovation level in the current year, and IndRD represents the average innovation level in the industry for that year. According to this formula, the higher the Herd value, the narrower the gap between the firm’s innovation level and the industry average, meaning the firm is more likely to follow industry trends in its innovation decisions, exhibiting stronger “herding behavior.” Conversely, if the Herd variable is smaller, it indicates that the firm’s innovation level is more independent, with weaker convergence to the overall industry innovation pattern.
Based on the empirical regression results in Table 6, the interaction term between the LCCP and the herd behavior variable (Herd) is significantly positive. This suggests that the implementation of the LCCP substantially amplifies the imitation effect of firms in green innovation. Under the policy incentives, firms are more likely to refer to the practices of their peers when making decisions, rather than innovating independently based on their own technological reserves or market demands. This mechanism may stem from firms’ excessive reliance on policy benefits: incentivized by the LCCP, firms often choose to imitate mainstream green innovation strategies within the industry to obtain government subsidies, enhance market recognition, or meet regulatory requirements, rather than focusing on the quality and technological breakthroughs of their innovations. This “convergent innovation” exacerbates the bubble in corporate green innovation.
Mechanism Analysis of Herd Behavior.

Note. *, **, and *** indicate significance at the 10%, 5%, and 1% levels, respectively.
Heterogeneity Analysis
Heterogeneity Analysis of Ownership Concentration
This research employs the ownership concentration measure used by Lyu (2025), defined as the proportion of shares held by a firm’s top 10 shareholders. Based on the median value, the sample is split into two categories. In the high ownership concentration group, shares are predominantly held by major shareholders or a few core shareholders, whereas in the low ownership concentration group, shares are more widely distributed. As indicated by the group regression results in Table 7, the impact of the LCCP on corporate green innovation bubbles is more significant in the high ownership concentration group.
Heterogeneity Analysis of Ownership Concentration.

Note. *, **, and *** indicate significance at the 10%, 5%, and 1% levels, respectively.
On one hand, in firms with high equity concentration, major shareholders usually have greater decision-making power and often prioritize short-term gains (Tibiletti et al., 2021; K. Wang & Shailer, 2015). The LCCP typically brings government subsidies, tax benefits, financing support, and other policy incentives, which increase the firms’ motivation to acquire resources in the short term. Under the leadership of major shareholders, firms may be more inclined to pursue these short-term policy gains and might even adopt “symbolic innovation” or exaggerate the achievements of green technologies in order to meet policy requirements and secure government support. As a result, the firm’s green innovation activities may remain superficial, overlooking technological breakthroughs and quality improvements, thus exacerbating the formation of a green innovation bubble. This behavior not only fails to promote sustainable development but could also impact the overall green technological progress in the industry. On the other hand, high equity concentration is often associated with weakened internal governance structures (Margaritis & Psillaki, 2010), where controlling shareholders dominate corporate decisions (R. Chen & Chen, 2024; X. Zheng & Shen, 2024), and the oversight of minority shareholders and external investors is limited. In such governance structures, firms are more prone to “pseudo-innovation” or low-quality green innovation projects. Especially under policy incentives, these firms may adopt formalistic innovation strategies aimed at meeting government green policy requirements and securing financial support. In contrast, firms with more dispersed equity tend to have more transparent governance structures and more oversight mechanisms, making them better able to guard against short-term speculative behaviors, thus exhibiting lower levels of green innovation bubbles. Additionally, under the push of LCCP, the market’s valuation of green innovation firms typically rises, especially in the early stages of the policy. This market expectation may lead firms to overestimate the prospects of their green technologies, potentially even resulting in stock price manipulation. In firms with high equity concentration, major shareholders, leveraging information asymmetry (Boubaker et al., 2014), may use exaggerated or misleading green innovation information to inflate stock prices, gaining short-term benefits from market speculation. Therefore, under the incentives of the LCCP, firms with high equity concentration, due to the strong control that major shareholders exert over management, are more likely to engage in short-sighted innovation behaviors, further exacerbating the formation of a green innovation bubble.
Heterogeneity Analysis of Environmental Protection Subsidies
Government environmental protection subsidies, as an important policy tool, play a significant role in firms’ production and operational activities (Xia et al., 2022). These subsidies not only directly reduce the costs of environmental governance for firms, but also alleviate their capital constraints, promoting long-term investments (Shao & Chen, 2022; Wu & Hu, 2020). This study manually examines the details of government subsidies extracted from the annual reports of publicly listed companies, focusing on environmental protection. Keywords such as “green,”“environmental subsidy,”“environment,”“sustainable development,”“clean,” and “energy saving” are used to identify relevant subsidy amounts. The environmental protection subsidy is calculated using the formula: (subsidy amount × 100) / total revenue. Based on the median value of the subsidy indicator, firms are categorized into two groups: those with high environmental protection subsidies (High subsidy) and those with low environmental protection subsidies (Low subsidy).
According to the grouped regression results in Table 8, the LCCP has a stronger bubble effect on green innovation for companies with lower environmental subsidies, while this effect is weaker and even insignificant for companies with higher environmental subsidies. This difference reflects the distinct response mechanisms of companies under policy incentives. Specifically, companies with higher environmental subsidies typically already receive direct government support and can secure stable funding for green innovation (Han et al., 2024; Shi & Zhou, 2024), which reduces their dependence on additional policy incentives such as the LCCP. With adequate funding, these companies are more likely to focus on long-term technological research and development and innovation, rather than engaging in “tactical innovation” to quickly capitalize on policy benefits. As a result, their green innovation activities are more sustainable and substantial, avoiding the formation of innovation bubbles. In contrast, companies with lower environmental subsidies, due to limited resources, often cannot secure sufficient government support, making them more sensitive to the incentives of the LCCP. These companies are more inclined to exploit policy benefits for “short-term arbitrage” innovation, seeking to maximize short-term gains by increasing the number of green patents, while neglecting the improvement of innovation quality, leading to a higher degree of green innovation bubble. On the other hand, companies with higher environmental subsidies are typically subject to regular government reviews and are required to provide detailed reports on environmental governance and green innovation performance during the subsidy distribution process (J. Liu et al., 2020). This makes their innovation behavior more likely to be constrained by external supervision, reducing the likelihood of speculative innovation. In contrast, companies with lower environmental subsidies often face less regulation, making them more prone to adopting “speculative” innovation strategies under policy incentives, further exacerbating the trend of green innovation bubble formation. Therefore, policymakers should consider the potential incentive biases and regulatory blind spots that may exist during the innovation process when designing LCCP, to avoid over-reliance on policy incentives that may trigger green innovation bubbles.
Heterogeneity Analysis of Environmental Protection Subsidies.

Note. *, **, and *** indicate significance at the 10%, 5%, and 1% levels, respectively.
Heterogeneity Analysis of High Pollution Industries
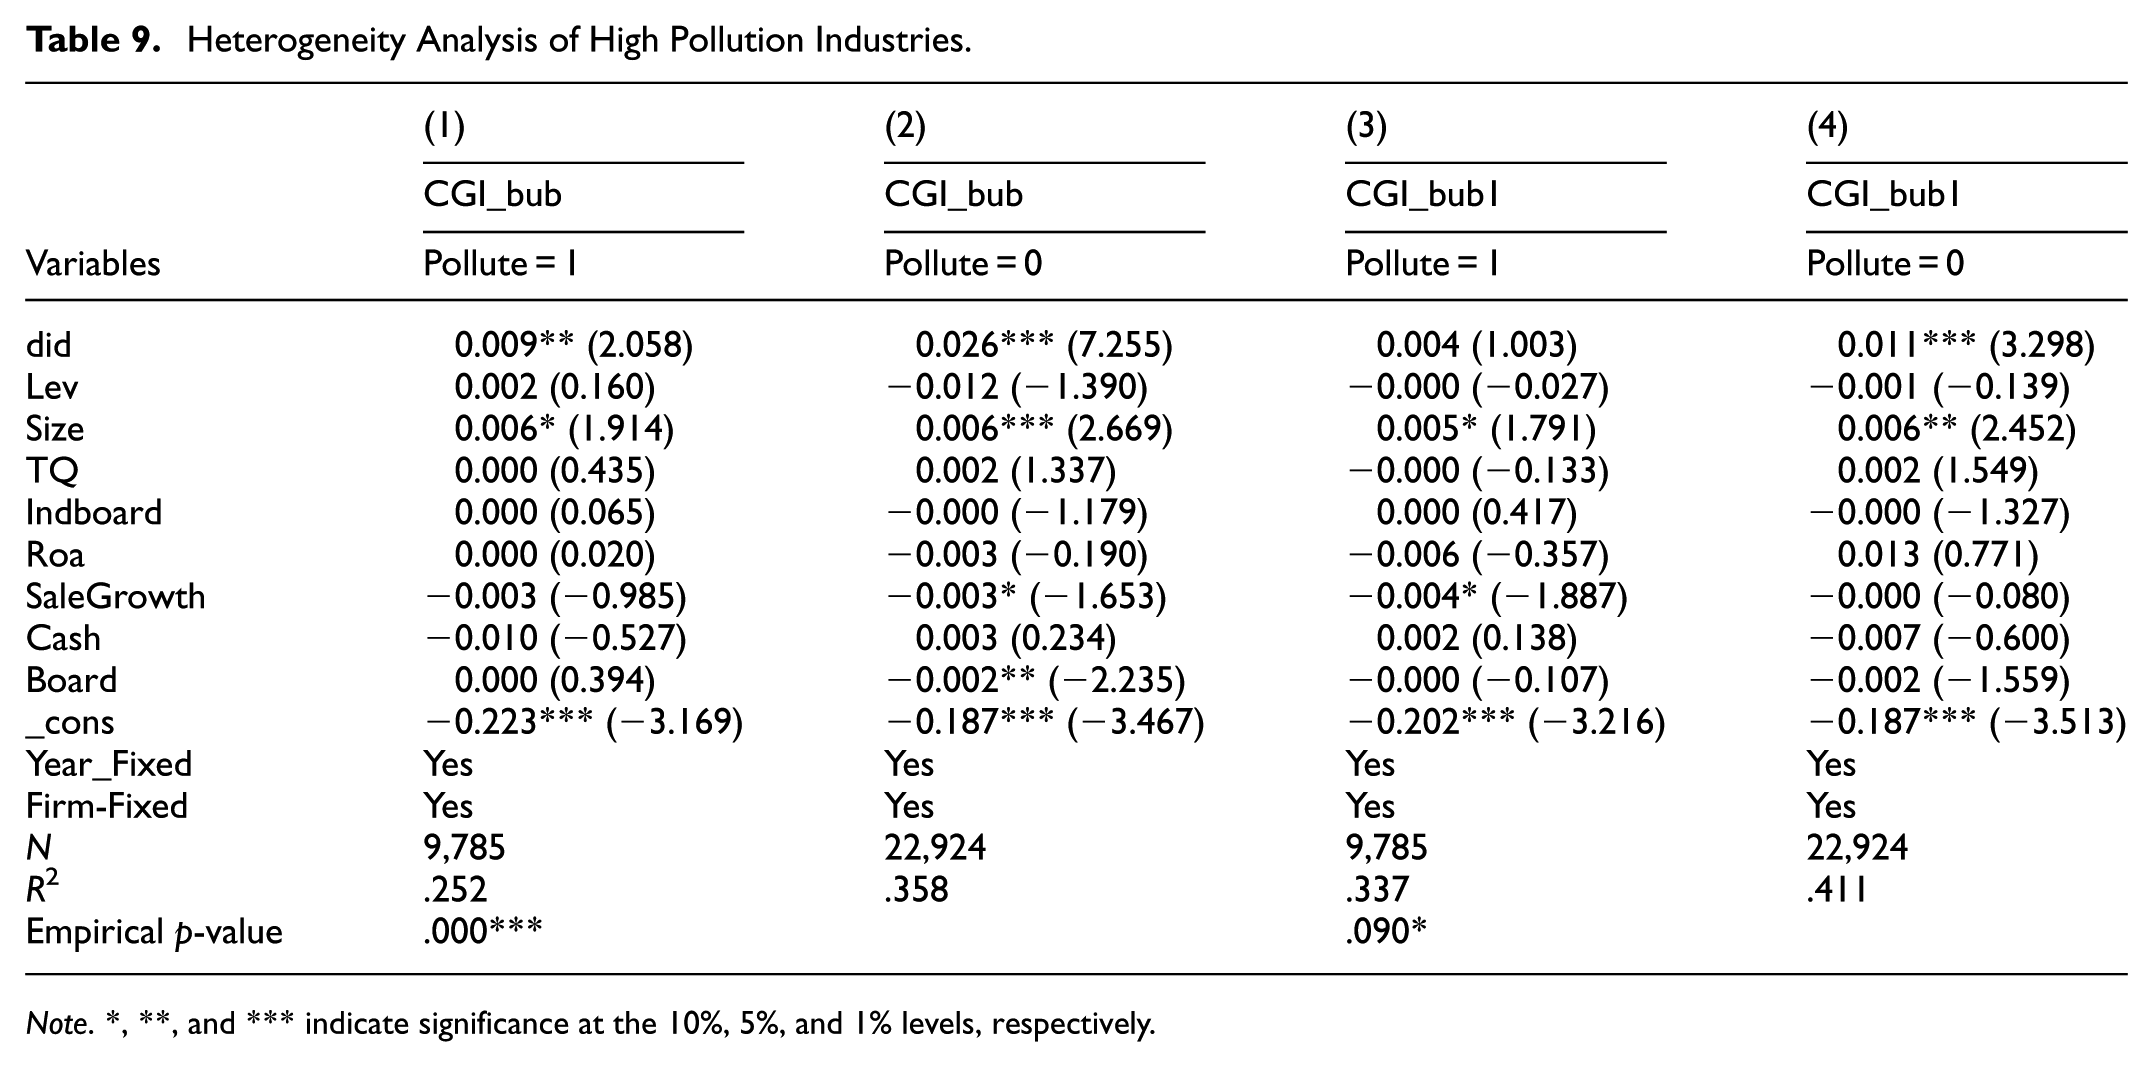
This study takes into account the varying driving effects of industry characteristics on corporate innovation behaviors. Following Cao (2025), high-pollution industries are classified based on the 2012 revisions of the “Industry Classification Guidelines for Listed Companies” by the “Environmental Protection Industry Classification Management Directory for Listed Companies.” These industries are typically associated with high-energy consumption, which have a significant environmental impact. Therefore, their green innovation behaviors may respond differently to policy incentives. Specifically, if a firm belongs to a high-pollution industry, it is assigned a value of 1 for the variable Pollute; otherwise, Pollute is 0. The regression results in Table 9 show a clear industry difference in the effect of the LCCP on the bubble effect of corporate green innovation.
Heterogeneity Analysis of High Pollution Industries.
Note. *, **, and *** indicate significance at the 10%, 5%, and 1% levels, respectively.
On one hand, firms in high-pollution industries typically face stricter environmental regulations (Y. Zhou et al., 2017; S. Zhu et al., 2014), and their innovation activities are often constrained by high environmental protection costs and complex technological research and development requirements. These firms’ investments in green innovation tend to focus more on compliance improvements and the upgrading of pollution control technologies, with less reliance on policy incentives for short-term “bubble” innovation. In contrast, firms in non-high-pollution industries, with relatively less environmental pressure, can more flexibly respond to the incentives brought by the LCCP. They are more likely to apply for a significant quantity of substandard green innovations using tools such as subsidies and tax breaks, leading to a more significant “bubble” phenomenon in innovation activities. Additionally, firms in non-high-pollution industries often operate in more competitive market environments, making it easier for them to enhance their image, attract capital, and meet policy requirements through superficial green innovations, such as the rapid growth in the number of patents.
Conclusion
The Low-Carbon City Pilot (LCCP) policy aims to promote firms’ green transition and enhance their green technological innovation capabilities. However, this study finds that while the policy generates positive effects, it also unintentionally contributes to the accumulation of green innovation bubbles. Our findings reveal a structural imbalance in which green patent applications surge under policy incentives, yet the quality of granted patents does not keep pace. This provides new evidence of the distortion of green innovation under policy-driven incentives.
In terms of underlying mechanisms, the LCCP policy intensifies market competition within industries and strengthens herding behavior among firms. As a result, firms become more inclined to pursue a higher quantity of green patents—seeking subsidies, tax incentives, and reputational benefits—rather than investing resources in high-quality, substantive technological R&D. Further heterogeneity analysis shows that this bubble effect is more pronounced among firms with higher ownership concentration, lower environmental subsidies, and those operating in non–heavily polluting industries. This suggests that different governance structures and external environments influence how firms respond to policy incentives.
Although this study systematically examines the impact of the low-carbon city pilot policy on corporate green innovation bubbles, several limitations remain. First, the analysis is primarily based on a sample of listed firms, and the applicability of the findings to non-listed firms warrants further examination. Second, the measurement of green innovation bubbles still relies on existing data and methodologies; future research could incorporate multidimensional indicators such as patent quality and the commercialization performance of technologies to provide a more refined assessment. In addition, future studies may further deepen the understanding of green innovation behavior and its potential irrational characteristics by exploring the interaction among different policy instruments and heterogeneity in regional institutional environments.
To ensure that the LCCP policy more effectively promotes substantive green innovation, policymakers should refine the incentive framework and incorporate more operational policy tools. First, reliance on single quantity-based indicators should be reduced, shifting toward an evaluation system centered on “innovation quality.” For example, a tiered subsidy mechanism could be implemented: offering higher subsidies for green invention patents with high technological content and significant environmental benefits, and lower subsidies for green utility model patents that are more prone to bubble formation. Such a mechanism would steer firms toward allocating resources to genuinely high-value green innovations. Moreover, before granting tax incentives, subsidies, or green financing benefits, the government could conduct ex-post environmental performance assessments—such as evaluating emissions-reduction effects, life-cycle environmental impacts, or the actual utilization of patented technologies—to prevent firms from securing policy benefits through large volumes of low-quality patents.
Second, oversight of firms’ green innovation activities should be strengthened, particularly for firms with high ownership concentration or low environmental subsidies, as these firms are more likely to engage in short-term arbitrage under policy incentives. Measures such as enhancing transparency in policy implementation, increasing random inspections, and establishing patent quality audit systems can help ensure that firms cannot obtain policy benefits through symbolic innovation or quantity inflation, thereby encouraging compliance with higher standards of innovation quality.
Finally, policy support should be tailored to industry characteristics. For heavily polluting industries, evaluations should focus on their technological R&D capabilities, governance performance, and the long-term environmental impacts of their technologies, to prevent firms from using large numbers of low-value patents to superficially package green transformation. For non–heavily polluting industries, policymakers should encourage more forward-looking green technology development and prevent firms from over-relying on policy incentives while neglecting technological originality and practical application value.
Footnotes
Appendix A
Acknowledgements
We would like to thank the editor and the anonymous reviewers for their insightful comments. All remaining errors were our own.
Author Contributions
Lin Zhang: Conceptualization, Methodology, Software, Validation, Formal analysis, Investigation, Data curation, Writing—review & editing, Writing—original draft preparation, Methodology, Funding acquisition, Visualization, Writing—review & editing.
Funding
The author received no financial support for the research, authorship, and/or publication of this article.
Declaration of Conflicting Interests
The author declared no potential conflicts of interest with respect to the research, authorship, and/or publication of this article.
Data Availability Statement
The datasets used and/or analyzed during the current study can be provided on reasonable request.