
Abstract
This study aims to predict stock returns by leveraging sentiment derived from daily financial news articles published in leading newspapers. The dataset combines firm-level financial indicators with a sentiment index constructed from online news coverage, covering daily data of 98,750 observations from September 2010 to December 2020. Employing the Long Short-Term Memory (LSTM) model, the findings demonstrate a significant relationship between news sentiment and stock returns in the manufacturing sector. Notably, news sentiment emerges as the second most influential predictor after trading volume, surpassing several traditional financial variables. These results offer practical implications for investors seeking to improve decision-making and for policymakers aiming to monitor market volatility. The integration of textual data into predictive models provides a valuable resource for anticipating economic risks and enhancing regulatory responses.
Plain Language Summary
Investors often use firm financial indicator and market trends to predict stock prices for their investments. However, today’s fast-changing world make it difficult to accurate predictions for stock performance. This study investigates whether news articles from business news papers can help improve those predictions. We collected business news from major English newspapers in Pakistan and daily stock returns data from the manufacturing firms listed on the Pakistan Stock Exchange with the data covering over 98,000 daily records from 2010 to 2020. We used a Long-Short-Term Memory (LSTM) machine learning technique to build our models to predict stock returns for the same day and the next day by leveraging news articles sentiment and other financial data. The results show that news sentiment is a key factor in predicting stock prices. This suggests that investors can make better decisions by considering business news, not just financial numbers. Regulators can also benefit by focusing on specific sectors like manufacturing rather than taking a one-size-fits-all approach. This helps understand market behavior more accurately and make better policy decisions.
Introduction
Investors scrutinize the companies that have higher stock returns and lower risk. However, due to instability and a noisy environment, predicting the stock market is complex and challenging (Nguyen et al., 2015). Analysts and traders depend on technical indicators related to daily stock price movements. Although these indicators can be used in prediction, it is still difficult to accurately predict daily stock returns (Ticknor, 2013). Time-series analysis forms the foundation of the most outdated conventional stock market prediction techniques. According to de Gooijer and Hyndman (2006), one-third of the papers published in the literature focused on time series analysis. The Moving Average (MA), Autoregressive Moving Average (ARMA), and Autoregressive Integrated Moving Average (ARIMA) are traditional econometric estimation techniques for predicting stock returns (Jin et al., 2020). However, the stock market displays nonlinear features that the traditional approaches may not be suitable for stock market predictions in a complex environment with high risks and uncertainties (M. Li et al., 2020).
As a result, literature has adopted advanced machine learning models to obtain more accurate predictions (Fazel Zarandi et al., 2012; Hadavandi et al., 2010; Hegazy et al., 2013). For example, directive and iterative forecasting techniques (Hamzaçebi et al., 2009), Artificial Neural Network (ANN; Yetis et al., 2014), Recurrent Neural Network (RNN; Roman & Jameel, 1996), Particle Swarm Optimization (PSO) and Least Squares Support Vector Machine (LSSVM; Hegazy et al., 2013), fuzzy decision tree (FDT) and Genetic Algorithm (GA; Lai et al., 2009). The primary objective of employing these advanced machine learning models in literature is to enhance the accuracy of stock return predictions, particularly in complex and volatile market environments.
Along with other traditional financial indicators, investors react to social and online news media, which play a significant role in their investment decisions (Nguyen et al., 2015). Researchers have also leveraged information in news articles and financial data about stocks to predict stock market returns using traditional econometric models. According to Fang et al. (2014), media contents impact individual investors’ trading behavior through frequent discussions about stock price movements.
Most of the previous research has employed pooled data from multiple industries, including financial and non-financial sectors, from different stock exchanges to predict stock returns. We select only the manufacturing sector because this sector is a key driver of economic growth, which significantly contributes to GDP by creating jobs for both skilled and unskilled workers and supporting related industries through supply chains (Felipe, 2018; Ndubisi et al., 2021). The manufacturing sector boosts exports, earns foreign exchange, and strengthens trade balances. As such, it plays a vital role in creating employment opportunities, especially for semi-skilled and unskilled workers, helping to reduce poverty and improve living standards (Erumban & de Vries, 2024). Beyond direct employment, the manufacturing sector also drives economic activity through backward and forward linkages, fostering growth in agriculture, mining, logistics, and services (Ur Rehman & Bakar, 2019). In developing countries, it helps diversify the economy, supports urbanization, and reduces poverty (Rodrik, 2013). Additionally, it promotes infrastructure development and technological innovation. A strong manufacturing base increases economic resilience and, with modern practices, supports sustainability through efficient resource use and environmentally friendly production (OECD, 2014).
In this context, using a multi-industry approach may not be entirely appropriate for examining the manufacturing sector, as its unique characteristics and role in the economy differ significantly from other industries. Consequently, the manufacturing sector, given its central role in economic activities, warrants a focused and separate investigation into its performance. This view is also endorsed by X. Y. Qiu et al (2006), who recommended developing separate models for each industry (p. 14). Therefore, our results provide more robust analysis related to the manufacturing sector against those studies that used market index data, which is pooled for multiple industries (Alamsyah et al., 2019; W. Chen et al., 2017; Vargas et al., 2017; Vijh et al., 2020).
In our study, we use manufacturing firms for our analysis listed on the Pakistan Stock Exchange (PSX). This sector has demonstrated significant performance and resilience across various periods. Notably, in 2016, it was recognized as the third-largest market in Asia and ranked as the fifth best-performing stock market globally (Mangi, 2016). In 2020, during the challenging COVID-19 pandemic, the PSX outperformed major global indices, including the S&P 500, emerging as the best-performing market in Asia and the fourth globally (Khushro, 2020). Despite ongoing political instability, the PSX continues to be regarded as one of the leading emerging markets, characterized by high growth potential and substantial liquidity (Ghani et al., 2022; Irtiza et al., 2021; Joyo & Lefen, 2019).
For the analysis, we developed a sentiment index from business news articles from leading Pakistan newspapers, including The News, The Tribune, and The Dawn, using daily data from September 2010 to December 2020. This decade has had many ups and downs in Pakistan’s economy, that is, in 2011, the government was struggling to deal with many issues, like terrorism, corruption, and economic instability. In 2013, the elections of the new prime minister and his dismissal in 2017 by the Supreme Court of Pakistan due to corruption charges reported in the Panama Papers. In 2018, the newly elected prime minister of Pakistan, former cricketer turned politician Imran Khan, whose government fairly dealt with COVID-19 through the smart lockdown (WHO, 2020). The World Economic Forum (WEF) announced a commemorative “Pakistan Strategy Day” on November 25 against dealing with COVID-19 (Brende, 2020). The period includes the IMF program of 2019 and the withdrawal of NATO forces from Afghanistan. These events have mainly been discussed in business news articles in the selected period.
Our results demonstrate that predicting stock returns using data from news articles and other financial information helps predict stock returns. In addition, research has shown that machine learning models are “Black Boxes” because the contribution of each input variable in the model is unknown when predicting the output variable. We employ the relative importance technique to identify the contribution of each input variable to predicting the stock returns of the manufacturing sector. Our results show that news articles are valuable sources of information for predicting stock returns. Thus, ignoring textual information in news articles can lead to mis-specified models, and the results may be biased.
This study makes important contributions to existing literature. First, according to Cristescu et al. (2022), market dynamics are changing rapidly and have inevitably impacted the financial market; market prediction has become more crucial than ever. Therefore, it is important that investors adopt non-conventional measures for stock returns predictions. Therefore, this study used a large qualitative dataset, specifically, business news articles, to enhance the prediction of stock returns of the manufacturing sector. This approach marks a significant departure from the predominant trajectory of existing research, which largely relies on traditional fundamental methods. By incorporating textual information from news articles as predictive variables, the study opens a new avenue for future research in stock return forecasting. Therefore, news sentiments help investors understand market dynamics to the investors for making critical investment decisions (Calvard & Jeske, 2018).
Second, previous studies have mainly focused on their analysis for pooling data from multiple industries using stock indexes. We select only a single sector, that is, the manufacturing sector, because each sector has its own dynamics. For instance, certain sectors demonstrate strong performance, others do not, making it difficult to generalize findings across all industries. Therefore, we recommend conducting industry-specific analyses to ensure that the results are more accurately applicable to each sector. In this context, using a multi-industry approach may not be entirely appropriate for examining the manufacturing sector, as its unique characteristics and role in the economy differ significantly from other industries. Consequently, the manufacturing sector, given its central role in economic activities, warrants a focused and separate investigation into its performance. Therefore, our results provide more robust analysis related to the manufacturing sector against those studies that used market index data, which is pooled for multiple industries (Alamsyah et al., 2019; W. Chen et al., 2017; Vargas et al., 2017; Vijh et al., 2020).
Third, the study enhances the accuracy of stock return prediction by integrating textual information from news articles with financial data, a departure from prior studies that primarily relied on financial data alone to predict stock returns and used a traditional econometric model (Herwartz, 2017; Holthausen & Larcker, 1992; Joshi, 2011; G. Li et al., 2022; Osman, 2025).
Fourth, the machine learning models are considered as black boxes because they do not provide the contribution of each input variable for predicting the output variable (Le & Viviani, 2018; Mount et al., 2013; Olden & Jackson, 2002; Tzeng & Ma, 2005). We use a variable importance approach to identify the contribution of each input variable in predicting stock returns. Our findings underscore the prominence of news articles as the second most influential variable, indicating their significance as a predictor of stock returns. Therefore, the study emphasizes the importance of textual information that may be used for extracting valuable insights pertinent to stock market dynamics and early warning indicators, among other applications. Furthermore, the study facilitates regulators in assessing the magnitude of fluctuations in stock market volatility through the analysis of news articles.
Fifth, in contrast to the predominant focus on conventional econometric and machine learning models used in previous research, this study explores the efficacy of the LSTM and compares the results of traditional SVM models for a better prediction accuracy (Karmiani et al., 2019; Nayak et al., 2024).
Finally, this study provides a theoretical contribution by integrating the Efficient Market Hypothesis (EMH), Prospect Theory, and Appraisal Theory in explaining the investor behavior for stock return prediction. Using this framework, investors may utilize various sources of information, including traditional financial variables and textual data from business news articles, to make informed decisions. Prospect Theory helps frame information, which influences their risk perceptions and future investment decisions. Appraisal Theory helps explain how investors may transform textual information into sentiment using positive and negative words, which in turn affects their decision-making process in financial markets. By integrating these theoretical viewpoints, our study highlights the role of sentiment derived from news articles as a meaningful input in understanding and predicting market behavior.
Literature Review
A growing strand of finance literature examines the prediction of stock returns using traditional econometric models (for a comprehensive review, please refer to Naik & Reddy, 2021). These conventional models rely on established theories and propose statistical interpretability, while often falling short in capturing the non-linearity and high-dimensional structure of financial data (M. Qiu et al., 2016). Such limitations of conventional models led to increased scholarly interest in machine learning predictive models that can process large-scale, complex datasets with high accuracy.
In this context, machine learning models have shown substantial capability in predicting stock returns more accurately. For example, Vijh et al. (2020) employ ANN and Random Forest (RF) algorithms to predict closing prices of large U.S. firms and conclude that ANN consistently provides high prediction accuracy as compared to RF. Recent studies have explored deep learning techniques, such as LSTM, RNN, and Convolutional Neural Networks (CNNs). For example, Moghar and Hamiche (2020) demonstrate that LSTM networks can effectively model sequential patterns in stock price predictions, while Ticknor (2013) shows that Bayesian regularization and Levenberg–Marquardt methods can forecast short-term stock movements with high accuracy. M. Qiu et al. (2016) emphasize that though ML models provide better predictions, a broader set of input variables can also significantly enhance model performance, highlighting the importance of comprehensive variable selection in predicting stock market returns more accurately.
Beyond numerical financial variables, researchers have increasingly recognized the predictive value of textual information, particularly financial news. Alamsyah et al. (2019) examine sentiment extracted from five Indonesian news websites using SVM and find a strong correlation between news sentiment and stock market returns. In the U.S. context, Nikkinen and Peltomäki (2020) explore the relationship between news articles and Google search trends to stock returns using a state space and distributed lag framework and suggest that news-based sentiment significantly drives market behavior. Likewise, Wang et al. (2021) apply LSTM to 1.7 million news articles and demonstrate that media attention is positively associated with stock returns in the green sector. W. Chen et al. (2017) establish a causal relationship between news sentiment and market performance in China using a two-layer RNN-GRU model.
The predictive power of textual data has been further validated using advanced deep learning approaches. Vargas et al. (2017) compare CNN and RNN on Reuters financial headlines, finding RNNs superior for predicting stock returns. Firmansyah and Husodo (2021) analyze the impact of daily news and Google search volumes on Indonesian stock returns using the Fama–French Three-Factor Model (FF3F) and find abnormal returns associated with sentiment variables. Similarly, Raman et al. (2022) combine sentiment indexes and financial indicators using hybrid ML-econometric models, reporting a strong link between positive sentiment and cumulative abnormal returns.
Social media platforms have additionally supplemented the scope of sentiment analysis in financial market prediction. Nguyen et al. (2015) utilize Topic Sentiment Latent Dirichlet Allocation (TSLDA) on Yahoo Finance message boards and suggest that TSLDA improved prediction accuracy. Batra and Daudpota (2018) use Twitter news sentiment in predicting stock market returns using SVM and observe a positive link between Twitter news sentiment and stock market returns. Pagolu et al. (2017) use 2,50,000 Microsoft Tweets and historical prices to observe the stock market movements and find that the increase or decrease in a firm’s stock price is strongly related to public sentiment. Duz Tan and Tas (2021) use Twitter sentiment to check how stock returns are influenced by sentiment and suggest that the volume of tweets has a positive relation with stock returns. In addition, positive sentiment has a greater effect on small and emerging market companies. M. Li et al. (2020) utilize a BERT-based sentiment classifier on Chinese stock reviews and confirm a positive relationship between investor sentiment and market performance. Uniquely, Alshammari and Ory (2023) investigate the influence of religious announcements in Saudi Arabia, revealing that such sentiment-rich information can also predict market dynamics, thereby expanding the definition of informational content in financial markets.
More recently, Nabi and Iqbal (2025) highlight the growing value of combining financial indicators with news sentiment to improve stock return predictions. Applying a neural network to over 231,000 daily observations (2010–2024) shows that news articles significantly enhance return forecasts in the South Asian banking sector. These findings support the use of textual data alongside financial metrics for more informed investment and policy decisions. Shao et al. (2025) use the HD-SURDLM model and combine sentiment analysis from social media and news with dynamic financial modeling to predict stock returns. Using tools like VADER and RoBERTa, it outperforms traditional models. It offers improved prediction and decision support for investors in sentiment-driven markets. Doroslovacki et al. (2024) find that entropic and non-entropic sentiment indicators based on pessimism, consensus, and optimism effectively forecast S&P 500 and Bitcoin prices, especially over longer horizons.
In sum, the literature reveals a clear shift toward hybrid models that integrate structured financial data with unstructured textual inputs. The consistent superiority of machine learning models, particularly deep learning and natural language processing in predicting stock returns, challenges the exclusive reliance on traditional econometric and machine learning models (for further details, please see Todd et al., 2024).
Theoretical Framework and Hypothesis
The role of financial news and textual information in shaping investor behavior has been examined in the literature through three major theoretical perspectives: (a) the Efficient Market Hypothesis (EMH), (b) prospect theory, and (c) appraisal theory.
The Efficient Market Hypothesis introduced by Fama (1970) posits that financial markets are efficient when asset prices fully reflect all available information at any given time. EMH is generally classified into three forms. The weak form EMH emphasizes that current stock prices incorporate all historical data. The semi strong form extends and suggests that stock prices adjust rapidly to publicly available newly available information related to the firms and other macroeconomic information. The strong form of EMH suggests that private information is already reflected in stock prices, implying no investor can consistently achieve higher returns. While EMH provides a fundamental framework for understanding market behavior, growing practical evidence challenges its assumptions, particularly in the presence of new forms of data, such as textual information.
Recent studies have shown that, beyond historical and traditional financial data, textual information in the form of business news articles has a substantial impact on stock (Díaz & Jareño, 2009; Fedorova & Stepanov, 2024; Ho & Huang, 2021; Kim et al., 2014). These studies indicate that investors respond not only to structured financial indicators but also to the contents of news articles, which often reflect market information and investor expectations.
To explain how investors interpret and respond to business news, prospect theory provides valuable insights about market conditions (Barberis et al., 2016). Prospect theory, introduced by Kahneman and Tversky (1979), suggests that individuals evaluate gains and losses relative to a reference point. Investors tend to be risk-averse in the domain of gains and risk-seeking when confronted with losses. Prospect theory helps explain observed behaviors such as overreaction to positive news and underreaction to negative news, which are common in financial markets.
Complementing prospect theory, appraisal theory offers a psychological and linguistic framework to understand how information derived from news articles may influence investor decisions by converting it into emotions. Originating from the works of Arnold (1960) and Lazarus (1968), appraisal theory focuses on the emotional and evaluative language embedded in communication. Martin and White (2005) used appraisal theory to design an appraisal frame for deriving sentiment from textual information. In the context of financial markets, appraisal refers to the use of language to express emotions, judgments, and attitudes, often captured through polarity (positive vs. negative sentiment). The often-used tool of appraisal framework is the polarity index, which captures the sentiment of textual information. The frequency and context of emotionally charged positive and negative words in news articles can influence investor decisions, which may lead to shifts in trading behavior, stock price movements, and market anomalies (Goodell et al., 2022; Wei et al., 2015).
Empirical studies have found significant associations between sentiment derived from news articles, social media, and subsequent stock price movements (Becker et al., 1995; Calomiris & Mamaysky, 2019; Engle et al., 2021; Heston & Ranjan Sinha, 2017). Building on this, prior research has employed sentiment analysis tools, such as sentiment indexes, to quantify the emotional content in financial news and assess its impact on market behavior. The sentiment index captures the polarity within financial news, presenting a proxy for investor mood from news articles from optimism and pessimism.
Based on this theoretical foundation, the present study investigates the role of financial news and sentiment in predicting stock returns in Pakistan’s manufacturing sector. The integration of appraisal-based sentiment measures with financial indicators contributes to a more nuanced understanding of investor behavior in response to news information. Accordingly, the study proposes the following hypotheses:
Research Methodology
Sample
Initially, we select all the firms listed on the Pakistan Stock Exchange (PSX). To ensure sectoral consistency, we excluded financial firms due to their distinct business activities and regulatory environments. From the remaining pool, we chose only manufacturing firms, which are included in the PSX 100 Index, as this index represents the most liquid and influential companies in Pakistan’s capital market. The reason for the selection of manufacturing firms is that this sector serves as a major source of export earnings, contributing to foreign exchange reserves and reducing reliance on imports, which is crucial for stabilizing the trade balance in Pakistan (SBP, 2022). This sector contributes approximately 12.4% to GDP, large-scale manufacturing accounts for around 9.2% and small-scale manufacturing contributes about 2.0% of GDP (Pakistan Economic Survey, 2023). Similarly, the manufacturing sector employs about 16% of the total labor force, which is one of the largest employers outside the agricultural sector. In addition, manufacturing goods make up nearly 64% to 70% of total exports, which include textiles, garments, leather products, chemicals, and sports goods. (Pakistan Bureau of Statistics, 2023). After accounting for all criteria, our final sample consists of the top 25 manufacturing firms from key industrial sectors, including textiles, cement, chemicals, and automobiles.
The financial data used in this study were obtained from DataStream, while news articles were collected through web scraping from online newspaper archives. The selection of the study period was determined by the availability of historical news data. Accordingly, the starting point of the analysis was set based on the earliest date for which archived news articles were accessible on the websites of the selected newspapers. News sentiment data were sourced from three major English-language newspapers in Pakistan: The News, The Express Tribune, and Dawn, which are widely regarded as credible and maintain comprehensive digital archives.
After applying all inclusion criteria and ensuring data consistency, the final sample comprised the top 25 manufacturing firms listed on the Pakistan Stock Exchange. The dataset spans the period from September 2010 to December 2020, resulting in a total of 98,750 daily firm-level observations. This comprehensive dataset forms the foundation for the empirical analysis conducted in this study.
Variables and Definitions
Output Variable
The output variable for the underlying study is the stock market returns. Many other researchers have used this variable as an outcome (W. Chen et al., 2017; Moghar & Hamiche 2020). This is calculated in the following Equation 1:

Where Market Returns is the difference between the closing and opening prices divided by the opening price, the subscripts i and t represent the company and time, respectively.
Input Variables
We used two types of variables in this study to develop our prediction model. The first is the sentiment index developed through business news articles, and the second is the financial variables representing firms’ characteristics, which include trading volume (Chordia & Swaminathan, 2000; Gambarelli & Muzzioli, 2025; Lee & Rui, 2000), Total Assets (Al-Mwalla et al., 2010; Arslan & Zaman, 2014; Basu, 1977) as a proxy of firm size, market value of the (Al-Mwalla et al., 2010; Gambarelli & Muzzioli, 2025; Ong et al., 2010; Wu, 2014), and Market-to-Book ratio (Atilgan et al., 2021; Pontiff & Schall, 1998). These control variables are also used in the literature.
Construction of Sentiment Index
To develop the Sentiment Index, we scraped news articles from the business section using Python from each newspaper website. There are multiple Application Programming Interfaces (API) in Python for web scraping. We adopted Beautiful Soup and Selenium APIs due to their high efficiency, which provided us with CSV files. After scraping news articles, we cleaned them of unnecessary symbols, punctuation, and stopwords, and the text was converted into lowercase. There are different types of dictionaries available for extracting sentiment words from Word documents. According to Anese et al. (2023), dictionary-based sentiment provides meaningful results that outperform those based on stock index returns.
The two common types of dictionaries are Loughran and McDonald (2011) financial dictionary and the Harvard Psycho-sociological Dictionary. According to Loughran and McDonald’s (2011), word lists developed for other disciplines misclassify the common words in the financial text and suggest that almost 3/4 of the negative words widely used Harvard Dictionary are typically not considered negative in the financial context. With these considerations, Loughran and McDonald (2011) developed their dictionary of positive and negative words for measuring the sentiment of text documents. This dictionary has been widely used in the recent literature (Iqbal, 2020; Iqbal et al., 2023; Iqbal & Riaz, 2022; Iqbal & Saeed, 2025). In our context, we found negative words, which include “recession,”“crisis,”“declined,”“insolvency,” and “dispute,” the most frequently used words in news articles. Similarly, we found “strong,”“despite,”“leading,”“improve,” and “effective” as the frequent positive words in these newspapers. The news articles not only reflect the specific country but also the international context because economies are connected financially due to international transactions. The simplest way to score the sentiment of a text is to calculate the positive and negative words in each article. We counted as many times a term occurs in each article, which reflects the stress placed by the writer on a specific issue. The reason is that the presence of positive and negative terms in the texts is a more robust summary indicator of the sentiments positioning (Iqbal, 2020).
Finally, we applied the formula of Uang et al. (2006) to develop the sentiment index as shown in the following Equation 2:

The value of the sentiment index ranges between +1 to −1, representing the complete positive to negative sentiment. This formula has been used by many other researchers for sentiment extraction in accounting and finance literature (Henry, 2008; Iqbal, 2020; Iqbal & Riaz, 2022; Iqbal, Saeed, et al., 2023).
Estimation Techniques
The LSTM Neural Networks
To predict stock returns of the manufacturing sector of Pakistan, this study employs the LSTM model, which uses three key vectors containing numerical sequences.At each time step t − 1, the LSTM unit internally generates two vectors: the cell state c and the hidden state h. These vectors are then passed forward as inputs to the next step t, where the unit also receives an external input vector x. The LSTM architecture enables the model to update its long-term memory (cell state) by integrating both the short-term memory (hidden state) and the new input vector. This process is administered by the forget gate, which determines whether to retain or discard previous information. A gate output of 1 indicates retention, while 0 indicates that the previous information should be discarded. One of the significant advantages of LSTM is its ability to retain information over longer sequences, making it particularly effective in addressing vanishing gradient problems. Furthermore, extending the LSTM model by adding a second hidden layer transforms the architecture into a deep learning model, as illustrated in Figure 1, thereby enhancing its learning capacity and predictive performance.

LSTM architecture.
This architecture is explained in the following Equation 3 shows the structure of the neural network:

Where o(y) is the output predicted through the weights (w) of input variables (s). After identifying the input layer, weights are adjusted based on the prediction accuracy.
Initially, the data is divided into training and test datasets. The model is trained on a training dataset, and then the trained model is used to test on unseen test datasets. When the network model is trained, an activation function called the hyperbolic tangent (tanh) function is deployed to transform the network weights according to output variables used for prediction. The tanh function is 0 centered and ranges between −1 and +1 using the “e” exponent. Equation 4 shows the tanh activation function below:

We normalized our data using the MinMax Scaler or normalization technique for better model performance, as shown in Equation 5.

To scale the data, we subtract the minimum value of each variable from all observations and divide it by the range of that variable. After scaling, our data ranges between 0 and 1, which is required for the activation function, that is, the hyperbolic tangent (tanh) function shown in Equation 4.
The model accuracy is defined with the help of mean squared error (MSE), sometimes referred to as the cost function. This is shown in the following Equation 6.

Where

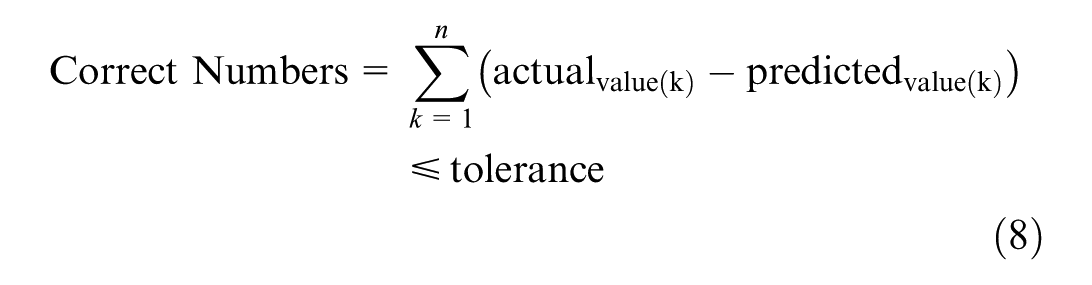
We calculated the percentage of correct predictions by calculating the difference between actual and predicted stock returns, and then we compared it with the tolerance level in Equation 8; the sum of all calculations is then divided by the total number of actual values. We used a tolerance level of 0.005 for our study.
Descriptive Statistics
Table 1 presents descriptive statistics of stock returns, news sentiment, and other financial variables. Stock return is the performance variable having a mean of −0.04. A negative mean indicates that most firms have negative stock returns for the selected period. One of the primary reasons for this negative mean in stock returns is the political instability in Pakistan. In 2011, Pakistan faced substantial financial issues because the government struggled to deal with many problems, including terrorism, corruption, and economic instability. Stock returns display extreme values, such as a minimum of −23.06, caused by crises such as the COVID-19 outbreak in Pakistan.
Descriptive Statistics.

Note. Rs is Rupees for the local currency of Pakistan.
News Sentiment has a negative mean value, which suggests that the majority of news has a negative sentiment. Among the other financial variables, the mean value of the trading volume and total assets in Pak Rupee are 1,595,276.96 shares and 58,837,964.80 Rupees, respectively. In addition, the mean value of the price-to-earnings ratio is 13.44%, ranging from 1.20% to 144.8%. The market-to-book ratio has a mean value of 2.07%, ranging from 25.03% to −16.47%.
Figure 2a and b present the graphical presentation of stock returns and news sentiment from 2010 to 2020. Figure 2a shows a considerable decline in return between 2010 and 2012 due to the financial crisis. Further, we observed a spike in returns in 2018 and a downward trend in the COVID-19 phase. Further, Figure 2b depicts a considerable decline in news sentiment from 2010 to 2012, the same as the decline in stock returns due to the political crisis in Pakistan.
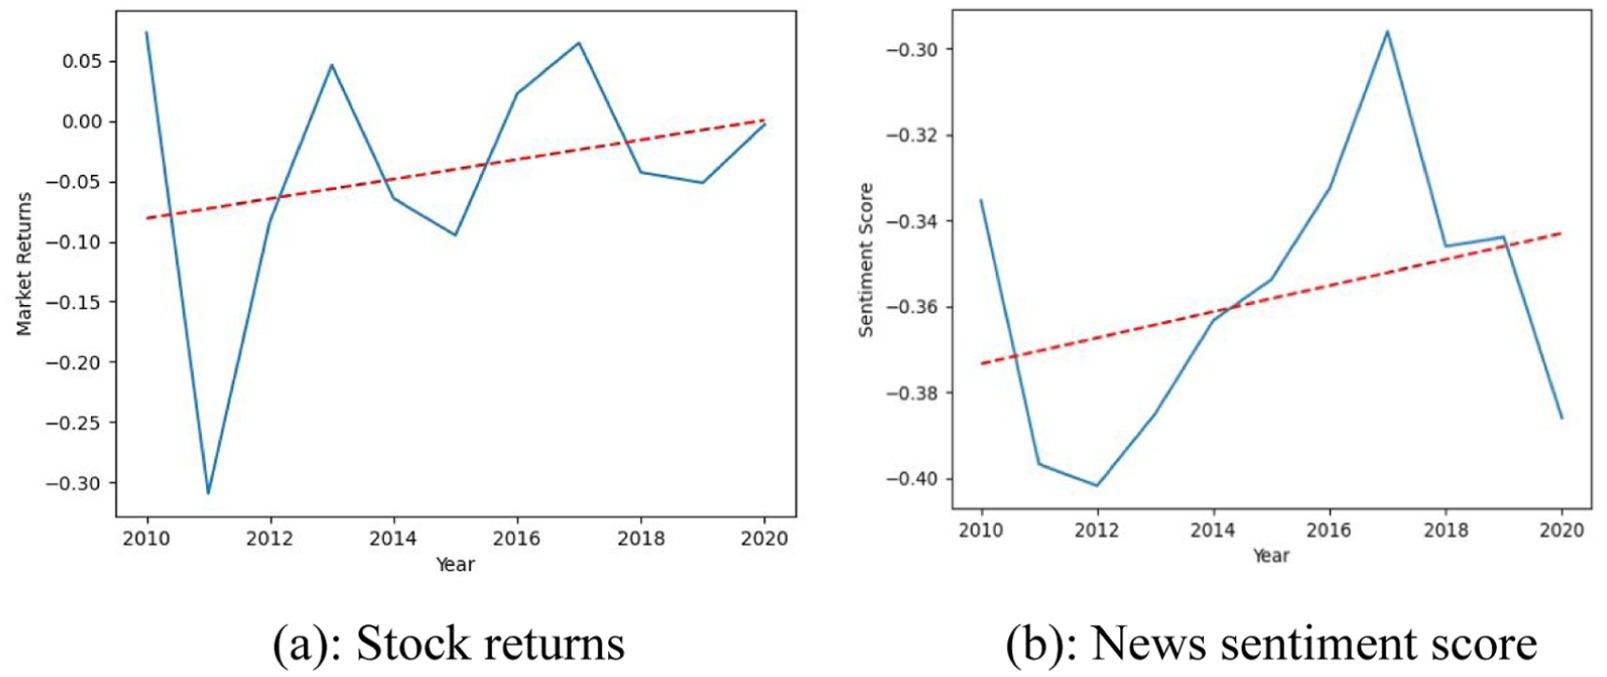
(a) Stock returns. (b) News sentiment score.
Similarly, we plot positive and negative news separately in Figure 3a and b, showing a similar pattern in negative sentiment. The overall negative news score is observed to be greater than the positive score.

(a) Positive news. (b) Negative news.
Table 2 presents the Variance Inflation Factor (VIF) and correlation matrix to observe the multicollinearity problem in the data. The VIF is applied to detect the presence of a collinearity problem in the data (García et al., 2015; Miles, 2014). The value of VIF 1 shows no multicollinearity, between 1 and 5 demonstrates moderate correlation, but is typically acceptable. However, VIF > 5 is considered a high multicollinearity problem within independent variables. According to O’Brien (2007), when VIF reaches these threshold values, researchers often attempt to reduce the collinearity by eliminating one or more variables from their analysis. In our case, our variables range between 1 and 2.29, which is acceptable for all variables for further analysis (Chehimi et al., 2024; Hashem et al., 2022).
Correlation Matrix.

Though for VIF, researchers have multiple arguments related to the effectiveness of finding the multicollinearity problem in the data. To validate our results of multicollinearity, we use the correlation matrix of all independent variables. There are two objectives in the correlation matrix: (a) the relationship between the dependent and independent variables, and (b) finding the multicollinearity between independent variables. We find that the news sentiment and stock returns are positively correlated. However, the magnitude of the relationship is low. On the other hand, the volume of shares traded has a higher magnitude with stock returns than any other variable. Further, we found that the independent variables are not highly correlated with very low magnitude, which shows no multicollinearity between our independent variables.
Empirical Results
Prediction of Stock Returns for the Same Day
Machine learning models, particularly neural networks, are developed through an iterative process in which the number of neurons and hidden layers is systematically increased or decreased to optimize predictive accuracy. This trial-and-error approach allows researchers to identify the most effective architecture for minimizing errors and enhancing model performance.
Table 3 presents the predictive performance of the LSTM neural network model, structured across three panels based on the number of hidden layers and neurons. Panel 1 includes models with a single hidden layer and neuron counts ranging from 3 to 10. The results demonstrate that increasing the number of neurons enhances model accuracy to a certain point, specifically, up to seven neurons. Beyond this, additional neurons result in diminishing predictive accuracy. The best performance in Panel 1 is observed in Model 3, which incorporates seven neurons and yields the lowest Mean Squared Error (MSE) of 0.00369 and the highest prediction accuracy of 64.76%. Model 4, with 10 neurons, follows closely with an MSE of 0.00376 and an accuracy of 64.23%.
Predictive Accuracy of LSTM on Same-Day Stock Returns.

In panel 2, we used two hidden layers, starting from five neurons in the first layer and three neurons in the second layer, and then we gradually increased the number of neurons in each layer to 12 neurons in the first layer and 7 neurons in the second layer. In panel 2, we got the best results in model 7, with nine neurons in the first layer and five neurons in the second layer, with an MSE of 0.00333 and 68.64% of correct predictions.
In panel 3, we used three hidden layers. In model 9, we used five neurons in the first layer, three neurons in the second, and then two neurons in the third layer. We observed that when we increased the neurons in the hidden layers, the accuracy decreased.
Table 3 demonstrates that the optimal predictive performance is achieved with a neural network architecture comprising two hidden layers—nine neurons in the first layer and five in the second. This configuration yields the highest correct prediction rate of 68.64% and the lowest Mean Squared Error (MSE) of 0.0033. However, increasing the number of hidden layers beyond this point results in a decline in model performance.
For robust analysis, we estimate a Support Vector Machine (SVM) to compare the accuracy of the LSTM model. The SVM is used for classification problems. Therefore, we classify the stock returns into two classes (0, 1). We considered the mean value as a benchmark where values >= to the mean are given 1, and values below it are allocated 0 value. This provided us with relatively balanced values of 45,110 for category 1, and 53,042 values for category 0. Table 4 of the confusion matrix shows the results of SVM.
Predictive Accuracy of SVM on Stock Returns.
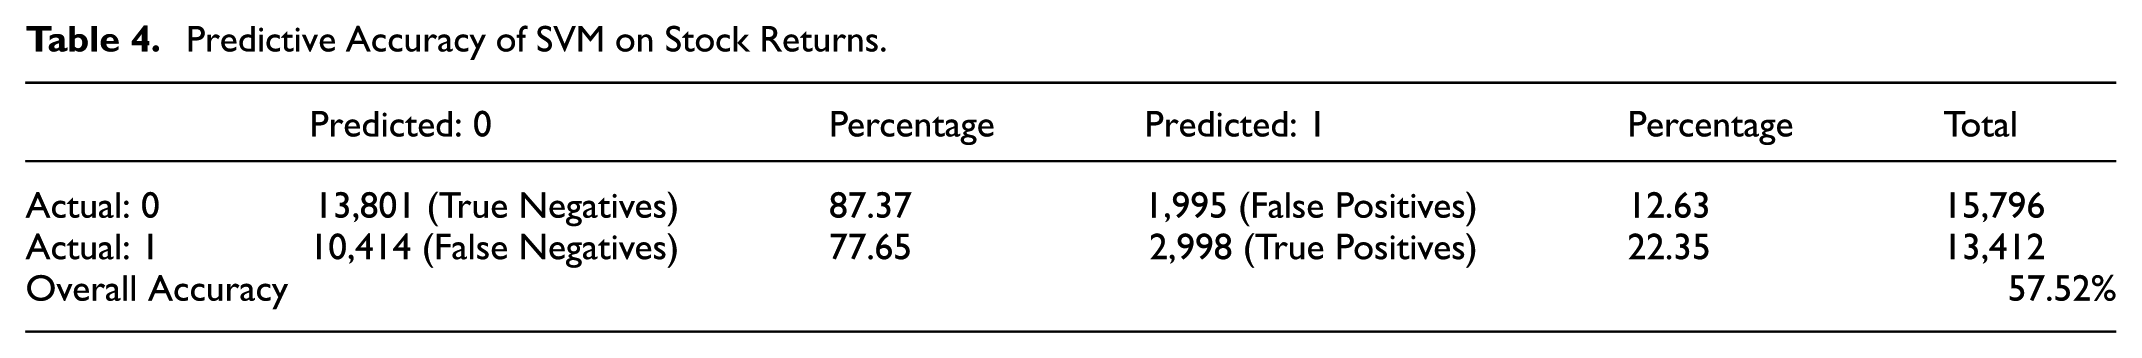
The SVM model performs well in predicting class 0, with 13,801 correct predictions and only 1,995 misclassifications. However, it struggles with class 1, correctly predicting just 2,998 cases while misclassifying 10,414 as class 0. This results in high specificity (87.4%) but very low recall for class 1 (22.3%), indicating the model is biased toward the majority class. Although the overall accuracy is 57.5%, which is also misleading. If we make a comparison with the LSTM model, the accuracy is relatively high compared to the SVM model. For example, the highest accuracy of panel 2, model 3 of LSTM is 68.64%, which is far better than the SVM model with 57.5%. This shows that LSTM models are more accurate compared to the SVM model.
Prediction of Stock Returns for the Next Day
To observe the impact of news sentiment on the next day’s stock return, we take all the variables with a 1-day lag. We follow a similar methodology to the LSTM estimated adopted in contemporaneous data, using three panels of data from one hidden layer to three hidden layers with different numbers of neurons. Table 5 presents the results of the LSTM.
Predictive Accuracy of LSTM on Next-Day Stock Returns.
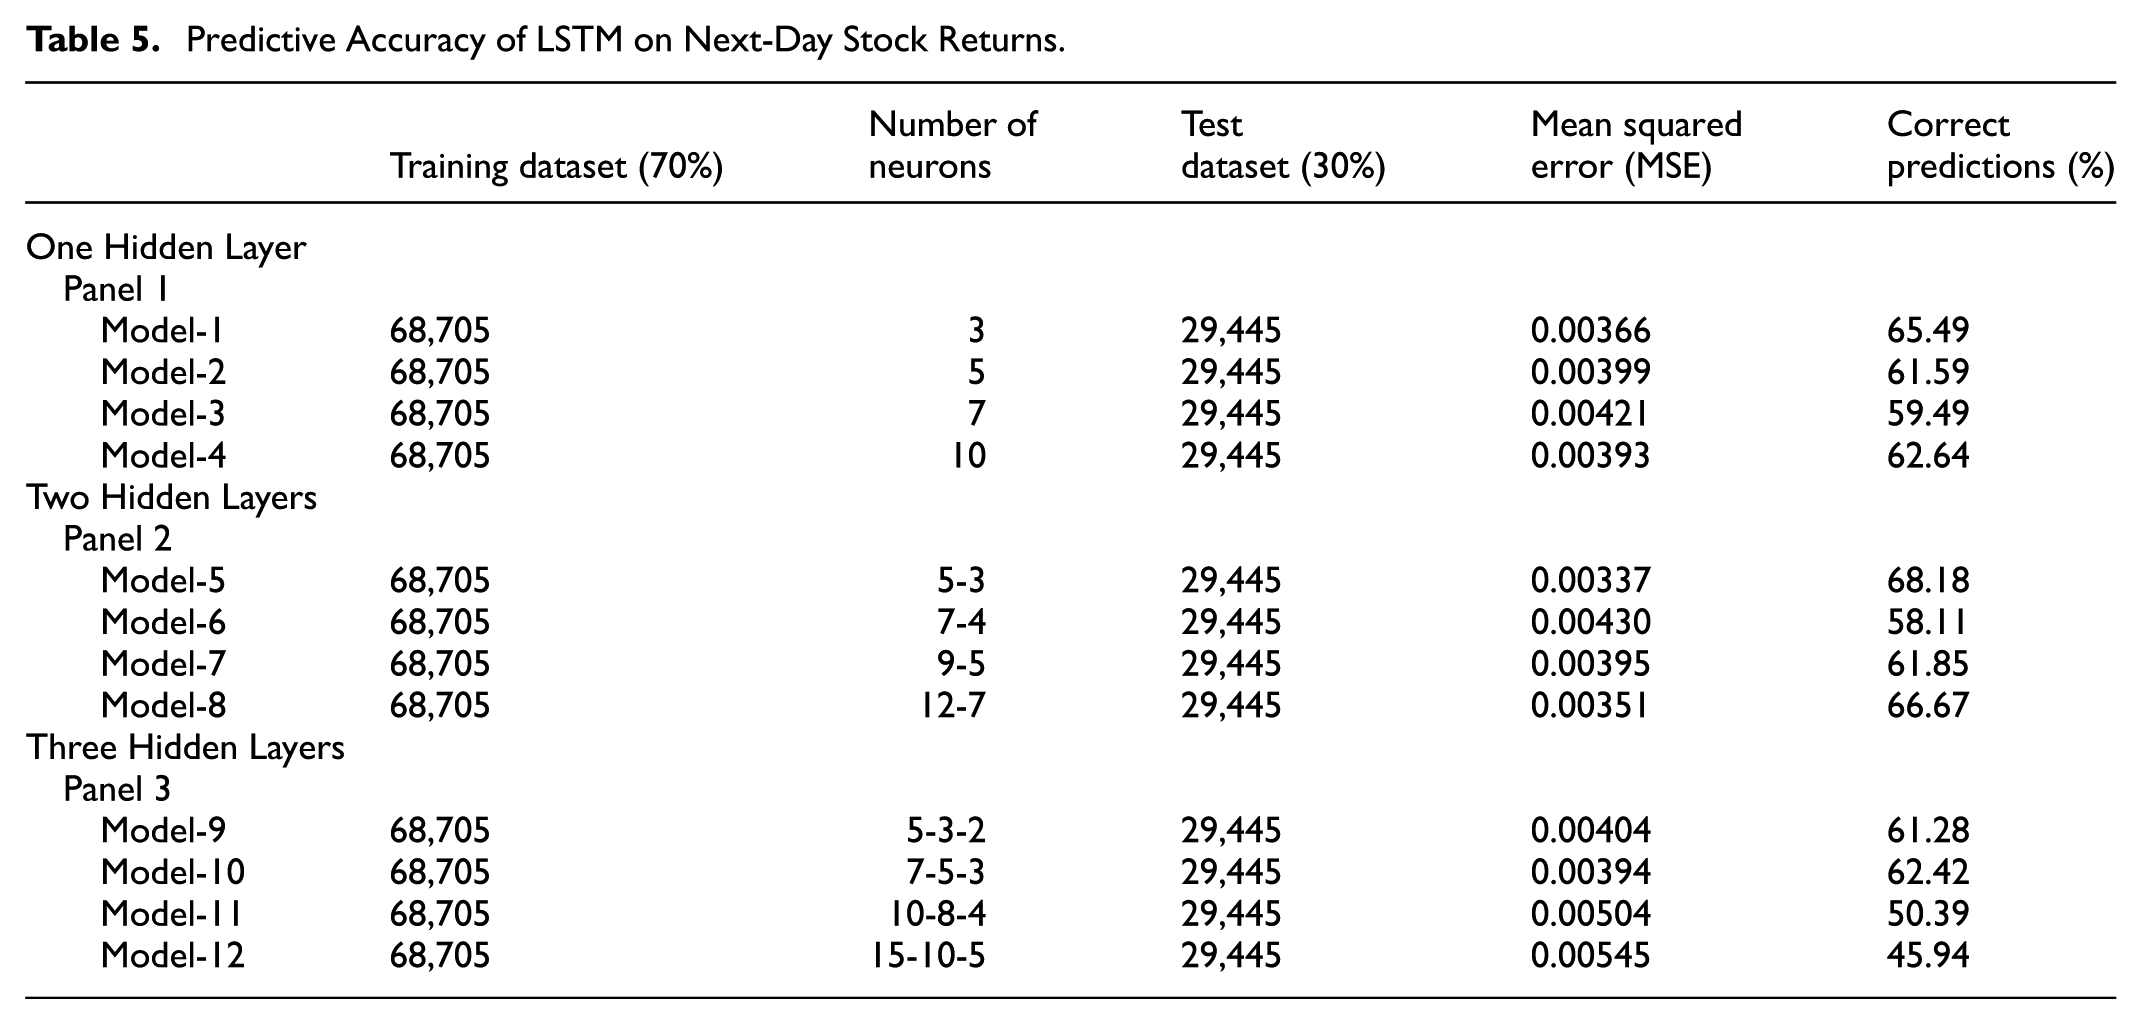
The best prediction results are achieved using two hidden layers in model 5. The first hidden layer has five and three neurons, in the next layer. Using this model, we got the correct prediction of 68.18% and an MSE of 0.00337. Similar to current-day prediction, the lowest results were found in model 12 with three hidden layers, with 15 neurons in the first, 10 in the second, and 5 in the third layer. Overall, we got the best number of the highest correct predictions in model 6 using two hidden layers in panel 2. Therefore, our results suggest that the lower the complexity of the model, the better the prediction results (Iqbal, 2020).
Similar to the contemporaneous model of SVM, we also estimated an SVM model for the lag values of inputs to predict stock returns.
Table 6 of the confusion matrix shows that the SVM model performs well in predicting class 0, with 13,427 correct predictions and only 2,514 misclassifications. However, it misclassifies with class 1, correctly predicting just 3,317 cases while misclassifying 10,200 as class 0. This results in high specificity (75.46%) but very low recall for class 1 (24.54%), indicating the model is biased toward the majority class. Although the overall accuracy is 56.84%, which is misleading and even less than contemporaneous stock returns. If we make a comparison with the LSTM model accuracy, SVM still has low accuracy. For example, the highest accuracy of panel 2, model 1 of LSTM is 68.18%, which is far better than the SVM model with 56.84%. This shows that LSTM models are more accurate compared to the SVM model.
Predictive Accuracy of SVM on Next-Day Stock Returns.

Relative Importance of Variables in LSTM Models
The machine learning models are considered “Black Box” because they do not provide the contribution of each variable in predicting the output variable. Therefore, we identify the importance of each variable in our selected models with the highest predictive accuracy.
Table 3 demonstrates that Model 7 has the highest accuracy and the lowest Mean Squared Error (MSE). The relative importance of each input variable is presented in Table 7.
Relative Importance of Variables on Same-Day Prediction.

Table 7 presents the results of variable importance in predicting stock returns, revealing that trading volume holds the most significant predictive power with a relative importance score of 0.5067, accounting for 50.98% of the total contribution. News sentiment emerges as the second most influential variable, contributing 16.20% with a score of 0.1623. In contrast, the market-to-book ratio demonstrates the least influence on stock return prediction, with the lowest importance score of 0.0710.
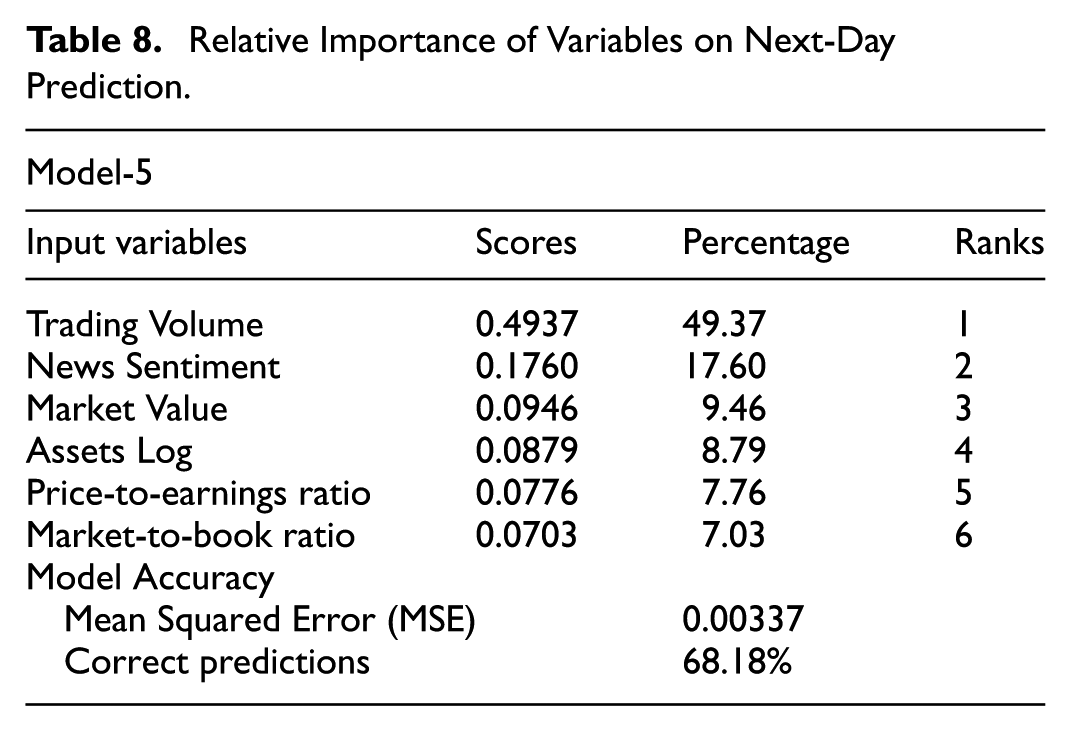
Likewise, Table 8 presents the relative importance of Model 5, which has the highest predictive accuracy in predicting next-day stock returns. The findings show consistent patterns, with trading volume maintaining its leading role at 49.37% (score = 0.4937). Particularly, the contribution of news sentiment increases to 17.60% (score = 0.1760), emphasizing its significance in stock return prediction. These results underscore that trading volume and news sentiment are the most important predictors, consistently exhibiting the highest relative importance in both current and next-day stock return predictions.
Relative Importance of Variables on Next-Day Prediction.
Results Discussion
The stock market is a key component of the financial system in a country’s economy (W. Gu et al., 2024). It serves as a channel through which publicly traded firms secure financial resources, provides funds for various research and development projects that contribute to the economic growth of a country. On the other hand, predicting stock returns is challenging due to the influence of numerous unpredictable factors such as economic conditions, firm performance, global events, and investor sentiment (Fama, 1970). While issues like data noise, overfitting, and model complexity limit models’ reliability (S. Gu et al., 2020). According to the Efficient Market Hypothesis, stock prices already reflect all available information, which makes it difficult for investors to achieve higher returns from the market (Malkiel, 2003).
For a more accurate prediction of stock returns, this study uses a sentiment index derived from business news articles from leading newspapers in Pakistan. The data set consists of firm-level financial variables and a sentiment index developed through online news articles from leading newspapers, covering the daily data from September 2010 to December 2020. Using the LSTM approach, we incorporate news Sentiment with financial variables to predict the impact of current (future) stock returns.
We performed two types of analysis: (a) analysis using contemporaneous data to observe the impact of news sentiment on stock returns, and (b) lagged values of news sentiment to predict the future value (t + 1) of stock returns. For robust analysis, this study explores the efficacy of the LSTM and compares the results with conventional SVM machine learning models predictive accuracy. The results are consistent with prior literature, which suggests that the LSTM models outperform the SVM-based models for stock returns predictions (Karmiani et al., 2019; Nayak et al., 2024).
However, the problems with machine learning models are that they do not provide the contribution of each input variable for predicting the output variable (Le & Viviani, 2018; Mount et al., 2013; Olden & Jackson, 2002; Tzeng & Ma, 2005). We use a variable importance approach to identify the contribution of each input variable in predicting stock returns. Our findings underscore the prominence of news articles as the second most influential variable, indicating their significance as a predictor of stock market returns. Hence, our findings indicate a substantive impact of the news sentiment on stock returns. Our results are consistent with Anese et al. (2023) that publicly available news is informative and can explain short-lived movements of stock returns. The results are also consistent with the banking sector, that sentiment derived from text documents is an important predictor of firm performance (Iqbal et al., 2023).
For other traditional variables, volume of trading was the highest predictor of stock return. The prior literature provides some mixed results due to different markets and stock indexes used for analysis. For example, Chordia and Swaminathan (2000) stated that trading volume is a significant determinant of stock returns. Contrary to the predictions of some theoretical models, Lee and Rui (2000) state that trading volume does not impact the stock market returns of Chinese markets. A similar view is also found by S. S. Chen (2012) that the prediction of stock returns through volume of trade is weaker.
Our findings indicate that firm size and the price-to-earnings ratio are significant predictors of stock returns, as reflected by their high variable contribution to the LSTM model. This aligns with the early work of Basu (1977), who was among the first to explore the relationship between stock performance and price-to-earnings ratio. Similarly, the forward price-to-earnings ratio offers a stronger predictor of future growth than the traditional trailing price-to-earnings ratio (Gambarelli & Muzzioli, 2025; Wu, 2014). In the context of the Pakistan Stock Exchange (formerly Karachi Stock Exchange), Arslan and Zaman (2014) also found that firm size, measured by total assets, and price-to-earnings ratio significantly affect stock returns. Al-Mwalla et al. (2010) found a long-run relationship between stock price movements, firm size, and price-to-earnings ratio, which can be used to achieve abnormal returns. In addition, Ong et al. (2010) demonstrated the usefulness of the price-to-earnings ratio as a tool for gaining insights into overall stock market movement.
In our analysis, the market-to-book ratio received the lowest scoring predictor among others. Our result contrasts with several earlier studies that highlight the market-to-book ratio as a significant predictor of stock returns. For instance, prior research suggests that this ratio contains valuable information about future returns that is not captured by other financial variables (Atilgan et al., 2021; Pontiff & Schall, 1998). Specifically, it is effective in predicting 1-year returns across many emerging market economies. The divergence in our results may be attributed to differences in market structure, industry-specific periods, or data characteristics (Aras & Yilmaz, 2008). These factors could influence the predictive relevance of the market-to-book ratio in our context, underscoring the need to consider local market dynamics when evaluating financial indicators.
These results provided empirical evidence to support our hypotheses that, along with traditional financial indicators, news sentiment extracted from daily newspapers impacts stock returns. Further, the stock returns can be predicted for the next day with the help of news sentiment derived from news articles published in daily newspapers. Collectively, these studies reinforce our results and support the relevance of firm-specific fundamentals in stock return prediction, along with the sentiment index as a full set of information. In summary, a variable importance analysis reveals that news sentiment derived from business news articles is an important predictor and highlights the value of incorporating textual information in news articles into predictive models.
This approach provides an understanding of market behavior and offers practical implications for stakeholders seeking data-driven investment strategies in emerging markets like Pakistan. For example, Investors can enhance their decision-making by incorporating textual information from business news alongside traditional financial indicators, especially under dynamic market conditions. For regulators and policymakers, the findings suggest that a multi-industry approach may not adequately capture the unique characteristics of the manufacturing sector. Instead, sector-specific analysis using textual information in news articles can provide deeper insights into market dynamics, risk patterns, policy effectiveness, and early warning signals. This can help regulators and policymakers better anticipate and respond to economic volatility and design more targeted regulatory measures.
For researchers, this study opens new avenues by demonstrating the potential of ensemble-based advanced machine learning techniques with both textual and financial data to predict stock market behavior. This approach marks a shift from traditional fundamental indicators and offers broader applications across other domains.
Theoretically, the study bridges efficient market hypothesis, prospect theory, and appraisal theory to explain how investors process and act on a full set of information that includes textual and financial data. While EMH assumes market participants use available information efficiently, prospect theory emphasizes cognitive biases in decision-making through framing information for investment decisions. Appraisal theory adds an emotional dimension, explaining how investors convert textual information into sentiment. Together, this framework highlights the importance of sentiment in understanding and predicting stock returns.
Conclusion
Investors traditionally rely on fundamental and technical indicators derived from financial data to predict stock price movements. However, in a volatile and information-rich environment, accurately predicting stock returns remains a significant challenge for investors and regulators. This study addresses this gap by incorporating sentiment extracted from business news articles alongside firm-level financial data to enhance stock return prediction. Specifically, we collected daily news articles from prominent English-language newspapers, including The News, Dawn, and The Express Tribune, and analyzed daily stock returns of the top 25 manufacturing firms listed on the Pakistan Stock Exchange (PSX 100 Index), covering daily data of 98,750 observations from September 2010 to December 2020
Employing LSTM, we developed several predictive models to forecast both current and next-day stock returns. The models with two hidden layers demonstrated superior performance in terms of predictive accuracy. Given the black-box nature of machine learning algorithms, we further employed a relative importance technique to identify the contribution of each input variable to predicting stock returns. The findings reveal that news sentiment is among the influential predictors of stock returns, underscoring the impact on investor behavior and market movements.
This study offers practical insights for investors, regulators, and researchers. Investors can improve decision-making by incorporating business news sentiment alongside traditional financial indicators, particularly in volatile markets. For regulators, the findings highlight that a broad multi-industry approach may overlook the unique dynamics of the manufacturing sector. Sector-specific analysis using textual data can provide valuable insights into market behavior, risk, and policy outcomes, aiding in more precise regulatory actions.
While our findings offer valuable insights, it is important to consider potential limitations related to unobserved factors, which are inherent in studies of this nature. Moreover, in this study, the news coverage is limited to the Pakistani newspapers, which may not fully represent the broader informational landscape. Further, the selection of only the top 25 manufacturing firms listed in the PSX 100 index of Pakistan may have limited the generalizability of the study.
The study provides further avenues for future research, including broadening the scope by including other countries’ firms on a larger scale and respective country business news articles. This will help the generalization of results on a larger scale. Further, researchers can develop ensemble-based models that combine the predictions of multiple individual models to produce a final output that is typically more accurate, robust, and generalizable than any single model alone.
Footnotes
Ethical Considerations
This article is not based on any studies with human participants or animals performed by any authors.
Author Contributions
Javid Iqbal: Conceptualization of idea, methodology selection, software, data collection, text preprocessing for sentiment construction, analysis, and results. Hind Alnafisah: Funds provision, supervision, reviewing of the paper. Hammad Akber: Finding relevant literature, data collection, text preprocessing for sentiment construction. Muhammad Safdar Sial: Overview the the paper, supervision, editing and finalizing of paper.
Funding
The authors disclosed receipt of the following financial support for the research, authorship, and/or publication of this article: Funding of the study is supported by Princess Nourah bint Abdulrahman University Researchers Supporting Project number (PNURSP2026R549), Princess Nourah bint Abdulrahman University, Riyadh, Saudi Arabia.
Declaration of Conflicting Interests
The authors declared no potential conflicts of interest with respect to the research, authorship, and/or publication of this article.
Declaration of AI
The writeup, methodology, and results are performed by the authors. Authors have not used AI and AI-assisted technologies in the above-mentioned processes in this article.
Data Availability Statement
Data will be available on request.