
Abstract
We examine the cross-sectional seasonality of stock excess returns in China. We find that stocks’ historical excess returns are positively related to their future excess returns under a congruent-mood period and negatively associated with their future excess returns under a noncongruent-mood period. Besides, stocks with larger mood beta tend to outperform during mood periods, and this impact is still significant after differentiating companies. Moreover, consistent with our hypotheses, mood beta has stronger explanatory power after China’s unique Split-Share Structure Reform and RMB Exchange Rate Reform. Finally, mood beta has stronger explanatory power compared to sentiment beta during ascending and descending mood months.
Introduction
Previous research has found cross-sectional seasonality of stock returns and pointed out that some stocks would outperform others during certain calendar months (Heston & Sadka, 2008, 2010; Hirshleifer et al., 2016, 2020). Following Hirshleifer et al. (2020), in this paper, we relate mood beta to stock return fluctuations in China under congruent-mood and noncongruent-mood periods. We construct mood beta and test the following empirical implications: Does mood recurrence and reversal effects exist in China? Is mood beta a strong predictor of China’s A-shares excess returns when ascending or descending mood is anticipated? Does the Split-Share Structure Reform or RMB Exchange Rate Reform have an impact on the mood beta effect? What’s more, which is the better predictor of future stock excess returns across high and low mood periods, mood beta, or sentiment beta?
We make a brief literature review on investor sentiment and stock return seasonality. In highly uncertain circumstances, mood plays a major role in forming evaluations. Previous studies focusing on sentiment yield mixed results, see Lee et al. (1991), Chen et al. (1993), Swaminathan (1996), Elton et al. (1998), and Neal and Wheatley (1998). Subsequent researches confirm that swings in investor sentiment could affect asset prices, and such studies mainly focus on the U.S. and other developed markets (Baker & Stein, 2004; Baker et al., 2012; Baker & Wurgler, 2006, 2007; Brown & Cliff, 2004, 2005; Huang et al., 2015; Schmeling, 2009). They relate sentiment levels to stock price deviations and find positive results. Market investor sentiment affects the cross-section of asset returns can be found in Lemmon and Portniaguina (2006), Qiu and Welch (2004), Kumar and Lee (2006), Frazzini and Lamont (2008), Li and Yeh (2011), Stambaugh et al. (2012), Ben-Rephael et al. (2012), and Da et al. (2015), among many others. There are also a large number of studies have documented that the Chinese stock market is also significantly affected by sentiment. Kling and Gao (2008), Arquette et al. (2008), Chi et al. (2012), Han and Li (2017), and Li and Ran (2020) employ different investor sentiment indices and confirm that high sentiment stocks earn high average returns compared with low sentiment stocks. The market’s sentiment could affect investors’ optimistic or pessimistic attitude toward the future and has a great impact on stock returns.
The above studies focus on the market’s overall sentiment and ignore the seasonality in the cross-section of stock returns. Since the seasonality effect is widely existing in the worldwide stock market, recent studies have also identified seasonality in the cross-section of stock returns. Heston and Sadka (2008, 2010), Keloharju et al. (2016), Birru (2018), Chiah and Zhong (2019, 2021), and Hirshleifer et al. (2020) all point out that some stocks outperform others in the same calendar month, on the same day of the week, or during certain periods. Other literature finds similar results and confirms the existence of stock return seasonality, such as January is associated with the uplifted mood of the New Year period (Bergsma & Jiang, 2016; Thaler, 1987), March is associated with the highest recovery from seasonal affective disorder (SAD), and both September and October are related with the highest onset of the SAD effect (Kamstra et al., 2017). Building on the previous examples, studies related to China also find month seasonality (Wen et al., 2021) and weekday seasonality (Ali & Ülkü, 2020) of stock returns.
The Chinese stock market provides a good setting to examine the investor mood effect on stock returns. As the largest market in Asia, it contains a large proportion of retail investors compared to other developed markets. Retail investors are more inclined to the mood swings and thus the Chinese stock market is more suitable for exploring mood the seasonal effects of investor mood. China’s major holidays are quite different from western countries. For example, the Chinese New Year (usually in February), Labor Day holiday (in May), and National Day Holiday (in October) are relatively longer public holidays. During these holidays, government offices and banks are shut, some businesses, such as malls, restaurants, and hotels will open as usual, or even stay open longer. The arrival of the new year or the public holidays could boost morale. Travel activity is anticipated to peak in these holidays, hence Labor Day Holiday and National Day Holiday are also known as China’s “Golden Weeks”. We anticipate that these holidays could greatly affect investors’ anticipation about the economic development and thus influence their stock expectations. As such, this paper explores the cross-sectional seasonality of stock excess returns in China.
The first innovation of this paper is to introduce the mood beta proposed by Hirshleifer et al. (2020) to verify whether it is a strong predictor of stock excess returns in China when ascending or descending mood is anticipated. To test for such effects, we use monthly and weekly stocks’ historical excess returns in the past high or low mood periods to forecast returns in future prespecified high mood periods. We also test the correlation to support our conjecture by identifying mood swings in the past using realized average stock returns. Since the Shanghai Stock Exchange and the Shenzhen Stock Exchange were established in 1990 and 1991, respectively, our sample includes monthly and weekly data from 1991 to 2020. We examine samples starting from 1991 and 2000 to 2020, unlike Wen et al. (2021), because the Chinese stock market is not fully developed in the first several years. We test whether the empirical result and the predictive ability of mood beta would be affected by different sample periods.
The second innovation is that we track mood-induced mispricing by comparing portfolios formed on different firm characteristics. We investigate whether the role of mood beta generates a discernable distinction between companies that trade internationally and those that don’t, between state-owned enterprises (SOEs hereafter) and non-state-owned enterprises (non-SOEs hereafter). Further, we also exploit two far-reaching reforms of China’s capital market. One is the Split-Share Structure Reform and the other is the Renminbi (RMB hereafter) Exchange Rate Reform. Non-tradable shares were one of the most conspicuous characteristics of China’s capital market before the Split-Share Structure Reform. The conversion of non-tradable shares into tradable shares demonstrates the financial liberalization of China’s stock market. Before the Split-Share Structure Reform, there exist a large volume of non-tradable state-owned and legal person shares, and only about one-third of the shares of domestically listed companies float on the stock markets. On 29 April 2005, the Chinese government launched a Split-Share Structure Reform to convert non-tradable shares into tradable shares. This paper investigates whether the mood beta effect changes when tradeable shares increase after the reform was implemented. As to the RMB Exchange Rate Reform, China has moved into a managed floating exchange rate regime based on market supply and demand for a basket of currencies since July 2005. The underestimate of the RMB’s exchange rate has reduced as the RMB has grown more flexible. Hence, the effect of the Exchange Rate Reform on the mood beta effect is also considered in this paper.
Finally, we exploit the effect of mood beta and sentiment beta on the predictability of stocks’ future excess returns. We perform regressions using panel data to validate the roles of mood beta and sentiment beta with controls for market factors. It is a novel exercise, to our best knowledge, to apply both the principal component analysis (PCA hereafter) and the partial least squares (PLS hereafter) approaches to construct the sentiment beta and compare it with mood beta. We perform regressions to forecast future excess returns during high and low mood periods using mood beta in the presence of sentiment beta. We try to find out which one, mood beta or sentiment beta, is the better index to predict future stock excess returns across ascending and descending mood months.
Li and Ran (2020) find that investor sentiment plays a dominant role in predicting the A-shares market, and the PLS sentiment index outperforms the PCA index. For more information about the predictability of investor sentiment in the A-shares market, please refer to Li and Ran (2020). In this paper, when we examine the future stock excess returns during periods of ascending and descending moods, we draw the following conclusions. Firstly, for A-shares in China, stocks’ historical excess returns are positively associated with their future excess returns under a congruent-mood period and negatively related to their future excess returns under a noncongruent-mood period.
Secondly, stocks with higher mood betas tend to outperform over mood months and mood weeks. Besides, mood beta generates a discernable distinction between companies that are SOEs and companies that aren’t. Moreover, consistent with our hypotheses, mood beta has stronger explanatory power after the completion of China’s unique Split-Share Structure Reform and RMB Exchange Rate Reform. Last but not the least, mood beta has better predictive power than sentiment beta during high and low mood periods. Mood beta is positively related to the cross-section of future stock excess returns in ascending mood periods and negatively related to the excess returns in descending mood periods. Across high and low mood periods, the PCA and the PLS sentiment beta don’t play major roles in predicting the future excess returns.
The remainder of the paper is organized as follows. Section 2 describes the data and presents hypotheses development. Section 3 examines the mood recurrence and reversal effects in China. Section 4 explores the role of mood beta in predicting future stock excess returns. In Section 5, we run regressions to test the effect of mood beta and sentiment beta during high and low mood periods. Section 6 concludes.
Data and Hypotheses Development
Data Description
Since Shanghai Stock Exchange was established in December 1990 and Shenzhen Stock Exchange was launched in July 1991, our sample includes companies listed on the Shanghai and Shenzhen Stock Exchanges in China issuing A-shares from January 1991 to December 2020. Since the Chinese stock market is not fully developed in the first several years, we thus test samples starting from the years 1991 and 2000. Monthly and weekly stock and market returns are obtained from the CSMAR Database. Other firm characteristic variables are obtained from Wind Database. To characterize the overall performance of the market, we use the equal-weighted index of A-shares returns to construct the market returns (we also use a value-weighted index and obtain similar results). The market excess returns are defined as the difference between market returns and the risk-free rates. For A-shares in China, we choose the monthly and weekly rate of 1-year time deposit as the risk-free rate.
Hypotheses Development
Based on previous studies, we can infer that seasonality commonly exists in the cross-section of stock returns. As mentioned above, investor mood is changing through time and is improving or deteriorating during certain months in China. We hypothesize that these mood variations could cause seasonal stock mispricing, deriving from over-optimism or pessimism about the future caused by mood. As the month-of-the-year effect has been widely proven in previous work (Bouman & Jacobsen, 2002; Heston & Sadka, 2008, 2010; Hirshleifer et al., 2020; Kamstra et al., 2003, 2017; Lakonishok & Smidt, 1988), we assume that mood seasonality also exists in Chinese stock market. Besides, the mood beta proposed by Hirshleifer et al. (2020) measures the sensitivity of stock returns to mood. We can infer that stocks with greater mood sensitivity would earn higher or lower returns accordingly. We thus hypothesize and test the following ones:
State-owned companies (SOEs) used to go public and offer minority tradable shares to institutional and individual investors before the Split-Share Structure Reform. The Chinese government maintains control by holding the majority of non-tradable shares in these listed SOEs. Liao et al. (2014) point out the reforms effectively reduced technological and legal barriers to the sale of state-owned shares to public investors, paving the way for China’s secondary privatization. The market mechanism is more effective since the Split-Share Structure Reform was a landmark event and opened the gate to China’s financial liberalization. We could infer that the reform generates a market mechanism that matches the interests of the government and public investors through effective information discovery. We hypothesize that the mood beta effect would be more significant after the Split-Share Structure Reform.
RMB Exchange Rate Reform, on the other hand, is also an important part of China’s plan to deepen the economic system and strengthen the macroeconomic adjustment mechanism. The reform of the RMB exchange rate system could reduce the external trade deficit, raise domestic demand, enhance Chinese company competitiveness, and increase the level of economic opening up. After the reform, China establishes a managed floating exchange rate regime based on market supply and demand. We deduce that as the RMB becomes more flexible, the underestimation of the RMB’s exchange rate decreases, and that the mood beta effect will be more evident following the RMB Exchange Rate Reform. We thus propose the following hypotheses:
The impact of market investor sentiment on stock price deviations has been widely investigated. Li and Ran (2020) find that market investor sentiment plays a dominant role in predicting the A-shares market. We also point out the PLS sentiment index outperforms the PCA index when seasonality is ignored. The final goal of this paper is to compare the predictive power of market investor sentiment and mood beta during high and low mood periods. Since mood beta, which assesses stock’s sensitivity to mood, has been proved to effectively predict the cross-section of stock returns during mood periods. We infer that when ascending and descending mood periods are investigated, the explanatory ability of market investor sentiment would deteriorate and the mood beta would account for a majority of future excess returns. We test the following hypothesis:
We illustrate in detail how we test these hypotheses in the following sections.
Mood Recurrence and Reversal Effects
We examine whether the mood recurrence and reversal effects exist in the A-shares market in China in Fama-MacBeth regressions, we use prespecified and realized mood months as predictors. For prespecified months, high (low) mood months are defined as the top (bottom) 2 months that have the highest (lowest) average stock market excess return over our sample periods 1991 to 2020 and 2000 to 2020. Over the sample period from 1999 to 2020, the top two average market excess returns appear in May (6.28%) and February (5.87%), the bottom two are in June (−1.62%) and September (−0.35%), respectively, in A-shares market in China. High mood months emerge in February (6.32%) and March (3.71%) in the period 2000 to 2020, whereas low mood months show in June (−2.83%) and October (−1.18%). February, March, and May are the highest months, partly because the Chinese New Year and Labor Day holidays fall in those months. The start of a new year or the celebration of public holidays may enhance morale. We may expect these holidays to have a significant impact on investors’ future expectations. The “quarter effect of stock returns”, on the other hand, might be a major factor for A-share seasonal weakness in June and September. China has a long tradition of conducting quarterly assessments of financial institutions. Financial institutions typically have a high demand for funds at this critical time to meet regulatory obligations, leading to the phenomena of capital outflow of the stock market.
Thus, we use the above-defined months as our prespecified high and low mood months. In addition to the prespecified mood months, we also examine the recurrence and reversal effects based on the realized mood months. Using the top two and bottom 2 months, ranked by the equal-weighted market excess returns realized in each year, we then define realized high and low mood periods. We first test for the recurrence and reversal effect based on the above-defined mood months. We do not differentiate February from May or June from September as conducted by Hirshleifer et al. (2020). Instead, we use their average excess returns as proxies for the past high or low mood months, respectively. Table 1 reports the mean, standard deviation, and other information about our data.
Descriptive Statistics.

Note. This table reports the summary statistics of the main variables.
The Mood Recurrence Effect
We first examine the recurrence effect of prespecified high and low mood months in two subsamples. We regress the excess returns across stocks on their historical excess returns in the corresponding prespecified high or low mood months:

where
Mood Month Recurrence and Reversal Effects.

Note. This table provides the estimated results for the recurrence and reversal effects testing. Following equations (1)–(2), we regress high (low) mood month returns on their prespecified or realized high (low) mood month returns.
, **, and ***Stand for significance at the 10%, 5%, and 1% level.
Next, we examine the mood recurrence effect using the historical returns during realized high and low mood months in Fama-MacBeth regressions. We try to examine the conjecture across the congruent-mood months, even when we use realized average stock returns to detect mood changes in the past. We measure the realized high and low mood periods using the top and bottom 2 months, ranked by the equal-weighted market excess returns realized in each year. We regress the cross-section excess returns on the realized high and low mood months in year

where
The regression results of equations (1) and (2) are reported in Table 2. The reported Fama-MacBeth t-statistics are in parentheses and are corrected for heteroskedasticity and autocorrelation using Newey and West (1987). In Panel A, coefficients for lags 1, 2–5, and lags 6–10 in Column (1) are −1.58%, 5.12%, and 11.55%, respectively. Only the coefficient for lags 2–5 is significantly positive at the 5% level. The results suggest that the increase in prior 2 to 5 years prespecified mood months excess returns leads to an increase in the current prespecified congruent-mood months returns. A one-standard-deviation rise in past excess returns is linked with 3.07% (=5.12%*0.0845/0.1411) of a standard deviation in future excess returns during prespecified mood months for lags 2–5. Results in Column (1), in general, confirm the existence of the mood recurrence effect across the prespecified congruent-mood months for year lags 2–5. In Panel B, results in Column (1) report the regression results when excess returns are obtained during the sample period 2000–2020. We obtain significantly positive coefficients for lag 1 and lags 2–5 at the 5% level. The results imply that the historical prespecified excess returns lead to an increase in each future congruent-mood month. In Column (2) of Panel A and Panel B, the average return response for lags 2–5 in the subsample 2000–2020 is 6.85%, implying that a rise in the historical realized mood months leads to an increase in the subsequent 5 years returns as measured by
The Mood Reversal Effect
We first test for the reversal effect of prespecified high and low mood months. In Fama-MacBeth regressions, the independent variables are flipped compared to that in equation (1). For example, when forecasting future high mood month excess returns, we use the historical low mood month excess returns as the independent variables. We regress the excess returns across stocks on their historical excess returns in the prespecified noncongruent-mood months:

Next, we examine the mood reversal effect using the historical returns during the realized high and low mood periods. We flip the independent variables compared to that in equation (2). We regress the cross-section excess returns on the realized high and low mood month returns in year

Results for testing the mood reversal effect are reported in Columns (3) and (4) in Table 2. In Column (3), the coefficients are negative for all three sets of lags in two subsamples. The coefficient of
Mood Beta to Predict Cross Section of Returns.
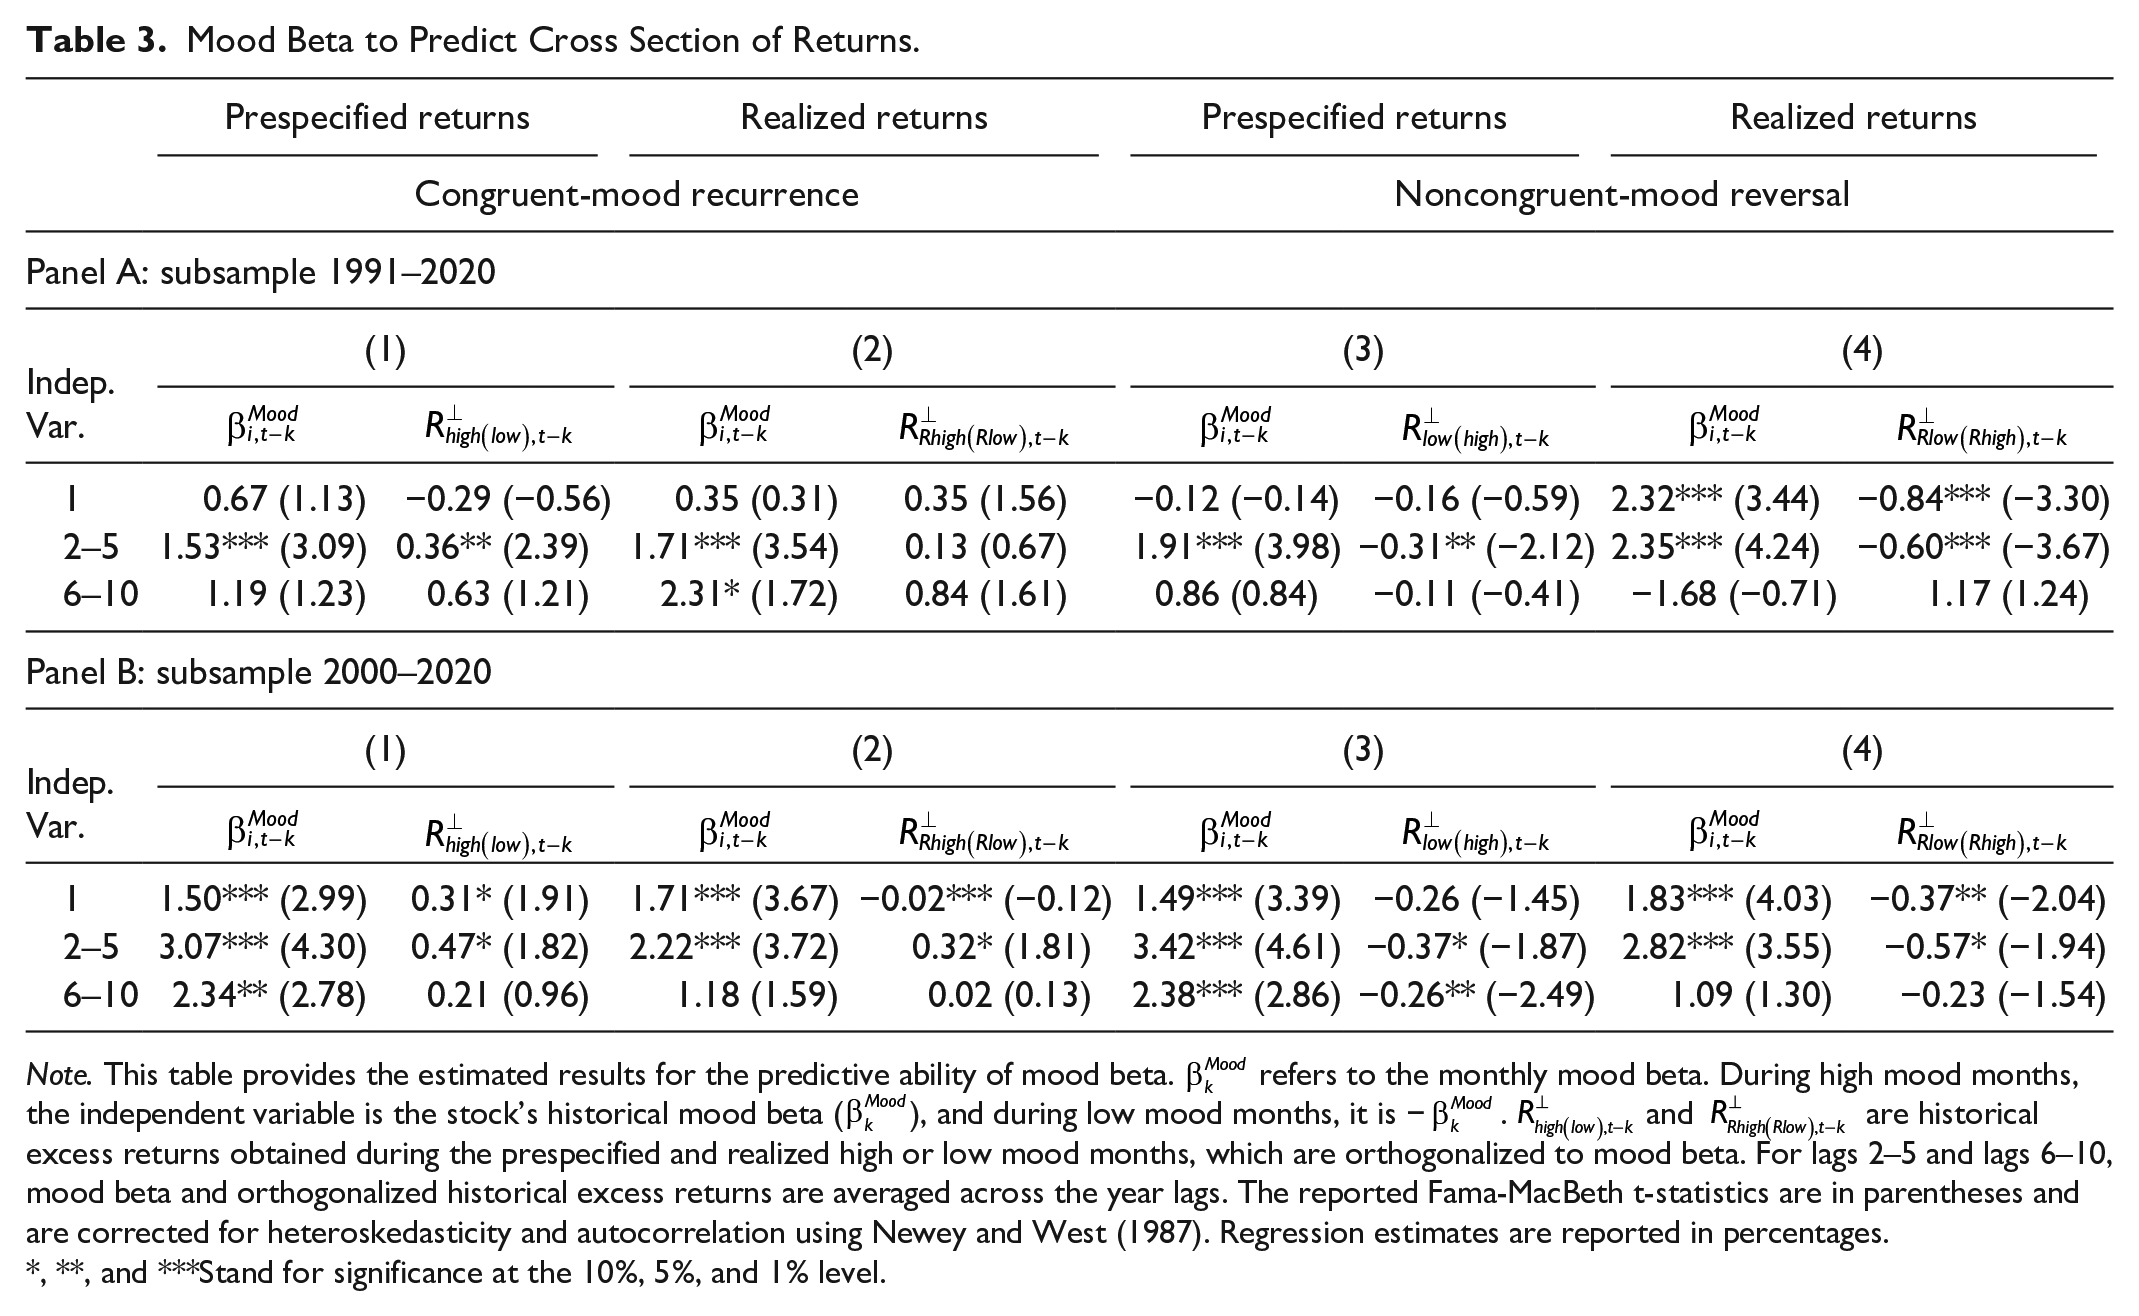
Note. This table provides the estimated results for the predictive ability of mood beta.
, **, and ***Stand for significance at the 10%, 5%, and 1% level.
To sum up, findings in Table 2 confirm the existence of significant congruent-mood recurrence and noncongruent-mood reversal effects at a monthly frequency for A-shares in China (Hypothesis 1), at least for the following 5 years. The results are robust whether prespecified or realized mood months are adopted in the regressions. The above evidence indicates that relative performance across different stocks is likely to recur for months with congruent mood and reverse for months with noncongruent mood.
Mood Beta Effect
Monthly Mood Beta
The construction of mood beta follows Hirshleifer et al. (2020): we run Fama-MacBeth regressions of each stock’s excess return on the contemporaneous equal-weighted market excess returns. Excess return for the individual stock is obtained during prespecified and realized high and low mood months defined above. We then use a window of size 40 as the rolling window to obtain our monthly mood beta for the individual stock. Mood beta represents a stock’s return sensitivity to the corresponding equal-weighted market excess returns across the past ascending and descending mood periods.

Monthly Mood Beta Effect
We first examine the role of mood beta in predicting the future performance of the individual stock. We hypothesize that stocks with high mood beta will do better in future ascending mood months and do worse in descending mood months. Thus, we run Fama-MacBeth regressions of excess returns of each stock on its corresponding mood beta during the prespecified (realized) high or low mood months. Estimations for lag 1, lags 2–5, and lags 6–10 are reported in Table 3. We also orthogonalize the historical excess returns on the corresponding mood beta and use the orthogonalized proxy as one of the independent variables. The orthogonalized historical excess returns are unrelated to the mood beta.
To test whether mood beta explains the mood recurrence and reversal effects, we use both mood beta and the orthogonalized proxies obtained during the congruent-mood (or noncongruent-mood) months to run the following panel regressions:


where
Table 3 reports the results of the Fama-MacBeth regressions. In Panel A, the coefficient of mood beta in Column (1) is 1.53% for lags 2–5, and significantly positive at 1% level. It implies that the increase of the mood beta would lead to an increase (decrease) in the stock excess returns in the following February and May (June and September) during prespecified mood months. Similar results can be found in regressions for lag1, lags 2–5, and lags 6–10 in Panel B. Mood beta carries a positive coefficient in regressions with prespecified congruent-mood months, suggesting a strong predictive power in predicting the future excess returns. When we replace
In contrast, results across prespecified or realized non-congruent high and low mood months are reported in Columns (3) and (4) of Table 3. The findings validate that mood beta could explain most of the noncongruent-mood reversal effect at monthly intervals for year lags 2–5. In Columns (3) and (4), the coefficients of mood beta remain positive and significant at 1% level for lag1 and lags 2–5. The estimates of mood beta remain virtually unchanged and continue to carry a significant positive coefficient. The coefficients of orthogonalized historical returns exhibit diminished predictive power for all sets of lags. What’s more, the sign of the coefficient of orthogonalized historical returns sometimes flips. The above findings confirm our conjecture (Hypothesis 2) that mood beta accounts for a considerable portion of the congruent and noncongruent recurrence and reversal effects, especially for year lags 2–5 for Chinese A-shares.
Mood Beta Effect Across Different Portfolios
In this section, we turn to explore the mood beta effect across different portfolios. We first investigate whether there is a significant difference in the mood beta effect between companies that trade internationally and those that don’t. We then exploit such distinctions between SOEs and non-SOEs. For year lags 2–5, the considerable mood beta impact can be seen in the above parts. We only present results for lags 2–5 for the prespecified high and low mood months for the sake of brevity. We also test for the mood effect across realized mood months and obtain similar results.
In Table 4, we run Fama-MacBeth regressions to examine the predictive ability of mood beta across different portfolios. The results in Columns (1) indicate that the mood beta effect is stronger in companies without international trade. The difference in the mood beta effect between the two groups is evident, given the empirical p-values are less than .1. For
Mood Beta Across Different Portfolios.

Note. This table provides the estimated results for the predictive ability of mood beta across different portfolios.
, **, and ***Stand for significance at the 10%, 5%, and 1% level.
Mood Beta Effect During RMB Exchange Rate Reform and Split-Share Structure Reform
In this section, we explore whether the mood beta effect would be affected by the Split-Share Structure Reform and RMB Exchange Rate Reform in China. After the establishment of the Shanghai and Shenzhen stock exchanges, the Chinese government implemented the split-share structure to maintain control over domestically listed firms. Only about a third of the shares of domestically listed companies float on stock exchanges because of the split share structure. The Chinese government launched a Split-Share Structure Reform on April 29, 2005, in order to convert non-tradable shares into tradable shares. Once the Split-Share Structure Reform is completed, the Chinese stock market would not be fundamentally different from international markets in terms of price and value. The reform process usually involves several phases, and we use the effective day of the reform plan to identify our subsamples. In regressions below,
Mood Beta Across Different Reforms.

Note. This table provides the estimated results for the predictive ability of mood beta across different reforms.
, **, and ***Stand for significance at the 10%, 5%, and 1% level.
Before July 2005, China maintained its currency policy of pegging the RMB to the US dollar at a fixed rate over decades. On July 21, 2005, China launched the RMB Exchange Rate Reform by moving into a managed floating exchange rate based on market supply and demand for a basket of currencies. The underestimate of the RMB’s exchange rate has reduced as the RMB has grown more flexible. In this section, we also look at the impact of the RMB Exchange Rate Reform on the mood beta effect.
Table 5 shows the results of Fama-MacBeth regressions. Panel A and Panel B focus on year lags 2–5 of prespecified mood periods, respectively. For brevity, the estimates for lag 1 and lags 6–10 are not presented, since they are identical to the baseline regressions. In Panel A, coefficients of
Robust Tests
In this section, we conduct robustness tests on weekly data to investigate our main point regarding the mood beta effect during ascending and descending mood months. We do not present findings across realized mood months because they are similar. We define high (low) mood weeks as the top (bottom) 5 weeks that have the highest (lowest) average stock market excess return over our sample period 1991–2020. The top 5 average market excess returns appear in weeks 32, 8, 7, 21, 15 and the bottom 5 weeks are weeks 25, 17, 39, 40, and 51. Thus, we use the above weeks as proxies for the prespecified high and low mood weeks. Following the same steps, we obtain weekly mood beta using a rolling window of 40 observations. we run Fama-Macbeth regressions of stock excess returns on their weekly mood beta for lag 1, lags 2–5, and lags 6–10 (Table 6).
Weekly Mood Beta Effect.

Note. This table provides the estimated results for the predictive ability of weekly mood beta.
, **, and ***Stand for significance at the 10%, 5%, and 1% level.
In Table 6, the coefficients of
Mood Beta and Sentiment Beta Effect
Monthly Sentiment Beta
Following Baker et al. (2012), Huang et al. (2015), Han and Li (2017), and Li and Ran (2020), we apply both the PCA and the PLS methods in our construction of the investor sentiment measurements. For proxies used to construct the investor sentiment, we choose the aggregate market value-weighted market turnover ratio, the price-earnings ratio of the stock market, and the number of newly opened individual investor accounts in the Shanghai Stock Exchange in China. Following Li and Ran (2020), we first remove the rational component from our sentiment proxies to construct the investor sentiment index. By orthogonalizing our sentiment proxies to the macro factor series (Baker & Wurgler, 2006; Verma & Soydemir, 2009), we obtain residuals from these regressions and use them as the final sentiment proxies. Macro factors used in our constructions contain industrial value-added growth, the growth of money supply, and changes in the foreign exchange rate. We obtain the appropriate sentiment proxies after all the above procedures. We then adopt the PCA (Baker & Wurgler, 2006) approach and the PLS (Huang et al., 2015) approach to form the sentiment index, denoted as

Mood Beta and Investor Sentiment
To further explore the extent to which the future excess returns can be explained by mood beta and sentiment beta. We carry out various tests during the prespecified and realized high and low mood periods using mood beta and sentiment beta. We run Fama-MacBeth regressions for lag 1and lags 2–5. One of the proxies used to construct the sentiment index (the number of newly opened individual investor accounts on the Shanghai Stock Exchange) has only been available since 2003. Due to the lack of this proxy, our sample begins in January 2003. For more details, please refer to Li and Ran (2020). The estimated results are reported in Table 7. Results in Columns (1)–(6) of Panel A indicate that mood beta tends to carry a positive coefficient at the 5% level across prespecified ascending and descending mood months. The predictive ability of mood beta can’t be diminished by sentiment beta constructed by the PCA and the PLS methods. In contrast, during the prespecified high and low mood periods, sentiment beta tends to exhibit weakened predictive power and the sign of the coefficient sometimes flips. The results suggest that high mood beta stocks earn a high future excess return. The reduction in the predictive power of sentiment beta indicates that stocks with higher mood beta earn higher stock returns. This evidence suggests that mood beta is closely related to future stock returns across high and low mood periods. When we focus on lags 2–5, the estimated results are reported in Panel B of Table 7. During periods with prespecified and realized ascending and descending moods, mood beta remains significantly positive in the presence of sentiment beta. On the other hand, the coefficients of
Mood Beta and Sentiment Beta.
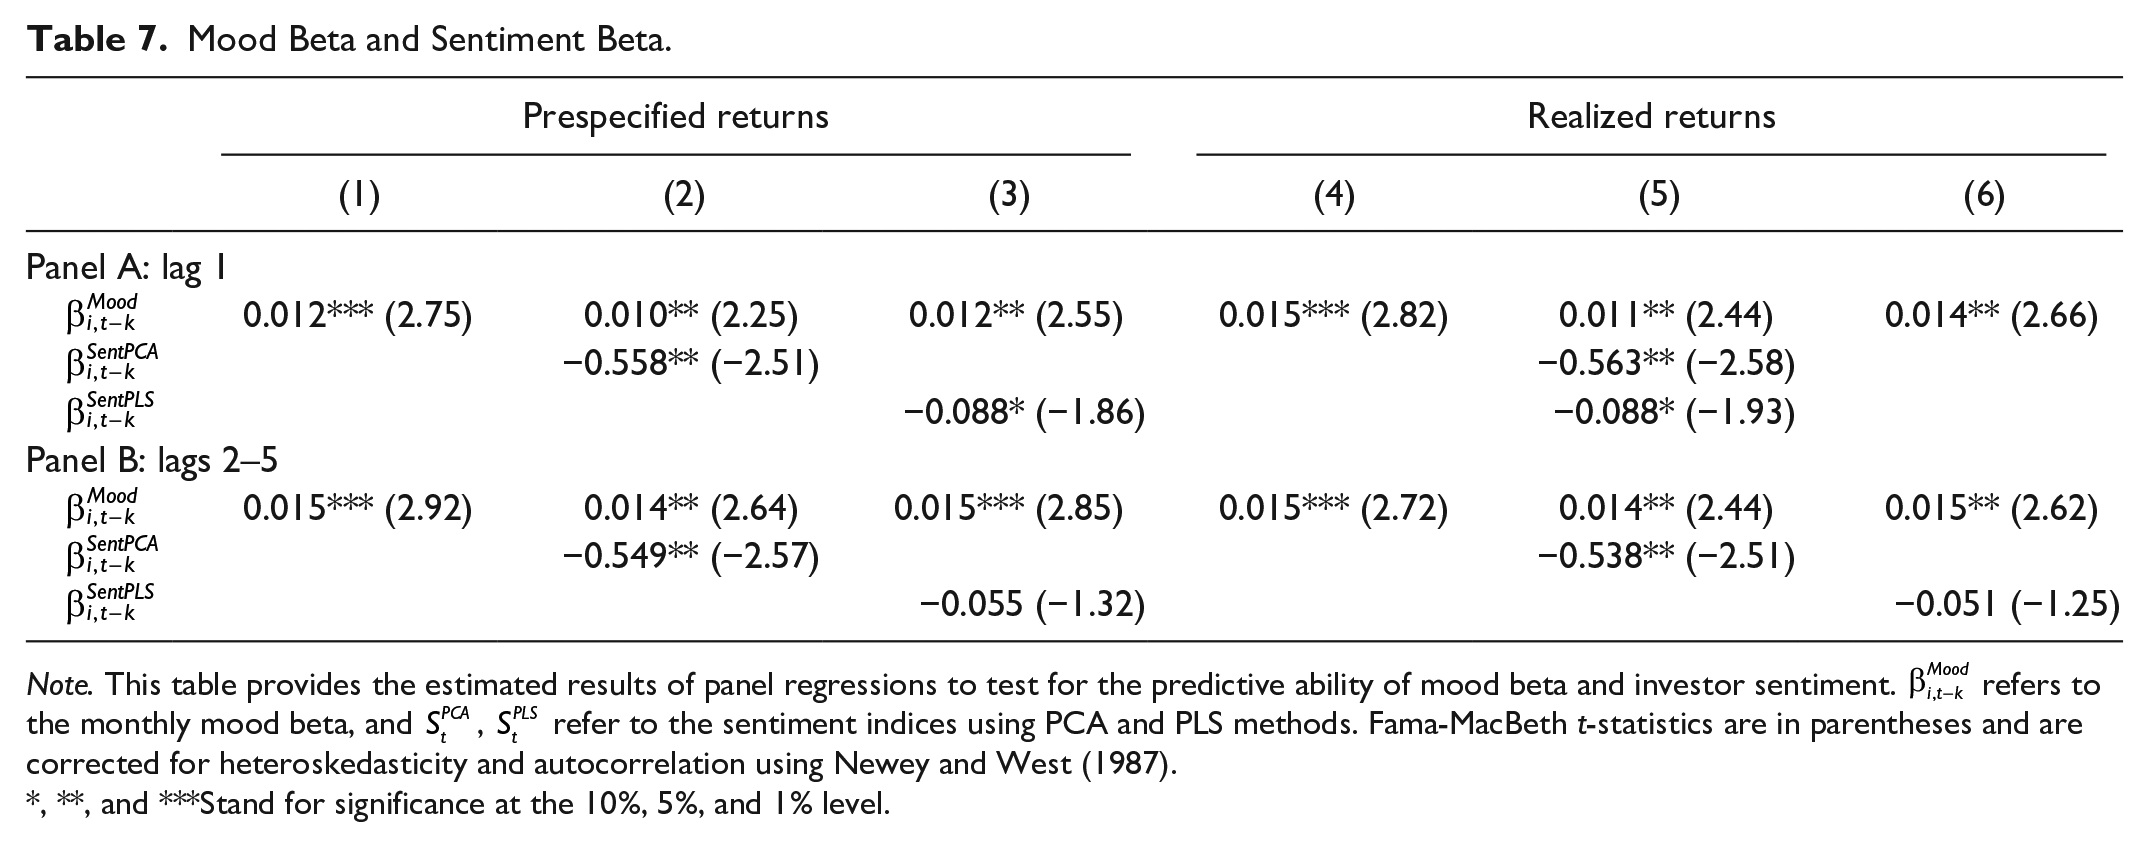
Note. This table provides the estimated results of panel regressions to test for the predictive ability of mood beta and investor sentiment.
, **, and ***Stand for significance at the 10%, 5%, and 1% level.
In conclusion, Hypothesis 4 is supported by the preceding facts. On the one hand, mood beta is consistently positive and significant throughout all the tests. Sentiment beta does not affect mood beta’s predictive capacity in forecasting future stock excess returns throughout high and low mood periods. Sentiment beta, on the other hand, has mixed coefficients that are occasionally insignificant, with no discernible pattern in ascending versus descending mood periods.
Conclusions
While investor sentiment has been widely examined in recent literature, previous investigations have not considered its predictability on seasonal stock excess returns, especially when ascending or descending mood is anticipated. We examine mood recurrence and reversal effects in China, as well as the mood beta suggested by Hirshleifer et al. (2020), to see if it is a significant predictor of seasonal stock excess returns. Furthermore, whether the Split-Share Structure Reform or the RMB Exchange Rate Reform have an impact on the mood beta effect. Finally, we examine the predictive power of both mood beta and investor sentiment after controlling for market factors.
We document that for A-shares in China, a stock’s historical excess returns are positively related to its future excess returns during congruent-mood periods and negatively associated with its future excess returns during noncongruent-mood periods. Furthermore, we discover that mood beta is positively (negatively) related to the cross-section of stock excess returns during high (low) mood periods. Besides, the mood beta effect is stronger for SOEs without international business, and it is more obvious when the RMB Exchange Rate Reform and the Split-Share Structure Reform are completed. Finally, compared to investor sentiment, mood beta has better predictability during ascending and descending mood periods.
Our analysis suggests that seasonal variations of A-shares stock prices in China are, if not all, partly explained by mood beta. Recent studies related to sentiment uses innovative approach such as music and photo sentiments in the US and other international markets (Chiah et al., 2021; Edmans et al., 2021; Fernandez-Perez et al., 2020; Obaid & Pukthuanthong, 2021). The connection between these mood indicators and stock mispricing in the Chinese stock market is uncertain. This is the subject of our future study project.
Footnotes
Acknowledgements
We thank several participants in various seminars for their nice feedback and suggestions. All possible remaining errors are ours.
Declaration of Conflicting Interests
The author(s) declared no potential conflicts of interest with respect to the research, authorship, and/or publication of this article.
Funding
The author(s) disclosed receipt of the following financial support for the research, authorship, and/or publication of this article: This project is funded by the research grant SM201910020003 of the Beijing Municipal Commission of Education.