
Abstract
Our research addresses the gap in investigating how political connections and financial constraints affect asset growth anomalies before and during the Covid-19 pandemic. Our sample includes listed non-financial firms in the Vietnam stock market from 2008 to December 2020. We employ Fama and MacBeth regressions and portfolio sorting methodology to analyze a sample with 34,441 monthly observations, including 478 firms. Our findings indicate a negative relationship between asset growth and subsequent stock returns in all periods. While the asset growth anomaly existed in the Vietnam stock market before the pandemic, it disappeared during the pandemic. The average raw return difference between stocks in the highest and lowest asset growth terciles was −0.26% per month before the pandemic. Our robustness tests show that asset growth anomaly exists in firms with political connections during the pandemic. In addition, the asset growth anomaly only persists in larger firms before the pandemic. Our findings support agency and pecking order theory, behavior, and rational explanations. Finally, this study contributes practical implications for managers and individual investors to prevent adverse impacts of asset growth anomalies.
Introduction
Chen et al. (2023) define asset growth anomalies as negative returns for firms with higher asset growth, which has long been debated in academic research. Cooper et al. (2008) attributed this anomaly to investors’ mispricing because they were too slow to incorporate information from the firm’s investments into stock prices. Lam and Wei (2011) argue that firms invest less when expected returns (i.e., capital costs) are higher, and firms invest more when returns are lower. Yao et al. (2011) argue that asset growth in Asia is weaker than in other markets because Asian firms often reinvest retained earnings to expand assets rather than equity and debt financing.
Political connections and firm performance are popular, especially in markets transitioning from centralized economies into market economies. Wisniewski (2016) reports that stock returns are higher during democratic administrations and the second half of a presidential term. Li et al. (2019) also suggest that the stock price tends to increase when the firm executives have a certain level of political connections. Azoury and Bouri (2015) show that the presence of a family CEO and the active participation of company owners in political affairs exacerbate the exploitation of minority shareholders. They may have access to privileged information unavailable to minority shareholders. They can use this information advantage to make decisions that are not in the best interests of minority shareholders, leading to adverse stock returns (Francoeur et al., 2012).
Previous research suggests that financial constraints significantly affect the company’s stock returns. Campello and Chen (2010) report that financially constrained firms have an insignificant positive return as the risk of financial constraints is priced in the market. Duong et al. (2022) document that financially constrained firms in Vietnam have relatively lower returns cross-sectionally. Nevertheless, Li and Lou (2019) have shown evidence that financial constraints are adversely connected to stock returns for liquid portfolios and positively associated with stock returns for illiquid portfolios.
Previous studies only focused on developed countries such as China and the US, and relatively few were conducted in frontier countries like Vietnam. Most studies use the same model; for example, outdated data, for example, Chan et al. (2010) use the KZ Index model. Moreover, what needs to be added is that based on asset pricing models, they still need to explain why unconstrained firms are more profitable than financially constrained firms. However, Quang et al. (2022) and Vo and Bui (2016), believe it is difficult to determine the asset growth in listed companies in Vietnam due to data limitations in a frontier market.
This study is conducted in Vietnam because of the following reasons. Firstly, there has been an increase in struggling businesses in Vietnam, particularly during the Covid-19 pandemic due to economic interruptions. In 2020, 101.7 thousand companies were specifically temporarily stopped and bankrupted. Vietnam has had the most significant number of bankruptcies in the previous ten years, with 41.8 thousand businesses leaving the market, notably in the first four months of 2020. Particularly during the pandemic, the business bankruptcy rate is unusually high in Vietnam (Duong et al., 2022). In addition, over 90% of Vietnamese firms are small firms with charter capital of less than 500,000 USD. These firms may consequently have higher financial constraints to accessing external capital than large firms (Nguyen & Kien, 2022), leading smaller firms to have more financial constraints.
Furthermore, Vo and Bui (2016) claim that when modeling the link between asset growth and stock returns, the total asset growth indicator is a more comprehensive predictor of stock returns than any growth component. Vo and Bui (2016) explain that the predictability of each asset growth sub-component enhances the total asset growth variable synergistically. Therefore, this study is the first to examine the impacts of financial constraints and asset growth on stock returns in Vietnam.
Furthermore, Faraji et al. (2020) show that companies with political ties are likely to perform better financially and experience higher stock returns because of economic rents and reduced uncertainty brought about by government backing. Negative anomalous returns, however, will probably result from more political unpredictability. In light of this, the question is whether firms with political connections have favorable or negative stock returns, especially during the Covid-19 pandemic.
We employ Fama & MacBeth regressions and portfolio analysis to examine the influence of political connections and financial constraints on asset growth anomalies before and during the pandemic. The final sample is a balanced panel with 34,441 firm-month observations of the listed firms in Vietnam from January 2008 to December 2020. This article generates the following striking results. Our findings indicate that the asset growth anomaly exists in the Vietnam stock market before the Covid-19 pandemic. However, this anomaly disappears during the pandemic. Besides, the average raw and risk-adjusted returns difference between stocks in the highest and lowest asset growth terciles in equal-weighted portfolios is −0.26% and −0.15% per month, respectively. These results align with Cooper et al. (2008), Lam and Wei (2011), Papanastasopoulos (2017), and Wen (2019). Nevertheless, our results from the portfolio sorting methodology report that the asset growth anomaly disappears after controlling financial constraints.
Finally, we perform the first robustness test to check whether asset growth anomaly exists in firms with and without political connections before and during the pandemic. We also test whether the asset growth anomaly persists across firm-size subsamples. Our robustness tests indicate that asset growth anomaly exists in firms with political connections during the pandemic. However, the asset growth puzzle remains robust within large companies before the pandemic.
Our research contributes empirical evidence to explain the asset growth puzzle in the frontier market. Our study is similar to Vo and Bui (2016) because they also examine the asset growth puzzle in Vietnam. However, Vo and Bui (2016) report that asset growth anomalies did not exist in listed firms on the Ho Chi Minh Stock Exchange (HOSE) between 2008 and 2012. Our study extends Vo and Bui (2016) because our sample includes listed HOSE and Hanoi Stock Exchange (HNX) firms from January 2008 to December 2020. Our study also differs from Vo and Bui (2016) because it identifies asset growth anomalies during the sampling period. Moreover, our study is similar to Fama and French (2008) because they report that small stocks might drive the asset growth effect and are absent amongst larger firms. Finally, this research is similar to Duong et al. (2022) because they examine the financial constraints on stock returns and use the Fama-Macbeth regression in Vietnam. Nevertheless, this study differs from Duong et al. (2022) because it examines the asset growth anomaly and political connections on stock returns while examining the distress risk on stock returns.
Finally, our study is also unique because we examine the impact of political connections on stock returns and whether asset growth anomaly exists across firm size subsamples. Wakil (2020) considers asset growth as a control variable to examine whether asset growth encompasses or lowers the impact of total book assets on future stock returns. Feng and Wu (2022) investigate the effects of local economic growth and asset location on the firm growth of real estate investment trusts (REITs), with asset growth being one of the variables used to measure the growth rate of real estate firms. Our research differs from prior literature because we employ asset growth as an independent variable to test the effect of asset growth on subsequent stock returns.
The subsequent sections of this study can be summarized as follows: Section “Literature Review” conducts a thorough examination of existing literature, Section “Data and Methodology” outlines the data and research methodology, Section “Empirical Results and Discussion” presents the empirical results and discussion, and Section “Conclusion” is about the conclusion and recommendations stemming from the research.
Literature Review
Theories
Previous studies employ behavior and rational hypotheses to explain the asset growth puzzle. Cooper et al. (2008), Lam and Wei (2011), Papanastasopoulo (2017), and Wen (2019) suggest that the asset growth anomaly is based on the behavior explanation. Due to information asymmetry, investors too slowly integrate firm investment information into stock prices. Therefore, companies that invest more or grow their total assets subsequently experience lower stock returns. The rational explanation argues that firms tend to invest more when the cost of capital is lower and vice versa, resulting in a negative relationship between asset growth and future stock returns (Wen, 2019).
Besides, the pecking order theory explains the negative relationship between asset growth and stock returns (Ling et al., 2019). Firms that issue debt to support asset expansion, particularly unsecured debt, will likely have exhausted their debt capacity and will be compelled to transition to equity financing in the following year. This transition may be causing the subsequent negative stock return. Generally, the issuance of collateralized debt to finance asset growth prevents managers from participating in sub-optimal investment activities.
Furthermore, agency theory explains how asset growth decreases subsequent stock returns (Chen et al., 2023; Watanabe et al., 2013). Managers, driven by their inclination to expand their sphere of influence, sometimes allocate resources to projects that yield negative net present values. This practice can diminish the overall value of the firm. Investors lacking a complete grasp of the issue of excessive investment stemming from agency conflicts may place an excessively high valuation on a company that has made substantial investments. Consequently, the underwhelming returns following significant investments can be viewed as a market correction that rectifies the initial overestimation of the firm’s potential future cash flows.
Assets Growth Anomaly and Stock Returns
Numerous studies examine the relationship between asset growth and stock returns. Chen et al. (2023) and Watanabe et al. (2013) found a negative relationship between asset growth and stock return relating to the agency problem of managers and asymmetric information. According to these findings, asset growth tremendously impacts stock returns in markets with poor investor protection, corporate governance, financial reporting quality, and earnings management. Machado and Faff (2018) discovered that asset growth negatively affects subsequent stock returns in the Brazilian stock market. Yao et al. (2011) also indicated a negative relationship between asset growth and stock returns in the Asian market. Cooper et al. (2008) report that earnings announcements of firms with low asset growth are related to positive abnormal stock returns, and those with high asset growth are related to negative abnormal stock returns. However, most of the above research focuses on developed markets; only a few studies are conducted in frontier markets, such as Vietnam. Vo and Bui (2016) indicate that the asset growth anomaly that disappeared in Vietnam could be due to mispricing and noise effects in the frontier market. Following prior literature, we propose the following hypothesis
Financial Constraints and Stock Returns
Financial constraints occur when a company’s ability to access external finance is hampered by an overabundance of debt or a shortage of valuable collateral. Prior literature examines the effect of financial constraints on stock returns. Campello and Chen (2010) report that financially constrained firms have an insignificant positive return as the risk of financial constraints is priced in the market. However, research by Chan et al. (2010) using the Kaplan and Zingales index model in 1997 indicates that financial constraints and stock returns have a negative relationship in the Australian market. Duong et al. (2022) also report a negative relationship between financial constraints and stock returns in Vietnam. Nevertheless, Li and Lou (2019) have shown evidence that financial constraints are adversely connected to stock returns for liquid portfolios and positively associated with stock returns for illiquid portfolios.
However, prior studies primarily concentrate on developed markets. Specifically, Campello and Chen (2010) collected data from COMPUSTAT and the Center for Research in Securities in the US market. Chan et al. (2010) only focus on the Australian market. Chan et al. (2010) and Lamont et al. (2001) use the KZ. Index to measure the degree of constraints and have in common is that they use the same model. Furthermore, prior studies leave an open puzzle of why enterprises with financial constraints would have lower returns than firms without financial constraints by implementing asset-pricing models.
We propose the following hypothesis as prior studies generate mixed findings between financial constraints and stock returns.
Hypothesis 2: Financial constraints reduce the stock returns of listed firms in Vietnam
Political Connections and Stock Returns
Claessens et al. (2008) indicate that higher stock returns are associated with higher campaign contributions to federal deputy candidates that win the election. Wisniewski (2016) reports that stock returns are higher during democratic administrations and the second half of a presidential term. Li et al. (2019) also suggest that the stock price tends to increase when the firm executives have a certain level of political connections.
On the other hand, Lee et al. (2019) examine the effects of political connections in terms of party changeover on stock returns in Taiwan and indicate that stock returns decline when the Democratic Progressive Party (DPP) wins the presidential election. Azoury and Bouri (2015) show that the presence of a family CEO and the active participation of company owners in political affairs exacerbate the exploitation of minority shareholders. They may have access to privileged information unavailable to minority shareholders. They can use this information advantage to make decisions that are not in the best interests of minority shareholders, leading to adverse stock returns (Francoeur et al., 2012). Besides, Hillier and Loncan (2019) also show that political connections are associated with substantial negative stock returns.
However, the previous studies above only focus on China and Taiwan, emerging markets, rather than frontier markets such as Vietnam. Specifically, Li et al. (2019) use data from Chinese firms from 2007 to 2016. Lee et al. (2019) collected donation lists from Taiwan’s two main political parties for the 2008 and 2016 presidential elections, excluding financial institutions. In 2008 and 2016, the sample included 628 and 834 firms, respectively. Political connections among firms are popular in Vietnam because it has transformed from a government-owned economy into a market economy.
Covid-19 and Stock Returns
The pandemic shocked the entire economy because business activities were disrupted due to the social lockdown. The Covid-19 pandemic has negatively affected consumption and sales, affecting future cash flow. This pandemic makes the financial situation and the stock market more concerned than ever. Topcu and Gulal (2020) show the relationship between the epidemic and the stock market. To come up with the study, they analyzed the daily data of 26 emerging stock markets using two data sources: the Investment Database (2020) and the Yahoo Financial Database (2020). From this, we conjecture that the pandemic had a negative effect on the stock market.
Data and Methodology
Data
In this report, we use data obtained from financial statements on FinPro from January 2008 to December 2020, including all stocks listed on the Ho Chi Minh City Stock Exchange (HOSE) and Hanoi Stock Exchange (HNX) of Vietnam’s stock market. The Vietnam stock market experienced a nascent stage of development and did not achieve full functionality until the mid-2000s. Consequently, our dataset from 2008 to 2020 is relatively comprehensive, given the limited historical data available in Vietnam. Besides, daily stock prices are taken from Cafef.vn, a reliable data source in Vietnam.
We follow Duong et al. (2022) to exclude the financial and utility industries. We follow Bali et al. (2011) to remove all observations, which are not enough data to calculate all variables. We follow Amihud (2002) in excluding stocks with less than ten trading days in a month and fewer than ten transactions in one trading day. We follow Duong et al. (2022) to winsorize all our variables at 5% and 95% to avoid problems with extreme value. To ensure all accounting variables are available, we follow Duong et al. (2022) to match the accounting data at the end of December of year t-1 with the stock returns from July of year t to June of year t+1 to avoid the look-ahead bias. The final sample is 34,441 firm-month observations, including 478 firms.
Model Construction
In response to the research objective, we construct monthly firm-level cross-sectional regressions to test the following regression model empirically:


Where β0 and µ i,t are the constant terms, Ri,t is the monthly raw return between July of year t and June of year t+1. The predictive cross-sectional regressions are run on the prior one-month TAG values, and control variables such as BM, SIZE, AKZ, LEV, IVOL, and ROA are calculated over the month t; µ is a residual value. All variable definitions are reported in Appendix A.
Estimation Method
At each month t, we run the Fama-MacBeth regression following models for all samples and regress monthly stock returns on beta, book-to-market ratio (BM), the market value of equity (SZ), total assets growth (TAG), and the proxies for financial constraints such as adjusted Kaplan and Zingales (AKZ), leverage (LEV), idiosyncratic volatility (IVOL), and return on assets (ROA).
To explore the impact of asset growth on stock returns from multiple angles, we also investigate the issue by implementing univariate and dependent portfolio sorting methods to estimate the value-weighted and equal-weighted results, which is aligned with the approach of many prominent publications, including Bali et al. (2011), Cooper et al. (2008), and Fama and French (1992, 2008), several others in stock returns modeling. After controlling for other variables, we calculate the return difference between the highest and lowest TAG terciles. The negative return difference implies the existence of an assets growth puzzle.
Furthermore, we conduct the first robustness test to investigate if there is an asset growth anomaly in firms with and without political links before and during the pandemic. We also test if the asset growth anomaly remains across firm-size subsamples.
Empirical Results and Discussion
Descriptive Statistics
Table 1 reports the descriptive statistics for variables. The average asset growth (TAG) value is 0.16 in Vietnam, with a standard deviation of approximately 57.74%. These values of asset growth are roughly similar to Vo and Chu (2019). The average value of ROA is 0.08; our results are consistent with Tran (2019). The firms using relative leverage are represented by the mean LEV of 0.49. BM, SZ, AKZ, IVOL, and POL average values are 0.11, 18.40, 0.70, 9.23, and 0.54, respectively.
Descriptive Statistics.

Note.Table 1 reports the descriptive statistics. The sample includes 34,441 firm-month observations from 2008 to 2020. All variable definitions are reported in Appendix A.
Table 2 reports the correlation matrix between the independent variables. All the differences are statistically significant, indicated at 1%, and there is no high correlation between variables. Duong et al. (2023) claimed that multicollinearity might happen when the correlation coefficient exceeds 0.80. However, Table 2 represents correlation coefficients that are less than 0.5, so multicollinearity is not a problem in our study.
Pearson Correlation Matrix.

Note.Table 2 reports the Pearson correlations between independent variables. The sample includes 34,441 firm-month observations from 2008 to 2020. All variable definitions are reported in Appendix A. ***, **, and * represent the significant level at 1%, 5%, and 10%, respectively.
Fama and MacBeth (1973) Estimation Results
In Table 3, we employ the Fama & MacBeth estimations to test whether asset growth anomalies exist in the Vietnam stock market, even after controlling for financial constraints and firm characteristics. Panel A shows that the coefficient of TAG is −0.45, with a t-statistic of −2.25. This result indicates that a 1% increase in the total assets will lead to a decrease of 0.45% in stock returns. Our finding shows that firms that make higher investments or increase the growth of their total assets generate lower subsequent stock returns. Our empirical result supports the behavior explanation by Cooper et al. (2008), Lam and Wei (2011), Papanastasopoulos (2017), and Wen (2019) because the effect of asset growth anomaly is related to mispricing, which suggests that asset growth anomaly exists due to information asymmetry when investors too slowly integrate firm investment information into stock prices. Managers seeking to expand their influence may invest in projects with negative net present values, eroding the firm’s overall value. Investors must fully grasp the problem of excessive investment due to agency conflicts that might overvalue companies with substantial investments. The subsequent low returns can be seen as a market correction, fixing the initial overestimation of the firm’s future cash flows (Chen et al., 2023; Watanabe et al., 2013).
Fama & MacBeth Estimation Results.

Note.Table 3 reports the two-step Fama and McBeth estimation results. The entire sample includes 478 firms from 2008 to 2020. All variable definitions are reported in Appendix A. ***, **, and * represent the significant level at 1%, 5%, and 10%, respectively. T-values are in parentheses.
Additionally, our result aligns with Ling et al. (2019) that firms that issue debt to finance asset expansion, particularly unsecured debt, will almost certainly have depleted their debt capacity and will be compelled to convert to equity financing the following year. This change might be the source of the subsequent negative stock return. Besides, our findings align with Wen (2019) that firms tend to invest more when the cost of capital is lower and vice versa, resulting in a negative relationship between asset growth and future stock returns. Our finding is consistent with the agency and pecking order theories, behavior, and rational explanations and supports hypothesis 1. Our results do not support the study of Vo and Bui (2016), indicating that the asset growth anomaly that disappeared in Vietnam could be due to mispricing and noise effects in the frontier market. It could be because Vo and Bui (2016) focused on the Ho Chi Minh Stock Exchange from 2008 to 2012, while our study includes the Ho Chi Minh Stock Exchange and the Hanoi Stock Exchange between 2008 and 2020.
Panel A also reports an adverse impact of financial constraints on stock returns. Specifically, a percentage increase in AKZ can reduce subsequent stock returns by 0.43%. Our finding is consistent with Chan et al. (2010) and Duong et al. (2022) because financially constrained firms have fewer external resources to finance their growth opportunities. Firms with more significant financial constraints may struggle to compete effectively. They may be unable to invest in research and development, marketing, or other essential activities that can enhance their competitive position, leading to lower returns than less constrained competitors. Investors may perceive financially constrained firms as riskier investments due to their limited financial resources and potential difficulties in meeting financial obligations. This increased risk perception can result in lower stock prices and returns for these companies. Therefore, higher financial constraints lead to a reduction in subsequent cross-sectional stock returns. Our finding supports hypothesis 2.
In panels B and C, financial constraints also have a statistically significant negative effect on stock returns in politically connected firms, with a coefficient of −0.71 (t-statistic is −2.32). This result suggests that when AKZ increases by one percentage point, the stock returns of politically connected firms decrease by 0.71%. However, asset growth anomaly has an insignificant impact on political and non-political connected firms. These results are explained by firms’ capacity to access capital through debt or equity financing, which can influence their asset growth approach (Mittal & Raman, 2021). Firms with limited access to capital may be unable to pursue significant asset growth regardless of their political or non-political nature.
In Panels D and E, the average slope coefficient on TAG is −0.54 with a corresponding t-statistic of −2.50. However, AKZ has a significantly negative effect on stock returns with a coefficient of −1.20 and a t-statistic of −2.03. That means a 1% increase in AKZ, leading to a 1.2% decrease in stock returns during Covid-19. Our finding is consistent with Chan et al. (2010) and Duong et al. (2022) because they report that firms with financial constraints have lower stock returns.
Overall, the result shows the negative impacts of asset growth and financial constraints on stock returns in Vietnam. In addition, the adverse effects of financial constraints remain robust in listed firms with political connections only. Finally, Table 3 reports that the asset growth anomaly disappeared during the pandemic while the negative impacts of financial constraints on stock return persisted.
Univariate Portfolio-level Analysis
In this section, we perform the univariate portfolio analysis by sorting stocks with the lowest asset growth into the first tercile (low TAG) and highest asset growth (high TAG) portfolios into the third tercile. Table 4 reports that the first tercile generates the highest stock returns. The value-weighted (VW) and equal-weighted (EW) monthly return difference between high TAG and low TAG for all periods is −0.75% and −0.21%, respectively. This finding confirms that the asset growth puzzle persists after employing the portfolio analysis methodology. These results are consistent with Cooper et al. (2008), Lam and Wei (2011), Papanastasopoulos (2017), and Wen (2019). Investors and portfolio managers are willing to pay a premium for stock having lower asset growth because they will not fall into mispricing attributed to information asymmetry, making investors tend to incorporate firm investment information into stock prices slowly and leading to subsequent negative stock returns due to projects with negative net present values.
Univariate Portfolio Sorting by Asset Growth.

Note.Table 4 reports the time-series averages of value-weighted and equal-weighted one-year post-formation monthly percentage returns portfolios sorted by TAG. ***, **, and * represent the significant level at 1%, 5%, and 10%, respectively. T-values are in parentheses.
We also examine the effects before the pandemic and during the pandemic period on the difference returns between the lowest and highest TAG portfolios. However, only equal-weighted (EW) is significant at −0.25% per month with a corresponding t-statistic of −1.88 before the pandemic. This result suggests that the asset growth puzzle only persists in all periods and before the pandemic.
Bivariate Portfolio-level Analysis
Table 5 shows the value-weighted average monthly returns of tercile portfolios double-sorted based on TAG after controlling for firm book-to-market ratio (BM), the market value of equity (SZ), and adjusted KZ. Index (AKZ), idiosyncratic volatility (IVOL), return on assets (ROA), and leverage (LEV).
Returns on Portfolios of Stocks Sorted by TAG After Controlling for Six Control Variables.

Note. Table 5 reports the bivariate sorting between asset growth and control variables. All variable definitions are reported in Appendix A. ***, **, and * represent the significant level at 1%, 5%, and 10%, respectively. T-values are in parentheses. However, we only report the value-weighted result for brevity. The Equal-weighted average monthly returns will be provided upon request.
Panel A shows the value-weighted average return differences between the high TAG and low TAG portfolios for all periods are 1.24%, −1.06%, −0.51%, −1.32%, 0.69%, and 0.56% per month, respectively. Panel B shows the value-weighted average return differences between the high TAG and low TAG portfolios before the Covid-19 pandemic are 1.5%, −1,3%, −0.43%, −1.42%, 0.45%, and -0.08% per month, respectively. Panel C shows that the value-weighted average return differences between the high TAG and low TAG portfolios during the pandemic are −1.5%, 1.5%, −1.3%, −0.27%, and 3.17%, and 1.69% per month, respectively. Our empirical results show that only AKZ is insignificant in value-weighted portfolios in three panels. Before, during the pandemic and all periods, the asset growth anomaly disappeared after controlling financial constraints (AKZ).
Impact of Political Connections and Asset Growth Anomaly on Stock Return
Table 6 represents the average returns and FF3-alphas for VW and EW portfolios ranked univariate in asset growth (TAG) terciles. We also divide stocks into terciles of lowest asset growth (low TAG) and highest asset growth (high TAG) portfolios.
Univariate Portfolio Sorting On Total Assets Growth After Controlling for Political Connections and the Covid-19 Pandemic.

Note.Table 7 reports the time-series averages of value-weighted and equal-weighted one-year post-formation monthly percentage returns portfolios sorted by TAG. We employ a dummy variable with one value for politically connected firms and 0 otherwise.
, **, and * represent the significant level at 1%, 5%, and 10%, respectively. T-values are in parentheses.
In panel A, average raw and risk-adjusted return differences between stocks in the highest and lowest TAG terciles are under 1% per month and insignificant before the pandemic. However, the return difference becomes −4.28% for the value-weighted portfolio during the pandemic. Our findings suggest that the asset growth anomaly becomes even more pronounced in firms with political connections during the pandemic. The firms with political ties helped enhance their access to resources and opportunities during the pandemic. These firms often benefit from government support and preferential treatment. Consequently, they experience heightened asset growth, leading to the asset growth anomaly.
In panel B, average raw and risk-adjusted return differences between stocks in the highest and lowest TAG terciles are statistically insignificant during the pandemic. However, the return difference is −0.65% for the equal-weighted portfolios before the pandemic, respectively. Our results indicate that the asset growth anomaly is significantly more prominent in firms without political connections before the pandemic. Our results align with Cooper et al. (2008), Lam and Wei (2011), Papanastasopoulos (2017), and Wen (2019). The effect of asset growth anomaly is related to mispricing, which suggests that asset growth anomaly exists due to information asymmetry when investors too slowly integrate firm investment information into stock prices. Our result aligns with Ling et al. (2019) that firms that issue debt to finance asset expansion, particularly unsecured debt, will almost certainly have depleted their debt capacity and will be compelled to convert to equity financing the following year.
Table 7 illustrates the value-weighted average monthly returns of tercile portfolios double-sorted based on TAG after controlling for firm characteristics. After controlling for the financial constraints, the value-weighted return difference between the highest and lowest asset growth is −1.11%. This result indicates that the asset growth anomaly exists after controlling for financial constraints in politically connected firms. In contrast, Table 7 reports that the asset growth anomaly disappears during the pandemic after controlling for financial constraints.
Returns on Portfolios of Stocks Sorted by TAG After Controlling for Firm Characteristics.

Note. All firms give average raw and risk-adjusted returns in percentage terms. Political connection is a dummy variable. We also run equal-weighted average monthly returns of tercile portfolios double sorted on TAG and other variables. However, we only report the value-weighted average monthly returns of tercile portfolios double sorted on TAG and other variables. Equal-weighted average monthly returns of tercile portfolios double sorted on TAG, and other variables will be provided upon request. ***, **, and * represent the significant level at 1%, 5%, and 10%, respectively. T-values are in parentheses.
Robustness Tests
This section investigates whether asset growth anomaly persists across firm size subsamples. We follow Fama and French (2008) to divide our sample into five firm-size subsamples. The smallest firms have a market cap below the 20th percentile of all firms, while the most prominent firms have a market capitalization above the 80th percentile.
Table 8 reports that the asset growth puzzle persists in the larger firm size subsample. This result indicates that a percentage increase in the total assets will lead to a decrease of 0.87% in stock returns. Our finding aligns with Cooper et al. (2008), Lam and Wei (2011), Ling et al. (2019), Papanastasopoulos (2017), and, Wen (2019). However, the asset growth anomaly does not exist within the smallest firms. This anomaly also disappears during the pandemic across firm-size subsamples.
Robustness Test Results Across Firm Size Subsamples.
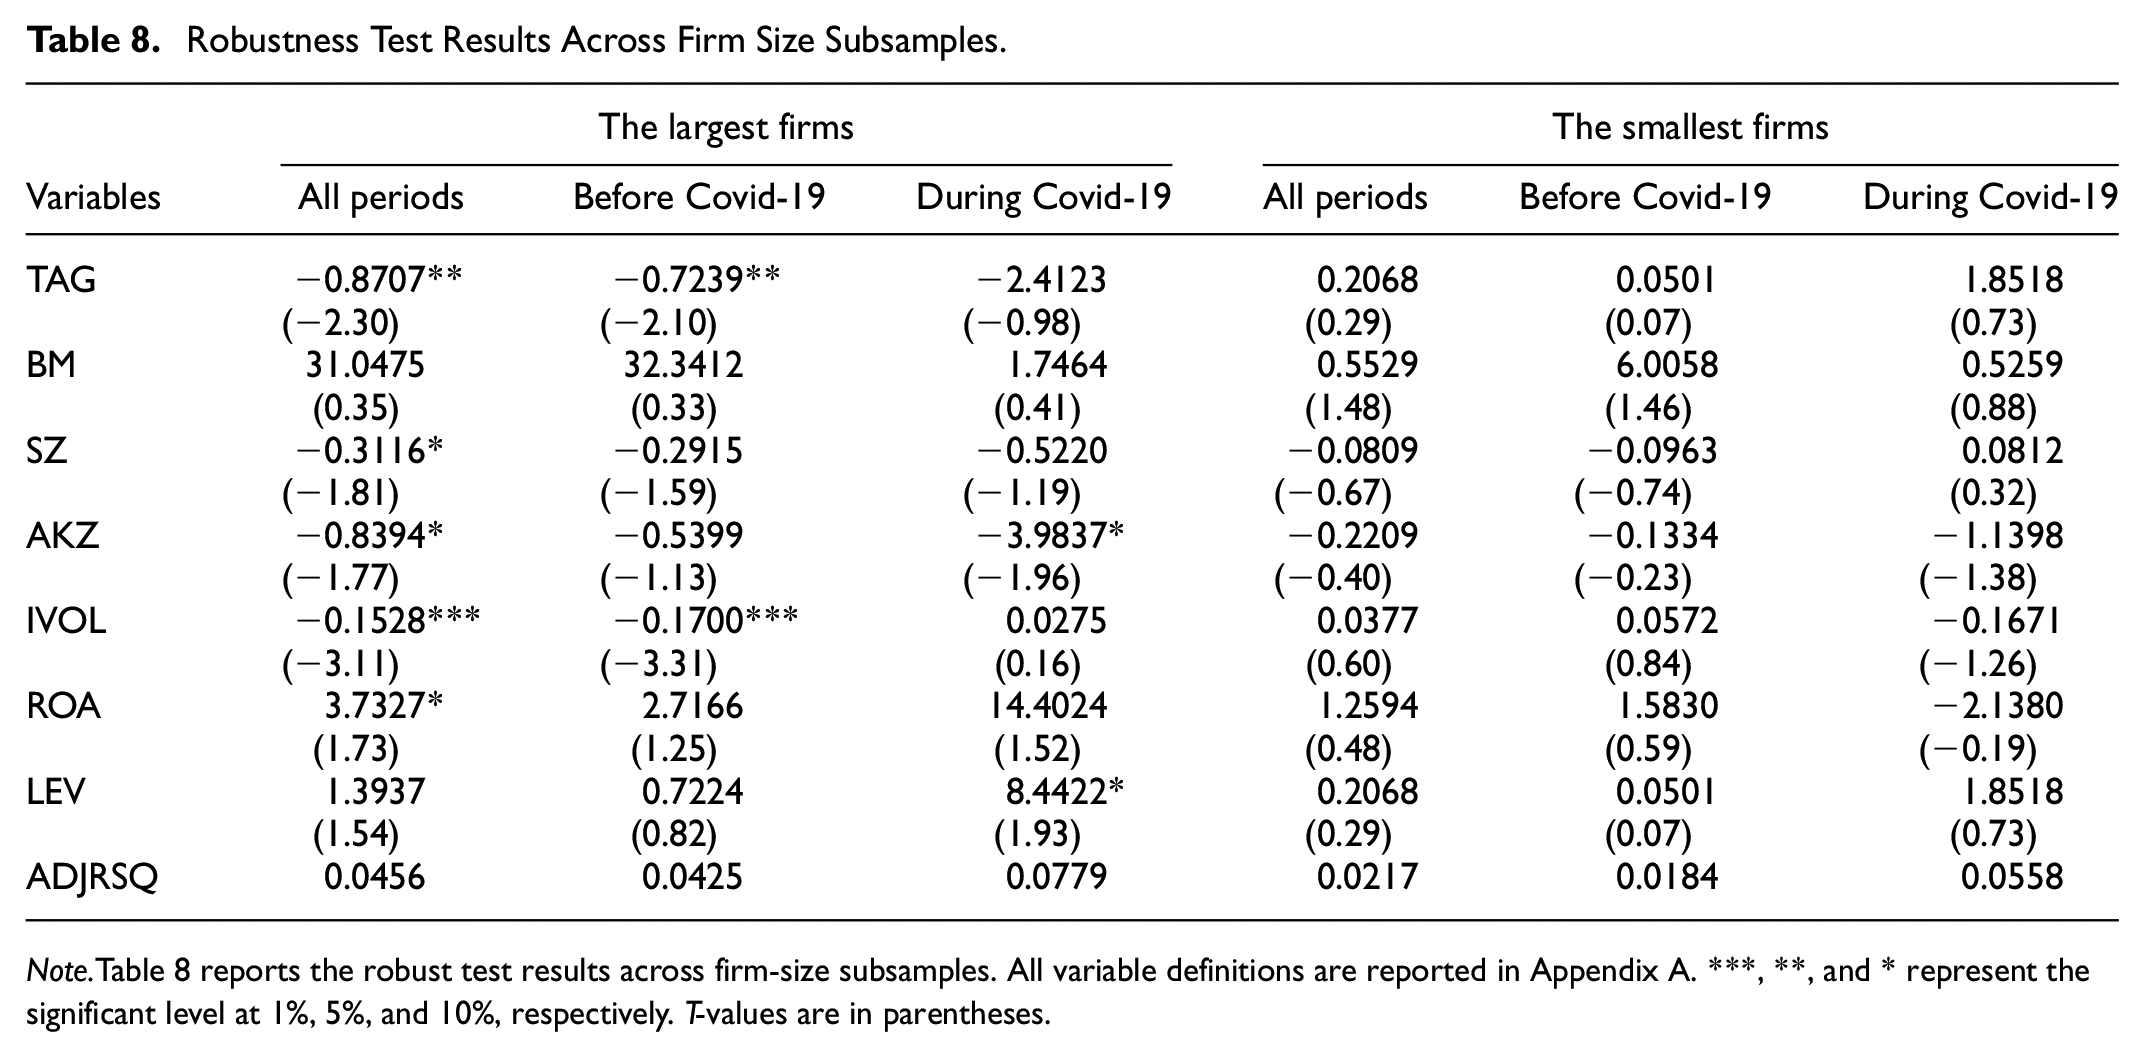
Note.Table 8 reports the robust test results across firm-size subsamples. All variable definitions are reported in Appendix A. ***, **, and * represent the significant level at 1%, 5%, and 10%, respectively. T-values are in parentheses.
Table 8 also indicates that the financial constraints have robust impacts on the stock returns of the largest firms in the sample. Moreover, the negative effect of financial constraints on stock returns is even more pronounced during the pandemic. However, the impact of financial constraints is not robust within the smallest firm.
Conclusion
This study estimates the influence of political connections and financial constraints on asset growth anomalies before and during the pandemic. Our findings show that the asset growth anomaly existed in the Vietnam stock market before the pandemic. However, the asset growth anomaly disappears after controlling financial constraint factors. Our results suggest that asset growth anomaly exists in firms with political connections during the pandemic. Moreover, this anomaly persists in the most prominent firms before the pandemic. Finally, the negative impact of financial constraints on stock returns is even more pronounced during the pandemic.
This study contributes practical implications for policymakers. Policymakers must consider the broader implications of asset growth and stock returns on market stability. If excessive asset growth and poor stock performance become widespread, it could pose risks to overall market stability, and policymakers may need to intervene to address systemic issues. Furthermore, one way to mitigate asset growth anomalies is that policymakers may need to examine the regulatory environment to ensure that companies are not engaging in activities that inflate their total assets without generating corresponding value. Policymakers should stress transparent reporting and disclosure standards, especially for politically connected firms. This suggestion can deter the misuse of connections to inflate assets or engage in activities detrimental to the economy, a critical concern during the pandemic. Besides, policymakers can play a role in facilitating access to capital for businesses, especially smaller companies, to support sustainable growth. This recommendation can involve initiatives to increase access to financing, reduce regulatory burdens, and promote innovation.
This study also contributes practical implications for retail investors and managers in preventing the asset growth puzzle. Beekes et al. (2016) suggest that firms with better governance make more frequent disclosures. Therefore, managers must manage the business effectively and avoid losses by assessing the situation and promptly making appropriate adjustments. Moreover, managers should be closely and strictly monitored for debt issuance because Ling et al. (2019) indicate that the issuance of collateralized debt to finance asset growth prevents managers from being involved in sub-optimal investment activities. Our findings suggest that individual investors buy stocks of firms with lower asset growth and have fewer financial constraints to achieve higher returns. Retail investors should conduct comprehensive due diligence when considering investments in Vietnamese firms. Specifically, individual investors should thoroughly assess financial reports, corporate governance practices, and the transparency of these companies to gauge the potential risks associated with asset growth anomalies and financial constraints (Quang et al., 2022).
Although this study contributes to the growing literature on asset growth puzzles and political connections in emerging markets, it has data limitations. This study only focuses on non-financial firms in Vietnam, a frontier market in Asia. Thus, the results may not be applied to other markets. Future studies are encouraged to analyze asset growth anomalies across the country during different economic policy uncertainty periods.
Footnotes
Appendix
Variable Definitions.

| Variable | Definitions | |
|---|---|---|
| AKZ | Following Chan et al. (2010), we construct the adjusted Kaplan and Zingales (KZ index): AKZ = -1×CF – 7.03×DIV -1.59×Cash+1.14 × LEV+0.16×MB Where CashFlow (CF) is cash flow over assets; Dividends (DIV) are cash dividends over assets; Cash is cash balances over assets; Leverage (LEV) is the total debt-to-asset ratio; MB is the market-to-book assets ratio. |
|
| BM | Following Fama and French (1992), we calculate the book-to-market ratio in each month by the stock’s market value at the end of June of year t and the book values of common stock at the end of December t-1. | |
| IVOL | Following Duong et al. (2022) to estimate the idiosyncratic monthly volatility of an individual stock, we assume a single-factor return-generating process: Where is the idiosyncratic return on day d. The idiosyncratic volatility of stock I in month t is defined as the standard deviation of daily residuals in month t: |
|
| LEV | Leverage is the long-term debt ratio to total capital (total asset) at year t, following Azoury and Bouri (2016) |
|
| POL | Following Duong et al. (2022), we define political connection as a dummy variable with the value of one if the firm has CEOs or Chairman are members of the Communist party in Vietnam and zero otherwise. According to section four of the Vietnamese constitution, the Communist Party is the only ruling party in Vietnam. | |
| ROA | We measure return on assets (ROA) as the ratio of a company’s net income before financing costs to total asset year t. |
|
| SZ | Following Bali et al. (2011), we measure the firm size for each stock as the natural logarithm of the stock’s market value (stock’s price multiplied by shares outstanding as a proxy for market value) at the end of month t-1. | |
| TAG | TAG
it
is the growth rate of a firm I’s total assets (TA) from year t-1 to year t. Following Cooper et al. (2008), we use asset growth (TAG) as a composite measure of overall corporate investment growth and asset expansion. $TA{G_{i, t}} = {\rm{ }}\left( {Totals{\rm{ }}asset{s_{i, t}} - {\rm{ }}Totals{\rm{ }}asset{s_{i, t - 1\ }}} \right)/{\rm{ }}Totals{\rm{ }}asset{s_{i, t - 1}}$ |
|
Acknowledgements
We also thank anonymous reviewers for their constructive feedback, which helps us revise our manuscript
Author Contribution
Khoa Dang Duong (
Trang Ngoc Doan Tran (
Ai Ngoc Nhan Le (
Declaration of Conflicting Interests
The author(s) declared no potential conflicts of interest with respect to the research, authorship, and/or publication of this article.
Funding
The author(s) disclosed receipt of the following financial support for the research, authorship, and/or publication of this article: This work was supported by Ton Duc Thang University and Van Lang University.
Ethics Statement
This study does not involve animals or humans.
Data Availability Statement
The data that support the findings of this study are available from the corresponding author upon reasonable request.