
Abstract
Following the 2007/2008 global food price crisis, large-scale land acquisitions (LSLAs) proliferated across the Global South. However, empirical evidence investigating the role of rising prices in this proliferation remains lacking. This study provides the first empirical estimates of the relationship between agriculture commodity price dynamics and LSLAs. We constructed a unique bilateral panel data across 82 investor and 80 recipient countries between 2000 and 2020 and estimated a bilateral panel gravity model using two-way fixed effects and Poisson pseudo-maximum likelihood (PPML) estimator. The findings reveal that agricultural producer prices in recipient countries are primary drivers of LSLAs. Specifically, we find a negative relationship between these prices and LSLAs which indicate that investors target regions with lower producer prices. This suggests that the food independence motive outweighs the profit maximization motive in these investment decisions. Furthermore, the effect of investor-country food prices on LSLA flows is heterogeneous and depends on deal size. We find a positive association for the flow of smaller LSLA deals, suggesting smaller deals are driven by the food independence motive. However, this relationship becomes insignificant for larger deals, indicating that extensive acquisitions are less sensitive to food prices and are likely driven by other factors such as speculation, biofuel production, or financial diversification motives. These results contribute empirical evidence to the debate in the drivers of LSLAs. The study recommends that recipient countries implement targeted land governance policies to mitigate speculation and mandate produce for local markets.
Plain Language Summary
Since the early 2000s, the global landscape has witnessed a proliferation of large-scale transnational land deals. According to the database of the Land Matrix, since the early 2000s, more than 65 million hectares of agricultural land, an area nearly twice the size of Germany (35.7 million ha), have been transferred from local communities to private and public investors through more than 2200 concluded deals. Large-scale land acquisitions (LSLAs) has become an ongoing area of academic and policy concern due to its implications for food security, local tenure rights, and sustainable development, particularly in the Global South. This proliferation was triggered by the confluence of several global factors, most notably the 2007/08 agricultural commodity and food price rise. Despite, the 2007/08 global food price crisis is cited as one of the driving factors for the proliferation of LSLAs to the Global South, empirical evidence investigating the role of rising prices in this proliferation remains lacking. This study provided the first empirical estimates of the relationship between agriculture commodity price dynamics and LSLAs. We constructed a unique bilateral panel data across 82 investor and 80 recipient countries between 2000 and 2020 and estimated a bilateral panel gravity model using two-way fixed effects and Poisson pseudo-maximum likelihood (PPML) estimator. The findings reveal that agricultural producer prices in recipient countries are primary drivers of LSLAs. Specifically, we find a negative relationship between these prices and LSLAs which indicate that investors target regions with lower producer prices. This suggests that the food independence motive outweighs the profit maximization motive in these investment decisions. Furthermore, the effect of investor-country food prices on LSLA flows is heterogeneous and depends on deal size. We find a positive association for the flow of smaller LSLA deals, suggesting smaller deals are driven by the food independent.
Introduction
Since the early 2000s, the global landscape has witnessed a proliferation of large-scale transnational land deals. According to the database of the Land Matrix, since the early 2000s, more than 65 million hectares of agricultural land, an area nearly twice the size of Germany (35.7 million ha), have been transferred from local communities to private and public investors through more than 2200 concluded deals (Land Matrix, 2023). This phenomenon is widely referred in the literature under various terminologies, including Large-Scale Land Acquisitions (LSLA), Large-Scale Agricultural Investments (LSAI), and the more political related term, “land grab.” While LSAI emphasizes the capital flow, we adopt LSLA throughout this study, because our empirical focus is on the proliferation of these land transfers. LSLA has become an ongoing area of academic and policy concern due to its implications for food security, local tenure rights, and sustainable development, particularly in the Global South. This proliferation was triggered by the confluence of several global factors, most notably the 2007/2008 agricultural commodity and food price rise. For example, a significant spike in agricultural commodity and food prices occurred between 2005 and 2008, with a 51% increase by March 2008 alone (Ivanic & Martin, 2008), which served as a major incentive for investors to secure overseas production (Deininger & Byerlee, 2011; Borras & Franco, 2012).
The extensive literature on LSLAs has primarily focused on the consequences of these land transfers, including their effects on land tenure rights (Dell’Angelo et al., 2017; Gerber & Haller, 2021; Liao et al., 2016); environmental impacts (Davis et al., 2020; Rulli et al., 2018) and effects on welfare and livelihoods of farm households (Akalu et al., 2025; Bekele et al., 2021; Herrmann, 2017; Jiao et al., 2015). In contrast, research on the drivers behind the proliferation of LSLA is relatively scarce (Arezki et al., 2018; Bujko et al., 2016; Kareem, 2018; Lay & Nolte, 2018; Anti, 2022). While the proliferation of transnational land deals follows the 2007/2008 rise in global commodity and food prices, there remains a lack of empirical evidence exploring how global commodity and food prices dynamics influence the scale of large-scale land acquisitions. To address this gap, this study empirically examines whether agricultural commodity and food prices, along with subsequent price volatility, drive the proliferation of large-scale agricultural land acquisitions in the Global South.
The acreage response theory suggests that price changes affect producers’ decisions on farmland allocation, with higher prices encouraging more farmland dedicated to production (Keeney & Hertel, 2009; Nerlove, 1956). Price changes could affect the decision of investors to engage in the LSLAs. The effect of price changes on investors’ decision to engage in the LSLAs could be moderated by their underlying motivations. The drivers of foreign direct investment literature identify two main motives: resource-seeking and market-seeking (Arezki et al., 2018; Helpman & Krugman, 1985; Markusen, 2002). Under the resource-seeking motive, investors, often state-owned entities, prioritize securing food supplies for their home countries. They engage in LSLAs seeking cheap labor, fertile land, and water (Lay & Nolte, 2018). Thus, a rise in food price in the investor’s country serves as a push factor to engage in LSLAs for food production with the goal of securing food independence in their home countries (Arezki et al., 2018; Cotula, 2012). In this case, we expect a positive relationship between LSLAs and food prices in investor countries, and a negative relationship with recipient countries’ export prices. This is because investors target countries with lower export prices to export their produce back to their home country at a lower cost. In contrast, the market-seeking motive focuses on profit maximization, where investors target countries with lower production costs and higher agricultural producer/farm gate prices resulting a positive association between LSLAs and agricultural producer prices, and a negative association with input prices such as wage rate in recipient countries. This is because lower input prices imply lower production costs, leading the investor to be more profitable.
In this study, we empirically tested how changing prices drive the proliferation of large-scale land acquisitions to the global South. We apply two-way fixed effects and the Poisson pseudo-maximum likelihood (PPML) estimator on a unique bilateral panel dataset capturing LSLAs flows from 82 investors and 80 recipient countries between 2000 and 2020. Our analysis reveals that the relationship between price dynamics and LSLAs is complex and dependent on deal size. Our findings indicate that agricultural producer prices in recipient countries are the main price-related drivers of LSLAs. Food prices appear to have a greater influence only on the flow of smaller LSLA deals. This suggests that motives beyond simple food security or profit maximization, such as speculative motives, may drive larger LSLAs. The 2007/2008 global food price crisis has led to the financialization and commercialization of agricultural land (Bélair et al., 2024). This could explain why larger land deals are often driven by diversified motives, including financial speculation on land price appreciation and investment in non-food production, such as biofuel cultivation (Bruna et al., 2025; Neudert & Voget-Kleschin, 2021). Contrary to some expectations, we find a negative association between producer prices and the flow of LSLAs. This implies that investors target recipient countries with lower producer prices, suggesting the primary motive is securing food supplies for their home countries and accessing cheap production factors, rather than maximizing returns based on high local prices.
This study contributes to the large-scale land acquisition literature in the following important dimensions: First, we provide one of the first empirical estimates establishing a link between agricultural commodity and food price and the proliferation of LSLAs using a bilateral panel gravity model. The use of country-pair fixed effects, following Raimondi and Scoppola (2018) and Anti (2022), improves efficiency and flexibly treats time-invariant factors that affect the flow of LSLAs, thereby addressing associated endogeneity issues (Baier & Bergstrand, 2007). Second, we provide strong quantitative evidence that proliferation of LSLAs is fundamentally driven by the food independence motive. Finally, we introduce a crucial nuance by demonstrating that the drivers of LSLAs are highly dependent on deal size. The food security motive is shown to be significant mainly for smaller deals, implying that larger, more extensive land acquisitions are governed by different, often speculative or non-food-related, motives.
The remainder of the paper is organized as follows: Section 2 reviews existing literature on the drivers of the flow of LSLAs; Section 3 outlines the conceptual framework of the study; Section 4 presents the methods; Section 5 presents and discusses the results; and Section 6 concludes.
Literature: The Drivers of Large-Scale Land Acquisitions
The academic literature in large-Scale land acquisitions (LSLAs) has evolved significantly over the last two decades in response to the global surge in land deals following the 2007/2008 food and agricultural commodity price crises (Deininger & Byerlee, 2011). This development can be traced through distinct and cumulative stages. The initial phase focused primarily on quantifying the magnitude and severity of the phenomenon, frequently termed “land grabbing” (Edelman et al., 2013). This has led the creation of data collection initiatives by efforts from NGOs like GRAIN and later formalized and standardized by comprehensive projects such as the Land Matrix Initiative. These critical efforts provided the necessary empirical foundation, establishing the verifiable extent of the global land rush. Once the magnitude was adequately documented, research transitioned into two parallel, thematic areas: a focus on identifying and empirically modeling the complex drivers of LSLAs (which forms the core of this paper’s subsequent review) and a simultaneous emergence of grass-roots case studies evaluating the socio-economic and environmental impacts on local communities (see e.g., Akalu et al., 2025; Bekele et al., 2021; Davis et al., 2020; Herrmann, 2017; Jiao et al., 2015; Rulli et al., 2018). More recently, a new dimension has emerged that focuses on the consequences of failed or non-operational land deals (Bélair et al., 2024; Borras et al., 2022; Neudert & Voget-Kleschin, 2021). This crucial shift acknowledges that the negative impacts, related to the dispossession of property rights and livelihood disruption, are registered in local communities regardless of whether the investment successfully moves into long-term production.
Focusing on the drivers of LSLAs, in the earlier periods right after 2007/08, largely qualitative studies provided a foundational understanding, attributing the phenomenon to a confluence of structural factors, including globalization and the liberalization of land markets (Zoomers, 2010), shifts in corporate food regimes (Schoneveld, 2014), and increased demand for agricultural commodities driven by population growth (Deininger & Byerlee, 2011). These studies highlighted the role of non-profit motives, such as the push for biofuel demand driven by mandates and subsidies from the developed countries (Zoomers, 2010), and food security concerns in developed countries, with evidence suggesting that nations like Saudi Arabia incentivizing investors in LSLAs that prioritize securing steady food supplies to their nation rather than for domestic market supplies (Arezki et al., 2018; Cotula et al., 2009).
A more recent wave of the literature employs quantitative analysis, relying on the bilateral capital flow framework and the gravity model to empirically identify drivers which are often categorized as push and pull factors. Findings from this approach reveal that pull factors which are recipient country characteristics such as agroecological suitability and the availability of arable land and water resources are the dominant drivers (Arezki et al., 2018; Hirsch et al., 2020). Bilateral variables are also significant drivers, showing that while geographic distance negatively affects acquisitions, former colonial relationships provide a facilitation role in the proliferation of LSLAs (Arezki et al., 2015). Many of these drivers overlap with the drivers of other forms of foreign direct investment (Lay & Nolte, 2018). Furthermore, environmental factors have been considered as important drivers, showing that higher levels of precipitation encourage investment, while climate change and increased carbon dioxide emissions may act as deterrents (Mazzocchi et al., 2021).
Further studies have examined the role of institutional quality and strength in both the recipient and investor countries leading to mixed findings. Some studies argue that investors target recipient countries that have weaker institutions and higher corruption, as this facilitates acquisitions (Arezki et al., 2018; Bujko et al., 2016). Conversely, others suggest that a greater institutional gap between investor and recipient countries deters LSLAs (Raimondi & Scoppola, 2018), while specific institutions like bilateral investment treaties positively driving LSLAs (Anti, 2022). Studies that focus on Africa or Sub-Saharan Africa (SSA) region confirm the importance of availability of arable land and water in the recipient countries are the main drivers (Giovannetti & Ticci, 2016; Kareem, 2018). While weak institutions related to land governance discourage LSLAs which contradicts findings from most of the above studies while confirms the finding from Raimondi and Scoppola (2018). Unlike other studies, Giovannetti and Ticci (2016) indicated that countries with good institutional quality and poor tenure security systems attract more large-scale land acquisitions in biofuel feedstock production.
While these studies improve our understanding of the structural and institutional drivers of LSLAs, they do not address the role of agricultural commodity and food prices in driving the proliferation of LSLAs in regions to the global south, which is the focus of our study. We provide the first empirical estimates for the relationship between agricultural prices and the proliferation of LSLAs.
Conceptual Framework
The demand for agricultural land is a derived demand, depending directly on the demand for agricultural commodities (Hertel, 2011). This derived demand for agricultural land is affected by several factors, primarily changes in prices of agricultural commodities and factors of production alongside with secular trends such as population growth, rising per capita income and the resulting increase in purchasing power, and technological changes (Hertel, 2011). In line with the literature reviewed, the determinants of the flow of LSLAs are categorized into “push” and “pull” elements. Push factors originate in the investor country and motivate the decision to seek land abroad, including population growth, increased per capita food imports, and rising domestic agricultural commodity and food prices. Conversely, pull factors are characteristics of the destination (recipient) country that attract investors, such as favorable agro-ecological conditions (e.g., availability of cultivable land and water resources) and the host countries’ land governance institutions. Figure 1 visually illustrates how these factors influence the flow of LSLAs to the Global South.
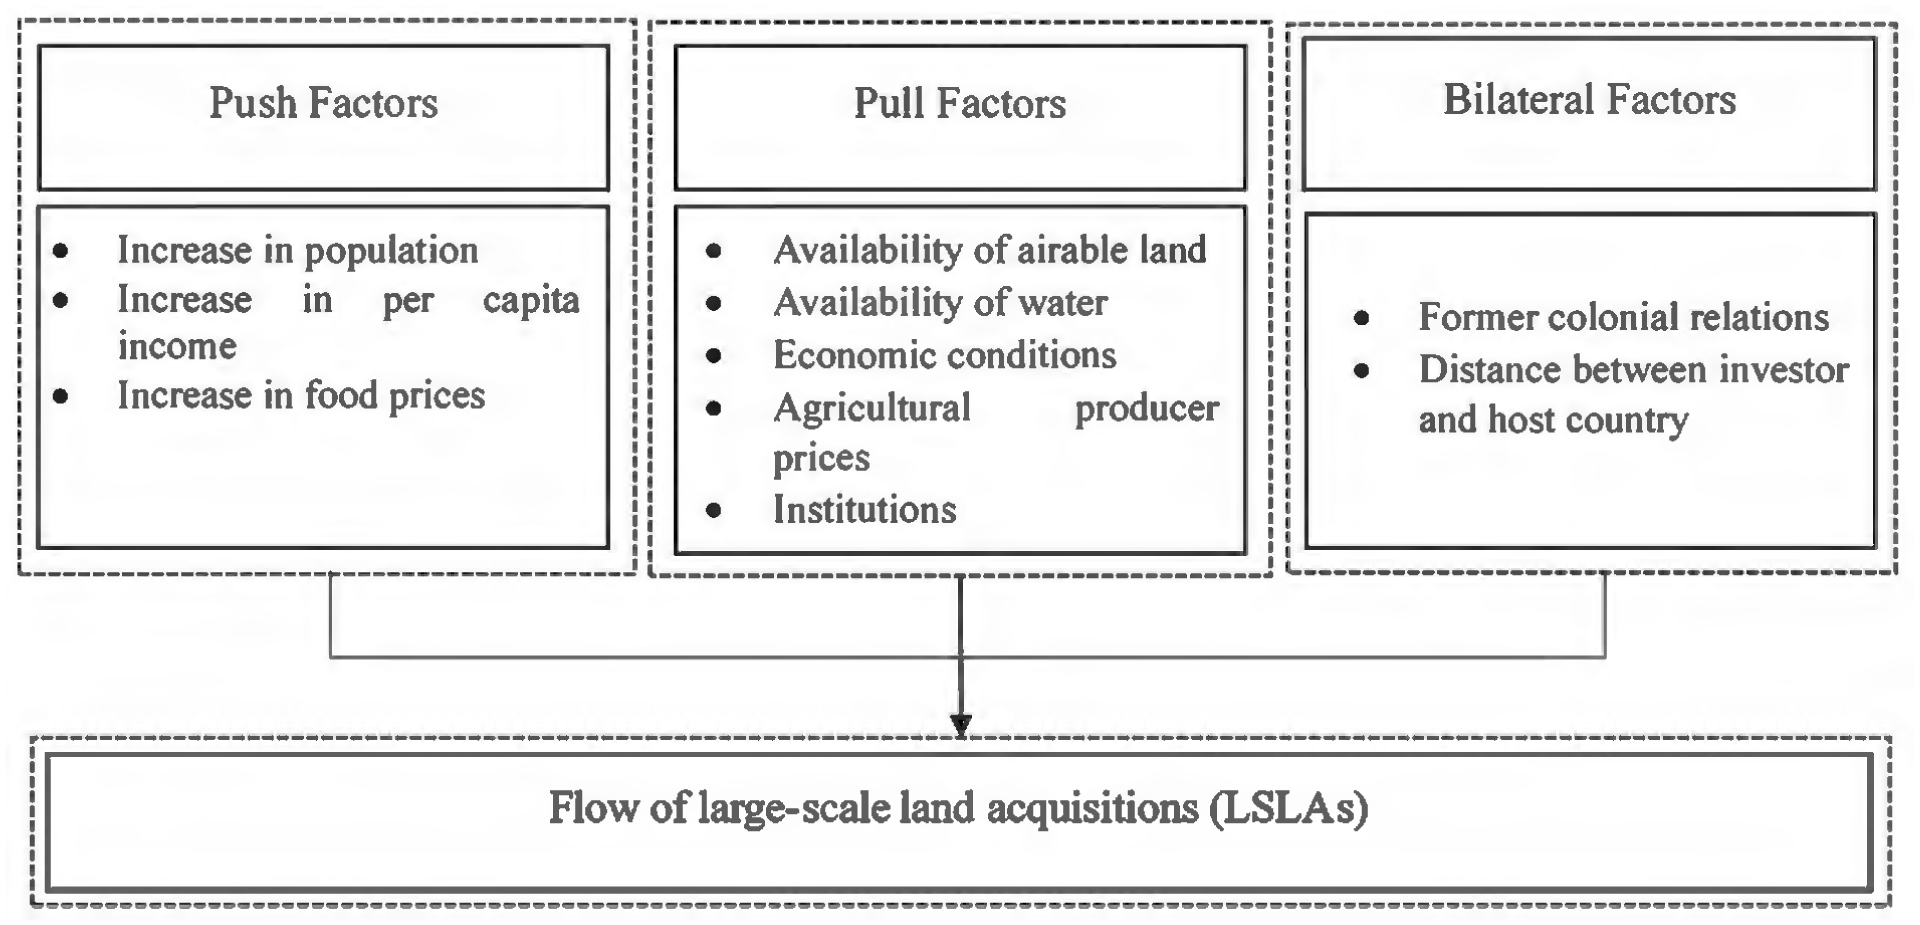
The drivers of the flow of large-scale land acquisitions.
The 2007/2008 global price surge in food and agricultural commodities is considered a turning point because it increased the economic attractiveness of land-based agricultural investments for both public and private capital. Concurrently, governments in many developing countries welcomed these inflows to revitalize their domestic agricultural sector, which had often been neglected as a “sun-set industry” due to underinvestment. The food price crisis simultaneously highlighted developed countries’ vulnerability to food insecurity, prompting them to strategically engage in overseas LSLAs. This context leads directly to our empirical question: Did rising agricultural commodity and food prices drive the land grab?
To analyze the impact of commodity price changes on large scale land acquisitions, we follow the spirit of acreage response theoretical framework, which explains how producers adjust land allocation based on expectations of output prices (Nerlove, 1956). The acreage response theory has been extensively used to establish how producers allocate their land in response to changes in commodity prices. For instance, Hausman (2012) applied the theory to demonstrate how fluctuations in the price of sugarcane and soybean (biofuels) affect the acreage decisions of farmers in Brazil. Similarly, Haile et al. (2016) utilized this framework to model the worldwide acreage and yield response to price change and volatility for major crops, including wheat, rice, corn, and soybeans.
The standard model assumes that producers make acreage decisions based on anticipated prices for outputs which are often proxied by observed prices from previous periods. However, given that LSLAs represent the globalization of farmland often undertaken with the motive of food independence than profit making (Arezki et al., 2018; Cotula, 2012; Zoomers, 2010), the decision to engage in LSLAs is governed by current commodity prices. Therefore, we deviate from the traditional acreage response framework by using current-year price indices to proxy for expected commodity prices in our empirical analysis.
The decision to engage in LSLA is driven by either resource-seeking or market-seeking motives of investors, leading to two sets of hypotheses regarding the influence of prices. Under the resource-seeking motives, we posit that rising food prices or volatility in investor countries will be positively associated with the flow of LSLAs to secure domestic food supply. Furthermore, the flow of LSLAs could be negatively associated with recipient countries’ export prices, as investors seek to minimize costs for re-exporting produce back home. Conversely, in the market-seeking motive we expect a positive association between the flow of LSLAs and recipient countries’ agricultural producer prices, reflecting the investor’s goal to target higher profit margins. Finally, we expect a negative association between the flow of LSLAs and recipient countries’ wage rates, as investors seek to maximize profitability through lower input costs.
Methodology
Data Description
We constructed a bilateral panel dataset covering the period from 2000 to 2020. Each observation in this dataset corresponds to a country pair for each year. The sources and descriptions of all datasets used in the analysis are summarized in Table 1, while Table 2 presents the summary statistics.
Definition of Variables and Sources of Data.

Summary Statistics of the Variables Used in the Analysis.

Large-Scale Land Acquisition Data
The data on land acquisition comes from the Land Matrix Database (Land Matrix Global Observatory, retrieved on 23-10-2023; Land Matrix, 2023). The land matrix is the most comprehensive online database available on large scale land acquisition at a global scale (Nolte et al., 2016). It organizes extensive information on LSLAs that have undertaken verification on the ground by NGOs affiliated with the International Land Coalition (Anseeuw et al., 2012). The land matrix has records for deals associated with transfer of rights to use through sale, lease or concession for more than 200 hectares of land to an investor; initiated after the year 2000 that result a potential conversion of land from smallholder production, local community use or important ecosystem service provision to commercial use. The Land Matrix records land deals starting from the intention when the investor expresses their interest, enters negotiation and when concluded. Our dataset includes deals that are concluded, have at least one investor from a foreign country, and for the purposes of agricultural production such as biofuels, food crops, fodder, and livestock.
We construct a bilateral panel dataset by aggregating the size and number of deals at an investor-recipient country pairs and year level. First, we used the Land Matrix database filtering options such as investor country of registration, recipient country, negotiation status, deal identification (ID) and Operating company/investor ID to identify the deals and investors. If a deal is owned by a group of investors from different countries, the Land Matrix records the entire deal to each country where the investors originate. In this case, we followed Hirsch et al. (2020) and Anti (2022) and divide the deals equally among investor countries. This approach helps to avoid upward bias in the deals and keep the bilateral flow of land acquisitions among countries. For instance, a group of investors from China and Thailand acquired 9,400 ha of land in Cambodia in 2006. The Land Matrix recorded this deal as 9,400 ha for each of the investor countries: China and Thailand with deal ID 67 and operating company/investor ID 34845. If we keep this deal for both countries, the data will be biased upward. Thus, we split the deal equally and assigned 4,700 ha for each of the investor countries. Second, to construct the bilateral panel dataset, we aggregated the deals concluded in the same year, considering the bilateral flow from investor to recipient countries. Following Lay and Nolte (2018) and Hirsch et al. (2020), we restrict the sample of recipient countries to non-high-income countries based on World Bank categorization in 2000 when the record in the flow of LSLAs is started by the land matrix initiative. This has two benefits. First, it helps to indicate how changes in prices affect the flow of LSLAs to low-income countries. The second is a methodological advantage, it helps to reduce the number of zero records in our dataset which have estimation challenges.
Figure 2 demonstrates the origin and destination of LSLAs and Table 3 illustrate the size and number of deals in our database by recipient and investor countries. The land matrix recorded 65 million hectares of 2,200 deals, used for the purposes of agricultural production, concluded between 2000 and 2020 (Land Matrix, 2023). However, some of the deals do not have year information in which the contract is signed. Thus, our sample contains 52.95 million hectares of land (92% of the total size) for LSLAs involving 1,676 deals (76.2% of the deals) signed between 2000 and 2020 flowing from 82 investor countries to 80 recipient countries (list of investor and recipient countries are provided in Table A3 in the Appendix). The majority of the deals occur in countries in the Europe and Central Asia (ECA), Sub-Saharan Africa (SSA), and Latin America and the Caribbean (LAC) regions (Figure 2 and Table 3). Investors mainly originate from countries in Europe and Central Asia (ECA), East Asia and the Pacific (EAP), and North America (NA) regions (Figure 2 and Table 3).

Distribution of LSLA deals concluded from 2000 to 2020 by investor and recipient countries.
Summary Statistics of LSAI Deals by Regions of Investor and Recipient Countries.

Note. SSA = Sub-Saharan Africa; LAC = Latin America and the Caribbean; MENA = Middle East and North Africa; SA = South Asia; EAp = East Asia and Pacific; ECA = Europe and Central Asia; NA = North America.
Panel A of Figure 3 demonstrates the cumulative trend of LSLAs over time. We observe that the flow of LSLAs steadily increased over the years from 2006 to 2010 and since then the number of deals recorded every year has slowed down. The slowdown after 2010 might be due to the increased scrutiny of land deals following the 2007/08 economic crisis which might have discouraged reporting (Arezki et al., 2018). Panel B of Figure 3 shows the allocation of global agricultural investment deals to different production types. A larger proportion of agricultural deals are acquired for production of food crops followed by livestock.

Cumulative number of LSLA deals concluded from 2000 to 2020 (Panel A) and proportion of LSLAs allotted to different production.
Price Data
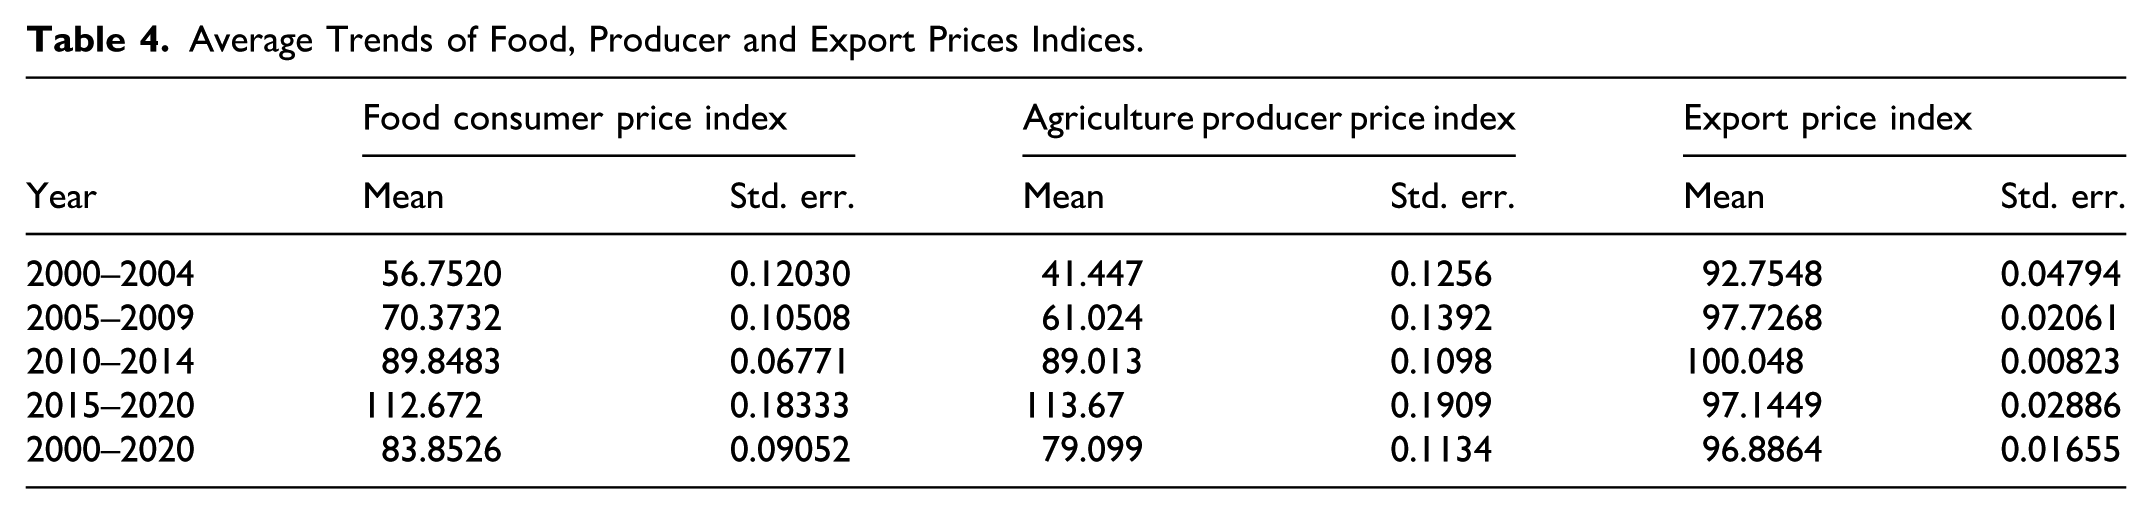
To examine whether the proliferation of large-scale land acquisition is driven by changing prices, we use consumer, producer, export and input prices. As a proxy for consumer price, we utilize the food Consumer Price Index (CPI). The UN-FAO provides two forms of CPI: a general CPI and a food-specific CPI. The general CPI measures the average change over time in prices paid by consumers for a broad range of goods and services while the food CPI specifically tracks changes in the price of a basket of food items (including cereals, meat, dairy, fruits, vegetables, oils, and sugar). Given claims that the surge in LSLAs during the 2007/2008 economic crisis was linked to fluctuations in food prices, we use the food CPI (using the year 2015 as a base) in our analysis. We proxy agricultural producer price by overall agricultural producer price index. The UN-FAO categorizes producer price index into three types: single-item price index, commodity group price index, and the overall agriculture producer price index. The producer price index measures the average annual change in the selling prices received by farmers for primary agricultural products, such as crops and livestock. For our analysis, we focus on the overall agriculture producer price index (using the years 2014–2016 as a base) as the majority of land deals are allocated to crop and livestock production (see Figure 3). We also used a country level commodity export price index from the IMF. The commodity export price index (using the years 2012 as a base) for each country is computed from the change in the international price of up to 45 individual commodities weighted by ratio of exports to GDP (Kebhaj & Suhaib, 2019). Table 4 presents the 5-year average trends of the three price indices from the year 2000 to 2020.
Average Trends of Food, Producer and Export Prices Indices.
We used labor wages sourced from the International Labor Organization (ILO) as a proxy for input prices. The ILO provides annual wage data on metrics such as average monthly earnings of employees and the labor income share as a percentage of GDP. While average monthly earnings of employees would best represent production costs, this dataset suffers from significant missing values. For example, average monthly earnings of employees are unavailable for 15 of the LSLA recipient countries in our dataset. Consequently, we used labor income share of GDP as a proxy for wage rates in our analysis. Labor income includes compensation for employees and a portion of the income of self-employed individuals. The labor income of the self-employed is calculated based on a statistical analysis of employees with similar characteristics, excluding any income from their capital. Labor income share of GDP represents the portion of GDP attributed to labor compensation, as opposed to the share that accrues to capital in any given year.
Econometric Model
We develop the empirical model to estimate how price changes affect LSLA flows by following the gravity model of bilateral trade and investment flows and complementing it with the spirit of the acreage response theory. Theoretically, the model specifies the flow of investments,

where
The use of the gravity model within a bilateral panel data offers key benefits. First, it allows incorporating country pair fixed effects which helps to control for time invariant factors influencing investment flows. This helps to isolate the effect of time varying factors such as price changes on LSLA flows. In addition, fixed effects help reduce the problem of endogeneity bias by accounting for unobserved heterogeneity within each country pair, enhancing the validity of the estimates (Baier & Bergstrand, 2007; Fally, 2015).
The traditional approach to estimating the gravity equation, as specified in Equation 1, is to use OLS after transforming the equation into a linear form using logs. However, in this case, the dependent variable is the size of land deals in hectares and the number of completed deals. Since deals do not always happen to all the affected countries, the dependent variable contains a large proportion of zeros. This makes the OLS estimator problematic, as the absence of LSLA flows causes the dependent variable to be zero-a common occurrence to our data-which makes log transformation impossible. Even when all values of the dependent variable are positive, log-linearization can violate the consistency assumption which is a prerequisite for applying an OLS estimator (Silva & Tenreyro, 2006). Given the nature of our dependent variable, a more suitable approach is to use maximum likelihood-based estimators such as the Poisson pseudo-maximum likelihood (PPML).
The Poisson Pseudo-Maximum Likelihood estimator (PPML) is consistent under the weaker assumption of correct specification of the conditional mean, meaning that the data do not need to strictly follow Poisson distribution to apply PPML (Cameron & Trivedi, 2005). In their seminal work, “the log of gravity”Silva and Tenreyro (2006) recommended using PPML to estimate constant elasticity regression models. Although initially developed to estimate gravity models of trade flows, it has since been applied in a broad range of economic applications (Santos Silva & Tenreyro, 2022). The advantage of the PPML over OLS estimator is that it produces efficient and consistent estimates in the presence of heteroscedastic errors and large proportion of zeros in the dependent variable-both conditions that can lead to inconsistent and biased OLS estimates (Silva & Tenreyro, 2006). PPML directly estimates the nonlinear form of the gravity model without dropping zero flows of LSLAs. In recent literature that seeks to identify the drivers of large-scale agricultural acquisitions, application of PPML has become a common practice.
Following the basic work of Silva and Tenreyro (2006) and recent studies such as Anti (2022), Arezki et al. (2018), Lay and Nolte (2018) and others, we apply the PPML to estimate the effect of prices changes on the flow of LSLAs. Additionally, since the error terms in gravity model specifications is likely to be correlated with in country pairs, which could lead to underestimated standard errors, all estimates cluster standard errors at country pair-level (Shepherd, 2016). Moreover, to take into account the potential bias that could arise from functional misspecification, we followed Silva and Tenreyro (2006).
To apply PPML estimator, the gravity model in Equation 1 could be re-specified as follows;

where
In the acreage response literature, a lagged acreage variable is included as an explanatory variable to account for the inertia in switching from one crop to another, which involves adjustment costs (Lin & Dismukes, 2007). In our model, however, we included it to capture the momentum effect driven by media attention on LSLA flows. The lagged acreage variable reflects the carry-over of media coverage from 1 year to the next, meaning that the increased information about LSLAs in the previous years could stimulate a higher flow of LSLAs in the current year. However, this approach introduces an estimation challenge. The PPML estimator provides consistent estimates of constant elasticities without requiring log transformation of the dependent variable, allowing the inclusion of zero values. However, the explanatory variables should be transformed into logs except dummy variables. In this case, the introduction of the lagged dependent variable with a large number of zero creates a challenge in transforming the values into logs. We address this by adding a very small constant to zero values in the lagged variable. In this case, however, one should be cautious during the interpretation of the results as the explanatory variable is not exactly the log of the lagged dependent variable.
Results and Discussion
Effect on the Extensive Margin
Table 5 presents the Poisson pseudo-maximum likelihood (PPML) estimation results, using the number of LSLA deals as a dependent variable, measuring the effect of prices on LSLA flows at the extensive margin. As our model in Equation 2 is specified as a constant elasticity regression framework, the coefficients are interpreted as elasticities when the independent variables are in logarithmic terms and semi elasticities when independent variables expressed in level terms. Columns 1, 2, and 3 show baseline regression results using the agricultural producer price of recipient countries, food price of investor countries and export price of recipient countries as an independent variable individually, respectively. In Column 4, we extend the baseline model by including both producer and food prices as an independent variable simultaneously. Columns 5 to 8 extends the results presented in 1 to 4 by including a battery of covariates.
Poisson Pseudo Maximum Likelihood Estimation on the Number of LSAI Deals.
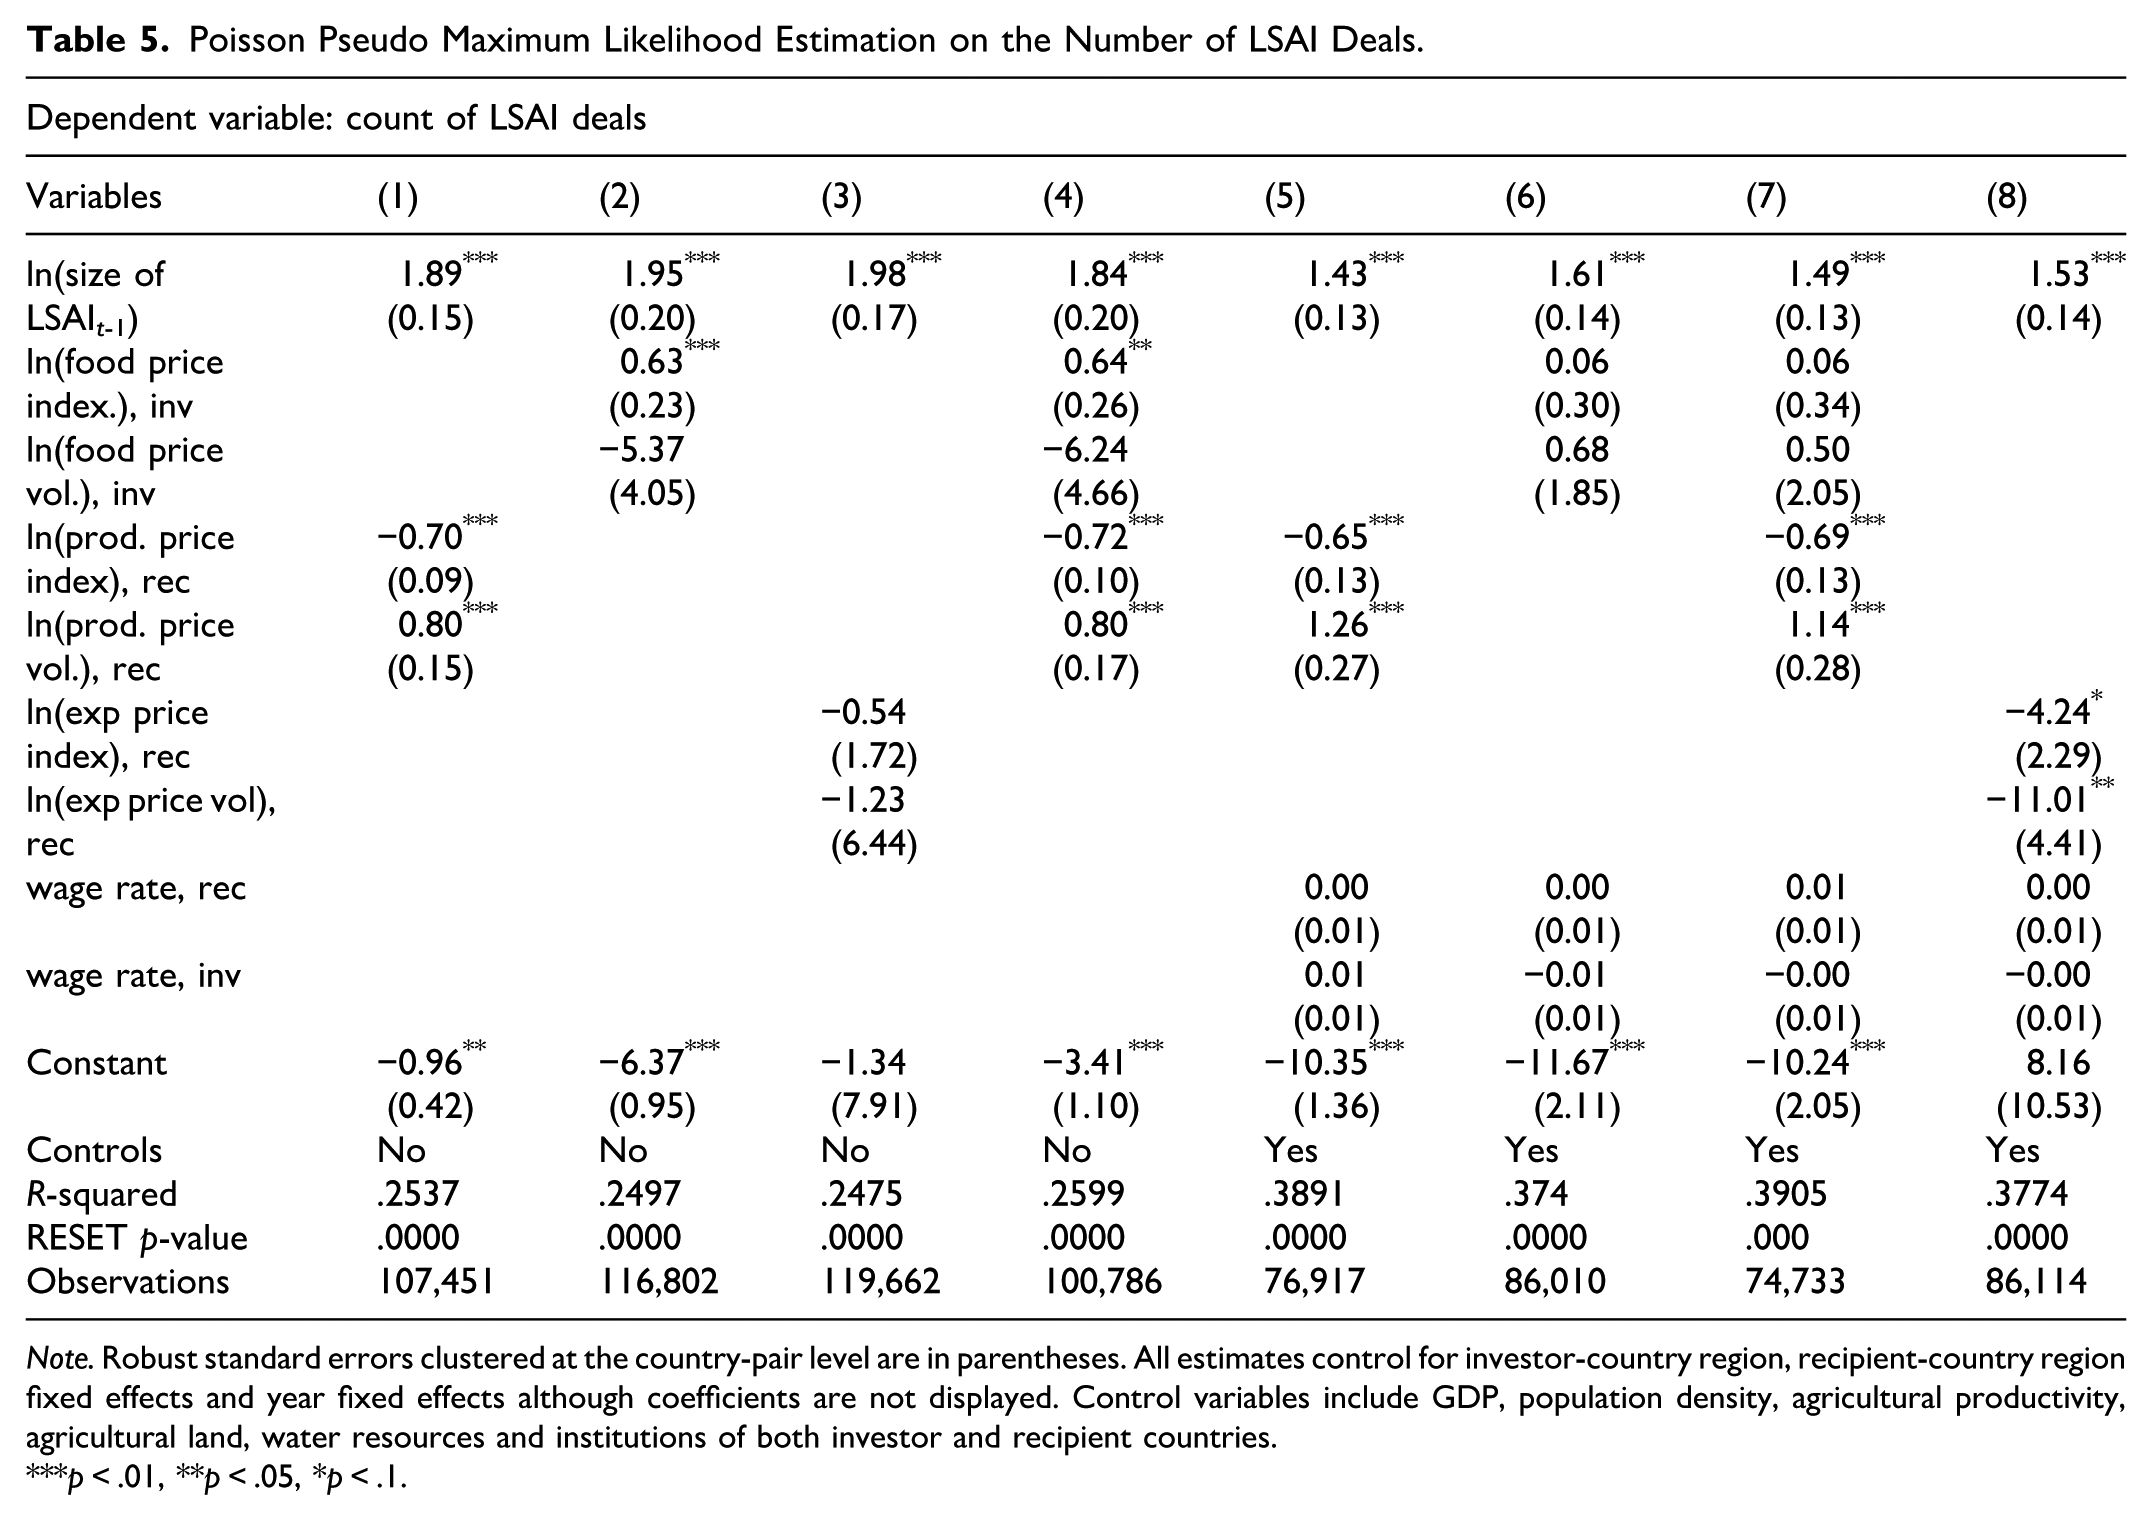
Note. Robust standard errors clustered at the country-pair level are in parentheses. All estimates control for investor-country region, recipient-country region fixed effects and year fixed effects although coefficients are not displayed. Control variables include GDP, population density, agricultural productivity, agricultural land, water resources and institutions of both investor and recipient countries.
p < .01, **p < .05, *p < .1.
In line with the expectations, we find a positive association between the flow of LSLAs and food prices in investor countries, indicating that an increase in food prices in the investor countries encourage the flow of LSLAs to recipient countries. The coefficient suggests that, all else being equal, a 10% increment in food prices in investor countries results in a 6.3% increase in the number of deals. This finding supports our hypothesis of a positive association of food prices and LSLA flows. The observed positive association could imply that investors target host countries to ensure the food security needs of their home countries. However, it is worth noting that this effect dissipates in the fully specified model in columns 6 and 7. Besides, we observe no significant association between food price volatility and the number of LSLA deals.
The coefficient for agricultural producer price in recipient countries is negative and statistically significant, indicating that increase in producer price decreases the number of LSLAs. Specifically, the coefficient suggests that, all else being equal, a 10% increase in agricultural producer prices in recipient countries results in a 6.5 to 7.2 percentage point decrease in the flow of LSLAs. This finding suggests that investors target host countries with lower agricultural producer prices, contradicting the hypothesis that profit maximization drives a positive association between producer prices and the flow of LSLAs. The negative association may indicate that profit maximization is not the sole driver of large-scale land acquisitions. Instead, investors may also be motivated by food security and resource access goals. Conversely, we find a positive association between producer price volatility and the flow of LSLAs. This suggests that fluctuations in producer price serve as a pull factor, attracting to environments with higher price uncertainty. This could be due to opportunities for speculative gains available to investors in the domestic market.
The results further indicate that the coefficients for both export commodity price and export commodity price volatility are negative, suggesting that investors target countries with lower export commodity prices. This finding may indicate that investors place less emphasis on the level of export prices when deciding to engage in LSLAs, aligning more closely with the food independence motive rather than a profit maximization objective. We initially hypothesized that if the intention of LSLAs is profit maximization-aiming to export their produce to available markets- there would be a positive association between export prices in the recipient countries and flow of LSLAs. In such cases, investors would be expected to target countries with higher export price to maximize returns. However, the observed negative association challenges this hypothesis, reinforcing the notion that LSLA investors are motivated by securing food supplies rather than direct profit opportunities. Regarding the input prices, proxied by wage rates, the analysis did not reveal a significant association with the flow of LSLAs.
Effect on the Intensive Margin
Table 6 presents results of the PPML estimation using the size of LSLA deals as the dependent variable. Regression results in Tables 5 and 6 indicated that the results are robust to alternative definitions of the dependent variable. Regarding the effect of prices, agricultural producer prices appear to be an important determinant of LSLA flows. The coefficients of agricultural producer prices (ranging from 0.45 to 0.77 in absolute terms) are consistent in magnitude and sign with those obtained when the dependent variable is measured in count of LSLAs (Table 5). For agricultural producer price volatility, the results mirror those in Table 5, showing a positive association between producer price volatility the flow of LSLAs. This suggests that investors in large scale agricultural land target host countries with higher producer price volatility.
Poisson Pseudo Maximum Likelihood Estimation on the Size of LSAI Deals.

Note. Robust standard errors clustered at the country-pair level are in parentheses. All estimates control for investor-country region, recipient-country region fixed effects and year fixed effects although coefficients are not displayed. Control variables include GDP, population density, agricultural productivity, agricultural land, water resources and institutions of both investor and recipient countries.
p < .01, **p < .05, *p < .1.
Likewise, the food price shows a positive coefficient similar to the results in Table 5, despite the effects dissipate in the full specification models. Regarding export price in the recipient countries, the coefficient turns out to be insignificant, suggesting that commodity export prices do not significantly influence LSLA flows on the intensive margin. The relationship between wage rate of investor countries and LSLAs is positive, indicating that rising production costs in the investor countries serve as a push factor for LSLA flows. However, wage rate in the recipient countries is not statistically significant, suggesting that local labor costs may not play a significant role in attracting LSLAs. This may be attributed to the fact that LSLAs are capital intensive often involving mechanization with less labor requirements. In this regard, evidence suggests that the net employment effect of LSLAs on land formerly used by smallholders is negative with a rather significant employment loss (Nolte & Ostermeier, 2017)
The lagged dependent variable is introduced to see if the increased media coverage on LSLAs, which also represent greater information about LSLAs, affected the flow via the media carry over effect. During the 2007/2008 period where large scale land acquisitions picked, there was a heated argument on the effect of LSLAs among human right activists and the media who coined large scale land acquisitions, especially in the global south, as land grabs (Edelman et al., 2013; Borras & Franco, 2012; Pearce, 2012; The Economist, 2009). Deininger and Byerlee (2011) showed that media reports about foreign land acquisition start to increase at the time of the 2007/08 commodity price boom. Likewise, the results in Tables 5 and 6 demonstrate a positive association between the lagged dependent variable and LSLA flows. The result shows that the media carry over from 1 year to the other affected the flow of LSLAs positively.
Generally, our findings reveal that the impact of different price on the flow of LSLAs are similar across the intensive and extensive margins. Among the different prices considered, agricultural producer price emerges as the main driver for the flow of LSLAs. These results are consistent with our hypothesis that LSLAs are mainly driven by the food independence motive rather than profit maximization. The notion that these investments are driven by food security concerns of investor countries aligns with the observed surges in LSLA flows following the 2007/2008 global food price crisis. For instance, countries with limited domestic food production capability implement policies and incentive to encourage investors to engage in overseas agricultural production, with the aim of ensuring food supplies for their population (Cotula et al., 2009). Furthermore, evidence indicates that countries investing in LSLAs are also significant grain importers (Lu et al., 2018), highlighting the role of food security as the main driver.
The Effect of Other Variables
We included control variables to align our results with the previous research on the determinants of LSLAs. These controls are variables specific to investor and recipient countries, such as GDP, population density, agricultural land, water resource availability, agricultural productivity, institutions and gravity variables such as distance and colonial relationship are included in our estimation model. The coefficients of these control variables are presented in the appendix. Specifically, Table A1 presents the results using the number of LSLAs as the dependent variable, while Table A2 uses the size of LSAI deals. Economic size, proxied by GDP, is important drivers of LSLAs, consistent with findings from Hirsch et al. (2020), Lay and Nolte (2018), and Mazzocchi et al. (2021). We find that recipient country GDP is negatively associated with LSLA flows, suggesting that lower recipient economies are attractive for LSLAs. Conversely, investor country GDP is positively related with the flow of LSLAs, indicating that larger economies are more likely to invest in foreign land. Regarding population density, we find a positive association of recipient countries population density and the flow of LSLAs. Arezki et al. (2018) also indicate that LSLAs target countries with larger population sizes. Resource endowment such as availability of suitable agricultural land and water are the main drivers of LSLAs (Hirsch et al., 2020; Lay & Nolte, 2018; Mazzocchi et al., 2021). Our findings also confirm that countries with abundant water resources and agricultural land are more attractive for LSLAs. Regarding institutional quality, we constructed a composite measure of governance following Lay and Nolte (2018) based on the six World Governance Indicators. This index is scaled between 0 (good governance) and 1 (poor governance). We found that weaker institution is associated with higher LSLA flows, aligning with Bujko et al. (2016). This suggests that investors may target countries with weaker regulatory environments. Finally, our results confirm the expected impact of gravity variables: distance negatively affects the flow of LSLAs, while colonial ties positively influence the flow of LSLAs.
Robustness Check
To ensure the robustness of our results, we employed various model specifications. Following previous studies such as Lay and Nolte (2018), we conducted robustness check by restricting the sample data in to two ways: first, to the size of operational deals, and second, to land deals that exclude very large projects (deals with more than 10,000 ha). The results are presented in Tables 7 and 8. The first specification focuses on operational deals, which are defined in the startup or in production phase as reported by the Land Matrix. The findings of this analysis are consistent with the full sample results on the sign and coefficients of agriculture producer price and food price.
PPML Estimation on the Size of Operational LSAI in ha.

Note. Robust standard errors clustered at the country-pair level are in parentheses. All estimates control for investor-country region, recipient-country region fixed effects and year fixed effects although coefficients are not displayed. Control variables include GDP, population density, agricultural productivity, agricultural land, water resources and institutions of both investor and recipient countries.
p < .01, **p < .05, *p < .1.
PPML Estimation on the Size of LSAI Less Than 10,000 ha.

Note. Robust standard errors clustered at the country-pair level are in parentheses. All estimates control for investor-country region, recipient-country region fixed effects and year fixed effects although coefficients are not displayed. Control variables include GDP, population density, agricultural productivity, agricultural land, water resources and institutions of both investor and recipient countries.
p < .01, **p < .05, *p < .1.
Similarly, the sub-sample analysis that excludes very large deals also aligns with the results of the full sample. Notably, we find a positive and statistically significant association between the food price in investor countries and the flow of LSLAs. This result suggests that food prices are the main drivers of smaller LSLA deals. The non-significant result of food prices in the full specification model indicates that larger LSLA deals are less sensitive to fluctuations in the consumer price index of the investor’s home country. This suggests that food security or profit maximization may not be the sole drivers behind the proliferation of large-scale land deals. Following the 2007/2008 global food price crisis, the financialization and commercialization of agricultural land have led investors to increasingly view land as a speculative asset—used as a hedge against market volatility or as an appreciating asset—rather than purely a factor of production (Bélair et al., 2024; Neudert & Voget-Kleschin, 2021). This indicates that larger land deals are often driven by complex, diversified motives, including financial speculation on land price appreciation, hedging against commodity price volatility and investment in non-food production, such as biofuel cultivation (Bruna et al., 2025; Neudert & Voget-Kleschin, 2021). These non-food and speculative drivers could explain why the largest investments are less responsive to specific food price changes in investor countries. Consequently, excluding these larger-deals from analysis enables a clearer examination of the relationship between food price in the investor countries signaling food independence motive of investors in smaller deals for more focused food production projects.
Conclusion
A recent proliferation in large scale land acquisitions (LSLAs) has been linked with the increase in agricultural commodity and food prices following the 2007/2008 economic crises (Deininger & Byerlee, 2011; Edelman et al., 2013). This study examined the relationship between price dynamics and the flow of LSLAs across 82 investor and 80 recipient countries between 2000 and 2020, leveraging a bilateral panel gravity model. The model incorporates investor and recipient country fixed effects, along with time-fixed effects, for robust estimation using a pseudo-maximum likelihood (PPML) estimator.
Our findings reveal that the effect of food price on the flow of LSLAs differ based on the size of LSLA deals. Food price is one of the main drivers for smaller LSLA deals than larger deals. This suggests that food independence or profit maximization may not be the only drivers behind the proliferation of large-scale land deals. Neudert and Voget-Kleschin (2021) and Bélair et al. (2024) pointed out that investors engage in LSLAs from the speculative motive. Following the 2007/2008 global food price crisis, the financialization and commercialization of agricultural land have led investors to increasingly view land as a speculative asset rather than purely a factor of production (Bélair et al., 2024; Neudert & Voget-Kleschin, 2021). This indicates that larger land deals are often driven by diversified motives, including financial speculation on land price appreciation, hedging against commodity price volatility and investment in non-food production, such as biofuel cultivation (Bruna et al., 2025; Neudert & Voget-Kleschin, 2021). These non-food and speculative drivers could explain why the largest investments are less responsive to specific food price changes in investor countries. Consequently, excluding these larger-deals from analysis enables a clearer examination of the relationship between food price in the investor countries signaling food independence motive of investors in smaller deals for more focused food production projects. The result further corroborates previous literature that LSLAs are driven by the food independence motive of investor countries than profit maximization motive. Contrary to expectations, we find that agriculture producer prices and LSLAs exhibit a statistically significant negative relationship, indicating that agricultural producer prices in recipient countries emerge as the main driver for the flow of LSLAs. This finding confirms that investors are primarily targeting low-cost production environments than higher producer prices that could maximize their returns. This implies that LSLAs prioritize to secure food supplies and access cheap production factors for their home countries, fundamentally reinforcing the food independence motive over the profit-maximization goal. The notion that these investments are driven by food security concerns of investor countries aligns with the observed surges in LSLA flows following the 2007/2008 global food price crisis. For instance, countries with limited domestic food production capability implement policies and incentive to encourage investors to engage in overseas agricultural production, with the aim of ensuring food supplies for their population (Cotula et al., 2009). Furthermore, evidence indicates that countries investing in LSLAs are also significant grain importers (Lu et al., 2018), highlighting the role of food security as the main driver.
These results contribute to the ongoing debate regarding the primary drivers of LSLAs. While previous literature documented economic size and resource availability as a potential motivator of LSLAs, our study offers empirical evidence suggesting that food prices, agricultural producer prices and commodity export prices as the drivers of LSLAs. Specifically, our results demonstrate the importance of examining deal size heterogeneity. By showing that price sensitivities differ significantly across deal size, we provide an empirical roadmap for future research to avoid treating all LSLA deals together. The smaller deals which are price sensitive align with the food security narrative, while the large deals defy this simple explanation, suggesting a mix of biofuel, or purely financial diversification drivers that deserve separate modeling.
The findings of this study have important implications for countries affected by the socio-economic impacts of land deals. The findings reveal that LSLAs are primarily attracted by the food independence motive of investor countries rather than production for domestic markets underscoring the need for targeted land governance in recipient countries. Policy makers could include a mandated volume of the produce for the local market. Further, regulation should refocus from promoting investment volume to critically screening investment motives. Specifically, policymakers could deter speculative, large-scale deals through tight land-based investment contractual governance that incorporate mandates of productive output that could make land retention for speculation less attractive. Finally, the negative correlation with recipient country producer prices highlights the vulnerability of local producers. To protect smallholders and enhance food security, recipient countries need stronger safeguards and clear land-use planning to ensure investments benefit the local economy, rather than solely exporting produce to investor countries.
The limitation of this study stems from the data on LSLAs. This study relies on the Land Matrix database, which is widely used for LSLA research (see e.g., Anti, 2022; Arezki et al., 2018; Lay & Nolte, 2018). While the land matrix is the most comprehensive online database available on large scale land acquisition which organizes extensive information that has undertaken verification on the ground by NGOs affiliated with the International Land Coalition (Anseeuw et al., 2012), some limitations exist. The first limitation is related to timeliness of LSLA data. Large scale land deals take time to be publicly known and verified on the ground (Nolte et al., 2016). This could lead to underestimation, particularly for recent years. The second is, there has been an intense scrutiny on the land deals by civil societies following the 2007/08 economic crisis (Arezki et al., 2018). This might have discouraged reporting of deals, potentially impacting data completeness after 2007/2008 economic crisis. The third limitation is related to geographical coverage of LSLA deals. The land matrix didn’t record land deals in Northern, industrialized countries - the European Union, Northern America, Australia, and New Zealand – where significant land deals have been documented during the past two decades (Borras et al., 2022). These limitations suggest a potential underestimation of LSLA activity, which could influence the observed relationships between prices and large-scale land acquisitions.
Footnotes
Appendix
List of Investor and Recipient Countries.

| Country name | Iso3ccountry codes | As investor | As recipient | ||
|---|---|---|---|---|---|
| Size in ha | Number of deals | Size in ha | Number of deals | ||
| Angola | AGO | 15,450 | 1 | 90,102 | 7 |
| United Arab Emirates | ARE | 344,366.1 | 21 | 1,561,416 | 57 |
| Argentina | ARG | 429,409.5 | 32 | 1,561,416 | 57 |
| Australia | AUS | 43,356 | 3 | 0 | 0 |
| Austria | AUT | 51,293.33 | 4 | 0 | 0 |
| Belgium | BEL | 121,306.3 | 11 | 0 | 0 |
| Benin | BEN | 0 | 0 | 10,000 | 2 |
| Burkina Faso | BFA | 0 | 0 | 2,000 | 1 |
| Bangladesh | BGD | 2,300 | 1 | 0 | 0 |
| Bulgaria | BGR | 0 | 0 | 163,615.8 | 23 |
| Belize | BLZ | 15,805 | 2 | 8,000 | 1 |
| Bermuda | BMU | 14,583.28 | 4 | 0 | 0 |
| Bolivia | BOL | 0 | 0 | 21,955 | 2 |
| Brazil | BRA | 248,752.8 | 8 | 3,310,451 | 93 |
| Barbados | BRB | 11,735.9 | 1 | 0 | 0 |
| Central African Republic | CAF | 0 | 0 | 14,018 | 2 |
| Canada | CAN | 798,165.8 | 29 | 0 | 0 |
| Switzerland | CHE | 5,967,043 | 60 | 0 | 0 |
| Chile | CHL | 0 | 0 | 107,690.5 | 17 |
| China | CHN | 2,114,640 | 99 | 160,817 | 6 |
| Cameroon | CMR | 0 | 0 | 323,855 | 8 |
| Congo, Democratic Rep. of the | COD | 0 | 0 | 558,951.9 | 13 |
| Congo, Rep. of the | COG | 0 | 0 | 479,000.1 | 11 |
| Colombia | COL | 0 | 0 | 220,236 | 26 |
| Costa Rica | CRI | 17,570 | 2 | 8,816 | 4 |
| Cuba | CUB | 0 | 0 | 5,000 | 1 |
| Cayman Islands | CYM | 239,578.9 | 8 | 0 | 0 |
| Cyprus | CYP | 4,660,349 | 167 | 0 | 0 |
| Czech Republic | CZE | 6,736 | 5 | 0 | 0 |
| Germany | DEU | 574,601.2 | 47 | 0 | 0 |
| Djibouti | DJI | 10,000 | 1 | 0 | 0 |
| Denmark | DNK | 133,081.5 | 23 | 0 | 0 |
| Algeria | DZA | 0 | 0 | 1,295 | 1 |
| Egypt | EGY | 17,782.09 | 4 | 155,620 | 6 |
| Spain | ESP | 191,587 | 13 | 0 | 0 |
| Estonia | EST | 10,740 | 1 | 0 | 0 |
| Ethiopia | ETH | 2,000 | 1 | 708,578.7 | 57 |
| Finland | FIN | 882,084.7 | 12 | 0 | 0 |
| France | FRA | 616,646.2 | 41 | 0 | 0 |
| Gabon | GAB | 0 | 0 | 1,060,131 | 8 |
| United Kingdom | GBR | 2,455,097 | 108 | 0 | 0 |
| Georgia | GEO | 0 | 0 | 10,542 | 4 |
| Ghana | GHA | 78,713.5 | 3 | 420,212.5 | 40 |
| Gibraltar | GIB | 121 | 1 | 0 | 0 |
| Guinea | GIN | 0 | 0 | 188,630 | 4 |
| Guinea-Bissau | GNB | 0 | 0 | 2,964 | 2 |
| Greece | GRC | 15,594 | 1 | 0 | 0 |
| Guatemala | GTM | 13,000 | 2 | 28,291 | 4 |
| Guyana | GUY | 0 | 0 | 1,382,691 | 6 |
| Hong Kong | HKG | 1,060,207 | 20 | 0 | 0 |
| Honduras | HND | 0 | 0 | 4,264 | 1 |
| Croatia | HRV | 2,300 | 2 | 0 | 0 |
| Hungary | HUN | 10,321 | 2 | 0 | 0 |
| Indonesia | IDN | 1,788,555 | 46 | 2,574,806 | 135 |
| India | IND | 0 | 0 | 3,642 | 1 |
| Ireland | IRL | 13,089 | 8 | 0 | 0 |
| Iraq | IRQ | 15,240.09 | 1 | 0 | 0 |
| Iceland | ISL | 270 | 1 | 0 | 0 |
| Israel | ISR | 53,797.21 | 15 | 0 | 0 |
| Italy | ITA | 709,746.5 | 26 | 0 | 0 |
| Jamaica | JAM | 0 | 0 | 18,000 | 1 |
| Japan | JPN | 4,005,981 | 33 | 0 | 0 |
| Kenya | KEN | 51,488.75 | 7 | 249,354 | 6 |
| Cambodia | KHM | 0 | 0 | 459,627.5 | 59 |
| South Korea | KOR | 521,736.9 | 16 | 0 | 0 |
| Kuwait | KWT | 21,206.09 | 2 | 0 | 0 |
| Laos | LAO | 0 | 0 | 264,599.9 | 16 |
| Lebanon | LBN | 127,457 | 5 | 0 | 0 |
| Liberia | LBR | 0 | 0 | 1,118,987 | 10 |
| Libya | LBY | 29,950 | 3 | 0 | 0 |
| Liechtenstein | LIE | 22,064.25 | 2 | 0 | 0 |
| Sri Lanka | LKA | 44,595.58 | 3 | 0 | 0 |
| Lithuania | LTU | 151,523 | 6 | 4,650 | 1 |
| Luxembourg | LUX | 527,839.2 | 44 | 0 | 0 |
| Morocco | MAR | 0 | 0 | 1,572 | 2 |
| Moldova | MDA | 0 | 0 | 42,300 | 2 |
| Madagascar | MDG | 0 | 0 | 562,022 | 11 |
| Mexico | MEX | 42,756 | 5 | 6,396 | 1 |
| Mali | MLI | 0 | 0 | 116,045 | 6 |
| Malta | MLT | 4,700 | 0 | 0 | 0 |
| Myanmar | MMR | 0 | 0 | 325,549.8 | 10 |
| Mongolia | MNG | 0 | 0 | 270 | 1 |
| Mozambique | MOZ | 0 | 0 | 967,708.5 | 65 |
| Mauritania | MRT | 0 | 0 | 2000 | 1 |
| Mauritius | MUS | 208,201.3 | 10 | 500 | 1 |
| Malawi | MWI | 0 | 0 | 19,034 | 5 |
| Malaysia | MYS | 2,787,973 | 83 | 288,825.5 | 2 |
| Namibia | NAM | 0 | 0 | 1,264 | 3 |
| Niger | NER | 0 | 0 | 1,500 | 1 |
| Nigeria | NGA | 0 | 0 | 128,932 | 16 |
| Nicaragua | NIC | 5,000 | 1 | 49,925 | 13 |
| Netherlands | NLD | 2,874,500 | 81 | 0 | 0 |
| Norway | NOR | 290,699.7 | 18 | 0 | 0 |
| New Zealand | NZL | 23,231 | 10 | 0 | 0 |
| Pakistan | PAK | 1,000 | 1 | 4,050 | 1 |
| Panama | PAN | 23,418.67 | 5 | 2,809 | 1 |
| Peru | PER | 425 | 1 | 159,848 | 16 |
| Philippines | PHL | 3,200 | 1 | 13,430 | 5 |
| Papua New Guinea | PNG | 0 | 0 | 3,459,082 | 28 |
| Poland | POL | 2,563 | 1 | 0 | 0 |
| North Korea | PRK | 61,256 | 3 | 0 | 0 |
| Portugal | PRT | 407,947 | 10 | 0 | 0 |
| Paraguay | PRY | 0 | 0 | 467,411 | 12 |
| Qatar | QAT | 156,240.6 | 12 | 0 | 0 |
| Romania | ROU | 138,800.4 | 6 | 369,735 | 35 |
| Russia | RUS | 95,225.5 | 7 | 24,359,619 | 317 |
| Rwanda | RWA | 0 | 0 | 21,780 | 4 |
| Saudi Arabia | SAU | 902,278.6 | 25 | 0 | 0 |
| Sudan | SDN | 0 | 0 | 384,038.8 | 17 |
| Senegal | SEN | 0 | 0 | 183,309.7 | 14 |
| Singapore | SGP | 1,793,885 | 115 | 0 | 0 |
| Solomon Islands | SLB | 0 | 0 | 7,741 | 1 |
| Sierra Leone | SLE | 0 | 0 | 294,873.7 | 11 |
| Serbia | SRB | 0 | 0 | 100,834.5 | 19 |
| South Sudan | SSD | 0 | 0 | 106,989 | 3 |
| Sao Tome and Principe | STP | 0 | 0 | 4,917 | 1 |
| Suriname | SUR | 0 | 0 | 823 | 1 |
| Sweden | SWE | 200,313 | 14 | 0 | 0 |
| Syria | SYR | 12,600 | 1 | 0 | 0 |
| Thailand | THA | 86,449.3 | 12 | 0 | 0 |
| Tajikistan | TJK | 0 | 0 | 909 | 1 |
| Timor-Leste | TLS | 0 | 0 | 3,000 | 1 |
| Tanzania | TZA | 0 | 0 | 133,732.1 | 24 |
| Uganda | UGA | 0 | 0 | 48,507 | 14 |
| Ukraine | UKR | 0 | 0 | 2,648,426 | 249 |
| Uruguay | URY | 38,470 | 3 | 1,078,666 | 56 |
| United States of America | USA | 5,195,551 | 139 | 0 | 0 |
| Uzbekistan | UZB | 0 | 0 | 286,035 | 19 |
| Venezuela | VEN | 0 | 0 | 60,000 | 1 |
| British Virgin Islands | VGB | 6,777,160 | 116 | 0 | 0 |
| South Vietnam | VNM | 0 | 0 | 345,905 | 10 |
| South Africa | ZAF | 967,984 | 24 | 8,208 | 3 |
| Zambia | ZMB | 0 | 0 | 253,537.8 | 37 |
| Zimbabwe | ZWE | 48,981.5 | 6 | 0 | 0 |
Ethical Considerations
Ethical approval was not required as the study did not involve human participants.
Consent to Participate
This article does not contain any studies with human participants performed by any of the authors.
Funding
The authors disclosed receipt of the following financial support for the research, authorship, and/or publication of this article: This study is supported by Guizhou University Humanities and Social Science Research Center Project of Guizhou Province (GDZX2024019).
Declaration of Conflicting Interests
The authors declared no potential conflicts of interest with respect to the research, authorship, and/or publication of this article.
Data Availability Statement
Data used in the analysis of this paper will be available up on request.