
Abstract
This meta-analysis investigated creativity differences between urban and rural children, examining the moderating effects of age, regional context, and measurement tools. Studies were systematically selected based on explicit inclusion criteria, which required peer-reviewed publication between 2003 and 2023, clear operational definitions of urban and rural populations, and the use of standardized or validated measures of creativity. Analysis of 22 studies (2003–2023) encompassing 76,082 participants revealed a small-to-moderate overall effect size (d = 0.376, 95% CI [0.301, 1.054]) with no significant differences between urban and rural settings (t = 0.82, p = .42). Age emerged as a significant moderator, with children aged 11 to 12 years showing the highest effect sizes (d = 12.06). Regional variations were substantial, with studies from the United States (d = 11.75) and Canada (d = 5.19) demonstrating larger effects than other regions. The Torrance Tests of Creative Thinking yielded the highest measurement tool effect sizes (d = 6.66). High heterogeneity (I2 = 99.43%) suggested substantial variability due to methodological and contextual differences. These findings challenge geographical determinism in creative development and emphasize the need for age-appropriate, culturally sensitive approaches to creativity assessment in educational settings.
Plain Language Summary
Why was the study done? Creativity is important for children’s learning and future success. But does living in a city or countryside make a difference in how creative children are? This study looked at research from around the world to see how age, location, and the tools used to measure creativity affect children’s creative thinking. What did the researchers do? The researchers analyzed data from 22 studies with over 76,000 children from different countries, including the United States, Canada, China, Taiwan, and more. They compared creativity scores between urban and rural children and looked at how children’s age, their country, and the type of test used influenced the results. What did the researchers find? On average, there was no big difference in creativity between children living in cities and those in rural areas. However, age made a difference—children aged 11–12 showed the highest creativity scores. Also, children from the U.S. and Canada tended to score higher than those from other countries. The type of creativity test mattered too. Some tests, like the Torrance Test of Creative Thinking, showed stronger results than others. Why does it matter? These findings show that creativity is influenced more by age, teaching methods, and culture than by simply where a child lives. This means schools and teachers can help children become more creative by using age-appropriate and culturally relevant teaching methods, no matter where they are.
Keywords
Introduction
Creativity is widely recognized as a core educational competence that supports children’s cognitive development, academic performance, and future innovative capacity (Nikkola et al., 2024; Ritter & Ferguson, 2017; Weber & Greiff, 2023). Research increasingly shows that nurturing creativity in early childhood is essential for promoting adaptive thinking in rapidly changing learning environments (Beghetto, 2021; Cropley & Cropley, 2015). Drawing on Glăveanu’s (2013) definition, this study conceptualizes creativity as the production of novel and appropriate ideas within sociocultural contexts and treats it as a malleable developmental skill shaped through learning experiences, pedagogical practices, and cultural mediation rather than as a fixed trait (Corazza, 2016; Henriksen et al., 2017). With this framing, the study focuses on preschool-aged children (ages 3–6), acknowledging early childhood as a formative period for creative growth.
Creativity develops through the interaction of cognitive, social, and contextual influences, including age, environment, and assessment approaches (Gruszka & Tang, 2017; Kandler et al., 2016). The preschool years represent a sensitive developmental window, characterized by rapid neural maturation and emerging divergent thinking and problem-solving skills (Jankowska & Karwowski, 2025; Rietzschel et al., 2016). In line with Vygotsky’s (2004) sociocultural theory, children’s creative acts originate through social mediation and the internalization of cultural tools, suggesting that regional differences reflect variations in scaffolding opportunities rather than inherent differences in ability. Bronfenbrenner’s ecological systems theory further emphasizes that creativity develops within nested systems that include family, school, and broader cultural structures (Neal & Neal, 2013; Rosa & Tudge, 2013).
Cross-cultural studies show that creativity manifests differently across educational systems, shaped by cultural values and pedagogical priorities (Chien & Hui, 2010; P. S. Huang et al., 2017; X. Huang et al., 2019). Some contexts emphasize individual divergent thinking, while others prioritize collaborative problem-solving or culturally situated forms of creative expression (Karwowski & Beghetto, 2019; Mullet et al., 2016). These variations highlight the need to examine creativity through context-sensitive frameworks rather than universal assumptions.
Despite these contributions, several research gaps remain. Findings on urban–rural creativity differences are inconsistent, with studies reporting urban advantages, rural strengths, or no meaningful differences. Few investigations have considered how developmental stages influence creativity across regions, and cross-regional comparisons remain limited. Further, the use of diverse measurement tools raises concerns about comparability and construct validity.
To address these gaps, this study conducts the first comprehensive cross-regional meta-analysis of urban–rural differences in children’s creativity, synthesizing evidence from 22 studies involving more than 76,000 participants published between 2003 and 2023. By examining moderators such as age, regional context, measurement tools, and study period, this analysis advances understanding of creativity as both developmentally sensitive and contextually embedded. The findings hold important implications for educational policy and practice, including equitable resource allocation, culturally responsive curriculum design, and the development of valid and context-sensitive assessment frameworks.
This study therefore aims to systematically analyze differences in creativity between urban and rural children and to identify the moderating factors influencing these differences. Clarifying these relationships contributes to the design of equitable and culturally informed educational practices and provides a foundation for developing standardized yet contextually appropriate creativity assessments.
Objective 1: To determine the average effect size of creativity differences between urban and rural preschool children using 22 peer-reviewed journal articles published between 2003 and 2023.
Objective 2: To analyze the potential moderating factors that influence the urban–rural creativity gap, focusing on:
Age Effects: How age moderates the relationship between geographical location and creativity levels.
Regional Context: The role of study location and regional educational systems in shaping creativity differences.
Measurement Tools: The impact of different creativity assessment methodologies (e.g., creativity tests vs. self-report measures).
Study Period: How the relationship between geographical location and creativity has evolved over time (2003–2023).
Based on these objectives, the following research questions are proposed:
Literature Review
Theoretical Foundations and Developmental Significance of Preschoolers’ Creativity
Preschoolers’ creativity arises from the interaction of cognitive, social, and environmental factors, reflected in early manifestations of divergent thinking, cognitive flexibility, and originality (Leggett, 2017; Polat & Aydın, 2020; Robson, 2014; Robson & Rowe, 2012). Research consistently shows that creativity in early childhood is multifaceted and shaped by children’s emerging abilities and the quality of environmental stimulation (Polat & Aydın, 2020; Yates & Twigg, 2017).
Vygotsky’s (2004) theory highlights imagination as a reconstruction of lived experiences mediated by cultural tools, with pretend play and narrative activities serving as central contexts for creative expression within the Zone of Proximal Development. This view positions creativity as culturally grounded and relational, underscoring the role of adult guidance and peer interaction in supporting early creative growth. Bronfenbrenner and Morris’s (2006) ecological systems theory similarly emphasizes that creativity develops through children’s engagement with nested environmental systems, while Glăveanu (2013) conceptualizes creativity as a socially distributed process embedded in cultural practices.
The preschool years represent a highly sensitive period for creative development due to rapid neural and cognitive growth (Cheung, 2016, 2018). Urban contexts often offer structured cultural and educational resources that stimulate creative exploration, whereas rural settings may foster creativity through nature-based and community-oriented experiences (Craft et al., 2014; Davies et al., 2013; Leggett, 2017). Both contexts can therefore support creative development through distinct but meaningful pathways.
Longitudinal evidence suggests that early creative experiences predict later academic performance, problem-solving ability, and socio-emotional competence (Jeffrey & Craft, 2004; Yildiz & Yildiz, 2021). Although access to resources varies across regions, creative outcomes depend not only on material availability but also on instructional practices and cultural values that mediate children’s engagement with creative tasks (Acar et al., 2021; Wu et al., 2021).
Despite these findings, prior research has not synthesized cross-regional evidence to clarify whether urban–rural differences in creativity reflect developmental variation, contextual differences, or methodological inconsistencies. The present study addresses this gap by conducting the first cross-regional meta-analysis that integrates findings across countries, age groups, and measurement approaches.
Theoretical Justification for Moderators: Age, Geographical Context, and Measurement Tools
The systematic examination of creativity development requires careful consideration of multiple factors that influence creative outcomes and function as methodological controls in empirical research. Building on developmental systems theory (Lerner, 2018), creativity is understood as emerging from dynamic interactions between individual trajectories and contextual influences across multiple ecological levels. This perspective integrates three complementary theoretical frameworks that justify our moderator selection: Vygotsky’s sociocultural theory, Bronfenbrenner’s bioecological systems theory, and dynamic skill theory.
Vygotsky’s Sociocultural Theory: Culture, Mediation, and the Zone of Proximal Development
Vygotsky’s sociocultural theory provides a foundational framework for understanding how social and cultural contexts shape the development of creativity (Cole & Wertsch, 1996; Vygotsky, 2004). Within this perspective, children’s creative capacity is not viewed as an innate trait alone but as an outcome of socially and culturally mediated activity. Central to this theory is the concept of the Zone of Proximal Development (ZPD)—the distance between what a child can accomplish independently and what can be achieved with the guidance of more knowledgeable others (Vygotsky, 2004).
Crucially, Vygotsky’s theory emphasizes that it is the quality and accessibility of scaffolding—rather than geographical location per se—that shape developmental outcomes (Rogoff, 2003; Wood et al., 1976). Scaffolding refers to the intentional and adaptive support provided by more knowledgeable others to help children accomplish tasks they cannot yet perform independently (Wood et al., 1976). In urban environments, scaffolding often manifests through formal institutions such as museums, libraries, and structured curricula. In contrast, rural contexts may feature alternative forms of scaffolding, including community-based problem-solving, guided environmental exploration, and traditional practices grounded in local knowledge systems (Craft et al., 2014; Davies et al., 2013). From a Vygotskian perspective, comparable levels of creative development can emerge across diverse geographical settings when both afford sufficient cultural tools—such as language, narratives, artifacts, and collaborative opportunities—and access to experienced others who mediate learning (Cole & Wertsch, 1996; Vygotsky, 2004).
The process of internalization is also central to this framework (Rogoff, 2003; Vygotsky, 2004). Vygotsky posited that children transform external social practices and cultural resources into internal psychological tools that support higher-order thinking. As development proceeds, children gradually internalize increasingly sophisticated cultural practices and symbolic tools, enabling more complex and contextually grounded forms of creative expression. Importantly, this process is not universal but culturally situated, reflecting the distinctive values, practices, and mediational means available within each sociocultural context (Cole & Wertsch, 1996).
Age as a Developmental Moderator in the Vygotskian Framework
From a Vygotskian perspective, age functions not merely as a chronological marker but as an index of children’s growing capacity to engage with increasingly complex cultural tools and social practices (Fischer & Bidell, 2006; Jankowska & Karwowski, 2025). Empirical evidence suggests that younger preschoolers (ages 3–4) often express associative or symbolic forms of creativity through play-based interactions, whereas older preschoolers (ages 5–6) display more intentional and goal-directed creativity as their participation in structured and collaborative activities increases (Kleibeuker et al., 2017; Russ, 2014). This developmental progression exemplifies internalization—the gradual incorporation of culturally valued creative practices into children’s own psychological functioning.
Geographical Context as an Environmental Moderator
Geographical context influences creativity not through location itself but through the distribution of mediating resources and social practices. Urban settings tend to offer diverse cultural institutions, specialized educational resources, and heterogeneous peer networks, while rural environments often provide close-knit communities, rich natural surroundings, and locally grounded knowledge systems (Bronfenbrenner & Morris, 2006; Craft et al., 2014; Davies et al., 2013). How these contextual affordances shape creativity depends on how educational systems and community practices structure opportunities for creative engagement.
Measurement Tools as Methodological and Construct Moderators
Creativity comprises multiple components, including divergent thinking, cognitive flexibility, originality, and applied problem-solving (Barbot et al., 2019). Measurement tools capture different facets of this construct. Standardized assessments such as the Torrance Tests of Creative Thinking measure divergent idea generation, whereas observational methods, consensual assessments, portfolios, and free drawing tasks capture more contextual or embodied forms of creativity (Acar & Runco, 2019; Amabile, 1982). From a Vygotskian perspective, measurement tools function as cultural artifacts that support or constrain creative expression, and their alignment with local cultural practices influences the accuracy of cross-regional comparison.
Integration and Justification of Moderators
Examining age, geographical context, and measurement tools as moderators serves both theoretical and methodological purposes. Methodologically, these moderators help account for systematic variance and clarify the sources of urban–rural differences. Theoretically, they allow for testing predictions from sociocultural and ecological frameworks regarding how developmental readiness, environmental support, and task demands interact to shape creative performance (Beaty et al., 2018; Lerner, 2018). Integrating these perspectives provides a more nuanced understanding of how creativity develops across diverse educational contexts.
Theoretical Framework for Understanding Urban-Rural Creativity Differences
Urban–rural differences in creativity can be understood through environmental psychology, developmental theory, and sociocultural perspectives, which collectively emphasize that creativity develops within systems shaped by cultural, social, and educational influences (Cheung & Leung, 2013). Prior findings on how geographical contexts affect creativity remain inconsistent: some studies report urban advantages due to structured learning environments (Davies et al., 2013), whereas others highlight rural strengths linked to experiential and community-based learning (Acar et al., 2021). These contradictory results underscore the need for systematic synthesis.
A Vygotskian perspective suggests that geographical location does not directly determine creativity. Instead, differences arise from variations in cultural tools, language practices, and opportunities for guided participation. When both urban and rural settings provide adequate mediational resources, children can achieve comparable levels of creative development. This theoretical framing supports examining moderators that influence how environmental contexts shape creativity outcomes.
Rationale for Adopting Meta-Analysis
Meta-analysis provides a systematic method for integrating findings across studies, offering stronger statistical power and more precise effect size estimates in areas where results vary by context, population, or measurement approach. For urban–rural comparisons, meta-analysis helps address methodological inconsistencies by incorporating moderators such as age, region, and assessment tools (Hunter & Schmidt, 2004).
It also supports the evaluation of publication bias and study quality through sensitivity analyses and funnel plots (Borenstein et al., 2021), and identifies temporal trends that reflect shifts in educational practices (Card, 2015). Although creativity research has grown, findings regarding geographical differences remain fragmented, with studies alternately reporting urban advantages, rural strengths, or negligible differences.
By synthesizing 22 studies across diverse regions and age groups, this meta-analysis provides a more reliable estimate of urban–rural creativity differences. The inclusion of key moderators allows for deeper understanding of the contextual factors shaping creativity. The results offer meaningful implications for education, informing the design of context-sensitive curricula, equitable resource distribution, and culturally responsive creativity assessments
Methods
Inclusion and Exclusion Criteria
Our search procedure yielded 151 studies. We applied the following selection criteria to these studies:
We only considered studies that presented quantitative measures comparing creativity levels between urban and rural children. Some studies were included even if this comparison was not the primary goal of the research. Studies that provided only qualitative analyses or theoretical discussions were excluded. This decision was based on the requirements of meta-analytic procedures, which rely on standardized statistical indicators (e.g., means, standard deviations, or effect sizes) that can be aggregated and compared across studies. Qualitative studies, while valuable for contextual insights, do not provide commensurable data necessary for statistical synthesis and were therefore excluded to maintain methodological rigor (Borenstein et al., 2021).
We included studies that used objective measures of creativity (e.g., Torrance Tests of Creative Thinking [TTCT]) or self-report scales with demonstrated adequate reliability, such as measures of creative personality or creative self-confidence beliefs. Studies using non-validated measures or single-item assessments were excluded.
To ensure conceptual clarity, we included only studies that explicitly defined “urban” and “rural” based on objective demographic or administrative criteria, such as national census classifications, population density thresholds, or municipal versus county-level designations. Studies employing vague or subjective geographic distinctions (e.g., “big city” versus “village” without reference to official administrative or statistical data) were excluded. This procedure ensured that regional comparisons were anchored in verifiable demographic or policy frameworks rather than in the authors’ subjective interpretations.
With respect to participant selection, we relied on the sampling procedures reported in the original studies. The majority of studies recruited participants through school-based sampling frames, typically drawing samples from intact classrooms or grade-level cohorts, while a smaller subset employed convenience sampling within designated urban or rural school districts. Across all studies, participants were children or adolescents formally enrolled in accredited educational institutions. This inclusion criterion ensured the representativeness of the target school-aged populations and minimized potential sampling biases associated with extracurricular or community-based recruitment.
The inclusion of countries was determined by empirical availability rather than by a priori selection. Countries represented in this meta-analysis (e.g., the United States, Canada, China, Taiwan, Indonesia, Norway, among others) were identified through peer-reviewed studies published between 2003 and 2023 that satisfied the inclusion criteria outlined above. This approach minimizes selection bias and reflects the global distribution of accessible empirical research on urban–rural differences in creativity. Although operational definitions of “urban” and “rural” varied slightly across studies, all were based on explicit and objective criteria, ensuring adequate comparability for the present analysis.
4. We initially focused on preschool children aged 3 to 6, but limiting the sample to this age group risked publication bias and increased heterogeneity because creativity assessments in young children often involve small samples and greater measurement challenges. To ensure sufficient data and maintain methodological rigor, we expanded the inclusion criteria to school-aged children up to age 16. Studies outside this range were included only when data for the target ages could be extracted. This broader scope allowed examination of creativity across developmental stages. Previous research shows mixed findings regarding urban–rural differences among preschoolers. Some studies report advantages for urban children due to greater access to early childhood education and stimulating learning environments (Dai et al., 2024), whereas others highlight rural children’s strengths in imaginative play and context-based problem-solving (Anderson, 2012). These inconsistencies underscore the need to analyze how environmental contexts shape creativity during early development
5. Only peer-reviewed journal articles published between 2003 and 2023 were included. Unpublished dissertations, conference papers, and book chapters were excluded to ensure quality control. To further ensure study quality, we also reviewed the indexing status and Scimago Journal Rank (Q1–Q4) of the journals in which these studies appeared. Approximately half of the included studies were published in SSCI- or Scopus-indexed journals within the Q1 to Q2 range, while others came from Q3 to Q4 outlets or regional journals not indexed in SSCI. This distribution reflects both the strength of the evidence base and the current limitations of the literature. Only five studies published in non-SSCI journals were retained, because they met all other inclusion criteria (peer-reviewed, clear definitions of urban and rural context, validated creativity measures, and sufficient statistical reporting). To minimize subjectivity, two authors independently evaluated these studies and reached full agreement on their inclusion, thereby ensuring transparency and consistency in the selection process.
Regarding participant selection, we relied on the sampling procedures reported in the original studies. Most studies recruited participants through school-based sampling frames, with samples typically drawn from intact classrooms or grade cohorts. A smaller number employed convenience samples within designated urban or rural school districts. In all cases, participants were children or adolescents formally enrolled in recognized educational institutions, and studies were required to clearly specify the criteria for urban and rural classification. This ensured that the included participants were representative of the school-aged populations targeted in their respective contexts.
We also excluded studies that:
used data previously published in other included studies;
provided insufficient statistical information for effect size calculation;
employed multilevel models without providing standardized effect sizes;
were not available in English or [other included languages].
A total of 22 studies met the selection criteria and were included in the analysis. Together, these studies included 76 effects with 76,082 participants.
Search Strategies
We followed a systematic three-step procedure to identify relevant studies. First, we conducted a comprehensive search of major electronic databases including Web of Science, ERIC, PsycINFO, Scopus, Education Full Text, Pro-Quest, and Google Scholar. This search strategy was designed in alignment with established meta-analytic procedures outlined by Lipsey and Wilson (2001) and the PRISMA guidelines (Page et al., 2021), which emphasize transparency, replicability, and comprehensiveness in study identification. We searched for articles published between 2003 and 2023 using the following search parameters:
For creativity-related terms: creativity OR “creative ability” OR “creative thinking” OR “creative potential” OR “divergent thinking” Combined with location-related terms: AND (urban OR rural OR “geographical location” OR “regional difference”) Combined with population-related terms: AND (child* OR preschool* OR kindergarten OR “elementary school” OR “primary school” OR student*)
In the second step, we examined the reference lists of identified articles and relevant review papers to locate additional studies that met our inclusion criteria. We also used Google Scholar’s “cited by” feature to identify more recent studies that cited key papers in our initial pool.
Finally, to ensure comprehensive coverage, we conducted a manual search of key journals in creativity research and child development, including:
Creativity Research Journal
Thinking Skills and Creativity
Psychology of Aesthetics, Creativity, and the Arts
Journal of Creative Behavior
Early Childhood Research Quarterly
Child Development.
Coding Procedures
A total of 151 articles were obtained through the aforementioned search method, and these articles were input into a simple coding system for initial review. The author and coresearcher independently coded all 22 articles that met the inclusion criteria for this meta-analysis. The coding process focused on extracting relevant information such as sample size, sample selection, effect sizes, and data necessary for moderator analyses. A detailed coding framework was developed to guide the process, categorized as follows:
1. Sample Characteristics
Sample size: Total number of participants in each study.
Age range: Specific age ranges of the participants (e.g., 3–6 years).
Geographic location: Classification of urban versus rural settings.
Country/region of study: The geographical context of each study.
2. Measurement Characteristics
Type of creativity measure: Classification of tools (e.g., divergent thinking tests, self-report measures).
Specific measurement tools used: Instruments employed in each study (e.g., Torrance Tests of Creative Thinking [TTCT], Cognitive Assessment Profile [CAP] & Humor Styles Questionnaire [HSQ]).
Reliability coefficients: Internal consistency or test-retest reliability reported in the studies.
Components of creativity measured: Key dimensions assessed (e.g., fluency, flexibility, originality).
3. Study Characteristics
Publication year: Chronological scope (2003–2023).
Study design: Cross-sectional, longitudinal, or experimental designs.
Type of effect size reported: Information on statistical metrics (e.g., Cohen’s d, Hedges’ g).
These study designs and effect size metrics were selected based on established methodological guidelines for meta-analyses (Borenstein et al., 2021; Lipsey & Wilson, 2001).
AI Assistance in the Coding Process
During this stage, AI tools were used to enhance the efficiency and reliability of our process:
Abstract Summarization: The AI tool (NotebookLM ) was employed to extract and summarize the abstracts of all initially retrieved articles into a structured table, to facilitate the initial screening and selection of relevant studies.
Codebook Development: NotebookLM also assisted in drafting the initial version of the coding manual by organizing key variables, providing consistent definitions, and generating example entries. The final codebook was refined collaboratively by the research team to ensure alignment with the study’s objectives.
Coding Process
The initial coding was conducted independently by two coders to ensure inter-rater reliability. Any discrepancies were resolved through discussion and consensus. When agreement could not be reached, a third researcher was consulted. Inter-rater reliability for the coding process was calculated using Cohen’s kappa (k) to quantify chance-adjusted agreement. The overall reliability score was k = .78, indicating substantial agreement.
To maintain consistency, the coding manual was reviewed and refined throughout the coding process. This manual included explicit definitions, examples for each coding category, and clear guidelines to address ambiguities. Additionally, when studies reported multiple relevant outcomes, all eligible outcomes were coded to maximize data inclusivity and robustness.
To ensure accuracy and minimize bias, all data entries were double-checked by an independent researcher. Regular coding meetings were held to resolve ambiguities and refine the coding scheme, ensuring that all included studies adhered to the established inclusion criteria.
Moderator and Mediator Analysis
In this meta-analysis, we examined four potential moderators influencing the relationship between geographical location (urban and rural) and children’s creativity.
For participant age (age effects), we analyzed the continuous variable of mean age reported in each study, rather than categorical age groups. This approach allowed us to capture more nuanced developmental patterns in the urban-rural creativity gap. For regional context, we considered the country where each study was conducted as a moderator. While previous meta-analyses often grouped countries into broader geographical regions, we maintained individual country distinctions to examine specific educational systems and institutional characteristics that might influence urban-rural creativity disparities. The study period (publication year) of each study was treated as a continuous moderator spanning from 2003 to 2023. This temporal analysis allowed us to explore trends in the urban-rural creativity gap over two decades without imposing arbitrary period divisions.
For creativity measurement tools, we analyzed each distinct instrument (e.g., TTCT, CAP, and HSQ) rather than grouping tools into broad categories. Because this is a meta-analysis, the instruments were those reported in the original studies. The most frequently used was the Torrance Tests of Creative Thinking (TTCT; Torrance, 1966, revised 1990), followed by the Creative Assessment Packet (CAP; F. Williams, 1980), the Consensual Assessment Technique (CAT; Amabile, 1982), the Wallach–Kogan Tests (Wallach & Kogan, 1965), and the Humor Styles Questionnaire (HS); Martin et al., 2003). Several studies also used free drawing or researcher-developed tasks, which were included only if they reported validated scoring rubrics and adequate reliability indices. This ensured that potential variations in how different tools detect urban-rural creativity differences were captured. Psychometric properties (e.g., reliability coefficients) of these tools were also reviewed to contextualize results.
For each of these moderators, we conducted meta-regression analyses using mixed-effects models. This choice enabled us to account for both within-study variance (e.g., methodological differences) and between-study variance (e.g., heterogeneity in sample characteristics or regional educational contexts). Heterogeneity across studies was assessed using Cochran’s Q test and I2 statistics to determine the degree of variability attributable to differences between studies rather than sampling error.
Data Processing and Analysis
Data analysis followed the procedures recommended by Borenstein et al. (2021) and Cooper et al. (2009). Effect sizes were calculated using Cohen’s d to represent standardized mean differences in creativity between urban and rural groups. When studies reported alternative statistics such as F, t, or chi-square values, these were converted to Cohen’s d using established formulas. Studies reporting multiple independent comparisons were retained, and all effects that met the criteria of independence, relevance to urban–rural comparisons, and sufficient statistical information were included and nested within the multilevel structure.
A three-level meta-analysis was conducted using the metafor package in R to account for the hierarchical nature of the data. Level one represented sampling variance, level two accounted for multiple effect sizes within studies, and level three captured between-study variance. This approach enabled simultaneous estimation of within-study and between-study variability and provided robust pooled effect size estimates. Forest plots were generated to display individual and overall effect sizes with confidence intervals.
Heterogeneity was assessed using Cochran’s Q and the I2 statistic, which quantify whether observed variance exceeds sampling error and the proportion of variance attributable to true heterogeneity. Standard thresholds of 25%, 50%, and 75% were used to interpret low, moderate, and high heterogeneity.
Moderator analyses were conducted through mixed-effects meta-regression. Moderators included participant age, regional context, measurement tools, and publication year. Regression coefficients and p-values were examined to determine whether each moderator significantly influenced the magnitude or direction of effect sizes, and country-level results were compared to capture variation across educational systems.
Publication bias was examined using funnel plots, Egger’s regression test, and sensitivity analyses (Egger, 1997). This approach is consistent with recent meta-analytic practices in educational and psychological research (Hsieh, 2025). The trim-and-fill procedure was applied to estimate potential missing studies and adjust the pooled effect size. These complementary approaches helped address vulnerabilities such as selective reporting and the file-drawer problem and ensured the robustness of the meta-analytic conclusions.
Results
Overall Effect
This study analyzed data from 22 peer-reviewed studies, encompassing a diverse sample of participants (the total sample size is approximately 76,082 participants) across multiple regions, including the United States, China, Taiwan, Pakistan, Saudi Arabia, Norway, Canada, Estonia, India, Indonesia, and Thailand. The forest plot of effect sizes for these studies, along with their 95% confidence intervals, is presented in Figure 1. The reported effect sizes ranged from −3.50 to 7.36, with the majority indicating positive correlations. While most studies demonstrated positive effect sizes (Treatment Effect, TE) with confidence intervals predominantly in the positive range, some studies with weaker correlations exhibited confidence intervals overlapping zero, indicating lower statistical significance.

Forest plot of overall meta-analytic effect.
Objective 1 Findings
The average effect size of creativity differences between urban and rural preschool children was estimated at 0.376 (95% CI [0.301, 1.054], τ2 = 2.603) under the random effects model, indicating a small-to-moderate effect. These differences were not statistically significant (t = 0.82, p = .42), suggesting that urban (mean effect size of 4.508) and rural (mean effect size of 4.38) preschool children demonstrate largely comparable creativity performance.
Heterogeneity analysis revealed an exceptionally high level of variability across studies, with an I2 = 99.43%, indicating substantial differences likely attributable to variations in participant age, regional educational contexts, creativity measurement tools, and study periods (e.g., publication years). This high heterogeneity suggests that the observed relationship between urban-rural settings and creativity is likely influenced by specific regional characteristics such as educational systems, assessment practices, and institutional frameworks.
While the random effects model’s overall effect size (0.376) reflects a small-to-moderate correlation, the overlap of confidence intervals with zero for some studies underscores the influence of other moderating factors, such as cultural or methodological variations. The fixed effects model yielded a slightly higher but comparable estimate of 0.565 (95% CI [0.529, 0.601]), further emphasizing the need to address heterogeneity. Given the significant heterogeneity (I2 = 99.43%), subgroup analyses focusing on factors such as age, regional differences, and measurement instruments are warranted to clarify the variability in creativity outcomes. Note that some extreme effect sizes (e.g., d > 10) reflect weighted transformations under the mixed-effects model rather than raw standardized mean differences. These values should therefore be interpreted as model-based estimates rather than direct comparisons of group means.
Test for Heterogeneity
The results indicate a high degree of heterogeneity across the studies, as shown by Q(21) = 51,826.2, p < .001, and I2 = 99.43%. This suggests that nearly all variability in effect sizes stems from true differences between studies rather than sampling error. Such heterogeneity highlights the influence of methodological and contextual factors, including participant age, regional educational context (study location), creativity measurement tools, and study period (publication year). The high level of heterogeneity suggests that the relationship between urban-rural settings and creativity is moderated by specific regional characteristics such as differences in educational systems and assessment practices across study locations.
The between-study variance (τ2 = 3.559) further emphasizes the substantial variability in true effect sizes, necessitating a closer examination of potential moderating variables. To address this, subgroup analyses were conducted on four key moderators: participant age (age effects), regional context (study location), measurement tools, and study period (publication year) (see Table 1). These analyses aim to disentangle the contributions of these factors to the observed heterogeneity, providing a more nuanced understanding of how different educational systems and assessment practices across regions influence creativity differences in urban and rural settings.
Variables and Categories Used for Study Coding.

Note. TTCT = torrance tests of creative thinking; CAP = cognitive assessment profile; CA = consensual assessment; HSQ = Humor Styles Questionnaire; FDT = free drawing tests; BSS = Bureau of Statistics Standards; TTCT_G & MFFT = Torrance tests of creative thinking – graphical & Minnesota figural form test; MI Inventory = multiple intelligences inventory.
Test for Publication Bias and Outliers
The funnel plot (Figure 2) revealed potential asymmetry, suggesting the presence of publication bias. Smaller studies appeared to cluster asymmetrically, indicating stronger positive effects of regional differences and measurement tools on creativity outcomes. Egger’s regression test confirmed this asymmetry, with a significant intercept (p < .001), a negative slope (−2.42), and an R2 of 41%. These results indicate the overrepresentation of smaller studies reporting significant findings.
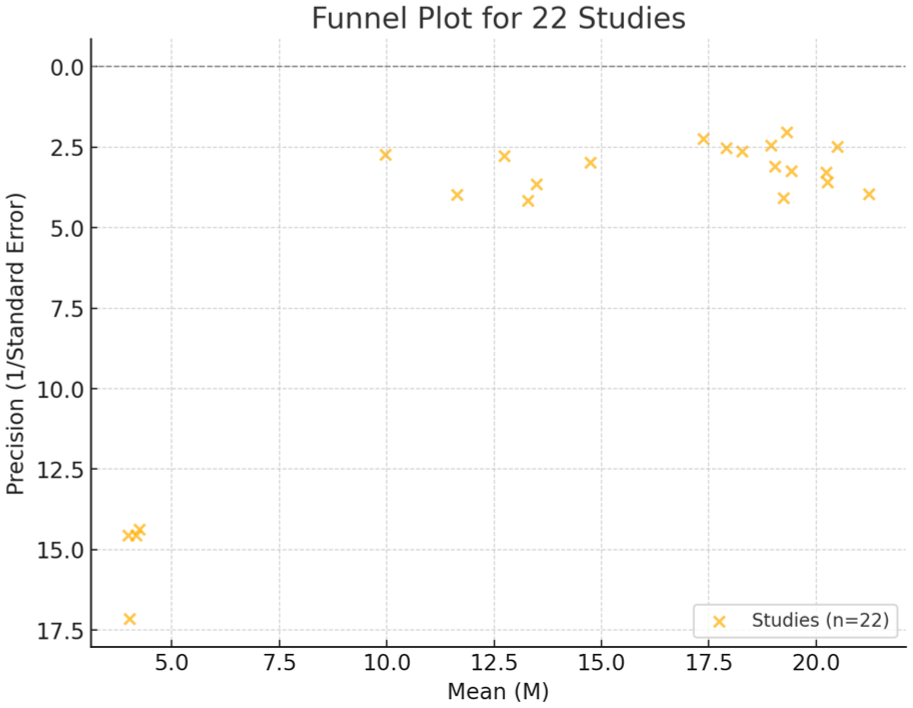
Funnel plot illustrating publication bias.
The funnel plot was based on the 22 studies included in the meta-analysis, presenting the distribution of effect sizes relative to their precision (1/Standard Error). While the limited number of studies (n = 22) may reduce the sensitivity of detecting asymmetry, the statistical results highlight the presence of small-study effects. This suggests that studies conducted in diverse regions with varying educational systems are more likely to be published when significant findings are reported.
These findings underscore the importance of interpreting the meta-analytic results with caution and accounting for potential publication bias, especially given the limited scope of the included studies.
The random-effects model estimated a moderate-to-large positive effect size of 0.376 (95% CI [0.301, 1.054]), reflecting consistent findings across studies. Similarly, the fixed-effects model produced an effect size of 0.565 [0.529, 0.601], suggesting that the inclusion of more heterogeneous studies did not significantly alter the overall estimate. Despite the high heterogeneity (I2 = 99.43%), these results underscore the robustness of the meta-analytic findings across diverse study designs and contexts.
To further evaluate the reliability of these conclusions, Rosenthal (1979)’s fail-safe N could be applied. If the fail-safe N indicates that thousands of unpublished or unidentified studies would be required to render the observed effect size non-significant, this would reinforce the credibility of the findings. Given the improbability of such a large volume of undiscovered studies, the current conclusions are likely robust.
Additional analyses of the largest studies in the dataset yielded consistent results, further confirming the reliability of the findings. Adjustments using the Trim and Fill method to account for publication bias produced slightly lower estimates, closely aligning with the original estimates. These adjustments demonstrate that the overall conclusions remain stable, even when accounting for potential biases. Together, these results affirm the consistency and reliability of the observed relationships between age, regional educational context, and measurement tools on creativity outcomes. The stability of these findings across different analytical approaches suggests that the influence of regional educational systems and assessment practices on creativity is robust.
Subgroup Analysis
The overall effect size provides valuable descriptive insights; however, the heterogeneity index (I2 = 99.43%) suggests that the observed variability in effect sizes across studies is largely due to factors beyond sampling error. To explore these differences, hypotheses about effect sizes were tested using the following moderators: (a) participant age (age effects), (b) Regional Context (study location), (c) measurement tools, and (d) study period (publication year). The results of these analyses are summarized in Table 2.
Summary Table of Weighted Average Correlation Coefficients for Each Moderating Factor.

Note. Effect sizes are based on random-effects models.
p < .05.
Participant Age (Age Effects)
Subgroup analysis revealed significant differences across age groups (Qb(7) = 18.34, p < .05). Children aged 11 to 12 demonstrated the highest effect size (d = 12.06, τ2 = 2.96), suggesting creativity may peak in late childhood. By contrast, adolescents (13–16 years) showed lower but stable effect sizes (d = 2.00, τ2 = 2.63).
Among preschoolers, a developmental trend was observed: 6-year-olds had the highest effect size (d = 5.71), followed by 5-year-olds (d = 4.88) and 4-year-olds (d = 3.27), with significant group differences (Qb(2) = 162.48, p < .05). Lower variability for 6-year-olds (τ2 = 1.88) suggests more consistent educational experiences, whereas younger children showed greater heterogeneity.
These results underscore the value of age-specific analyses, highlighting late childhood as a developmental peak and the final preschool year as a crucial stage for cultivating creativity.
Regional Context
Significant regional differences in creativity were found (Qb(10) = 22.47, p < .05). Studies from the U.S. (d = 11.75, τ2 = 1.07) and Canada (d = 5.19, τ2 = 1.40) showed higher effect sizes than those from Indonesia (d = 1.76) and Norway (d = 1.09), likely reflecting differences in educational emphasis on creativity.
Assessment tools also varied by region. In Taiwan, TTCT produced higher effect sizes (d = 6.66) than free drawing tests (d = 4.27). In China, consensual assessments (d = 5.14) outperformed TTCT (d = 4.65). Statistically significant tool-based differences (Qb(5) = 25.63, p < .05) further highlight the role of assessment practices in shaping outcomes.
These findings suggest that creativity outcomes are shaped by regional educational systems and the cultural alignment of assessment tools. Flexible tools may be more appropriate in less structured environments, while standardized tools like TTCT work best in more formal systems.
Measurement Tools
The choice of measurement tools significantly moderated effect sizes, highlighting the impact of tool sensitivity on creativity outcomes. Studies utilizing the TTCT demonstrated the highest weighted average effect size (d = 6.66, τ2 = 2.15), emphasizing its strong capacity to capture divergent thinking and other cognitive aspects of creativity. Similarly, the Cognitive Assessment Profile (CAP) yielded a comparable effect size (d = 6.15, τ2 = 10.13), reflecting its robust sensitivity to cognitive dimensions such as problem-solving and ideation. However, the relatively high τ2 = 10.13 indicates lower stability, suggesting greater variability in effect sizes across studies using this tool.
In contrast, free drawing tests (d = 4.27, τ2 = 1.03), consensual assessments (CA) (d = 5.14, τ2 = 0.58), and the Humor Styles Questionnaire (HSQ) (d = 5.14, τ2 = 0.09) produced moderate effect sizes. The between-group homogeneity statistic (Qb(5) = 25.63, p < .05) confirmed statistically significant differences between these tools. Notably, free drawing tests exhibited relatively higher variability (τ2 = 1.03), suggesting greater heterogeneity in capturing creativity across diverse contexts compared to the more structured TTCT and CAP.
These findings underscore the importance of aligning measurement tools with the specific dimensions of creativity being assessed. Highly structured tools such as TTCT and CAP tend to produce higher effect sizes and demonstrate lower variability, making them particularly suitable for capturing cognitive dimensions of creativity. In contrast, tools that focus on broader or less structured aspects of creativity, such as free drawing tests or CA, may yield more variable results due to their adaptability to diverse educational or cultural contexts.
Publication Year
Effect sizes also varied by publication year. Studies conducted in 2023 demonstrated the highest weighted average effect sizes (d = 5.19, τ2 = 1.40), reflecting both higher creativity outcomes and improved methodological consistency, compared to earlier studies such as those conducted in 2006 (d = 3.44, τ2 = 0.24). However, studies conducted in 2016 (d = 1.82, τ2 = 2.41), 2018 (d = 1.52, τ2 = 1.42), and 2020 (d = 1.66, τ2 = 0.44) yielded relatively lower effect sizes, suggesting that certain methodological or contextual factors during these years may have constrained creativity outcomes. The between-group homogeneity statistic (Qb(6) = 19.05, p < .05) indicated statistically significant differences across publication years, emphasizing the temporal variation in creativity research findings.
These findings suggest several possible explanations for the smaller effect sizes observed in 2016, 2018, and 2020. First, these years may have included studies conducted in regions or contexts with less emphasis on creativity within the educational system, potentially leading to underrepresentation of creativity in measured outcomes. Second, these years coincide with increased methodological diversity (e.g., greater reliance on less structured tools such as free drawing tests) or shifts in participant demographics, which may have contributed to variability in results. For example, the relatively low variance in 2020 (τ2 = 0.44) suggests methodological consistency but limited generalizability across broader educational contexts. Conversely, the higher variances observed in 2016 (τ2 = 2.41) and 2018 (τ2 = 1.42) may reflect greater heterogeneity in study designs, measurement tools, or cultural factors influencing creativity.
Overall, the consistent increase in effect sizes observed in 2023 underscores the impact of methodological advancements in creativity research. Improved standardization of measurement tools and more targeted sampling strategies likely contributed to these higher effect sizes and enhanced reliability of findings. These results emphasize the importance of considering temporal trends and contextual factors in creativity research to better understand how evolving educational and methodological practices influence creativity outcomes.
Summary of Results and Discussion
To align the discussion with our research questions (RQ1–RQ3), the subsections in the Discussion section explicitly indicate which research question each subsection addresses and integrate theory-driven explanations for the observed patterns.
Overall Effect and Heterogeneity-Addressing RQ1 and RQ2
This meta-analysis synthesized 22 studies (2003–2023) and found a small-to-moderate overall effect size (r = .376, 95% CI [0.301, 1.054]) for creativity differences between urban and rural children, with no statistically significant difference (t = 0.82, p = .42). This suggests that geographical setting alone is not a primary determinant of children’s creative development.
These findings align with previous research emphasizing the multifaceted nature of creativity, which is shaped by an interplay of contextual, cultural, and individual factors. For instance, Yeh and Ting (2023) demonstrated that while urban children initially outperformed their rural counterparts in standardized creativity assessments (i.e., formal tests such as the Torrance Tests of Creative Thinking that employ validated scoring rubrics to measure divergent thinking), both groups showed comparable improvements through targeted interventions such as digital or game-based creativity programs. This underscores the potential for educational initiatives to mitigate contextual disparities. Similarly, Glăveanu (2013) emphasized the social and cultural dimensions of creativity, noting that community practices like folk art significantly contribute to children’s creative expression regardless of geographical setting. These studies collectively suggest that creativity development transcends locational factors and is heavily influenced by access to educational opportunities and cultural practices.
In contrast, J. D. Williams et al. (1973) found rural children outperformed urban peers on verbal creativity, but our meta-analysis suggests such differences stem from factors like demographics, educational practices, and assessment tools. This aligns with Kaur’s (2023) view that access to resources and cultural norms shape creative outcomes more than geography alone.
From a Vygotskian perspective, these findings challenge the notion that geography is destiny. The non-significant overall urban–rural difference suggests that what matters is not location per se, but the availability of what Vygotsky termed “mediating means”—culturally specific tools, practices, and social interactions that enable creative thinking (Cole & Wertsch, 1996; Vygotsky, 2004). When both urban and rural contexts provide adequate cultural resources and opportunities for social mediation, children’s creative potential can be similarly realized across geographical settings.
The substantial heterogeneity observed (I2 = 99.43%, τ2 = 2.603) underscores the contextual complexity of creativity and is consistent with Vygotskian theory. Rather than indicating inherent differences between urban and rural children, this variability likely reflects cross-regional differences in the quality and cultural relevance of scaffolding within educational systems (Vygotsky, 2004; Wertsch & Tulviste, 1992). Variations in how regional educational systems structure opportunities for creative development, prioritize specific cultural tools, and implement assessment practices collectively contribute to the heterogeneity identified in this analysis.
These theoretical insights underscore the importance of examining moderators beyond simple geographical classification. Subgroup analyses presented in the following sections demonstrate how age, regional context, measurement tools, and temporal trends systematically moderate creativity outcomes, providing empirical support for the complex, context-dependent nature of creative development posited by sociocultural theory.
Participant Age: Importance of Preschool Development-Contributing to RQ3 (Age Moderator)
Age emerged as a key moderator, with creativity peaking in late childhood. Children aged 11 to 12 years showed the highest effect size (d = 12.06), significantly surpassing other age groups (Qb(7) = 18.34, p < .05). While this group also displayed higher variability (τ2 = 2.96), it likely reflects distinct cognitive and socio-emotional changes during this stage. In contrast, adolescents aged 13 to 16 showed lower effect sizes (d = 2.00) with comparable variability (τ2 = 2.63). These results support developmental theories identifying late childhood as a critical phase for creative growth, driven by improved problem-solving and abstract thinking capacities (Medvecka, 2023; Russ, 2022).
Among preschoolers, a clear developmental trend emerged: 6-year-olds had the highest effect size (d = 5.71), followed by 5-year-olds (d = 4.88) and 4-year-olds (d = 3.27), with significant between-group differences (Qb(2) = 162.48, p < .05). Variance was lower for 6-year-olds (τ2 = 1.88), suggesting greater consistency in educational practices and assessments, while younger preschoolers exhibited higher variability, likely due to methodological and contextual differences across studies.
Research supports these findings. For example, United Nations International Children’s Emergency Fund (2018) emphasizes that play in the preschool years enables children to explore and develop their imagination and creativity. Similarly, Weisberg et al. (2013) show that guided play—where curricular goals are paired with playful activities—effectively supports both learning and creative engagement. The elevated effect sizes for 6-year-olds underscore the pivotal role of the final year of preschool in fostering creativity, likely influenced by increased exposure to structured learning environments and creative tasks that prepare children for the cognitive demands of formal schooling.
These findings emphasize the importance of tailoring educational strategies to age-specific developmental needs. The relatively higher variability observed among younger preschoolers (τ2 = 2.88) highlights the influence of diverse educational practices and measurement tools. By contrast, the lower variability for 6-year-olds suggests that structured environments and consistent educational practices play a key role in fostering creativity during this critical developmental stage. These results advocate for early childhood interventions that focus on creativity-based activities to maximize children’s academic and personal potential.
Regional Influences: A Vygotskian Analysis of Educational Systems and Scaffolding Practices-Core Findings Addressing RQ3 (Regional Moderator)
Theoretical Framework: Systems-Level Scaffolding and Cultural Tools
This section directly addresses RQ3 by interpreting cross-regional variations in creativity through the lens of Vygotsky’s theory of creative development. According to Vygotsky (2004), imagination and creativity arise from the social transformation of experience—children internalize external cultural tools, language, and collaborative practices into novel imaginative functions. Hence, regional differences in creativity are not rooted in geography itself but in the quality and intentionality of sociocultural mediation that educational systems provide within the Zone of Proximal Development (ZPD).
System-Level Scaffolding and Cultural Mediation
The meta-analytic findings revealed that countries with robust, systematically organized scaffolding for creative development—such as the United States (d = 11.75, τ2 = 1.07) and Canada (d = 5.19, τ2 = 1.40)—demonstrated the highest and most stable creativity outcomes. From a Vygotskian standpoint, these systems exemplify the transformation of social participation into internalized creative thinking. In both contexts, creativity is explicitly positioned as a curricular goal supported by project-based learning, divergent-thinking activities, and teacher-facilitated collaboration (Beghetto & Kaufman, 2014; Karia, 2015). Such practices embody the guided participation that Vygotsky described as essential for developing higher psychological functions through social interaction. Moreover, the relatively low heterogeneity observed in the U.S. sample (τ2 = 1.07) suggests consistent implementation of creativity-supportive pedagogy nationwide. These findings resonate with Bronfenbrenner and Morris’s (2006) ecological systems theory, which emphasizes that well-aligned microsystem (classroom) and macrosystem (policy) interactions facilitate optimal developmental outcomes.
Development Through Internalization in Contextually Diverse Systems
Moderate effect sizes in Taiwan (d = 6.66, τ2 = 2.15) and China (d = 5.14, τ2 = 0.58) indicate that creative growth can also emerge in traditionally exam-oriented systems once they begin to cultivate what Vygotsky termed internalization of creative mediation. Both countries have initiated educational reforms emphasizing inquiry-based learning and innovation-driven curricula (X. Huang et al., 2019), reflecting a shift from teacher-centered instruction toward constructivist and student-centered approaches. The lower heterogeneity in China suggests more standardized adoption of creativity reforms, while Taiwan’s higher variability (τ2 = 2.15) may reflect uneven regional implementation (Chien & Hui, 2010; Rao & Li, 2009). This variation substantiates Vygotsky’s claim that the trajectory of creative development depends on how effectively children access and internalize cultural tools through collaborative activity (Cole & Wertsch, 1996).
Constraints on Creative Mediation in Under-Resourced Contexts
Lower mean creativity scores in Indonesia (d = 1.76, τ2 = 0.31) and Norway (d = 1.09, τ2 = 2.31) illustrate how creativity stagnates when opportunities for mediation are limited or inconsistent. Studies have shown that Indonesian classrooms often face large class sizes, resource constraints, and strong reliance on rote learning (Ra et al., 2016; Tin et al., 2010), which reduce opportunities for guided, individualized scaffolding. Similarly, while Norway’s education system emphasizes holistic development and equality (Meyer & Eilifsen, 2017), creativity is not always treated as a core curricular competency (Vincent-Lancrin et al., 2019). The resulting high heterogeneity (τ2 = 2.31) suggests uneven implementation of creativity-oriented teaching across schools. These patterns exemplify Vygotsky’s assertion that creativity cannot develop autonomously; it requires sustained social mediation through meaningful joint activity between teachers and learners. When such mediation is absent, children’s creative potential remains underdeveloped regardless of material resources.
Measurement Alignment as a Mediational Tool
From a Vygotskian perspective, assessment tools themselves function as cultural artifacts that mediate how creativity is expressed and valued. The strong performance associated with the Torrance Tests of Creative Thinking (TTCT) in Western contexts reflects alignment between these standardized measures and the forms of divergent ideation emphasized in those societies (Acar & Runco, 2019; Cramond & Kim, 2021). In contrast, collectivist contexts such as China, Taiwan, and Indonesia often value creativity that is relational, community-based, or contextually grounded (Chien & Hui, 2010; Karwowski & Beghetto, 2019). Standardized divergent-thinking tasks may thus underestimate creative potential in such environments, as they capture individual novelty but not culturally embedded innovation (Said-Metwaly et al., 2020). This mismatch between assessment artifacts and sociocultural practices exemplifies Vygotsky’s principle that all psychological tools mediate human activity differently across cultural systems. Hence, regional differences in measured creativity partly reflect disparities in the symbolic systems used to recognize and evaluate creative acts.
Table 3 summarizes the country-level estimates, heterogeneity indices, and contextual interpretations derived from these analyses, providing an empirical foundation for the theoretical synthesis that follows.
Country-Level Effect Sizes and Contextual Explanations.
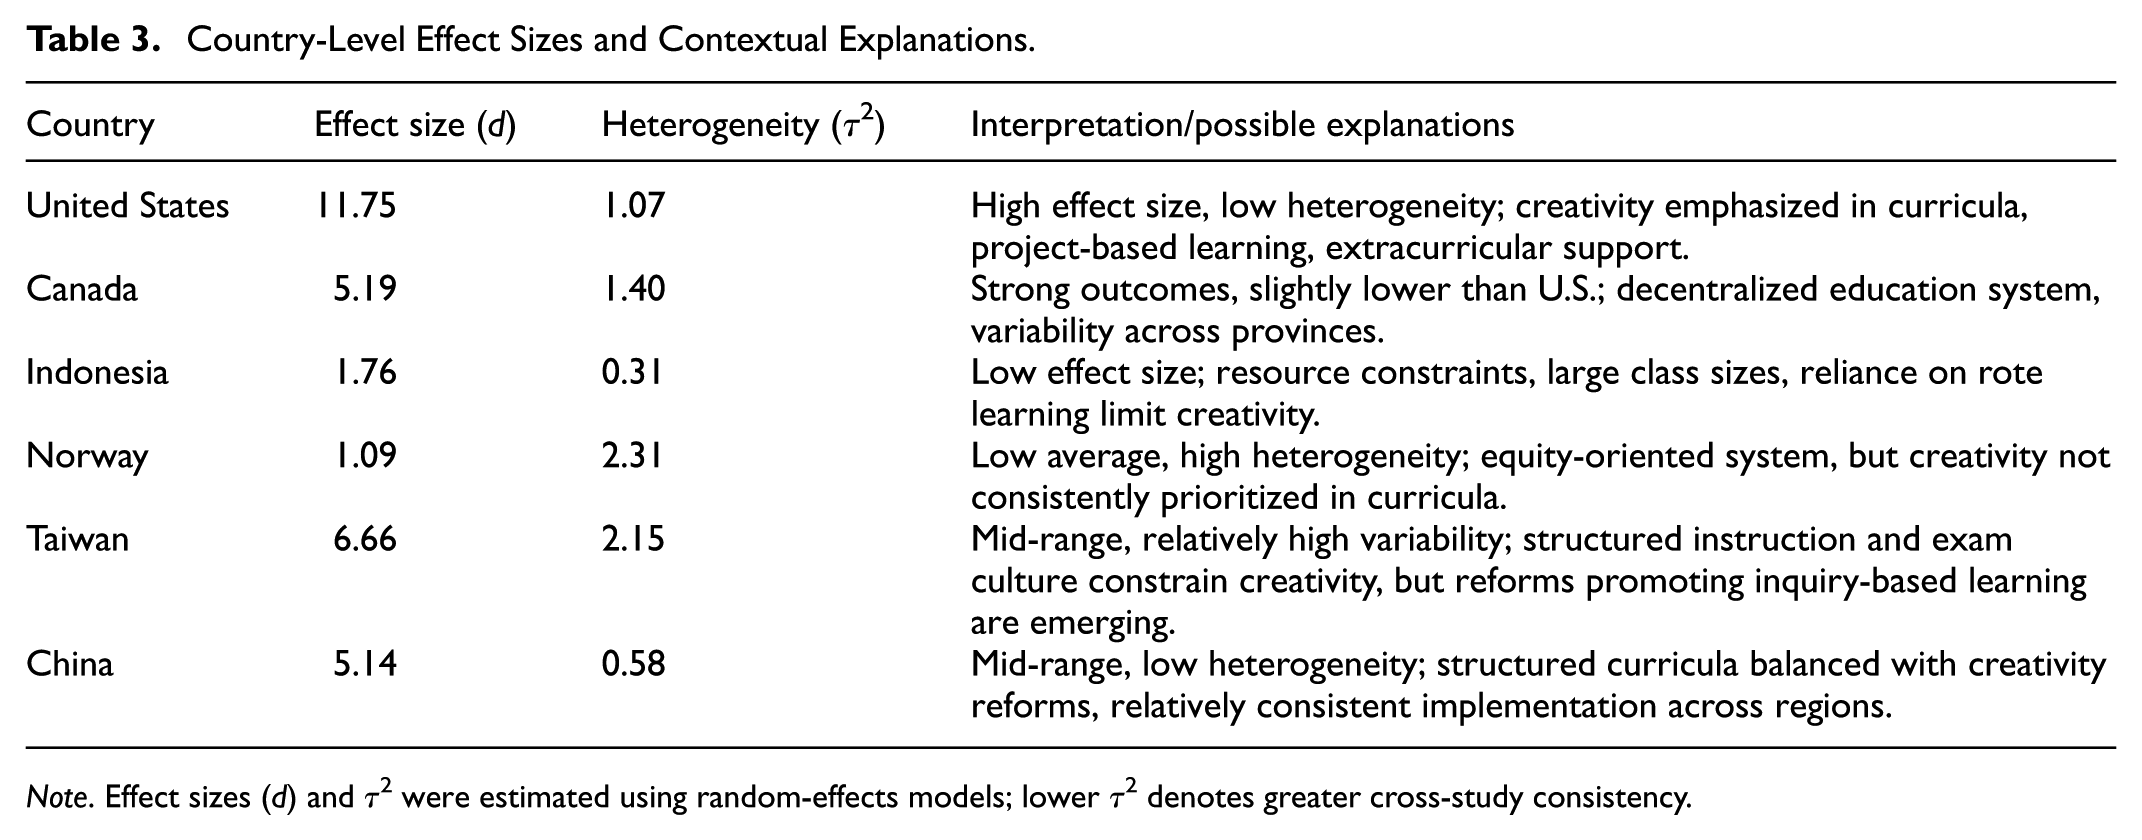
Note. Effect sizes (d) and τ2 were estimated using random-effects models; lower τ2 denotes greater cross-study consistency.
Integrative Theoretical Synthesis
Interpreted through Vygotsky’s framework, these cross-regional variations portray creativity as a socially distributed developmental phenomenon rather than an individual attribute. Regions with institutionalized scaffolding (e.g., U.S., Canada, China, Taiwan) demonstrate how intentional mediation transforms collective experience into internalized creative function. Conversely, systems with inconsistent or under-resourced mediation (e.g., Indonesia, Norway) illustrate the developmental ceiling imposed when creative engagement is not socially scaffolded. Overall, these findings empirically substantiate Vygotsky’s proposition that creativity develops through dialectical interaction between social mediation and individual imagination (Cole & Wertsch, 1996; Rogoff, 2003; Vygotsky, 2004). This theoretical synthesis also aligns with ecological and cultural perspectives emphasizing that the maturation of creativity depends on how societies structure access to mediational means, distribute learning resources, and value divergent thought as a cultural objective (Bronfenbrenner & Morris, 2006; Cabra & Guerrero, 2022; Lorenz, 2011; Marrocu & Paci, 2013).
Measurement Tools: Impact on Creativity Effect Sizes-Contributing to RQ3 (Measurement Moderator)
Measurement tools significantly moderated creativity outcomes, highlighting their sensitivity to different dimensions of creativity. The Torrance Tests of Creative Thinking (TTCT) yielded the highest effect size (d = 6.66, τ2 = 2.15), effectively capturing divergent thinking and higher-order cognitive skills (Li et al., 2024). Similarly, the Cognitive Assessment Profile (CAP) produced a strong effect size (d = 6.15), though with higher variability (τ2 = 10.13), indicating the need for more standardized implementation across studies.
In contrast, less structured tools—such as free drawing tests (d = 4.27, τ2 = 1.03), consensual assessments (CA; d = 5.14, τ2 = 0.58), and the Humor Styles Questionnaire (HSQ; d = 5.14, τ2 = 0.09)—showed moderate effect sizes with varying degrees of stability. CA’s low variability suggests strong reliability under controlled conditions, whereas free drawing tests’ higher variability reflects sensitivity to educational and cultural contexts.
From a Vygotskian standpoint, measurement tools themselves represent cultural artifacts that can either scaffold or constrain creative expression. The TTCT (d = 6.66) succeeds in formally structured Western educational contexts because it aligns with the cultural values and pedagogical practices those systems prioritize. In contrast, free drawing tests (d = 4.27) and consensual assessments (d = 5.14), while more contextually flexible, may fail to activate the full scope of creative thinking in highly structured environments where standardized divergent thinking tasks are the expected cultural tool. This variability (reflected in the tool × region interactions documented above) underscores a critical Vygotskian insight: assessment is never culturally neutral. To authentically measure children’s creative potential across diverse contexts requires tools that align with—or respectfully bridge—the specific cultural practices and mediating means available in each setting.
The between-group homogeneity test (Qb(5) = 25.63, p < .05) confirmed statistically significant differences among tools. These findings emphasize the need to align assessment methods with the creativity domains being evaluated. Future research should prioritize:
Standardizing structured tools like TTCT and CAP.
Enhancing adaptability of flexible tools in diverse contexts.
Developing hybrid models to ensure culturally valid and comprehensive assessment.
Refining measurement practices will support more effective educational interventions and policy decisions across regions.
Temporal Trends in Creativity Research-Complementing RQ3 (Time Moderator)
Effect sizes varied significantly by publication year, reflecting methodological and contextual developments. Studies from 2023 reported the highest average effect size (d = 5.19, τ2 = 1.40), indicating more consistent outcomes, whereas earlier years such as 2006 (d = 3.44, τ2 = 0.24), 2016 (d = 1.82, τ2 = 2.41), 2018 (d = 1.52, τ2 = 1.42), and 2020 (d = 1.66, τ2 = 0.44) yielded smaller and more variable results. The between-group homogeneity test (Qb(6) = 19.05, p < .05) confirmed significant temporal variation.
These trends likely reflect advances in measurement practices, including greater use of standardized tools and more targeted sampling in recent studies. Conversely, higher variance in earlier years suggests methodological inconsistency, such as reliance on less structured assessments or differing participant characteristics.
Despite progress, publication bias remains a concern. Funnel plot asymmetry and Egger’s test (p < .001) suggest selective reporting. As L. Huang and Musah (2024) noted, mixed-methods and culturally comparative research are essential to address such bias and improve generalizability.
Future research should prioritize:
Developing culturally adaptable, standardized creativity assessments.
Conducting longitudinal studies on methodological evolution.
Using mixed-methods designs to mitigate bias and inform policy.
These efforts will provide a stronger foundation for educational interventions and policy decisions aimed at fostering creativity across diverse populations.
To further enhance clarity and accessibility, we summarized the key findings, their theoretical interpretations, and corresponding practical and policy implications in a tabular format. This summary table (see Table 4) complements the narrative discussion by allowing readers to quickly compare results across moderators, facilitating a more integrated understanding of how age, regional context, measurement tools, and temporal trends shape creativity outcomes.
Summary of Key Findings, Interpretations, and Implications.

Note. TTCT = Torrance Tests of Creative Thinking; CAP = cognitive assessment profile.
Originality and Policy Contribution
This meta-analysis offers distinct contributions to the existing creativity literature and educational policy discourse. The study is the first to quantitatively synthesize cross-regional evidence on creativity differences between urban and rural children through a Vygotskian framework, demonstrating that creativity is socially mediated rather than geographically determined. By integrating meta-analytic methods with sociocultural theory, this research extends Vygotsky’s conception of the Zone of Proximal Development to the systemic level—showing that national education systems, cultural tools, and measurement practices jointly scaffold children’s creative development.
In policy terms, the findings emphasize the need for context-sensitive, culturally responsive educational reforms that foster creativity through guided participation, equitable resource distribution, and teacher training in creativity pedagogy. Table 4 summarizes these implications, highlighting actionable strategies such as age-specific curricula, standardized yet culturally adaptable assessments, and periodic policy reviews to sustain innovation-oriented learning environments.
Conclusions and Implications
This meta-analysis clarifies how age, regional context, and measurement tools shape children’s creativity. The overall effect size was small to moderate (d = 0.376) and not statistically significant (t = 0.82, p = .42), suggesting that creativity is not determined by geographical location. Instead, cultural, developmental, and methodological factors play a more substantive role. These findings underscore the need for systematic, age-sensitive, and culturally grounded approaches when examining creativity in diverse educational contexts..
Implications for Research and Practice
1. Theoretical Implications: This study underscores the importance of distinguishing developmental stages in creativity research. Children aged 11 to 12 showed the highest effect size (d = 12.06), identifying late childhood as a peak period for creative growth. Among preschoolers, a clear developmental trend emerged—6-year-olds demonstrated the highest creativity levels (d = 5.71), followed by 5- (d = 4.88) and 4-year-olds (d = 3.27). These findings call for theoretical models that capture age-specific creative trajectories throughout childhood and adolescence.
Substantial regional variation further highlights the role of cultural and educational contexts. The United States (d = 11.75, τ2 = 1.07) and Canada (d = 5.19, τ2 = 1.40) exhibited stronger, more consistent creativity outcomes than Indonesia (d = 1.76, τ2 = 0.31) and Norway (d = 1.09, τ2 = 2.31). Such differences reflect systemic disparities in how creativity is promoted and assessed, reinforcing the need for culturally inclusive frameworks that integrate regional educational priorities and sociocultural norms.
2. Practical and Policy Implications: This meta-analysis offers several practical and policy-oriented recommendations that align directly with the empirical findings. First, the absence of a significant overall urban–rural difference suggests that policies should move beyond geographical determinism and instead prioritize equitable access to creativity-supportive resources. Ministries of education should ensure that rural and urban schools receive comparable support in teacher training, curricula, and learning infrastructures.
Second, the strong age effects highlight the importance of developmental timing. Early childhood education policies should institutionalize play-based and experiential learning programs. Practically, curricula should foreground guided play, dialogic teaching, and tool-rich collaborative tasks that target students’ ZPDs, ensuring that both urban and rural programs provide systematic access to cultural tools that scaffold creative recombination. For late childhood (ages 11–12), curricula should integrate structured collaborative problem-solving and abstract reasoning tasks to align with developmental peaks in creative growth.
Third, regional variations indicate that one-size-fits-all approaches are unlikely to succeed. Policy frameworks should be culturally responsive—integrating international best practices such as TTCT-based interventions while adapting them to local traditions and systemic realities. This calls for flexible curricula that respect cultural values yet promote creativity as a universal 21st-century competence.
Fourth, the significant role of measurement tools underscores the need for standardized, developmentally appropriate, and culturally sensitive assessment systems. National education authorities should establish guidelines for creativity measurement, enabling reliable cross-regional monitoring and evidence-based policy adjustments.
Finally, temporal trends showing stronger outcomes in recent years highlight the importance of continuous reform. Policymakers should implement systematic evaluation cycles to monitor creativity-focused initiatives, ensuring that policies remain adaptive to evolving educational practices and international benchmarks.
3. Methodological Contributions: Findings on measurement tools provide key insights for future research. Structured tools like TTCT (d = 6.66, τ2 = 2.15) and CAP (d = 6.15, τ2 = 10.13) captured creativity reliably, though CAP showed higher variability—suggesting a need for standardization across contexts.
In contrast, less structured tools (e.g., free drawing tests, d = 4.27; consensual assessments, d = 5.14) demonstrated adaptability to diverse cultural settings. Future work should develop hybrid assessment strategies that combine the precision of structured tools with the contextual sensitivity of flexible measures, offering a more comprehensive view of creativity development.
Limitations and Areas of Future Research
The high heterogeneity observed in this meta-analysis (I2 = 99.43%) indicates considerable variation across studies, highlighting limitations related to methodological diversity, regional differences, and measurement practices. Although sensitivity analyses showed that excluding lower-ranked or non-indexed studies did not alter the overall patterns, variability in journal quality may have contributed to this heterogeneity. While funnel plots and Egger’s test suggested limited publication bias, meta-analyses in education and psychology remain vulnerable to the file-drawer problem, where studies reporting non-significant findings remain unpublished. Future reviews should expand their search to include gray literature, dissertations, and conference proceedings to minimize this bias.
Future work should examine creativity development longitudinally to clarify how creativity evolves from early childhood through adolescence and how interventions influence long-term trajectories. Cross-cultural designs are also needed to capture how educational practices and cultural norms shape creative outcomes across different societies. In addition, developing culturally adaptable, standardized assessment tools will support more accurate cross-context comparisons. Mixed-methods approaches that integrate quantitative and qualitative data can provide a more comprehensive understanding of creativity, and future studies should explore how pedagogical strategies interact with age and cultural context to influence creative development.
In summary, this meta-analysis advances understanding of creativity by integrating evidence from 22 studies conducted across diverse regions between 2003 and 2023. The findings emphasize the combined effects of age, regional context, and measurement approaches, reinforcing the importance of culturally and developmentally sensitive frameworks. This study is the first to synthesize urban–rural creativity differences using a cross-regional lens, offering novel theoretical insights and policy-relevant recommendations for designing equitable and context-responsive curricula. Its contribution lies in demonstrating age-specific and context-dependent patterns of creativity and in translating these insights into practical implications for educational policy and classroom practice.
Footnotes
Acknowledgements
The authors would like to express their gratitude to the school participants in the study. Thank you, Dr. Wang, for collaborating with me in screening articles for the meta-analysis.
Ethical Considerations
This study is a meta-analysis that synthesizes findings from previously published, peer-reviewed research articles. All data included in this study were obtained from publicly accessible sources and do not involve any new data collection, identifiable personal information, or human or animal participants. Therefore, according to the ethical guidelines of our institution and in alignment with SAGE Open’s policy, ethical approval from an Institutional Review Board (IRB) was not required. The study was conducted in accordance with the ethical standards of responsible research and reporting, including transparency, proper citation, and the avoidance of duplication or data fabrication.
Author Contributions
Chia-Yen Hsieh contributed to the conceptualization of the study, the design of the methodology, the formal analysis of both quantitative and qualitative data, and provided supervision throughout all stages of the research process. Yi-Wen Tsai was responsible for carrying out the experimental procedures, collecting both quantitative and qualitative data, and conducting the initial organization and coding of qualitative data under supervision. Both authors contributed to the writing, review, and approval of the final manuscript.
Funding
The authors disclosed receipt of the following financial support for the research, authorship, and/or publication of this article: Access to some research materials was supported by resources from a Ministry of Science and Technology project (Grant No. 114-2221-E-153-001-MY2).
Declaration of Conflicting Interests
The authors declared no potential conflicts of interest with respect to the research, authorship, and/or publication of this article.
Data Availability Statement
The datasets generated during and/or analyzed during the current study are available from the corresponding author on reasonable request.
Using AI Self-Disclosure
During the preparation of this work, the author(s) used [OpenAI] to [enhance the English writing] in order to [improve readability, as English is not the authors(s)’ first language]. Additionally, AI tools were used to assist in generating visualizations, such as forest plots and funnel plots, to better present the meta-analytic results. After using these tools/services, the author(s) reviewed and edited the content, including all visualizations, as needed, and take(s) full responsibility for the content of the publication.